


Abstract
Students and workers spend much of their day in school and office environments, where poor indoor air quality (IAQ) can negatively affect health and comfort. Indoor vegetation is increasingly proposed as a low-cost nature-based solution (NBS) to improve IAQ. This study evaluated the effects of phytoremediation on IAQ and indoor microclimate in schools across different regions and educational levels, as well as in office environments, under real-world conditions. Several C3 plants (e.g., Chamaedorea, Schefflera, Ficus, Epipremnum, Yucca, and Spathiphyllum) were used, with crassulacean acid metabolism (CAM) plants (Sansevieria) included in selected settings. Temperature, relative humidity, CO2, PM2.5, and PM10 were continuously monitored using intercalibrated low-cost sensors in absence and presence of vegetation. A comparable plant configuration was implemented in offices to assess its effects on volatile organic compounds (VOC). Indoor greenery reduced particulate matter, especially PM10 (18–20%), and improved microclimatic conditions by lowering air temperature (1–2 °C) and increasing relative humidity (6–15%). However, CO2 reductions were limited and context-dependent. In the tested office environments, plant introduction was associated with reduced total VOC concentrations (25–50%). Overall, our results further support that indoor vegetation constitutes a robust, cost-effective nature-based solution (NBS) capable of complementing conventional ventilation systems in both school and office environments.
Keywords:
indoor air quality (IAQ); potted plants; indoor greenery; phytoremediation; microclimate; CO2; VOC; PM10; PM2.5 1. Introduction
In modern societies, people typically spend approximately 80–90% of their time in indoor environments, including residential buildings, workplaces, schools, public buildings, and transportation systems [1,2]. Indoor air pollutant concentrations are often higher than those measured outdoors. This condition occurs when polluted outdoor air enters indoor spaces through natural or mechanical ventilation and combines with pollutants generated by indoor sources, resulting in increased overall exposure levels [3,4].
Long-term exposure to indoor airborne contaminants poses significant health risks and can contribute to the development of various adverse health outcomes [5,6]. At the global scale, the World Health Organization (WHO) estimated that approximately 3.8 million deaths per year are attributable to diseases associated with indoor air pollution, accounting for around 7.7% of total global mortality [7].
Ensuring satisfactory indoor air quality (IAQ) is essential for living in a healthy environment, preventing the occurrence of Sick Building Syndrome (SBS) [8]. A variety of compounds can contribute to poor IAQ, including carbon dioxide (CO2), volatile organic compounds (VOC), and particulate matter (PM), most of which pose various health risks.
In indoor environments, the main source of CO2 is human respiration; therefore, occupant density and ventilation effectiveness are key determinants of indoor CO2 levels. Although CO2 is often regarded as non-toxic, elevated indoor concentrations have been associated with increased drowsiness, reduced cognitive performance, and inflammatory responses. Widely adopted guideline values consider concentrations <1000 ppm indicative of good IAQ and <1500 ppm acceptable for the general population in environments such as schools and offices [9,10].
VOC are among the most abundant and dangerous indoor air pollutants: formaldehyde and BTEX (benzene, toluene, ethylbenzene, and xylene) have been identified as the main causes of SBS [11,12], and some of them are classified as carcinogenic [13]. The main sources of indoor VOC are paints, plastic, wood furniture coating, and cleaning products [14,15]. Exposure to typical indoor VOC belonging to different chemical classes can have negative effects even at low concentrations, particularly in people with respiratory conditions such as asthma. At high levels, VOC can cause mild symptoms ranging from fatigue, dizziness, eye, nose, and throat irritation, headache, nausea, and even more severe damage to the heart and respiratory system, kidneys, and lungs [5,16,17].
Indoor PM can be produced by numerous sources, including paints, varnishes, solvents, cleaning products, printers, heating systems, cooking activities, and infiltration from outdoor air. Prolonged exposure to these particles can cause respiratory diseases and increase the risk of lung cancer [18,19].
Many countries have implemented regulatory standards and guidelines to ensure that indoor air pollutant concentrations remain below a defined threshold in buildings such as offices, schools, and residences [20,21]. The European Union has revised the European Ambient Air Quality Directive guidelines, updating the air quality standards to be implemented by 2030 [22], while the WHO updated the Global Air Quality Guidelines in 2021, revising the levels and times of exposure to some of the main indoor air pollutants [23]. In Italy, the UNI 11976:2025 standard [24] provides the updated technical framework of IAQ assessment using CO2 concentration as proxy for ventilation effectiveness: according to this standard, CO2 levels between 1000 and 1200 ppm indicate adequate indoor conditions, while concentrations up to 1500 ppm are considered acceptable but suboptimal. These thresholds are consistent with international guidelines [23,25], with a specific focus on high-occupancy settings such as schools.
In this context, nature-based solutions (NBSs) are recognized as cost-effective measures to achieve the targets of improving IAQ and indoor comfort (Directive 2024/2881; UNI 11976:2025).
Beyond their aesthetic value, indoor plants have been associated with improved mental and physical well-being and IAQ [26,27,28], as well as positive effects on occupants’ health [29,30]. Plants can also influence indoor microclimatic conditions by increasing relative humidity (RH) and reducing air temperature through evapotranspiration [31,32,33,34]. RH is particularly relevant for occupant comfort and health: a low RH is associated with mucous dryness, skin and eye irritation, higher susceptibility to respiratory infections, and increased persistence of airborne viruses [35], whereas excessive RH, especially when combined with high indoor temperatures, may cause thermal discomfort, fatigue, and exacerbate respiratory and allergic symptoms by affecting the survival and infectivity of airborne bacteria and viruses [36].
Schools represent one of most important and critical infrastructures in modern societies, as children and adolescents spend most of their time in densely occupied classrooms characterized by multiple indoor pollution sources and higher respiration rates compared to adults [37,38]. Growing youth are particularly sensitive to environmental stressors [39] and more vulnerable to the adverse effects of indoor pollutants due to the ongoing physiological development, including the maturation of lung function [40,41].
While passive and active ventilation strategies are essential for pollutant removal and moisture control, they entail high maintenance costs and some filters show limited effectiveness for certain contaminants, such as VOC (e.g., formaldehyde) [42]. The integration of nature-based solutions (NBSs) has been highlighted as a complementary strategy, offering potential benefits for both physical and mental well-being [43,44]. In this context, indoor green infrastructures have been proposed as cost-effective interventions for pollutant removal with additional co-benefits [10,45].
Since IAQ strongly influence health, comfort, and productivity in both school and offices [36], potted plants have been explored for their potential to improve IAQ through CO2 sequestration [46,47], VOC uptake [48,49], PM retentions [28,50], and microclimate regulation. However, the evidence remains inconsistent: while laboratory studies frequently document CO2 reductions [51], even with a limited number of plants [52,53], other studies find limited improvements across IAQ parameters [52,54], and real-life data from office environments remains limited [48,55].
Furthermore, evidence from real school and office environments remains limited [47,54] and, in many cases, does not consider natural ventilation conditions (e.g., opening doors and windows) [50] and real dynamic occupancy scenarios (the presence of occupants and students) [47].
The effectiveness of indoor phytoremediation is strongly influenced by a combination of physiological, physical, and biological processes, including plant size, leaf micromorphology, stomatal uptake, surface deposition, and light availability [56]. Smaller species typically exhibit lower CO2 sequestration capacity than larger plants [57], while insufficient light may even increase indoor CO2 concentrations as a result of enhanced plant respiration under low irradiance [58,59].
Within this framework, a previous investigation [60], conducted in classrooms as part of the ‘Plants in the Classroom’ project, demonstrated that indoor green infrastructure contributed to reducing CO2 and PM2.5 concentrations while increasing relative humidity. Nevertheless, to address inherent limitations and variability, further studies have been recommended to test and extend this green model to different contexts and over longer monitoring periods.
To contribute to the still limited body of experimental evidence assessing the influence of indoor plants on IAQ under real-life conditions, the present study aims to evaluate the effectiveness of commonly used houseplant species through two distinct experimental settings conducted in schools and office environments during regular daily activities.
In the classrooms, relative humidity, temperature, CO2, PM10, and PM2.5 were continuously monitored. In the offices, the analysis focused on VOC and plant species-specific leaf microstructures.
2. Materials and Methods
2.1. Case Studies: Air Quality in Classrooms
2.1.1. Study Location
Three schools representing different educational stages, primary, middle, and high, were selected as case study in Italy. The primary school “Dante Alighieri” is located in Mirandola (MO, 44°52′51″ N, 11°04′35″ E), while the middle school “Leonardo da Vinci Orazio-Nucola” is situated in Terni (42°33′53″ N, 12°38′49″ E) (Figure 1). The selected high school “Piero Gobetti”, situated in Genova (44°24′37″ N, 8°53′54″ E), served as a representative institution for the final educational stage (Figure 1). For both primary and high schools, the selection was conducted in collaboration with school managers and teachers, together with the municipality and the local Federation of Coldiretti, the main agricultural organization in Italy and across Europe, representing the majority of Italian agricultural enterprises. In the case of the middle school, the Garden Club cultural association was also involved, providing additional support in coordinating school participation and facilitating local engagement.
Figure 1.
Geographical distribution of the school study sites (Genova, Terni, and Mirandola) and offices (Bologna) across Italy. Map generated using MATLAB® version R2023b (The MathWorks Inc., Natick, MA, USA) (base map credits: Esri, USGS, NOAA).
This multi-stakeholder approach ensured the selection of schools with different climatic, structural, and socio-organizational characteristics, providing a representative framework for assessing IAQ across diverse educational environments.
In each school, the same experimental protocol was implemented, consisting of a “green” classroom, with plants, and a control classroom without plants. The technical configuration for plant placement was defined according to the architectural features of each room and in compliance with all the relevant safety regulations. The potted plants remained in place throughout the entire monitoring period. Additional details are provided in Table 1.
Table 1.
Monitoring period, plant species number, and support structures used for indoor vegetation in each school.
The “green” and control classrooms were carefully selected in each school to ensure maximum comparability in terms of floor area, exposure and orientation, type of heating system, windows distribution and orientation, received solar radiation, and number of pupils. Artificial light consisted of ceiling-mounted fluorescence lamp units. The structural and operational characteristics of each school, along with the typical organization of the educational day, are summarized in Table 2.
Table 2.
Classroom technical specifications including surface area, occupancy, orientation, and lesson schedules.
2.1.2. Green Infrastructure (NBS)
Indoor plant infrastructure was implemented using ornamental potted plants arranged on dedicated plant stands, consisting either of three-level vertical metal shelving units or waterproof horizontal wooden shelves (Table 1). These configurations were selected to adapt to the classroom constraints while ensuring safety, stability, and adequate light exposure.
The plants (1–2 years old) were kept in plastic pots (diameter ranging from 12 cm for E. aureum to 24 cm for Y. elephantipes). Their average leaf area index (LAI), determined from four representative individuals per species with a ceptometer (LP-80 AccuPAR, Meter Group), varied according to species, ranging from 0.4 for Y. elephantipes and S. trifasciata to 3.6 for F. benjamina.
Plant species were selected based on functional and operational criteria, including non-allergenic suitability for school environments, documented air-purifying capacity, robustness under variable indoor conditions, and the inclusion of both C3 (Calvin cycle) and CAM (crassulacean acid metabolism) species to integrate complementary photosynthetic pathways and pollutant-removal dynamics, particularly relevant for enhancing indoor CO2 mitigation under suboptimal lighting conditions, with CAM species absorbing CO2 at night and C3 plants potentially releasing CO2 under low irradiance—as well as availability from local nurseries.
Whenever possible, plants were positioned in proximity to windows to optimize natural-light exposure and enhance photosynthetic activity. A detailed description of the plant configurations and the number of individuals per species used in each school is provided in Table 1.
2.1.3. Indoor Environmental Measurements
Continuous monitoring of the indoor environmental parameters was performed using the AirQino Indoor LITE air-quality unit (TEA Group srl, Signa, Florence, Italy) (Figure 2), developed by CNR-IBE to operate without interfering with teaching activities or causing student distraction. The system is built on an Arduino Shield Compatible electronic board (available online: https://www.arduino.cc, accessed on 15 April 2026), equipped with low-cost and high-resolution sensors (Figure 2). AirQino is equipped with factory-calibrated sensors [61,62], capable of measuring both meteorological variables (air temperature, °C; RH, %) and air quality parameters (CO2 concentration, ppm; PM2.5 and PM10, µg m−3). The device includes a microprocessor that acquires all readings from all sensors. Through the General Packet Radio Service (GPRS) technology, the unit transmits geolocated data to a remote server hosting the visualization platform and web interface, enabling real-time access to observations via a standard web browser.
Figure 2.
AirQino Indoor LITE monitoring station.
A summary of sensor accuracy, resolution, and operating ranges is provided in Table 3.
Table 3.
Technical specifications of the AirQino Indoor LITE monitoring station used for indoor measurements.
Monitoring stations were positioned 1–2 m above the floor, according to classroom configuration (Table 1), to approximate student breathing height while minimizing potential interference and enabling the evaluation of localized air-quality variations.
2.1.4. Intercalibration of AirQino Monitoring Stations
Prior to deployment, all AirQino units underwent an intercalibration procedure to reduce inter-unit variability typical of low-cost sensors and to ensure measurement consistency across devices. This procedure complemented the factory calibration and was previously validated under various operating conditions [60,61].
Monitoring stations (two per school) were co-located within classrooms for 6 days, simultaneously recording all parameters to allow direct comparison between devices. Hourly averaged datasets were then analyzed, and descriptive statistics were computed for the co-location period (Table S1).
A tolerance threshold, consistent with the nominal sensor accuracy (Table 3), was defined to assess the need for corrective actions. According to the adopted approach, no correction was applied when differences between instruments remained within the sensor resolution limits, in order to avoid the amplification of instrumental noise and preserve data reliability. This criterion was applied to all monitored parameters, including particulate matter (PM10 and PM2.5). When deviations exceeded this threshold, a linear regression model (y = ax + b) was applied, using one station as reference, to derive calibration coefficients and harmonize the datasets. Given that all units were identical in design and performance, the reference station was selected arbitrarily, as no a priori differences were expected. This procedure aimed at defining a common baseline across devices. Detailed statistical metrics, including r2 values, are reported in the Supplementary Material (Table S1).
2.2. Case Studies: VOC Measurements in Office Environment
VOC concentrations were investigated exclusively in office environments, where spatial layout and routine activities allowed for more targeted measurements, as repeated punctual sampling would have interfered with teaching activities if conducted in classrooms.
2.2.1. Study Location
This study was conducted in two offices located within the Research Area of CNR in Bologna, Italy (44°31′25″ N, 11°20′21″ E) (Figure 1): an empty office (October 2023) and an occupied office (April–May 2024, Table 4). The experiments were performed under different conditions: a small empty office (~13 m2), kept isolated for 10 days (17–26 October 2023), and a shared office (~30 m2), occupied daily by 4 to 5 people and monitored for 26 days (24 April–20 May 2024), with the door kept open.
Table 4.
Technical specifications of the monitored offices.
In the empty office, VOC sampling was performed once before plant installation, followed by 3 daily samplings after one week of acclimatation. In the occupied office, 3 measurements were performed before plant installation, followed by 6 daily samplings after acclimatation. No cleaning was carried out in the empty office after setup, while routine cleaning was maintained in the occupied office.
2.2.2. Green Infrastructure (NBS)
A total of 18 potted plants (three individuals per each species) were used in this study, belonging to the same species or at least to the same genus of those used in the classroom experiments (Table 4). All plants were watered weekly with equal amounts of water through the experimental period.
2.2.3. VOC Sampling and Analytical Procedure
VOC measurements were carried out in both experimental conditions before (ex ante) and after (ex post) the introduction and acclimatation of the potted plants using advanced analytical instrumentation for collection and chemical characterization of both anthropogenic and biogenic VOC. The total and individual concentrations of VOC were determined through offline chemical characterization performed ex ante and ex post. In each sampling session, 1 h air collections were carried out: air was drawn through adsorption cartridges using portable pumps (Pocket389Pump, SKC Inc., Washington County, PA, USA) that provided a constant flow of air of 200 mL min−1, yielding sampling volumes of 12 L. The traps consisted of inert metal tubes (8 cm × 0.3 cm i.d.) filled with Tenax TA and Carbograph 1TD (350 mg; 35/60 and 40/60 mesh, respectively), provided by Markes International, Ltd. (Llantrisant, UK). Measurements were carried out on different days but at the same time of day (11:00 a.m.) to minimize diurnal variability in indoor emissions and ventilation patterns, 1 measurement ex ante and 3 measurements ex post. During each sampling event, temperature, RH, CO2, and PM2.5 concentrations were also recorded with low-cost sensors to provide contextual environmental information relevant to VOC dynamics, together with photosynthetically active radiation (PAR). Chemical analysis of total VOC (TVOC) was performed by thermal desorption coupled with gas chromatography–mass spectrometry (TD-GC-MS) (TD: unity series 2, Markes International, Sacramento, CA, USA; GC–MS: Agilent Technologies, Wilmington, DE, USA). VOC identification was based on the combined evaluation of retention times and mass spectra, which were matched against the NIST 11 reference library using Agilent Mass Hunter Qualitative Analysis 12.0 software. Following compound identification, quantification was carried out using an external standard calibration approach [63]. All measurements were carried out in triplicate.
2.3. Leaf Micromorphology
For micromorphological analyses, fully developed and healthy leaves were collected and immediately transported to the laboratory for environmental scanning electron microscopy (ESEM) observations [64]. For each leaf, a 1 cm2 section was excised from the central lamina between the main vein and the margin. A total of 18 leaf portions (adaxial and abaxial sides) per species were mounted on stubs using double stick tape. Both surfaces were examined using an ESEM Zeiss, EVO LS 10 (Carl Zeiss Microscopy GmbH, Oberkochen, Germany). Micromorphological traits of the adaxial and abaxial surfaces were systematically observed and described. Stomatal density was quantified using an image analysis software (Leica Application Suite V4.1, Hamburg, Germany), by acquiring five images per leaf at 200× magnification. Stomata features were characterized according to the position of guard cells (prominent or sunken relative to the epidermis; stomatal rim orientation with respect to the veins; presence and extent of epicuticular waxes and possible occlusion of stomatal rims) [65]. Epicuticular waxes were assessed in terms of abundance, morphological typology (granules, rodlets and platelets), and surface distribution [66]. Cuticular ornamentation was also evaluated, distinguishing among deep ridges, micro ridges and surface with nearly absent ridges. None of the investigated species displayed trichomes.
3. Data Processing and Statistical Analysis
Raw data from the AirQino stations were recorded at regular intervals (every ~5 min) for the entire monitoring period. Before analysis, a checklist was applied to identify measurements affected by sensor malfunctions, power outages, or identified as outliers, which were subsequently removed from the dataset. The percentage of removed (or missing) data varied across the different sites: 37.5% at the “Dante Alighieri” primary school in Mirandola, 1.7% at the “Leonardo da Vinci Orazio-Nucola” middle school in Terni, and 3.3% at the “Piero Gobetti” high school in Genoa. The greatest data loss at Mirandola was due to power outages affecting one of the monitoring stations, resulting in the exclusion of data simultaneously recorded by the second station.
Hourly average concentrations of CO2, PM2.5, and PM10, along with air temperature (Air Temp.) and RH, were calculated for each classroom during the selected monitoring periods (see Section 2.1). The analysis focused on weekdays with regular teaching activities to assess indoor environmental conditions under representative occupancy scenarios. A time window between 7:00 and 15:00 (or 14:00 for the “Dante Alighieri” primary school) was selected to capture both peak occupancy and the subsequent transition period after a classroom was vacated.
Diurnal profiles were obtained by aggregating measurements by time of day (00:00–23:00) for the entire monitoring period for both the experimental classroom (with plants) and the control classroom (without plants). For each time window, mean values and the standard error of the mean (SE) were calculated (SEh = σh/√nh, where σh is the standard deviation and nh is the number of valid observations).
The effect of plants was assessed through a comparative analysis of hourly mean concentrations within the selected time window. Descriptive statistics (minimum, maximum, and mean values, with the corresponding standard error of the mean) were used to characterize the environmental conditions in the two classrooms. The relative difference (Δ%) between the experimental and control classrooms was calculated for each hour as Δ% = ((μ_plants − μ_control)/μ_control) × 100, where μ_plants and μ_control indicate the hourly mean concentrations measured in the vegetated classroom and the control classroom (without plants), respectively. The variability of Δ% was quantified as the SE of the hourly relative differences, derived from the standard deviation (SD) of inter-class differences, providing an estimate of the temporal consistency of the plant effect.
For the office monitoring campaigns (empty and occupied office), VOC concentrations were measured using a dedicated analytical system distinct from the AirQino stations (see Section 2.2). A statistical analysis was performed to compare conditions before (ex ante) and after (ex post) plant installation. Compounds were identified and classified according to their chemical class and name, and only valid observations were included in the analysis. Summary statistics (minimum, maximum, and mean ± SE) were computed for each compound under both conditions. Changes in VOC concentrations were expressed as Δ% (VOC) = ((μ_ex post − μ_ex ante)/μ_ex ante) × 100, where μ_ex ante and μ_ex post represent mean concentrations before and after plant introduction, respectively. The associated uncertainty was estimated via error propagation: SE (Δ%) = |Δ%| × √[(SE_ex post/μ_ex post)2 + (SE_ex ante/μ_ex ante)2].
Statistical significance of the differences was assessed using two-tailed t-tests. For the classroom dataset, paired-sample t-tests were applied to hourly mean values to account for the matched temporal structure of the measurements between experimental and control conditions.
For the office VOC dataset, paired-sample t-tests were used when ex ante and ex post datasets had equal sample sizes, while independent two-sample t-tests were applied when sample sizes differed, reflecting the structure of the sampling campaigns described in Section 2.2.3 (i.e., one pre-intervention campaign and multiple post-intervention measurements).
Significance levels in both analyses (schools and office) were defined as (*) p < 0.05, (**) p < 0.01, and (***) p < 0.001.
4. Results
4.1. Air Quality in Classroom
4.1.1. Primary School “Dante Alighieri”
Over the four-week monitoring period, hourly mean CO2 concentrations increased during classroom occupancy, reaching a maximum around midday (~1800 ppm). The concentrations decreased during the afternoon and stabilized at baseline levels during nighttime hours (Figure 3; Table 5). This diurnal pattern was consistent under both experimental conditions, with and without plants, but the CO2 concentrations were not significantly different between the classrooms with and without vegetation (Table 5). During nighttime, when students were absent, CO2 concentrations were comparable between classrooms irrespective of plant presence.
Figure 3.
Daily hourly averages of (a) PM2.5, (b) CO2, (c) RH, and (d) temperature in classrooms with and without plants from Monday to Friday from 6 March 2025 to 6 April 2025 at the primary school “Dante Alighieri” (PS-DA).
Table 5.
Comparative analysis of indoor air quality parameters in classrooms with and without plants during the 07:00–14:00 time window, selected to encompass lesson hours (typically starting at 08:00 and ending between 12:30 and 13:00) from Monday to Friday for the period 6 March 2025 to 6 April 2025 at the primary school “Dante Alighieri”.
PM2.5 concentrations exhibited greater temporal variability than CO2, with peak values observed around midday (7.8–8.8 µg/m3). During lesson hours, PM2.5 concentrations were on average slightly lower in the classroom with plants (−3%) compared to the control; however, the difference was not statistically significant, and concentrations never exceeded 10 µg m−3.
Hourly mean air temperature increased during daytime classroom occupancy, reaching approximately 29–30 °C at midday before decreasing to about 28 °C in the afternoon. On average, temperatures in the classroom with plants were significantly lower (−3%) than in the control classroom, with differences also observed under unoccupied conditions. In contrast, RH was significantly higher in the presence of plants by approximately 6%, and this increase persisted during periods without students.
4.1.2. Middle School “Leonardo Da Vinci Orazio-Nucola”
Over the four-week monitoring period, hourly mean CO2 concentrations increased during periods of student occupancy, reaching maximum values around midday (1357–1517 ppm) (Figure 4; Table 6). Concentrations subsequently decreased and gradually returned to a stable nighttime baseline. This diurnal pattern was observed under both experimental conditions; however, CO2 concentrations were significantly lower (−10%) in the classroom with vegetation. During nighttime, when classrooms were unoccupied, CO2 concentrations were comparable between the two conditions (366–423 ppm) (Table 6).
Figure 4.
Daily hourly averages of (a) PM2.5, (b) CO2, (c) PM10, (d) RH, and (e) temperature in classrooms with and without plants (Monday to Friday) for the period from 8 February 2026 to 8 March 2026 at the middle school “Leonardo da Vinci Orazio-Nucola” (MS-LVON).
Table 6.
Comparative analysis of indoor air quality parameters in classroom with and without plants during the 07:00–15:00 time window, selected to encompass lesson hours (typically starting at 08:00 and ending between 13:00 and 14:00) from Monday to Friday for the period from 8 February 2026 to 8 March 2026 at the middle school “Leonardo da Vinci Orazio-Nucola”.
PM2.5 concentrations exhibited higher temporal variability than CO2, with peak values typically occurring around midday (4.5–5.0 µg m−3) (Figure 4; Table 6). PM2.5 levels were consistently lower in the presence of plants (−11.2%), and this difference persisted during nighttime hours. A secondary increase in PM2.5 concentrations was observed after 16:00, despite the absence of students, likely associated with cleaning activities, followed by a decrease approximately five hours later. PM2.5 concentrations remained below 7 µg m−3 throughout the entire monitoring period.
Similarly, PM10 concentrations increased during classroom occupancy, reaching maximum values around midday (18.5–23.6 µg m−3), with an additional smaller increase in the late afternoon, likely related to cleaning activities. Across all periods, the presence of vegetation was associated with significantly lower PM10 concentrations, resulting in an average reduction of approximately 21%.
Hourly mean indoor air temperature increased during periods of classroom occupancy, reaching approximately 26 °C at midday in the control classroom, whereas temperatures remained lower in the classroom with vegetation, averaging around 23.7 °C (Figure 4; Table 6). Temperatures subsequently declined to approximately 20 °C under both conditions. Overall, the vegetated classroom showed significantly lower temperatures (−8%) compared to the control. During unoccupied periods, temperature differences between classrooms decreased and were not statistically significant. In contrast, RH was consistently and significantly higher in the classroom with plants (+15%), irrespective of student presence.
4.1.3. High School “Piero Gobetti”
After four weeks of observations, hourly mean CO2 concentrations increased during periods of student occupancy, reaching maximum values around midday (1500–1600 ppm) (Figure 5; Table 7). Concentrations subsequently decreased and gradually returned to a stable nighttime baseline. This diurnal pattern was consistently observed under both experimental conditions, with and without plants; however, no statistically significant differences in CO2 concentrations were detected between classrooms.
Figure 5.
Daily hourly averages of (a) PM2.5, (b) CO2, (c) PM10, (d) RH, and (e) temperature in classrooms with and without plants (Monday to Friday) for the period from 4 February 2026 to 4 March 2026 at the high school “Piero Gobetti” (HS-PG).
Table 7.
Comparative analysis of indoor air quality parameters in classrooms with and without plants during the 07:00–15:00 time window, selected to encompass lesson hours (typically starting at 08:00 and ending between at 14:00 from Monday to Friday for the period from 4 February 2026 to 4 March 2026 at the high school “Piero Gobetti”.
PM2.5 concentrations exhibited greater temporal variability than CO2, with peak values occurring around midday (1.9–2.6 µg m−3) and an additional increase in the late afternoon (Figure 5; Table 7). PM2.5 levels were consistently lower in the classroom with plants (−23%), and this reduction persisted during nighttime hours. Throughout the monitoring period, PM2.5 concentrations remained below 3 µg m−3.
Similarly, PM10 concentrations increased during classroom occupancy, reaching maximum values around midday (8.2–11.7 µg m−3). The presence of vegetation was associated with significantly lower PM10 concentrations, with an average reduction of approximately 21% compared to the control classroom.
Hourly mean indoor air temperature increased during periods of classroom occupancy, peaking at approximately 24 °C around midday in both classrooms, before declining to about 21 °C under both conditions. On average, the temperatures in the classroom with plants were significantly lower (−1%) than in the control. During unoccupied periods, particularly at night, the temperature differences between classrooms were reduced and comparable. In contrast, RH consistently remained higher in the classroom with plants, with an average increase of approximately 7%, regardless of student presence.
4.2. VOC Measurements in Office Environment
In the ex ante conditions, a total of 200 VOC belonging to 14 chemical classes were identified in the unoccupied sealed office, whereas 102 VOC belonging to 10 chemical classes were detected in the ex ante occupied open office (Table 8). The number of compounds per chemical class did not directly reflect their contribution to total concentrations. Alkanes were the most represented class in terms of number of compounds in both offices; however, alcohols accounted for the highest concentrations, followed by alkanes, acids, ketones, and esters in the unoccupied office, and by ketones, esters, alkanes, and arenes in the occupied office (Table 8).
Table 8.
VOCs in unoccupied and occupied offices: chemical classes, number of compounds for each chemical class, concentrations ex ante and ex post (mean ± SE), and Delta (Δ) values (%) between ex ante and ex post. Statistical significance is denoted by p < 0.05 (*), p < 0.01 (**), and p < 0.001 (***). n.d. = not detected.
Following plant installation, TVOC concentrations decreased significantly in both offices: in the empty office, TVOC concentrations decreased from 8.48 to 4.11 µg m−3 (−52%), while in the occupied office they decreased by 24%, from 9.22 to 6.99 µg m−3 (Table 8). The overall TVOC composition remained qualitatively similar, while there were substantial reductions in several classes and individual compounds, as the GC-MS analysis further revealed.
The VOC classes most affected by plant introduction were those showing higher ex ante concentrations. Alcohol concentrations decreased by 74% in the unoccupied office and by 31% in the occupied office, alkanes were reduced by 29% and 41%, respectively, while ketones decreased by 40% in the unoccupied and 46% in the occupied office. Monoterpenes and monoterpenoids showed marked reductions in both offices (−77% in the unoccupied and −46% in the occupied office), whereas arenes significantly decreased only in the occupied office (−28%). Ester concentrations significantly declined in the unoccupied office (−51%) but increased in the occupied office (+35%).
Regarding individual VOC, several alcohols showed significant reductions after plant introduction. In the unoccupied office, ethanol, 2-butoxy-(−89%), benzyl alcohol (−89%), and 2-Propanol 1 (2methoxypropoxy)- (−76%) decreased significantly, whereas isopropyl alcohol was significantly reduced in the occupied office (−69%). Ethanol concentrations decreased significantly in both offices (−59% in the unoccupied and −37% in the occupied office).
In the occupied office, acetone (ketone; 0.891 µg m−3) and isoprene (hemiterpene; 0.109 µg m−3) concentrations were higher than those measured in the unoccupied office (0.309 µg m−3 and 0.034 µg m−3, respectively). Both compounds significantly decreased following plant introduction in the two offices (acetone: −50% in the unoccupied and −56% in the occupied office; isoprene: −76% and −50%, respectively).
Monoterpenes and monoterpenoids were detected at relatively low concentrations in both offices. The most abundant compounds included limonene, p-cymene, and α- and β-pinene, all of which showed significant reductions after plant introduction (limonene: −89% unoccupied, −44% occupied; p-cymene: −78% unoccupied, −29% occupied; α-pinene: −44% unoccupied, −39% occupied; β-pinene: −76% unoccupied, −77% occupied) (Table S2).
Periodic measurements of environmental parameters indicated that, in the unoccupied office, plant introduction was associated with a reduction in air temperature (−3%) and an increase in relative humidity (+13%), while no relevant changes in CO2 concentrations were observed. In the occupied office, plant presence was associated with decreases in air temperature (−6%) and CO2 concentrations (−6%), along with an increase in RH (+12%).
4.3. Leaf Micromorphology
In all analyzed species, stomata were exclusively located on the abaxial surface, except for S. wallisi and Y. elephantipes which also exhibited sparse stomata on the adaxial surface. No morphological differences were observed between stomata occurring on the adaxial or abaxial leaf surfaces. F. Benjamina and S. actinophylla showed the highest total stomata density (between 150 and 140 stomata mm−2), whereas all other species were characterized by markedly lower stomatal densities, ranging from 29 to 63 stomata mm−2 (Table 9; Figure 6). Trichomes were not observed in any of the examined species.
Table 9.
Leaf macro and micromorphology and stomata density (stomata mm−2) on the leaf surfaces of the studied species. Both adaxial and abaxial surfaces are described; stomata density refers to the abaxial surface. Values are means ± SE (n = 3). a = absent.
Figure 6.
Environmental scanning electron micrograph of leaf abaxial surface with stomata (200× magnification). (A) Schefflera actinophylla, (B) Spathiphyllum wallisii, (C) Epipremnum aureum, (D) Ficus benjamina, (E) Chamaedorea elegans, and (F) Yucca elephantipes.
Epicuticular waxes were abundant and homogeneously distributed on both leaf surfaces in E. aureum, F. benjamina, and Y. elephantipes. In S. actinophylla, waxes were homogeneously distributed on both surfaces but less abundant on the abaxial side. In C. elegans, waxes were abundant and homogeneously distributed only on the adaxial surface, while in S. wallisi they were abundant but unevenly distributed on the adaxial surface. Waxes occurred in different morphotypes among species: they appeared as granules in S. actinophylla, often surrounding the stomata, and as platelets in S. wallisi and in Y. elephantipes. In C. elegans, E. aureum, F. benjamina waxes were mainly present as flakes. In addition, in F. benjamina and Y. elephantipes, the stomata rims were variably covered by nearly uniform waxes layers, consistent with previous reports [66]. In agreement with previous observations, stomata in F. benjamina were also surrounded by a characteristic cuticular thickening forming a distinct rim and were deeply sunken [67].
All the studied species exhibited cuticle ornamentation, characterized by different types of ridges on both the adaxial and the abaxial leaf surfaces. In S. actinophylla, ridges were present on both surfaces, while on the abaxial surface micro ridges were arranged in repeated patterns surrounding the stomata. Both leaf surfaces of S. wallisi were characterized by ridges oriented parallel to the stomata and by micro ridges arranged in repeated patterns, particularly around the stomata. In E. aureum, the ridges were arranged parallel to both stomata and leaf veins; additionally, epidermal cells were projected on the leaf surface, with clearly defined cell borders. In F. benjamina, the abaxial surface displayed prominently projected veins and ridges arranged in repeated patterns around the stomata, while the adaxial surface was characterized by projected veins and epidermis cells. In C. elegans, the macro ridges were aligned parallel to both the stomata and epidermal cells, elongated and projected, and exhibited well defined borders. Y. elephantipes showed macro ridges parallel to the stomata and the epidermal cells, elongated and projected on the leaf surface; around the protruding stomata, which were also present on the adaxial surface, papillae were arranged in distinct patterns.
5. Discussion
Phytoremediation is increasingly recognized as a potentially effective and sustainable strategy for improving indoor air quality; however, its performance strongly depends on both plant density and species composition [31,68,69,70,71,72].
Most commonly used indoor plants follow the C3 photosynthetic pathway and, during daytime, contribute positively to human well-being by absorbing CO2 and producing oxygen. Nevertheless, under low-light conditions or during nighttime, C3 plants may release CO2, potentially limiting their effectiveness in continuously occupied indoor settings. In the present study, a nature-based solution was implemented through the integration of many C3 plant species, selected and distributed according to the structural and functional characteristics of the monitored rooms. In addition, CAM plants such as Sansevieria laurentii were introduced in substantial numbers in a specific setting (middle school) to complement the diurnal CO2 uptake of C3 species. As CAM plants primarily assimilate CO2 nocturnally through crassulacean acid metabolism, they may contribute to a more balanced gas-exchange cycle over a 24 h period [31]. Similar combined C3–CAM strategies have been proposed in recent indoor air quality studies to mitigate nocturnal CO2 accumulation in poorly ventilated environments [68].
Under the conditions investigated in the present study, the contribution of indoor vegetation to CO2 mitigation was detectable, but limited. Reductions in CO2 concentrations were observed only during specific hours of the day and exclusively in the middle school, where the highest plant biodiversity and the most favorable plant-to-occupant ratio were implemented. In this context, the overall indoor CO2 balance was strongly influenced by human respiration associated with student occupancy, which likely constrained the detectability of plant-related CO2 uptake. This dominance of human respiratory emissions does not imply that plant assimilation is ineffective; rather, it suggests that the magnitude and temporal variability of occupant related CO2 sources may mask the comparatively smaller contribution of plants under real-life conditions.
These findings are consistent with previous results reported by Sharma et al. 2022 [68], who demonstrated that effective CO2 reduction through indoor plants depends strongly on plant density, species composition, and interaction with ventilation regimes. Likewise, the comprehensive review by Bandehali et al. 2021 [10] highlighted that, under real-life indoor conditions, plant-based CO2 mitigation is generally secondary to ventilation effects unless very high plant densities or engineered botanical biofilters are employed.
In contrast, particulate matter removal was more consistent and pronounced across all monitored school environment. This pattern is consistent with previous studies, which reported higher removal rates for PM2.5 and PM10 compared with CO2 and VOC in vegetated indoor environments, particularly under low-ventilation conditions [10,68]. The preferential removal of PM has been mainly attributed to physical processes such as gravitational settling, impaction, interception, and electrostatic deposition on leaf surfaces, as well as to vegetation-induced changes in airflow patterns and surface roughness that enhance particle deposition [10,68]. In this study, absolute PM concentrations during the monitoring period were generally low; consequently, the observed percentage reductions, ranging from approximately 3% to 23% for PM2.5 across all monitored schools corresponded to modest absolute reductions. The very low indoor PM2.5 concentrations, although unusual, reflect the specific macro-environmental conditions of the study area and the limitations of the monitoring approach. During the same period, the nearest official station (Genova–Rivarolo Cervetto, ARPA Liguria [73]) recorded average outdoor daytime PM2.5 concentrations of approximately 11 μg m−3. The much lower indoor levels are likely due to the shielding effect of the building envelope, combined with intermittent natural ventilation, with windows opened only briefly during breaks. In addition, the technical characteristics of the sensors must be considered. As reported in Table 3, AirQino PM sensors have a resolution of 1 μg m−3 and an accuracy of about 10%. Since indoor concentrations were close to the lower detection limit, small fluctuations could not be reliably captured, resulting in flattened hourly profiles and nearly overlapping trends in Figure 5a. Under these conditions, the reported relative reduction (−23%) corresponds to a very small absolute difference (<1 μg m−3) and should therefore be interpreted with caution, as it approaches the instrumental detection threshold. A clearer assessment of vegetation effects would likely require higher ambient PM2.5 levels. The variability observed for PM10 was of about 18–20% and more consistent compared to PM2.5. Nevertheless, even such limited reductions may be environmentally and health-relevant, as they contribute to reducing the cumulative exposure of students to particulate matter in indoor school environments.
Beyond pollutant removal, indoor vegetation also exerted a clear influence on indoor microclimatic conditions, particularly temperature and relative humidity. Across the monitored schools, the implementation of NBS contributed to significantly lower indoor temperatures during periods of daytime student occupancy, with reductions ranging from approximately 1 °C to 2 °C. This cooling effect is largely attributable to evapotranspiration processes, which dissipate sensible heat and reduce thermal fluctuations. Similar temperature moderation effects associated with indoor plants have been reported in densely occupied educational settings [10]. A residual cooling effect was also observed during nighttime periods, suggesting incomplete stomatal closure and sustained, albeit reduced, transpiration under indoor conditions [72,74].
Simultaneously, leaf transpiration led to measurable increases in indoor RH, ranging from approximately 6% to 15%. This finding is consistent with earlier studies demonstrating the role of indoor vegetation in stabilizing humidity levels and counteracting excessively dry indoor air, particularly during heating periods or in mechanically ventilated buildings [10,68,74,75]. This is an additional aspect worth discussing that concerns the indirect implications of plant-induced humidity regulation for indoor health conditions. In fact, the increase in relative humidity may shift indoor environments toward physiologically more favorable ranges and potentially reduce the stability and transmission of airborne viruses under moderate-to-high humidity conditions [76,77,78]. In this context, the ability of indoor plants to contribute to humidity regulation above critically low thresholds (>30%) [79] may represent a complementary, non-invasive strategy for improving indoor environmental conditions [31]. Such effects are particularly relevant in school settings, where thermal comfort and humidity are closely linked to the occupants’ well-being and cognitive performance.
Indoor air pollution comprises multiple components, which also include total volatile organic compounds. Numerous studies have demonstrated that potted plants can contribute to the reduction in indoor air contaminants under a range of environmental conditions [31,68,69,70,71,72,80,81,82] through absorption via leaf stomata and the epidermis, followed by further metabolization.
In our studies on office environments, TVOC concentration, but not composition, varied before and after the placement of potted plants. When no plants were present, the office presented higher TVOC concentrations than after plant introduction. This was the case at both experimental scenarios: the reduction was higher in the case of the unoccupied sealed offices, where fewer variables were at play, but it was also significant in the occupied office.
We thus suggest that the presence of VOC in general, and terpenes in particular, cannot be attributed to emissions caused by the physiological activities of the potted plants, although, to our knowledge, only S. wallisii, E. aureum, and F. benjamina can emit biogenic VOC, including terpenoid compounds [83,84]. Conversely, potted plants seemed to contribute to VOC reduction, mainly regarding alcohols, the classes with the highest concentrations, but also alkanes, ketones such as acetone, terpenic compounds such as isoprene, and the monoterpenes limonene and α- and β-pinene. VOC are released from different sources: alkanes, alcohols, arenes, and terpenes are among the main constituents of waxes and cleaning products; ethanol, 2-butoxy-, isopropyl alcohol, and benzyl alcohol are all found in cleaning products [85,86] and when present were significantly reduced after plant introduction; acetone is emitted through human breath and is a product of sugar metabolism [87]; limonene, p-cymene, and α- and β-pinene are typical fragrances of cleaning products [88,89], and isoprene can be emitted both by plants and through human breath [90,91]. Unlike all other VOC chemical classes, in the unoccupied office, in presence of plants, ester concentration decreased significantly, while it increased in the occupied office. This phenomenon may be related to the occupants, as these VOC are among the components of many perfumes, personal care products, and cosmetics [92]. Arenes, which include the so-called BTEX (benzene, toluene, ethylbenzene, and xylene) compounds, which are hazardous to human health, were present at concentrations relatable to external ones.
The species used in office environments have already been studied for their abilities to ameliorate IAQ. In particular, S. wallisii was studied for its ability to remove indoor pollutants such as NO2 and several VOC, including formaldehyde, benzene, toluene, and 2-ethylhexanol [93,94,95]; F. benjamina, C. elegans, and E. aureum removed formaldehyde, mainly in the root zone [31,93,96]; E. aureum removed formaldehyde, xylene, and toluene [93], as well as PM [27], and S. actinophylla removed gaseous toluene, benzene [93] and formaldehyde in the root zone [28,31]. The primary effects of the potential of the indoor plants on air quality are formaldehyde, benzene, and toluene removal; thus, using a combination of plant species can further improve air quality [79,95].
As dust-retention potential increases with the number of stomata [97], the relative higher total stomata density in F. benjamina and S. actinophylla suggested that these species have the potential to efficiently absorb particulate matter. As the potential of epicuticular wax in trapping particles is species-specific [98], and waxy leaves collected the highest amount of particles from the atmosphere [98,99], our results highlighted that species with waxier leaves, such as Yucca elephantipes, F. benjamina and E. aureum, could be more effective in capturing PM. Since leaves with rough surfaces and densely arranged grooves and ridges showed more PM accumulation than those with smooth surfaces [100], the leaf surface complexity and roughness of all of the species under study were considered suitable for capturing dust. Furthermore, in the species E. aureum, F. benjamina, C. elegans, and Y. elephantipes, the epidermis cells projected on the leaf surface contributed to the surface complexity and thus to its coarseness.
One limitation of this study is that it was carried out using low-cost monitoring devices, which inherently involve a certain degree of measurement uncertainty and lower accuracy compared to reference-grade instruments. Moreover, although efforts were made to ensure consistency in classroom characteristics (e.g., floor area, orientation, and number of students), key confounding factors—such as window and door opening behavior, ventilation frequency, occupant activities, and cleaning practices—of course could not be fully controlled and may have influenced the observed outcomes. Additionally, the office-based experiments were conducted with a limited number of replicates, reflecting their case-study nature; further studies will be needed to confirm and consolidate the observed results.
Taken together, the combined evidence supports the suitability of all the studied species for indoor applications.
6. Conclusions
Given that people spend up to 90% of their time indoors, ensuring good IAQ is essential to limit human exposure to air pollutants. In this context, indoor vegetation is increasingly recognized as a complementary strategy to improve indoor environmental quality.
Schools are a particularly sensitive setting, as children and adolescents, who are more vulnerable to air pollution, spend a substantial amount of time there.
This study investigated the effects of indoor plants in schools and offices under real-world conditions; to the best of our knowledge, it represents one of the first investigations to integrate continuous, real-time monitoring of phytoremediation effects on IAQ across multiple educational levels with the assessment of VOC concentrations in office environments.
The results indicate that the presence of multiple potted plant species is associated with measurable reductions in PM and VOC concentrations, along with improvements in indoor microclimate conditions, including lower air temperatures and higher RH. Despite variability among environments, these findings support the use of indoor plants as an effective and sustainable nature-based solution for enhancing IAQ in indoor workplaces.
While much of the current evidence on indoor phytoremediation is derived from controlled laboratory studies, this work provides in situ data demonstrating its relevance in real, occupied indoor environments. Despite the inability of fully control variables such as occupancy patterns and window or door opening, these conditions reflect typical school and workplace settings and therefore offer a realistic framework for assessing plant-based interventions. Even modest but consistent improvements across multiple indoor environmental parameters may thus be environmentally and health relevant.
In conclusion, the integration of indoor plants in schools and workplaces emerges as a promising complementary strategy to improve indoor environmental quality and promote healthier and more comfortable indoor spaces, particularly for children and adolescents who are more vulnerable to air pollution.
Future research should broaden plant-based experimental approaches and integrate them with systematic, long-term IAQ monitoring to further clarify the phytoremediation potential of indoor vegetation under real-life conditions. In addition, forthcoming initiatives will address the effects of indoor nature-based solutions on student cognitive performance and socio-psychological well-being, providing a more comprehensive assessment of their benefits for indoor environments.
Supplementary Materials
The following supporting information can be downloaded at: https://www.mdpi.com/article/10.3390/atmos17060596/s1. Table S1: Intercalibration results of AirQino monitoring stations based on co-location analysis and linear regression. Table S2: Alcohols, monoterpenes and monoterpenoids, hemiterpenes, and acetone in unoccupied and occupied offices: name, chemical classes, concentrations ex ante and ex post (mean ± SE), Delta (Δ) values (%) between ex ante and ex post. Statistical significance is denoted by p < 0.05 (*), p < 0.01 (**), and p < 0.001 (***). N.d. = not detected.
Author Contributions
Conceptualization, A.Z., L.N. and R.B.; methodology A.Z., L.N., R.B., S.P. and C.D.B.; software, S.P. and A.Z.; validation, A.Z., L.N., R.B., S.P. and C.D.B.; formal analysis, S.P.; investigation, S.P., C.D.B., A.N. and L.N.; resources, A.Z. and C.V.; data curation, S.P., C.D.B. and A.N.; writing—original draft preparation, S.P., C.D.B. and A.N.; writing—review and editing, A.Z., L.N., R.B., B.G., A.N., S.P. and C.D.B.; visualization, S.P., A.N. and C.D.B.; supervision, A.Z., B.G., R.B. and L.N.; project administration, C.V.; funding acquisition, B.G., R.B., A.Z. and L.N. All authors have read and agreed to the published version of the manuscript.
Funding
VOC measurements were funded under the National Recovery and Resilience Plan (NRRP), Mission 04 Component 2 Investment 1.5—Next Generation EU, Call for Tender No. 3277 dated 30 December 2021. Award Number: 0001052 dated 23 June 2022 (ECS_00000033_ECOSISTER). A.N. received financial support for a research stay in IBE-CNR, Bologna, from an internal mobility scholarship of Warsaw University of Life Sciences (SGGW).
Institutional Review Board Statement
Not applicable.
Informed Consent Statement
Informed consent was obtained from all subjects involved in the study.
Data Availability Statement
The original contributions presented in this study are included in the article/Supplementary Material. Further inquiries can be directed to the corresponding author.
Acknowledgments
We gratefully acknowledge Coldiretti for its stimulating scientific involvement in the project and for logistical support. We thank the Garden Club cultural association of Terni for the coordination and dissemination support, and all participating schools. The authors would like to express their sincere thanks to the students, teachers, and all staff for their enthusiastic participation, which made this study possible. We sincerely thank Arkadiusz Przybysz and Robert Popek of Warsaw University of Life Sciences (SGGW) for their ongoing pluriannual collaboration, which made Nawrocki’s exchange visit possible. Many sincere thanks to Franco Corticelli (ISMN-CNR) for his assistance in ESEM analysis.
Conflicts of Interest
The authors declare no conflict of interest.
References
- Orwell, R.L.; Wood, R.L.; Tarran, J.; Torpy, F.; Burchett, M.D. Removal of Benzene by the Indoor Plant/Substrate Microcosm and Implications for Air Quality. Water Air Soil Pollut. 2004, 157, 193–207. [Google Scholar] [CrossRef]
- World Health Organization. How Air Pollution Is Destroying Our Health. Available online: https://www.who.int/news-room/spotlight/how-air-pollution-is-destroying-our-health (accessed on 10 April 2026).
- Clark, M.L.; Peel, J.L.; Balakrishnan, K.; Breysse, P.N.; Chillrud, S.N.; Naeher, L.P.; Rodes, C.E.; Vette, A.F.; Balbus, J.M. Health and household air pollution from solid fuel use: The need for improved exposure assessment. Environ. Health Perspect. 2013, 121, 1120–1128. [Google Scholar] [CrossRef] [PubMed Central]
- Saini, J.; Dutta, M.; Marques, G. A comprehensive review on indoor air quality monitoring systems for enhanced public health. Sustain. Environ. Res. 2020, 30, 6. [Google Scholar] [CrossRef]
- Environmental Protection Agency. Integrated Science Assessment for Particulate Matter; EPA: Washington, DC, USA, 2009. Available online: https://assessments.epa.gov/isa/document/&deid=216546 (accessed on 10 April 2026).
- Wickliffe, J.K.; Stock, T.H.; Howard, J.L.; Frahm, E.; Simon-Friedt, B.R.; Montgomery, K.; Wilson, M.J.; Lichtveld, M.Y.; Harville, E. Increased long-term health risks attributable to select volatile organic compounds in residential indoor air in southeast Louisiana. Sci. Rep. 2020, 10, 21649. [Google Scholar] [CrossRef] [PubMed]
- World Health Organization. Burden of Disease from the Joint Effects of Household and Ambient Air Pollution for 2016: Summary of Results; World Health Organization: Geneva, Switzerland, 2018; Available online: https://cdn.who.int/media/docs/default-source/air-quality-database/aqd-2018/ap_joint_effect_bod_results_may2018.pdf (accessed on 10 April 2026).
- Lu, C.; Deng, Q.; Li, Y.; Sundell, J.; Norbäck, D. Outdoor air pollution, meteorological conditions and indoor factors in dwellings in relation to sick building syndrome (SBS) among adults in China. Sci. Total Environ. 2016, 560–561, 186–196. [Google Scholar] [CrossRef]
- Lowther, S.D.; Dimitroulopoulou, S.; Foxall, K.; Shrubsole, C.; Cheek, E.; Gadeberg, B.; Sepai, O. Low level carbon dioxide indoors—A pollution indicator or a pollutant? A health-based perspective. Environments 2021, 8, 125. [Google Scholar] [CrossRef]
- Bandehali, S.; Miri, T.; Onyeaka, H.; Kumar, P. Current State of Indoor Air Phytoremediation Using Potted Plants and Green Walls. Atmosphere 2021, 12, 473. [Google Scholar] [CrossRef]
- Orwell, R.L.; Wood, R.A.; Burchett, M.D.; Tarran, J.; Torpy, F. The potted-plant microcosm substantially reduces indoor air VOC pollution: II. Laboratory study. Water Air Soil Pollut. 2006, 177, 59–80. [Google Scholar] [CrossRef]
- Soreanu, G.; Dixon, M.; Darlington, A. Botanical biofiltration of indoor gaseous pollutants—A mini-review. Chem. Eng. J. 2013, 229, 585–594. [Google Scholar] [CrossRef]
- IARC Working Group on the Evaluation of Carcinogenic Risks to Humans. Formaldehyde, 2-Butoxyethanol and 1-tert-Butoxypropan-2-ol; IARC Monographs on the Evaluation of Carcinogenic Risks to Humans; IARC: Lyon, France, 2006; Volume 88, Available online: https://publications.iarc.who.int/Book-And-Report-Series/Iarc-Monographs-On-The-Identification-Of-Carcinogenic-Hazards-To-Humans/Formaldehyde-2-Butoxyethanol-And-1-tert-Butoxypropan-2-ol-2006 (accessed on 10 April 2026).
- Campagnolo, D.; Saraga, D.E.; Cattaneo, A.; Spinazzè, A.; Mandin, C.; Mabilia, R.; Perreca, E.; Sakellaris, I.; Canha, N.; Mihucz, V.G.; et al. VOCs and aldehydes source identification in European office buildings—The OFFICAIR study. Build. Environ. 2017, 115, 18–24. [Google Scholar] [CrossRef]
- González-Martín, J.; Kraakman, N.J.R.; Pérez, C.; Lebrero, R.; Muñoz, R. A state-of-the-art review on indoor air pollution and strategies for indoor air pollution control. Chemosphere 2021, 262, 128376. [Google Scholar] [CrossRef]
- Environmental Protection Agency (EPA). Annual Report and Accounts 2024; EPA: Wexford, Ireland, 2024. Available online: https://www.epa.ie/publications/corporate/governance/EPA-Annual-Report-2024-EN-UA.pdf (accessed on 10 April 2026).
- Brook, R.D.; Rajagopalan, S.; Pope, C.A., 3rd; Brook, J.R.; Bhatnagar, A.; Diez-Roux, A.V.; Holguin, F.; Hong, Y.; Luepker, R.V.; Mittleman, M.A.; et al. Particulate matter air pollution and cardiovascular disease: An update to the scientific statement from the American Heart Association. Circulation 2010, 121, 2331–2378. [Google Scholar] [CrossRef]
- Tröstl, J.; Chuang, W.K.; Gordon, H.; Baltensperger, U.; Keutsch, F.N.; Donahue, N.M.; Smith, J.N.; Worsnop, D.R.; Kulmala, M.; Volkamer, R.; et al. The role of low-volatility organic compounds in initial particle growth in the atmosphere. Nature 2016, 533, 527–531. [Google Scholar] [CrossRef]
- Han, K.-T.; Ruan, L.-W.; Liao, L.-S. Effects of Indoor Plants on Human Functions: A Systematic Review with Meta-Analyses. Int. J. Environ. Res. Public Health 2022, 19, 7454. [Google Scholar] [CrossRef]
- Australian Building Codes Board (ABCB). National Construction Code (NCC); Australia, 2022, Vol. 1. Available online: https://ncc.abcb.gov.au/ (accessed on 10 April 2026).
- GB/T 18883-2002; Indoor Air Quality Standard. Ministry of Environmental Protection of the People’s Republic of China: Beijing, China; Standards Press of China: Beijing, China, 2002. Available online: https://english.mee.gov.cn/Resources/standards/Air_Environment/quality_standard1/200710/t20071024_111820.shtml (accessed on 10 April 2026).
- European Union. Directive (EU) 2024/2881 of the European Parliament and of the Council of 23 October 2024 on ambient air quality and cleaner air for Europe (recast). Off. J. Eur. Union 2024, 2024/2881, 20.11.2024. Available online: https://eur-lex.europa.eu/eli/dir/2024/2881/oj (accessed on 10 April 2026).
- World Health Organization (WHO). WHO Global Air Quality Guidelines: Particulate Matter (PM2.5 and PM10), Ozone, Nitrogen Dioxide, Sulfur Dioxide and Carbon Monoxide; World Health Organization: Geneva, Switzerland, 2021; Available online: https://iris.who.int/handle/10665/345329 (accessed on 10 April 2026).
- UNI 11976:2025; Ergonomia Dell’ambiente Fisico—Strumenti per la Valutazione Della Qualità Dell’aria Interna [Ergonomics of the Physical Environment—Instruments for the Assessment of Indoor air Quality]. Ente Italiano di Normazione (UNI): Milano, Italy, 2025. Available online: https://store.uni.com/uni-11976-2025 (accessed on 10 April 2026).
- ASHRAE. ASHRAE Position Document on Indoor Carbon Dioxide; ASHRAE: Peachtree Corners, GA, USA, 2025; Available online: https://www.ashrae.org/file%20library/about/position%20documents/pd-on-indoor-carbon-dioxide-english.pdf (accessed on 22 May 2026).
- van den Bogerd, N.; Dijkstra, S.C.; Koole, S.L.; Seidell, J.C.; de Vries, R.; Maas, J. Nature in the Indoor and Outdoor Study Environment and Secondary and Tertiary Education Students’ Well-Being, Academic Outcomes, and Possible Mediating Pathways: A Systematic Review with Recommendations for Science and Practice. Health Place 2020, 66, 102403. [Google Scholar] [CrossRef] [PubMed]
- Aydogan, A.; Cerone, R. Review of the Effects of Plants on Indoor Environments. Indoor Built Environ. 2021, 30, 442–460. [Google Scholar] [CrossRef]
- Irga, P.J.; Pettit, T.J.; Torpy, F.R. The Phytoremediation of Indoor Air Pollution: A Review on the Technology Development from the Potted Plant Through to Functional Green Wall Biofilters. Rev. Environ. Sci. Bio/Technol. 2018, 17, 395–415. [Google Scholar] [CrossRef]
- Bringslimark, T.; Hartig, T.; Patil, G.G. The Psychological Benefits of Indoor Plants: A Critical Review of the Experimental Literature. J. Environ. Psychol. 2009, 29, 422–433. [Google Scholar] [CrossRef]
- Dijkstra, K.; Pieterse, M.E.; Pruyn, A. Stress-Reducing Effects of Indoor Plants in the Built Healthcare Environment: The Mediating Role of Perceived Attractiveness. Prev. Med. 2008, 47, 279–283. [Google Scholar] [CrossRef]
- Han, K.-T.; Ruan, L.-W. Effects of Indoor Plants on Air Quality: A Systematic Review. Environ. Sci. Pollut. Res. 2020, 27, 16019–16051. [Google Scholar] [CrossRef] [PubMed]
- Davis, M.M.; Hirmer, S. The Potential for Vertical Gardens as Evaporative Coolers: An Adaptation of the ‘Penman-Monteith Equation’. Build. Environ. 2015, 92, 135–141. [Google Scholar] [CrossRef]
- Mangone, G.; van der Linden, K. Forest Microclimates: Investigating the Performance Potential of Vegetation at the Building Space Scale. Build. Environ. 2014, 73, 12–23. [Google Scholar] [CrossRef]
- Pérez-Urrestarazu, L.; Fernández-Cañero, R.; Franco, A.; Egea, G. Influence of an Active Living Wall on Indoor Temperature and Humidity Conditions. Ecol. Eng. 2016, 90, 120–124. [Google Scholar] [CrossRef]
- Carrer, P.; Wolkoff, P. Assessment of Indoor Air Quality Problems in Office-Like Environments: Role of Occupational Health Services. Int. J. Environ. Res. Public Health 2018, 15, 741. [Google Scholar] [CrossRef]
- Jiang, J.; Irga, P.; Coe, R.; Gibbons, P. Effects of Indoor Plants on CO2 Concentration, Indoor Air Temperature and Relative Humidity in Office Buildings. PLoS ONE 2024, 19, e0305956. [Google Scholar] [CrossRef]
- Toyinbo, O. Indoor Environmental Quality, Pupils’ Health, and Academic Performance—A Literature Review. Buildings 2023, 13, 2172. [Google Scholar] [CrossRef]
- Fromme, H.; Diemer, J.; Dietrich, S.; Cyrys, J.; Heinrich, J.; Lang, W.; Kiranoglu, M.; Twardella, D. Chemical and Morphological Properties of Particulate Matter (PM10, PM2.5) in School Classrooms and Outdoor Air. Atmos. Environ. 2008, 42, 6597–6605. [Google Scholar] [CrossRef]
- Faustman, E.M.; Silbernagel, S.M.; Fenske, R.A.; Burbacher, T.M.; Ponce, R.A. Mechanisms Underlying Children’s Susceptibility to Environmental Toxicants. Environ. Health Perspect. 2000, 108, 13–21. [Google Scholar] [CrossRef]
- Foos, B.; Marty, M.; Schwartz, J.; Bennett, W.; Moya, J.; Jarabek, A.M.; Salmon, A.G. Focusing on Children’s Inhalation Dosimetry and Health Effects for Risk Assessment: An Introduction. J. Toxicol. Environ. Health A 2008, 71, 149–165. [Google Scholar] [CrossRef]
- Ginsberg, G.L.; Asgharian, B.; Kimbell, J.S.; Ultman, J.S.; Jarabek, A.M. Modeling Approaches for Estimating the Dosimetry of Inhaled Toxicants in Children. J. Toxicol. Environ. Health A 2008, 71, 166–195. [Google Scholar] [CrossRef]
- Chen, W.; Zhang, J.S.; Zhang, Z. Performance of Air Cleaners for Removing Multi-Volatile Organic Compounds in Indoor Air. In Proceedings of the 11th International Conference on Indoor Air Quality and Climate (Indoor Air 2008), Copenhagen, Denmark, 17–22 August 2008; pp. 1–8. Available online: https://www.researchgate.net/publication/275344400 (accessed on 10 April 2026).
- Han, K.-T. Restorative Nature: An Overview of the Positive Influences of Natural Landscapes on Humans; LAP LAMBERT Academic Publishing: Saarbrücken, Germany, 2011; Available online: https://lboro-test.koha-ptfs.co.uk/bib/567834 (accessed on 10 April 2026).
- Pulimeno, M.; Piscitelli, P.; Colazzo, S.; Colao, A.; Miani, A. Indoor Air Quality at School and Students’ Performance: Recommendations of the UNESCO Chair on Health Education and Sustainable Development & the Italian Society of Environmental Medicine (SIMA). Health Promot. Perspect. 2020, 10, 169–174. [Google Scholar] [CrossRef]
- Susanto, A.D.; Winardi, W.; Hidayat, M.; Wirawan, A. The Use of Indoor Plant as an Alternative Strategy to Improve Indoor Air Quality in Indonesia. Rev. Environ. Health 2021, 36, 95–99. [Google Scholar] [CrossRef]
- Husti, A.; Cantor, M.; Stefan, R.; Miclean, M.; Roman, M.; Neacsu, I.; Contiu, I.; Magyari, K.; Maia, M. Assessing the Indoor Pollutants Effect on Ornamental Plants Leaves by FT-IR Spectroscopy. Acta Phys. Pol. A 2016, 129, 142–149. [Google Scholar] [CrossRef]
- Suhaimi, M.M.; Leman, A.M.; Afandi, A.; Hariri, A.; Idris, A.F.; Mohd Dzulkifli, S.N.; Gani, P. Effectiveness of Indoor Plant to Reduce CO2 in Indoor Environment. MATEC Web Conf. 2017, 103, 05004. [Google Scholar] [CrossRef]
- Tarran, J.; Torpy, F.; Burchett, M. Use of Living Pot-Plants to Cleanse Indoor Air—Research Review. In Proceedings of the 6th International Conference on Indoor Air Quality, Ventilation & Energy Conservation in Buildings—Sustainable Built Environment, Sendai, Japan, 28–31 October 2007; Volume III, pp. 249–256. Available online: https://www.calameo.com/books/0009143748fb5d45e680c (accessed on 10 April 2026).
- Liu, Y.-J.; Mu, Y.-J.; Zhu, Y.-G.; Ding, H.; Arens, N.C. Which Ornamental Plant Species Effectively Remove Benzene from Indoor Air? Atmos. Environ. 2007, 41, 650–654. [Google Scholar] [CrossRef]
- Pichlhöfer, A.; Sesto, E.; Hollands, J.; Korjenic, A. Health-Related Benefits of Different Indoor Plant Species in a School Setting. Sustainability 2021, 13, 9566. [Google Scholar] [CrossRef]
- Han, K.-T. Effects of Indoor Plants on the Physical Environment with Respect to Distance and Green Coverage Ratio. Sustainability 2019, 11, 3679. [Google Scholar] [CrossRef]
- Torpy, F.R.; Irga, P.J.; Burchett, M.D. Profiling Indoor Plants for the Amelioration of High CO2 Concentrations. Urban For. Urban Green. 2014, 13, 227–233. [Google Scholar] [CrossRef]
- Cetin, M.; Sevik, H. Measuring the Impact of Selected Plants on Indoor CO2 Concentrations. Pol. J. Environ. Stud. 2016, 25, 1073–1079. [Google Scholar] [CrossRef]
- Ghazalli, A.J.; Brack, C.; Bai, X.; Said, I. Alterations in Use of Space, Air Quality, Temperature and Humidity by the Presence of Vertical Greenery System in a Building Corridor. Urban For. Urban Green. 2018, 32, 177–184. [Google Scholar] [CrossRef]
- Tudiwer, D.; Korjenic, A. The Effect of an Indoor Living Wall System on Humidity, Mould Spores and CO2 Concentration. Energy Build. 2017, 146, 73–86. [Google Scholar] [CrossRef]
- Abhijith, K.V.; Rawat, N.; Mendes Emygdio, A.P.; Le Den, C.; Collins, K.; Cartwright, P.; Alger, K.; McCallen, B.; Kumar, P. Demonstrating multi-benefits of green infrastructure to schools through collaborative approach. Sci. Total Environ. 2025, 958, 177959. [Google Scholar] [CrossRef] [PubMed]
- Pennisi, S.V.; van Iersel, M.W. Quantification of Carbon Assimilation of Plants in Simulated and In Situ Interiorscapes. HortScience 2012, 47, 468–476. [Google Scholar] [CrossRef]
- Pamonpol, K.; Tokhun, N.; Somparn, A. Measuring Elevated Indoor Carbon Dioxide Concentration from Unsuitable Condition of Indoor Plant. In Proceedings of the 2020 International Conference and Utility Exhibition on Energy, Environment and Climate Change (ICUE), Pattaya, Thailand, 20–22 October 2020; pp. 1–6. [Google Scholar] [CrossRef]
- Gubb, C.; Blanuša, T.; Griffiths, A.; Pfrang, C. Interaction between Plant Species and Substrate Type in the Removal of CO2 Indoors. Air Qual. Atmos. Health 2019, 12, 1197–1206. [Google Scholar] [CrossRef]
- Putzolu, S.; Ciciani, A.M.; Giorgetti, T.; Lombari, S.; Pire, E.; Ricci, M.; Pucci, N.; Zaldei, A.; Gioli, B. “Plants in the Classroom”: A Citizen Science Experience to Improve Indoor Air Quality at the Gobetti-Volta Scientific High School in Bagno a Ripoli (Italy). J. Technol. Appl. Vasc. Res. 2026, 11, 249. [Google Scholar] [CrossRef]
- Cavaliere, A.; Di Gennaro, F.; Di Lonardo, S.; Gioli, B.; Gualtieri, G.; Martelli, F.; Matese, A.; Toscano, P.; Vagnoli, C.; Zaldei, A. Development of Low-Cost Air Quality Stations for Next Generation Monitoring Networks: Validation of PM2.5 and PM10 Sensors. Sensors 2018, 18, 2843. [Google Scholar] [CrossRef]
- Gualtieri, G.; Carotenuto, F.; Finardi, S.; Tartaglia, M.; Toscano, P.; Gioli, B. Forecasting PM10 Hourly Concentrations in Northern Italy: Insights on Models Performance and PM10 Drivers Through Self-Organizing Maps. Atmos. Pollut. Res. 2018, 9, 1204–1213. [Google Scholar] [CrossRef]
- Donelli, D.; Meneguzzo, F.; Antonelli, M.; Ardissino, D.; Niccoli, G.; Gronchi, G.; Baraldi, R.; Neri, L.; Zabini, F. Effects of Plant-Emitted Monoterpenes on Anxiety Symptoms: A Propensity-Matched Observational Cohort Study. Int. J. Environ. Res. Public Health 2023, 20, 2773. [Google Scholar] [CrossRef]
- Baraldi, R.; Neri, L.; Costa, F.; Facini, O.; Rapparini, F.; Carriero, G. Ecophysiological and Micromorphological Characterization of Green Roof Vegetation for Urban Mitigation. Urban For. Urban Green. 2019, 37, 24–32. [Google Scholar] [CrossRef]
- Westerkamp, C.; Demmelmeyer, H. Leaf Surfaces of Central European Woody Plants: Atlas and Keys; Borntraeger: Berlin/Stuttgart, Germany, 1997; p. 252. [Google Scholar]
- Barthlott, W.; Neinhuis, C.; Cutler, D.; Ditsch, F.; Meusel, I.; Theisen, I.; Wilhelmi, H. Classification and Terminology of Plant Epicuticular Waxes. Bot. J. Linn. Soc. 1998, 126, 237–260. [Google Scholar] [CrossRef]
- El-Demerdash, M.M.; El-Sayed, A.S.; Teleb, S.S.; Sadek, A.M.; Elsehely, H.H. DNA Barcoding, Micromorphology and Metabolic Traits of Selected Ficus L. (Moraceae) Species from Egypt. BMC Plant Biol. 2024, 24, 983. [Google Scholar] [CrossRef]
- Sharma, S.; Bakht, A.; Jahanzaib, M.; Lee, H.; Park, D. Evaluation of the Effectiveness of Common Indoor Plants in Improving the Indoor Air Quality of Studio Apartments. Atmosphere 2022, 13, 1863. [Google Scholar] [CrossRef]
- Danielski, I.; Svensson, Å.; Weimer, K.; Lorentzen, L.; Warne, M. Effects of Green Plants on the Indoor Environment and Wellbeing in Classrooms—A Case Study in a Swedish School. Sustainability 2022, 14, 3777. [Google Scholar] [CrossRef]
- Moya, T.A.; van den Dobbelsteen, A.; Ottelé, M.; Bluyssen, P.M. A Review of Green Systems within the Indoor Environment. Indoor Built Environ. 2019, 28, 298–309. [Google Scholar] [CrossRef]
- Kim, H.H.; Yeo, I.Y.; Lee, J.Y. Higher Attention Capacity After Improving Indoor Air Quality by Indoor Plant Placement in Elementary School Classrooms. Hortic. J. 2020, 89, 319–327. [Google Scholar] [CrossRef]
- Kim, T.H.; Lee, H.; Choi, B.H.; Hyun, H.S. A Pilot Study of Improving the Atmospheric Environment of Classroom for Students’ Learning Activities. J. People Plants Environ. 2021, 24, 179–194. [Google Scholar] [CrossRef]
- ISPRA. One Portal Air Quality System (OPAS)—National Air Quality Data Portal. Monitoring Station: Genova—Rivarolo Cervetto (ARPA Liguria). Available online: https://opas.isprambiente.it/str_dataview_download (accessed on 22 May 2026).
- Caird, M.A.; Richards, J.H.; Donovan, L.A. Nighttime Stomatal Conductance and Transpiration in C3 and C4 Plants. Plant Physiol. 2007, 143, 4–10. [Google Scholar] [CrossRef]
- Resco de Dios, V.; Roy, J.; Ferrio, J.P.; Alday, J.; Landais, D.; Milcu, A.; Gessler, A. Processes Driving Nocturnal Transpiration and Implications for Estimating Land Evapotranspiration. Sci. Rep. 2015, 5, 10975. [Google Scholar] [CrossRef]
- Yang, W.; Elankumaran, S.; Marr, L.C. Relationship Between Humidity and Influenza A Viability in Droplets and Implications for Influenza’s Seasonality. PLoS ONE 2012, 7, e46789. [Google Scholar] [CrossRef]
- Bhattacharyya, S.; Gesteland, P.H.; Korgenski, K.; Bjørnstad, O.N.; Adler, F.R. Cross-immunity between strains explains the dynamical pattern of paramyxoviruses. Proc. Natl. Acad. Sci. USA 2015, 112, 13390–13395. [Google Scholar] [CrossRef] [PubMed]
- Audi, A.; AlIbrahim, M.; Kaddoura, M.; Hijazi, G.; Yassine, H.M.; Zaraket, H. Seasonality of Respiratory Viral Infections: Will COVID-19 Follow Suit? Front. Public Health 2020, 8, 567184. [Google Scholar] [CrossRef]
- Kerschen, E.W.; Garten, C.; Williams, K.A.; Derby, M.M. Evapotranspiration from Spider and Jade Plants Can Improve Relative Humidity in an Interior Environment. HortTechnology 2016, 26, 803–810. [Google Scholar] [CrossRef]
- Campiotti, A.; Ricciardi, E.; Spano, G.; Dominici, L.; Comino, E.; Riggio, R.; Pitasi, F.; Ribotta, L.; Barbero, S.; Sanesi, G.; et al. Indoor Green Walls for Improving Air Quality and Human Well-Being: A Case Study from a Primary School in Turin (Italy). Nat.-Based Solut. 2025, 8, 100280. [Google Scholar] [CrossRef]
- Weerasinghe, N.H.; Silva, P.K.; Jayasinghe, R.R.; Abeyrathna, W.P.; John, G.K.P.; Halwatura, R.U. Reducing CO2 Level in the Indoor Urban Built Environment: Analysing Indoor Plants Under Different Light Levels. Clean. Eng. Technol. 2023, 14, 100645. [Google Scholar] [CrossRef]
- Gomes, M.I.; Barreiros, A.M.; Boaventura, M.I.; Rodrigues, A.S. Do Plants Improve Indoor Air Quality? Myth or Reality? A Case Study in a University Environment Using Treated Wastewater for Plants Irrigation. In International Conference on Water Energy Food and Sustainability (ICoWEFS 2024); Brito, P.S., Ed.; Springer: Cham, Switzerland, 2025; pp. 110–117. [Google Scholar] [CrossRef]
- Yang, D.S.; Son, K.C.; Kays, S.J. Volatile Organic Compounds Emanating from Indoor Ornamental Plants. HortScience 2009, 44, 396–400. [Google Scholar] [CrossRef]
- Kaur, S.; Mishra, S.K.; Goel, V.; Gupta, M.; Sahu, L.K.; Singh, R.; Shrivastava, M.; Kumar, M. Biogenic Volatile Organic Compounds Emission from Indoor Plants: Potential Implications to Human Health. In AGU Fall Meeting Abstracts 2023; AGU: San Francisco, CA, USA, 2023; Volume 2023, Abstract GH51C-0642; Available online: https://ui.adsabs.harvard.edu/abs/2023AGUFMGH51C0642K/abstract (accessed on 10 April 2026).
- Gerster, F.M.; Vernez, D.; Wild, P.P.; Hopf, N.B. Hazardous Substances in Frequently Used Professional Cleaning Products. Int. J. Occup. Environ. Health 2014, 20, 46–60. [Google Scholar] [CrossRef]
- Nazaroff, W.W.; Coleman, B.K.; Destaillats, H.; Hodgson, A.T.; Liu, D.L.; Lunden, M.M.; Singer, B.C.; Weschler, C.J. Indoor Air Chemistry: Cleaning Agents, Ozone and Toxic Air Contaminants; LBNL-58231; Lawrence Berkeley National Laboratory: Berkeley, CA, USA, 2006; Available online: https://www.researchgate.net/publication/260389247_Indoor_Air_Chemistry_Cleaning_Agents_Ozone_and_Toxic_Air_Contaminants (accessed on 10 April 2026).
- Fenske, J.D.; Paulson, S.E. Human Breath Emissions of VOCs. J. Air Waste Manag. Assoc. 1999, 49, 594–598. [Google Scholar] [CrossRef]
- Rastogi, S.C.; Heydorn, S.; Johansen, J.D.; Basketter, D.A. Fragrance Chemicals in Domestic and Occupational Products. Contact Dermat. 2001, 45, 221–225. [Google Scholar] [CrossRef] [PubMed]
- Martienssen, M.; Riedel, R.; Kühne, T. Contribution of Professional Cleaning to Indoor Air and Sewage Pollution. Sustain. Chem. 2024, 5, 275–286. [Google Scholar] [CrossRef]
- Sharkey, T.D.; Wiberley, A.E.; Donohue, A.R. Isoprene Emission from Plants: Why and How. Ann. Bot. 2008, 101, 5–18. [Google Scholar] [CrossRef]
- Mochalski, P.; King, J.; Mayhew, C.A.; Unterkofler, K. A Review on Isoprene in Human Breath. J. Breath Res. 2023, 17, 037101. [Google Scholar] [CrossRef]
- Lee, J.W.; Trinh, C.T. Towards Renewable Flavors, Fragrances, and Beyond. Curr. Opin. Biotechnol. 2020, 61, 168–180. [Google Scholar] [CrossRef]
- Kumar, R.; Verma, V.; Thakur, M.; Singh, G.; Bhargava, B. A Systematic Review on Mitigation of Common Indoor Air Pollutants Using Plant-Based Methods: A Phytoremediation Approach. Air Qual. Atmos. Health 2023, 16, 1501–1527. [Google Scholar] [CrossRef]
- Fernández-Espinosa, A.J.; Montiel-de La Cruz, J.M.; Fernández-Cañero, R.; Pérez-Urrestarazu, L.; Rossini-Oliva, S. Volatile Organic Compounds, SO2 and NO2 Capture by Means of an Indoor Active Living Wall. Atmos. Environ. 2026, 371, 121856. [Google Scholar] [CrossRef]
- Harzanti, T.S.; Purwanti, I.F. Green Solutions: The Role of Spider Plant (Chlorophytum comosum) and Peace Lilies (Spathiphyllum wallisii) in Mitigating Indoor Formaldehyde. BIO Web Conf. 2025, 157, 05002. [Google Scholar] [CrossRef]
- Kim, K.J.; Khalekuzzaman, M.; Suh, J.N.; Kim, H.J.; Shagol, C.; Kim, H.H.; Kim, J.H. Phytoremediation of Volatile Organic Compounds by Indoor Plants: A Review. Hortic. Environ. Biotechnol. 2018, 59, 143–157. [Google Scholar] [CrossRef]
- Zhang, W.; Zhang, Z.; Meng, H.; Zhang, T. How Does Leaf Surface Micromorphology of Different Trees Impact Their Ability to Capture Particulate Matter? Forests 2018, 9, 681. [Google Scholar] [CrossRef]
- Chen, D.; Yan, J.; Sun, N.; Sun, W.; Zhang, W.; Long, Y.; Yin, S. Selective Capture of PM2.5 by Urban Trees: The Role of Leaf Wax Composition and Physiological Traits in Air Quality Enhancement. J. Hazard. Mater. 2024, 478, 135428. [Google Scholar] [CrossRef]
- Perini, K.; Ottelé, M.; Giulini, S.; Magliocco, A.; Roccotiello, E. Quantification of Dust Reduction via Vertical Greenery Systems (VGS). Ecol. Eng. 2017, 106, 95–114. [Google Scholar] [CrossRef]
- Katoch, A.; Kulshrestha, U.C. Assessment of Indoor Air Pollution through Fine Particle Capturing Potential and Accumulation on Plant Foliage in Delhi, India. Aerosol Air Qual. Res. 2022, 22, 220014. [Google Scholar] [CrossRef]
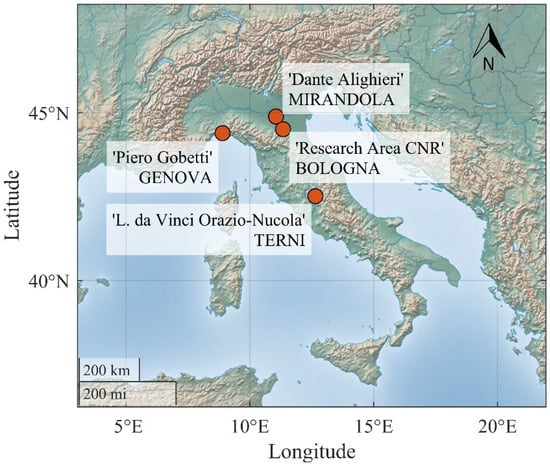
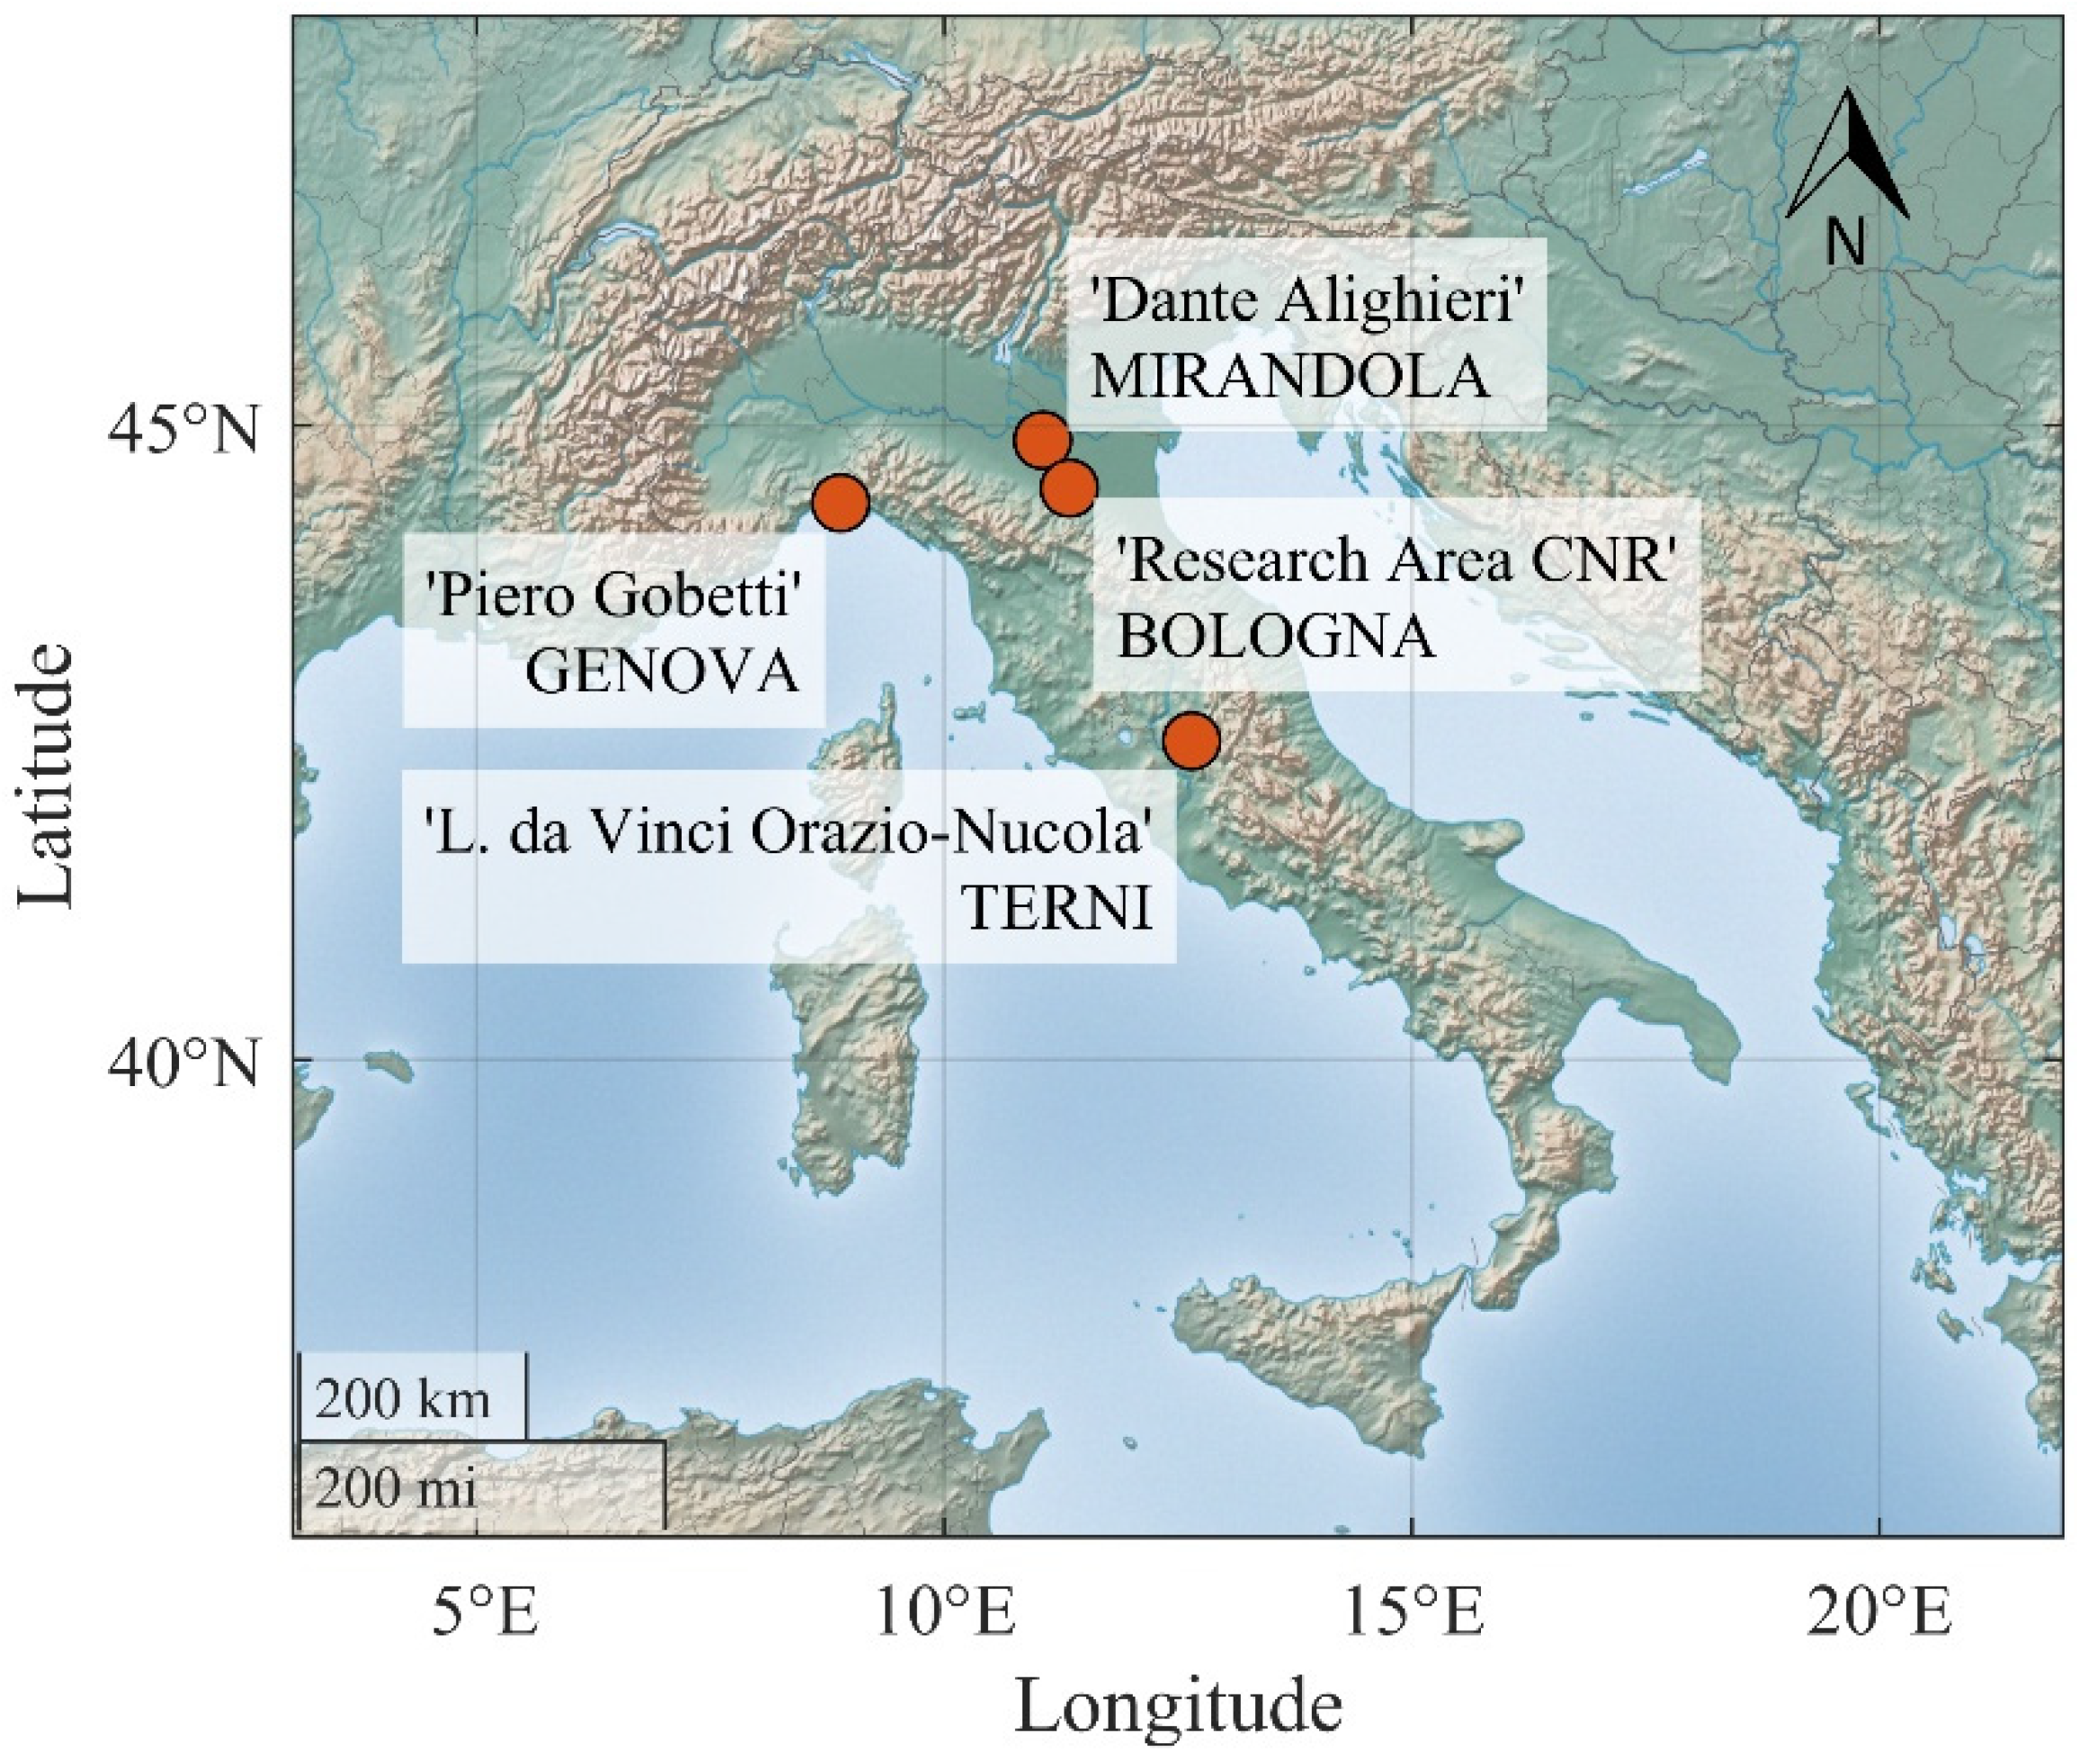
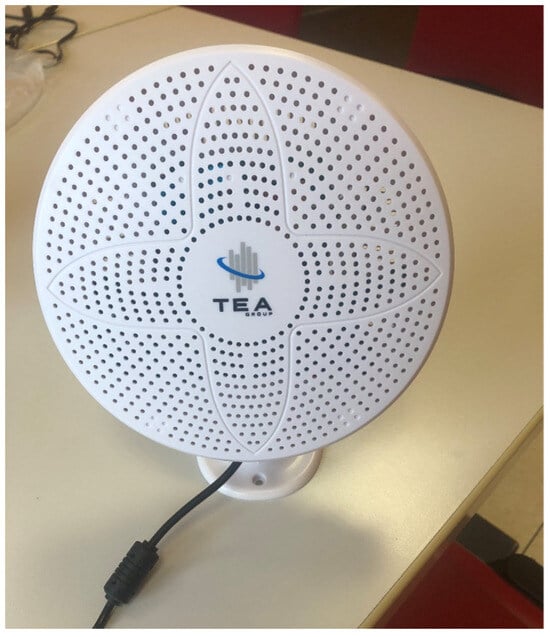
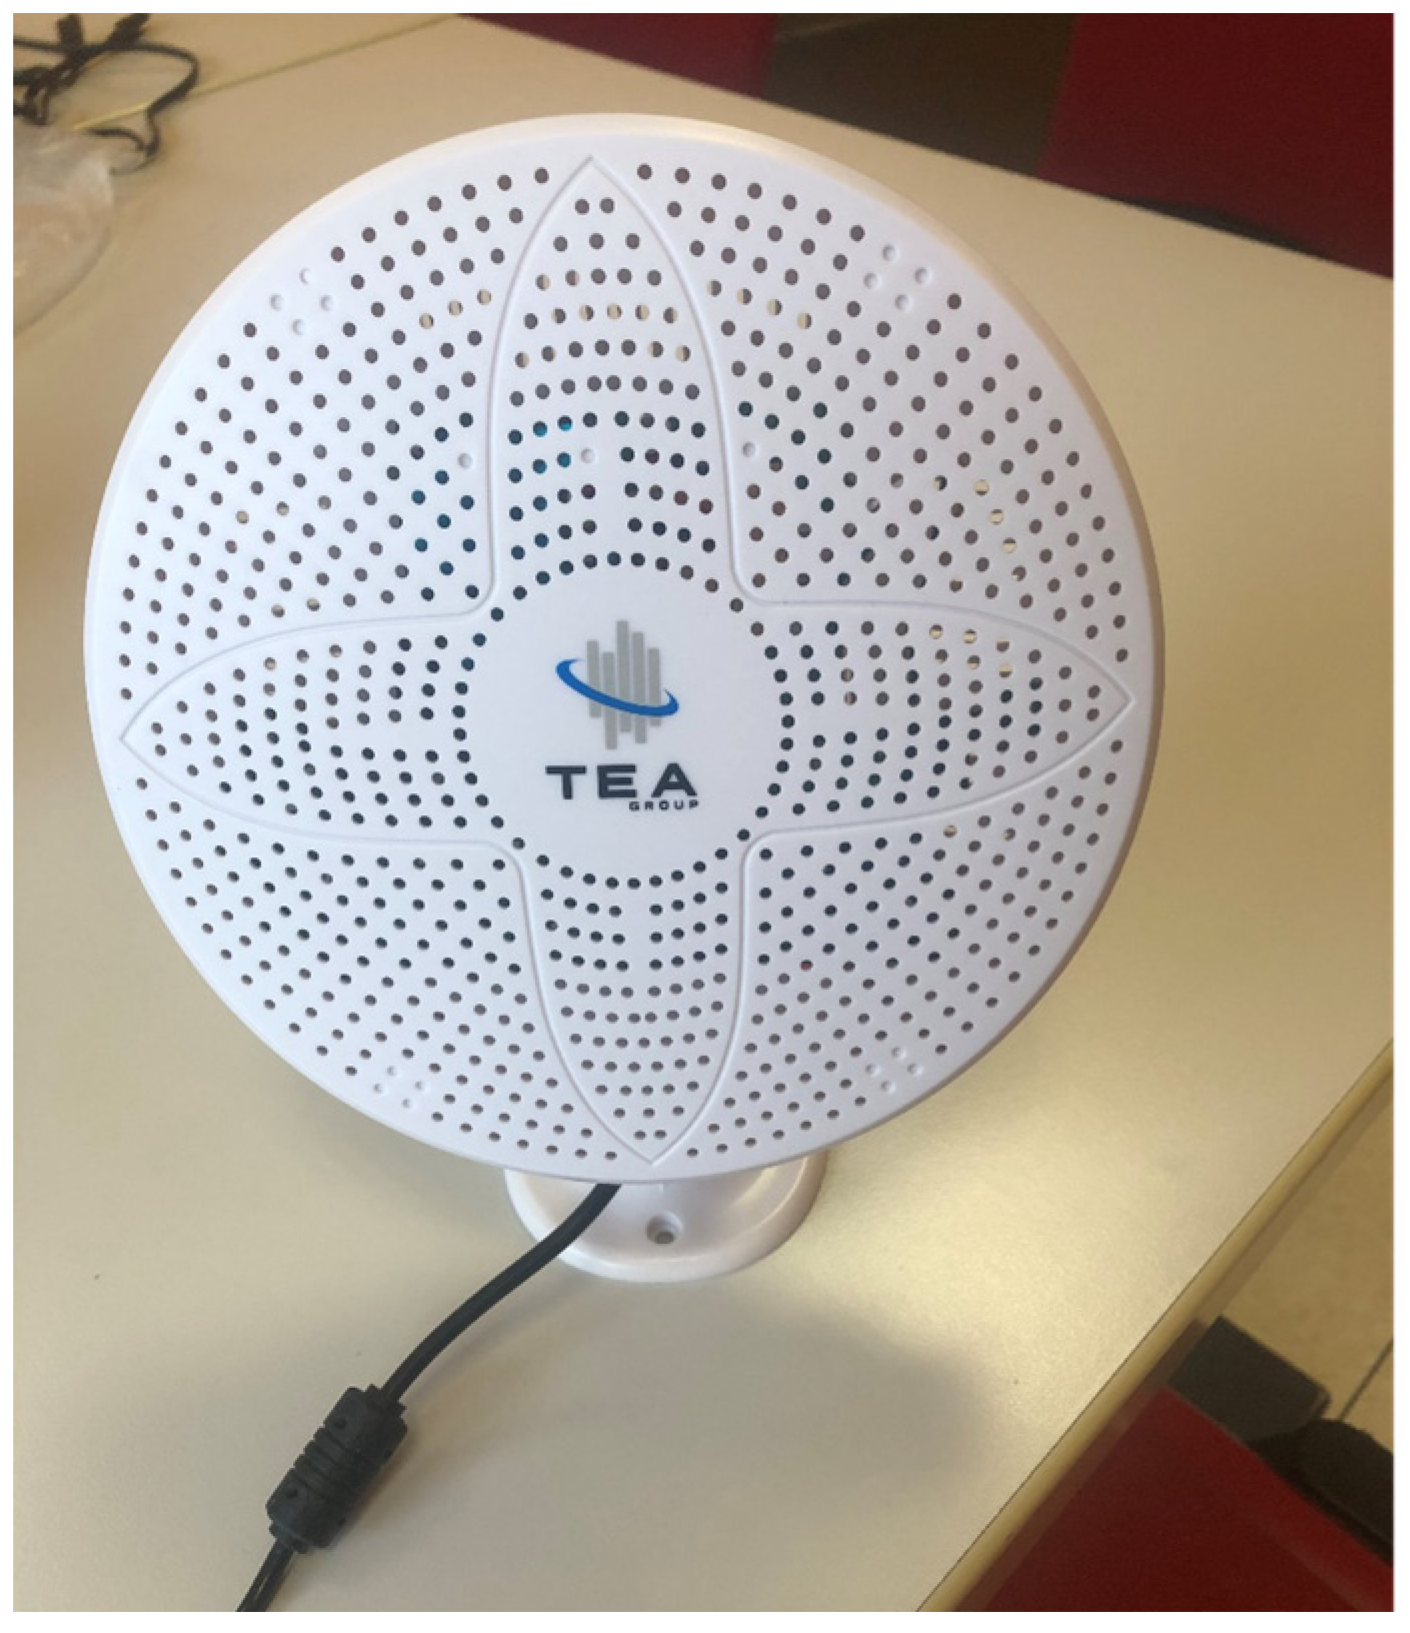
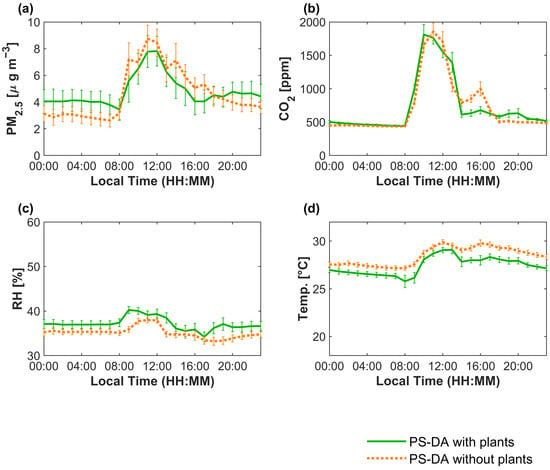
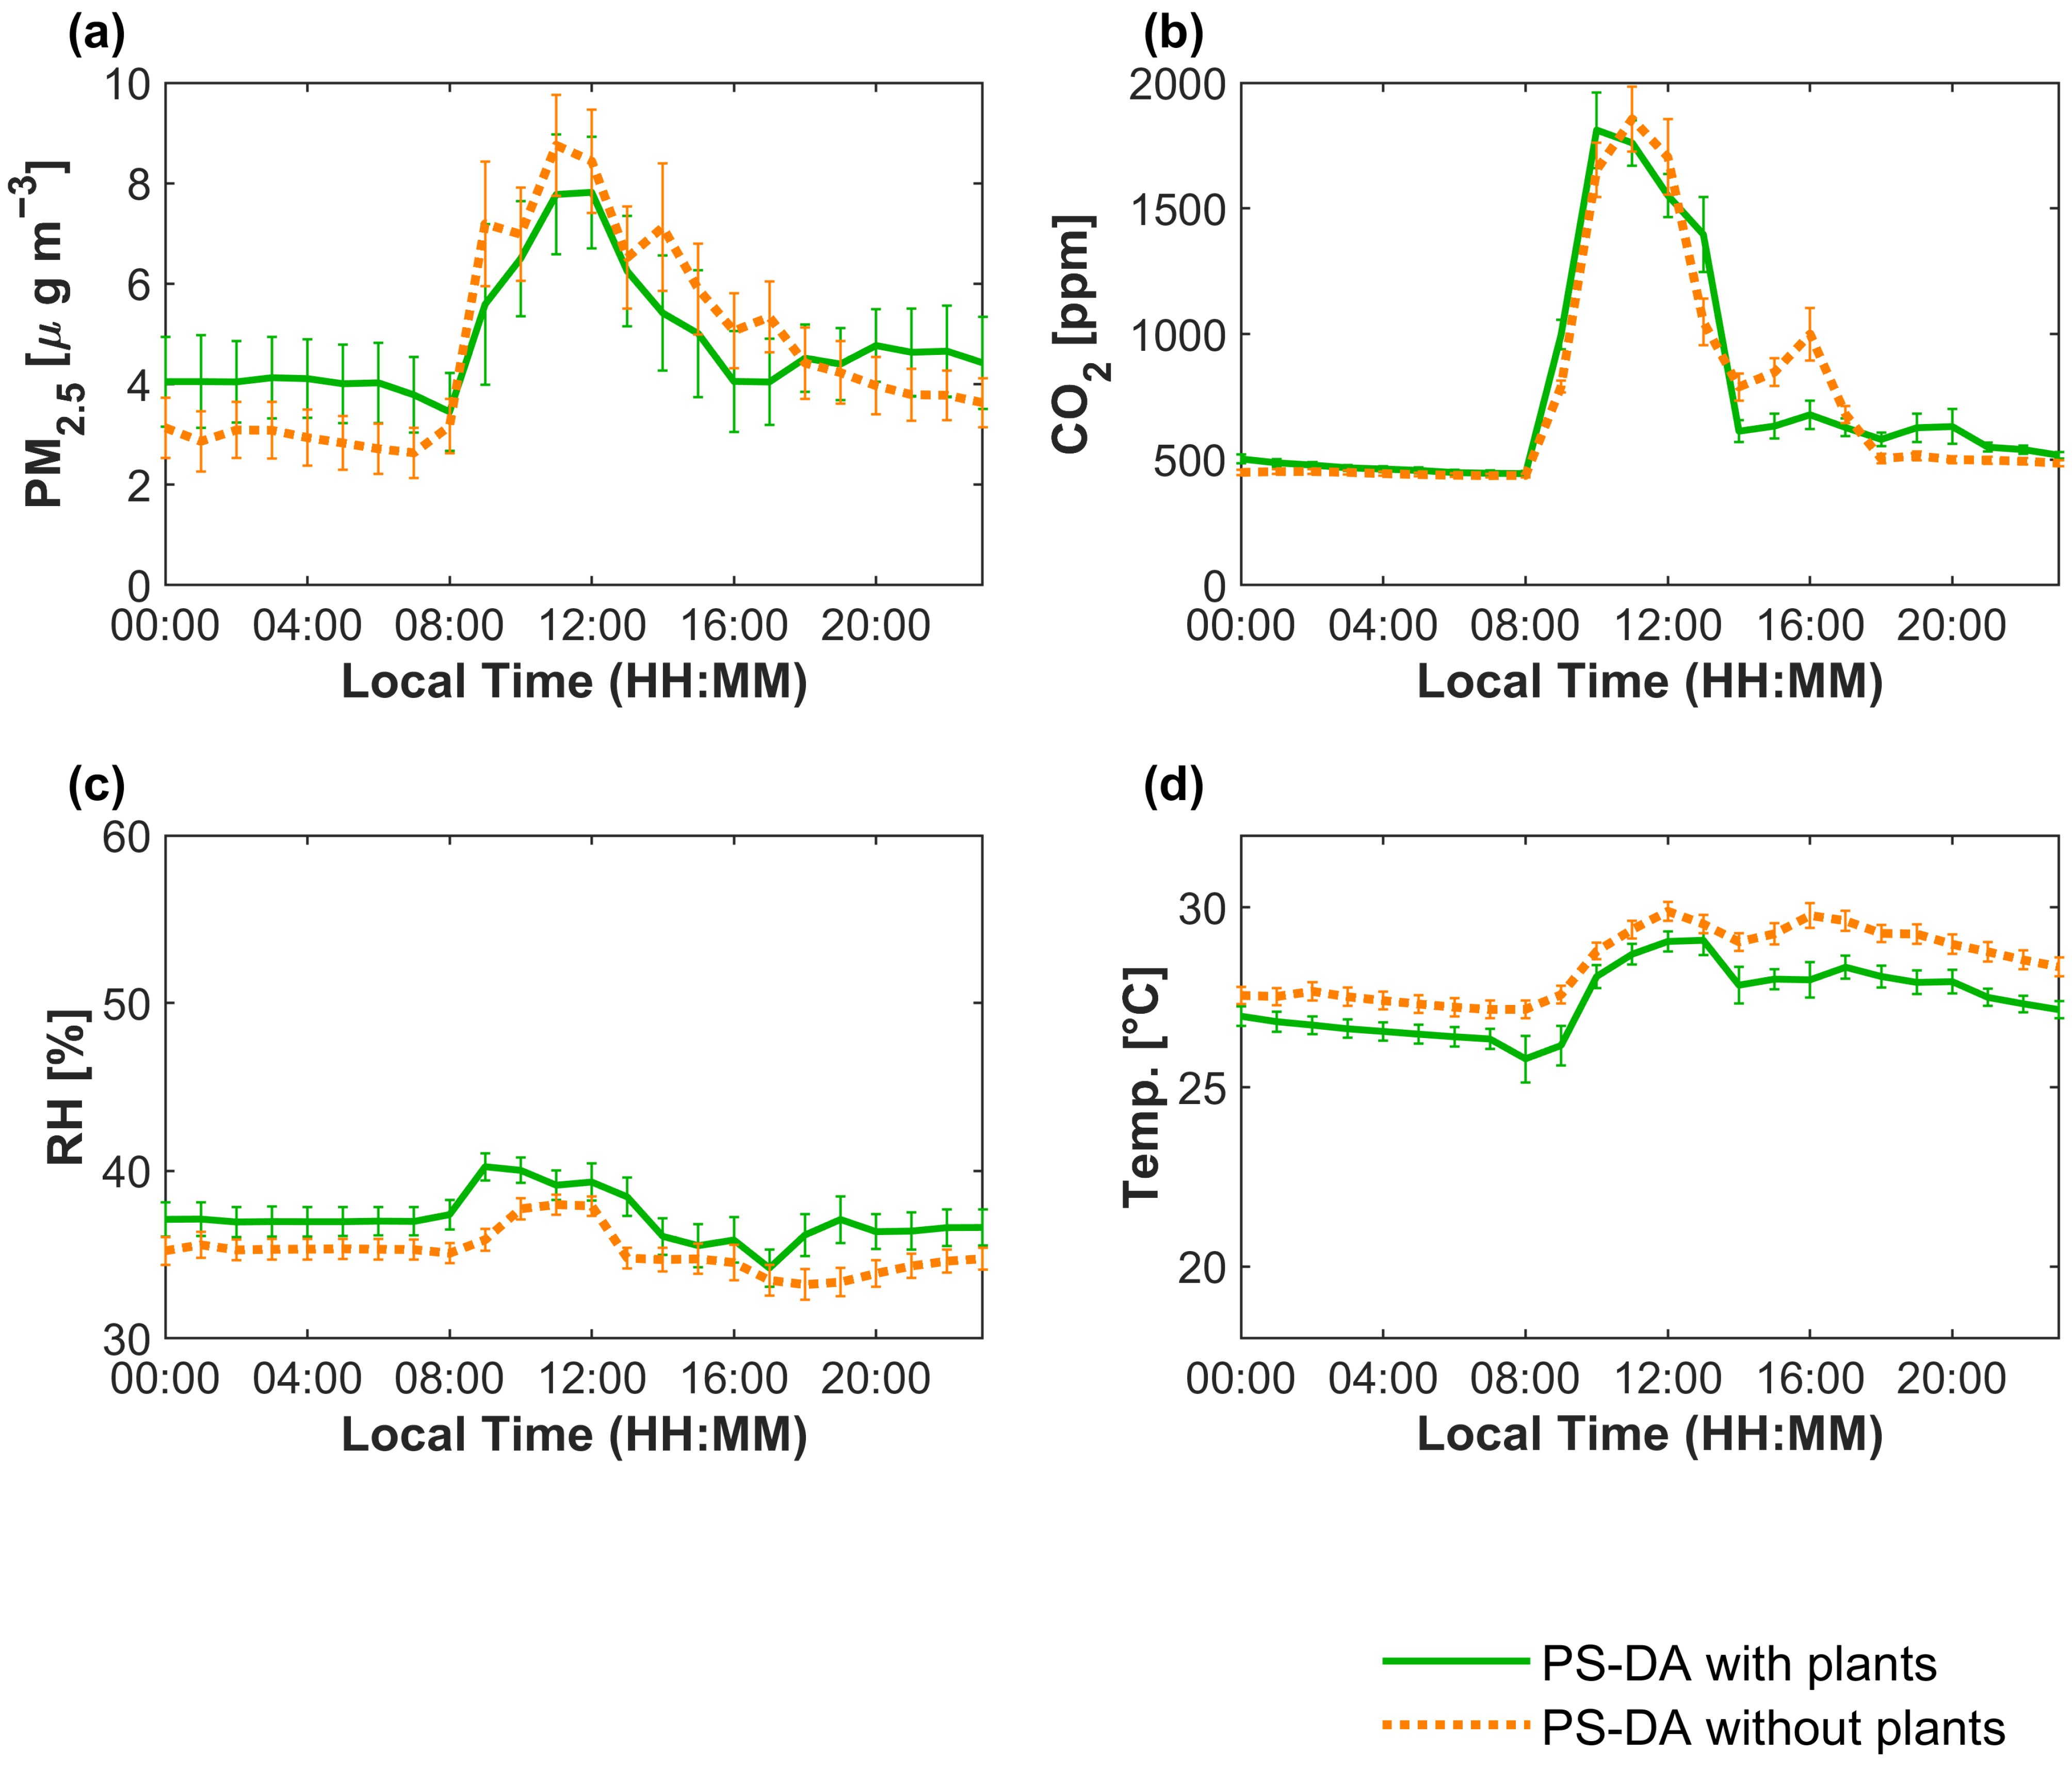
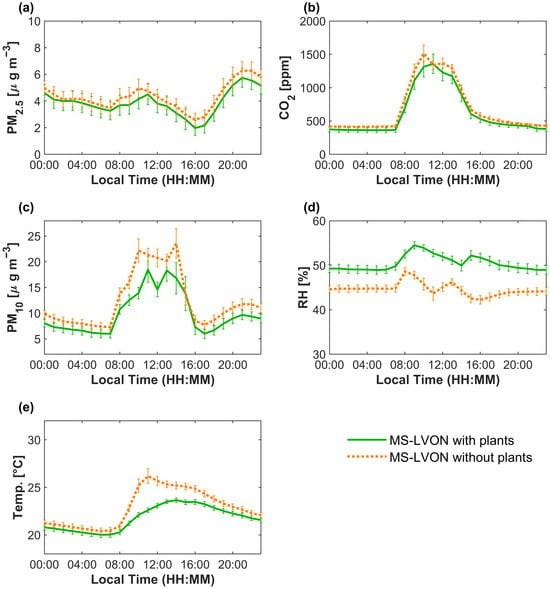
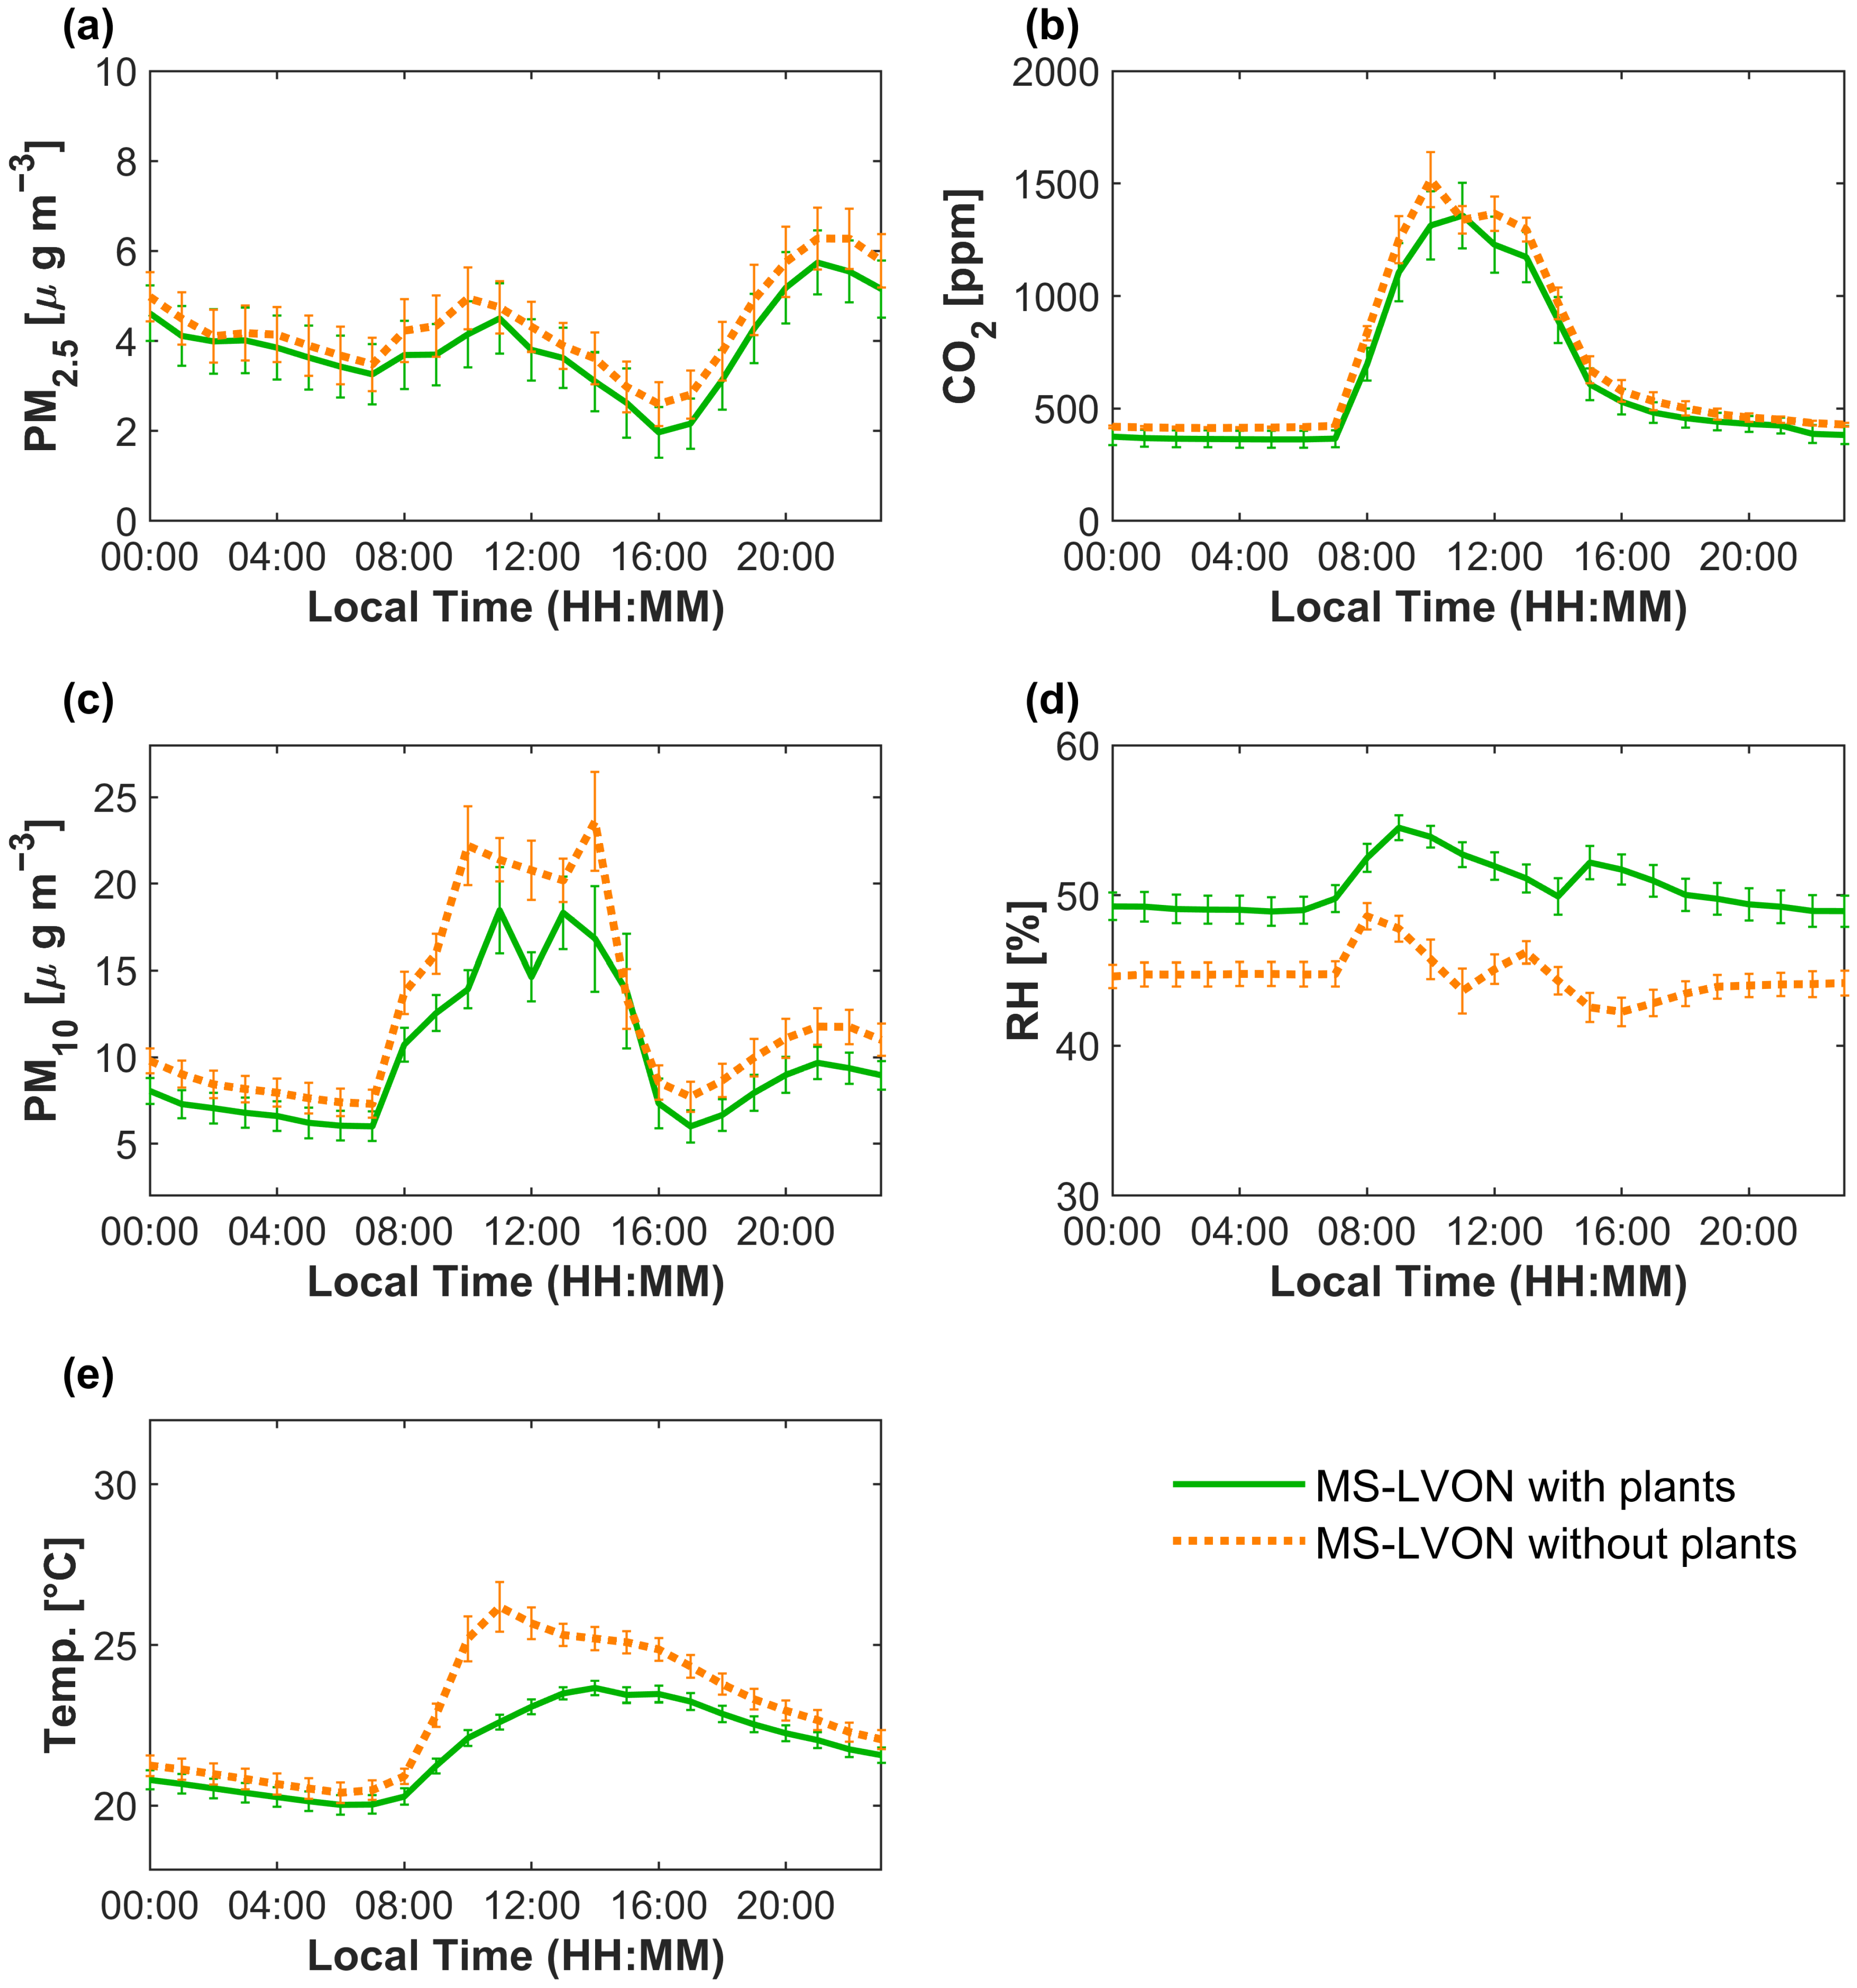
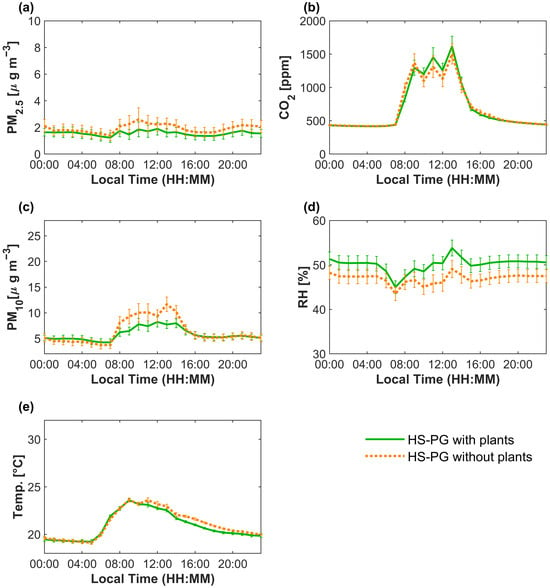
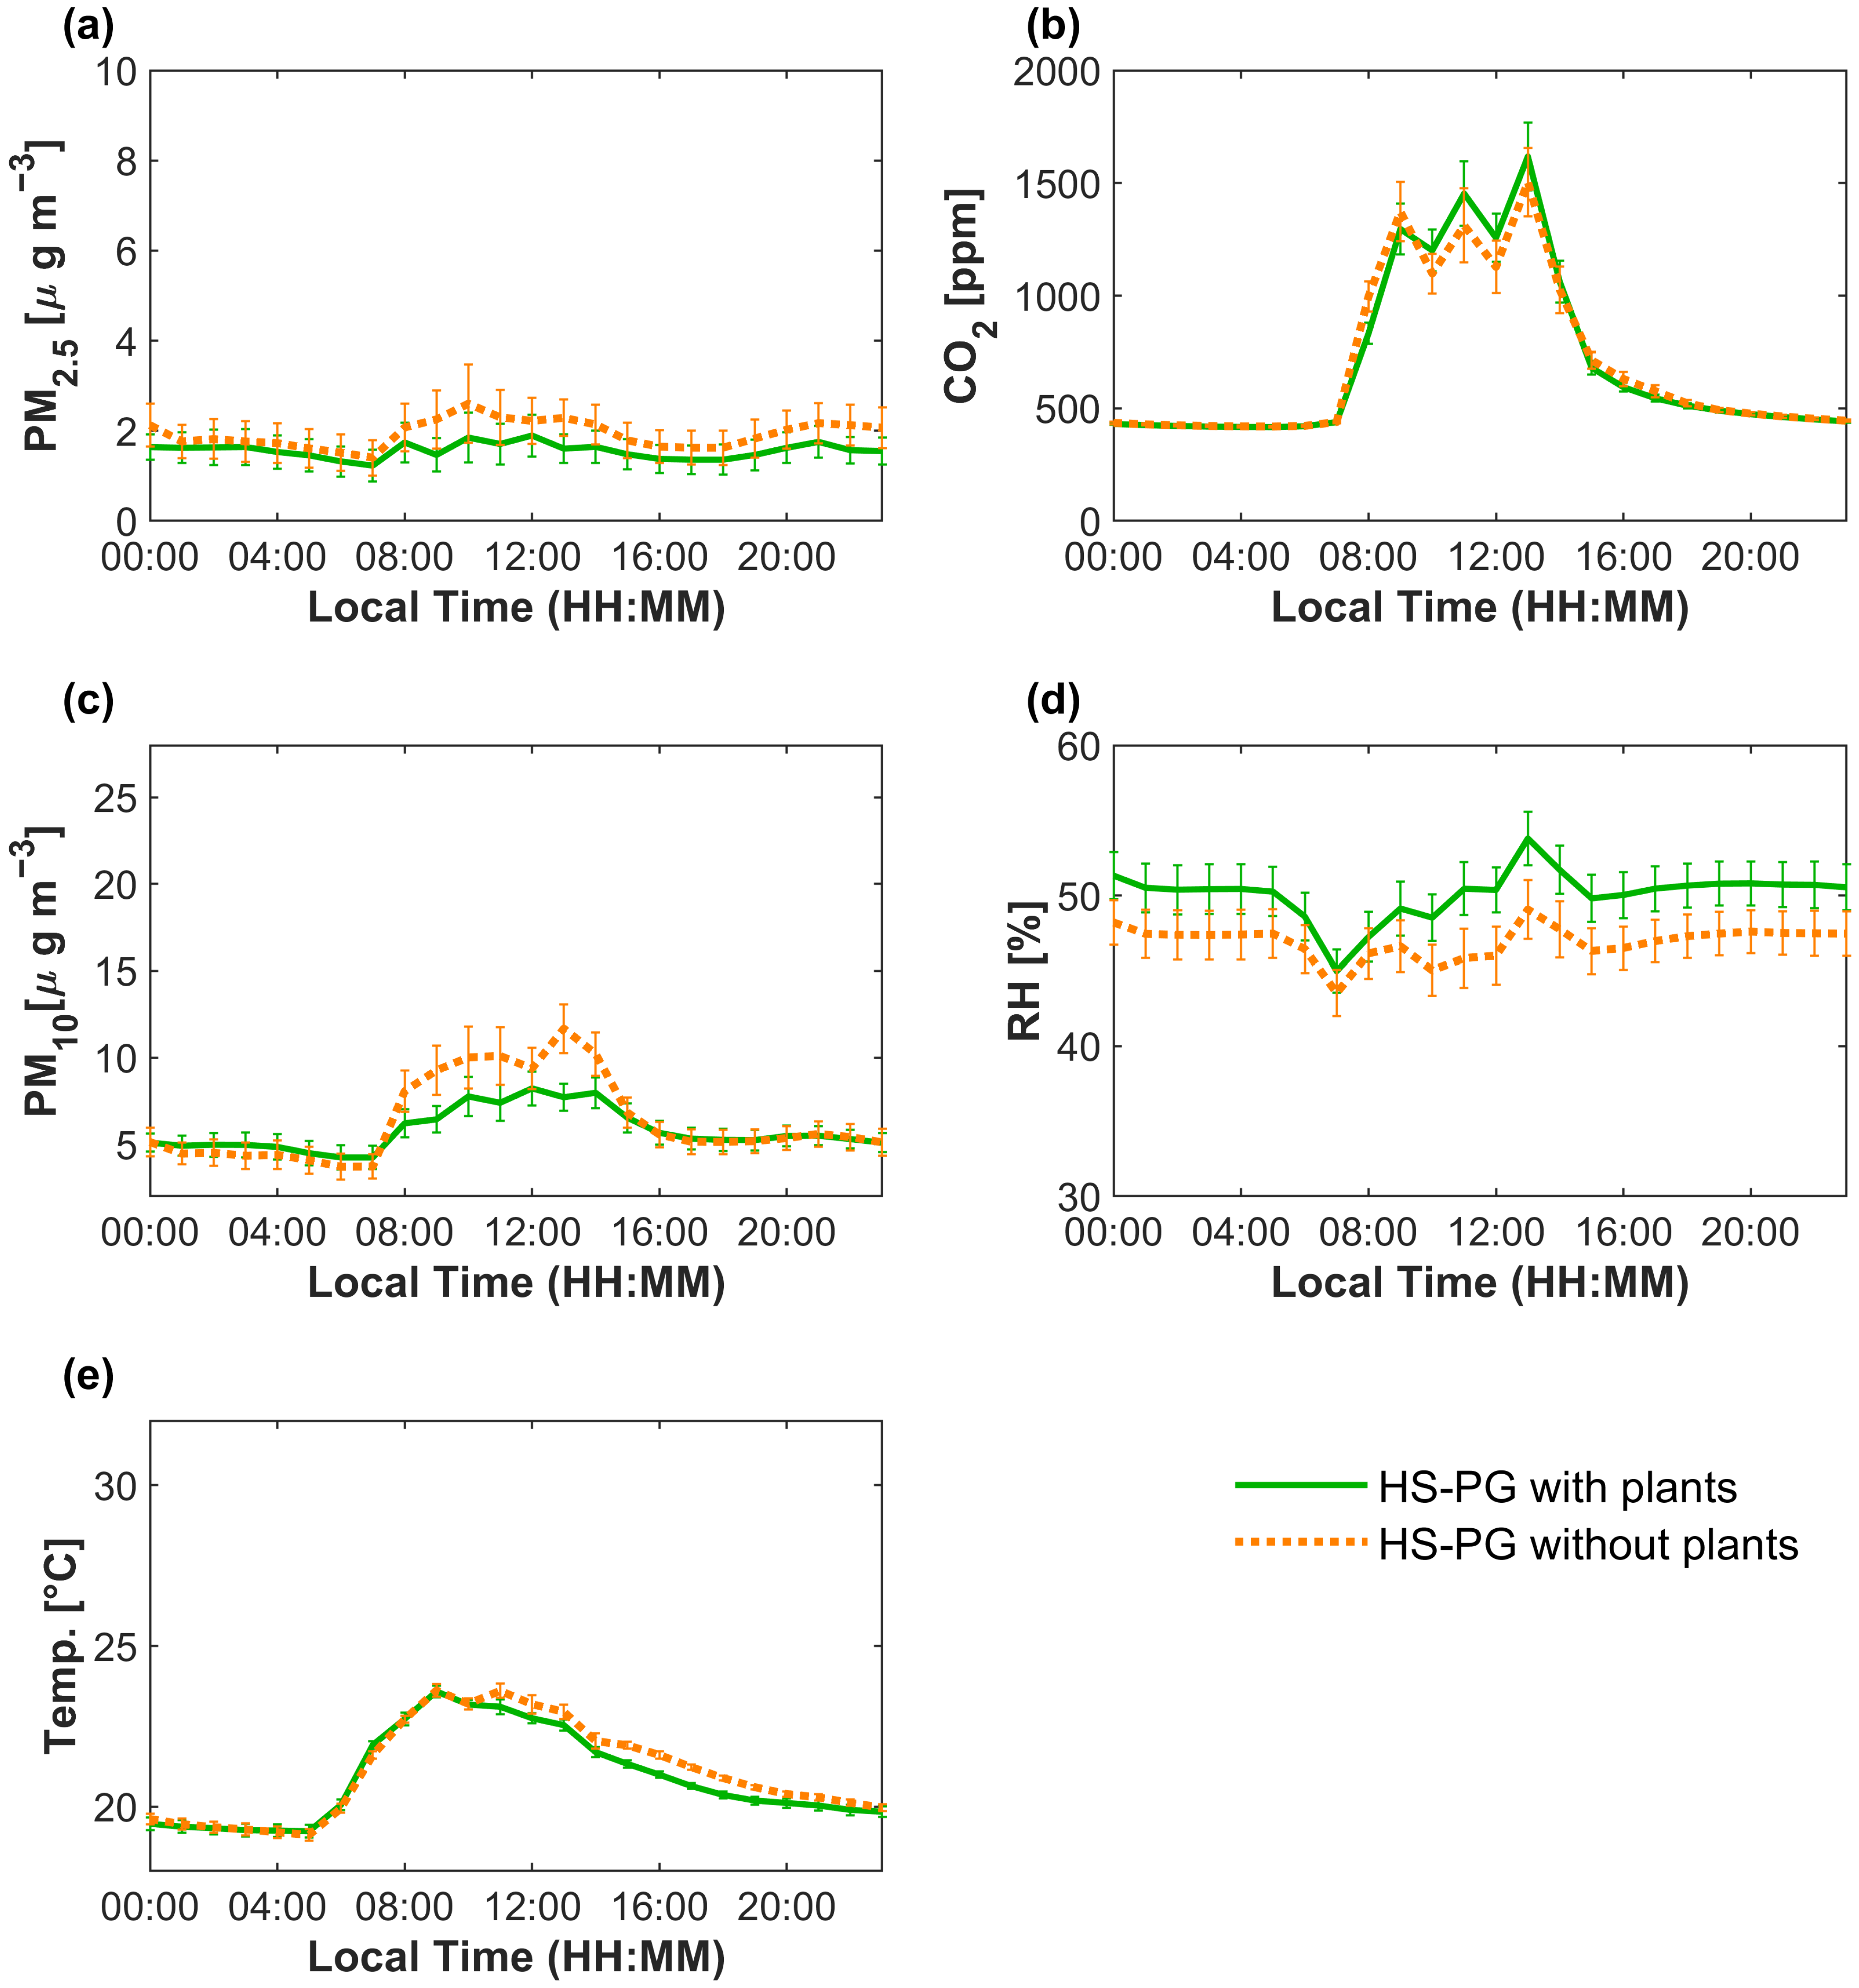
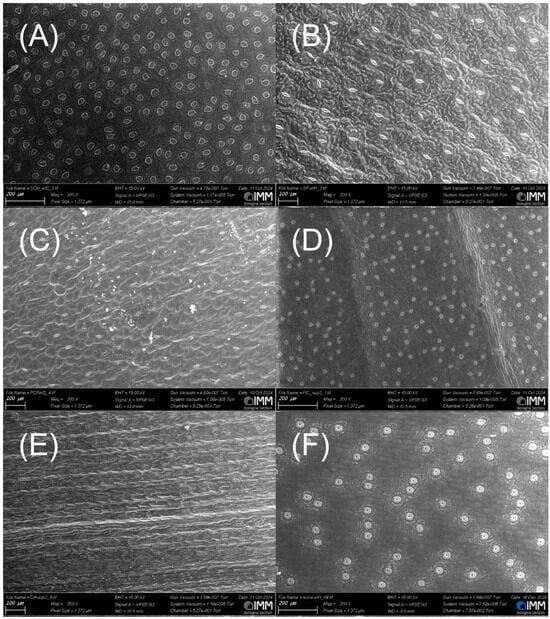
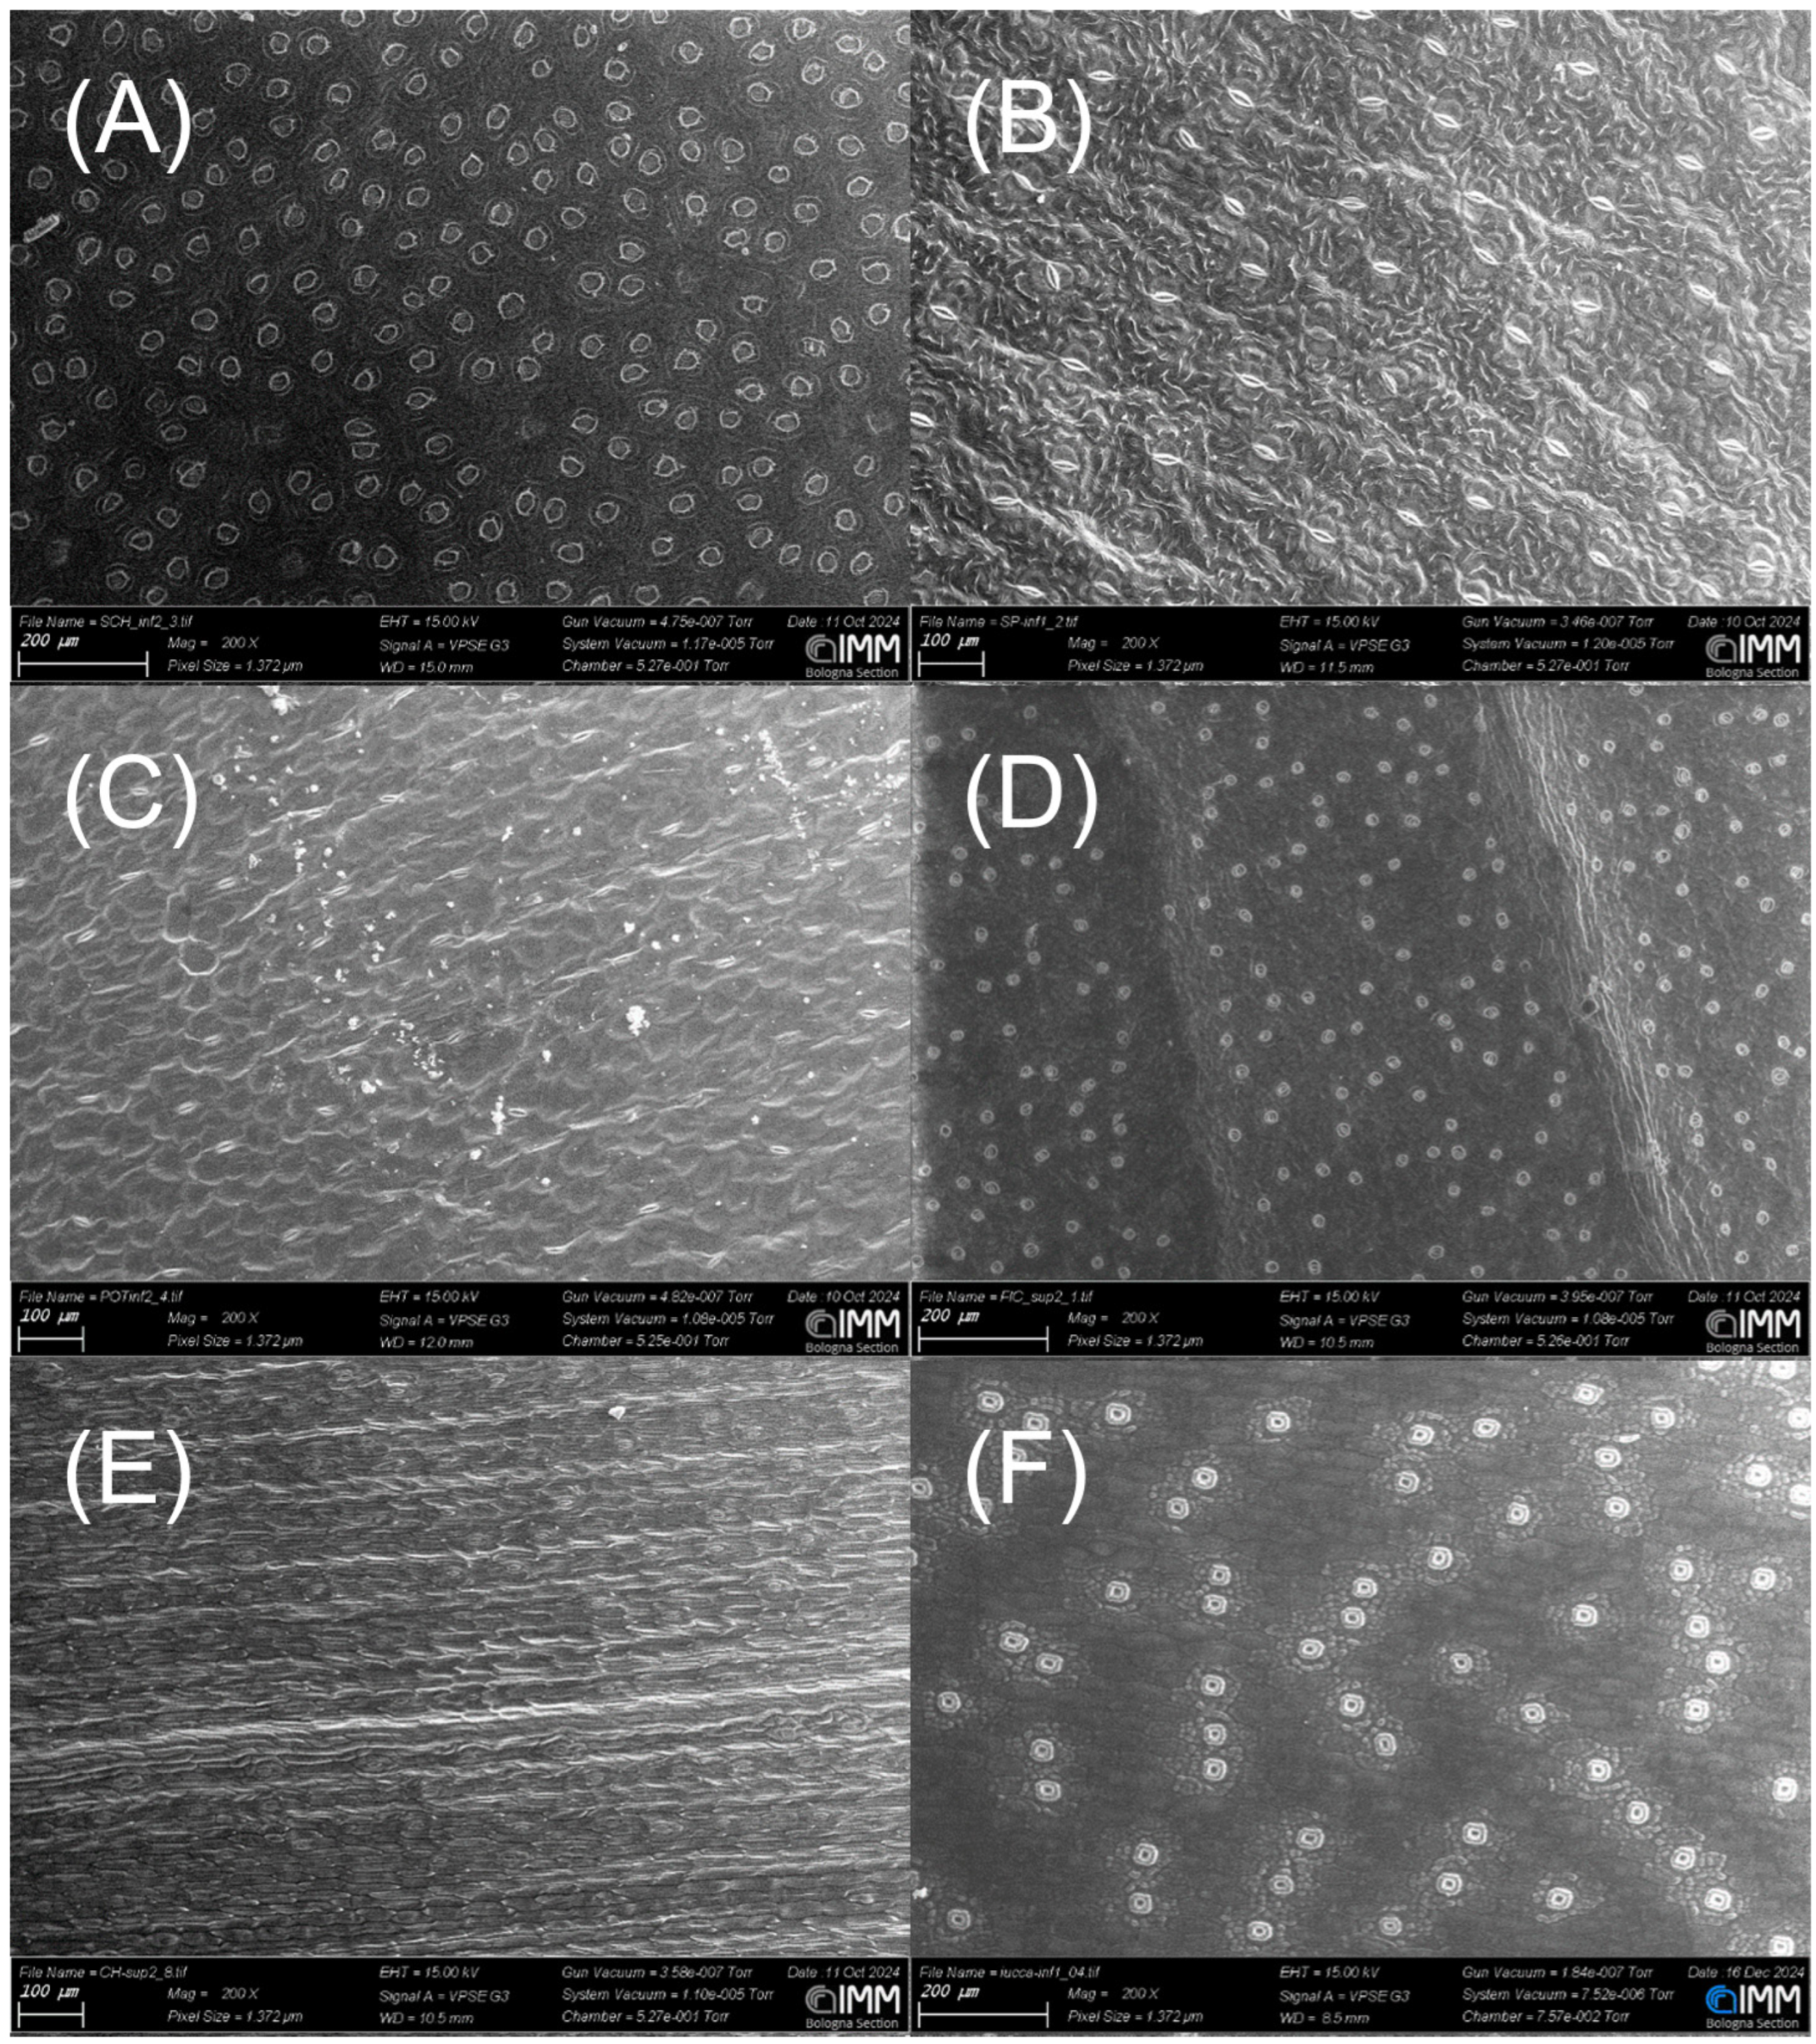

Disclaimer/Publisher’s Note: The statements, opinions and data contained in all publications are solely those of the individual author(s) and contributor(s) and not of MDPI and/or the editor(s). MDPI and/or the editor(s) disclaim responsibility for any injury to people or property resulting from any ideas, methods, instructions or products referred to in the content. |
© 2026 by the authors. Licensee MDPI, Basel, Switzerland. This article is an open access article distributed under the terms and conditions of the Creative Commons Attribution (CC BY) license.