


Abstract
This study examined the chemical composition and quantitative source contributions of coarse (PM10–2.5) and fine (PM2.5) particles in ship-based PM10 and PM2.5 filter samples from 2020 to 2024 across the Yellow Sea. The observations were primarily conducted during the spring season, when the influence of continental air masses from East Asia is pronounced, and detailed analyses of water-soluble ions and elemental species were performed. In coarse particles, sea salt components (e.g., Na+ and Cl−) and soil-derived species (e.g., nss-Ca2+ and CO32−) were predominant, whereas fine particles were dominated by secondary inorganic species such as nss-SO42−, NO3−, and NH4+. Source contributions were estimated using Dispersion Normalized Positive Matrix Factorization (DN-PMF), and eight common factors were identified, including sea salt, soil, secondary nitrate, secondary sulfate, oil combustion, biomass burning, marine biogenic emissions, and plant growth. Additionally, an industry factor was uniquely resolved in coarse particles, whereas a mobile source factor was identified in fine particles. In coarse particles, sea salt (30.9%) and soil (15.1%) were the major contributing sources, whereas fine particles were dominated by secondary nitrate (48.6%) and secondary sulfate (15.6%). Potential Source Contribution Function (PSCF) analysis indicated that the sea salt and oil combustion factors in coarse particles were associated with coastal regions of the Yellow Sea and the East China Sea, while the soil factor corresponded spatially with inland regions of northern China. In contrast, the secondary nitrate, secondary sulfate, and biomass burning factors in fine particles showed strong associations with inland regions of eastern China. Using size-resolved DN-PMF and five years of repeated observations over the same marine region, this study provides the first quantitative source apportionment analysis of interannual atmospheric composition variability and long-range transport affecting air quality over the Yellow Sea.
1. Introduction
Particulate matter (PM) in the atmosphere consists of a wide range of chemical species, including mineral dust, sea salt, organic and inorganic compounds, metals, and metalloids. These particles originate not only from natural and anthropogenic emission sources but also from secondary formation processes driven by atmospheric photochemical and chemical reactions [1,2]. Due to these complex sources and atmospheric chemical processes, the composition and concentration of PM exhibit substantial temporal and spatial variability. Among atmospheric aerosols, coarse particles (PM10–2.5; 2.5–10 μm) are generally distinguished from fine particles (PM2.5; <2.5 μm), which have longer atmospheric residence times and can be transported over long distances, and are primarily associated with primary emission sources such as soil dust, sea salt, and mechanically resuspended particles [3,4]. Coarse particles are especially helpful for tracing the spatial signatures of natural sources and localized emission processes because they have comparatively shorter atmospheric residence times and are heavily impacted by episodic events and local sources [5]. In marine and coastal environments, coarse particles are often influenced by sea salt, soil-derived particles, and shipping activities, resulting in pronounced contributions of coarse particle components [6,7]. Therefore, to comprehensively understand the characteristics of aerosol sources in marine atmospheric environments, it is necessary to conduct analysis by particle size, including not only PM2.5 but also PM10–2.5.
In the 2020s, high concentrations of PM2.5 haze cases were repeatedly observed in eastern China and adjacent seas, indicating that atmospheric chemical transformations during long-range transport continue to play an important role [8,9]. In particular, quantitative source apportionment of marine aerosols is essential for understanding marine ecosystem processes and elemental cycles of iron (Fe), sulfur (S), and nitrogen (N) [10]. Various studies have been conducted in the waters surrounding East Asia to identify the sources of marine aerosols [11]. It has been reported that various factors, including a mixture of marine, soil, and anthropogenic emission sources, influence marine aerosols in different sea areas such as the Eastern Mediterranean, the East China Sea, and the western Pacific [6,7,12]. However, many of these studies have relied on qualitative receptor modeling approaches such as Principal Component Analysis (PCA) and Factor Analysis (FA) [13], and quantitative source contribution analyses that explicitly account for regional marine characteristics remain limited. Positive Matrix Factorization (PMF) has been widely used as a receptor model to identify aerosol emission sources; however, measured PM concentrations are strongly influenced not only by emission intensity but also by meteorological conditions such as mixing height and wind speed. To address this limitation, Dispersion Normalized PMF (DN-PMF), which incorporates the ventilation coefficient (VC) to remove meteorological dilution effects, has been proposed [14,15], and recent studies have demonstrated that DN-PMF can more clearly resolve emission signals and improve temporal variability representation [16].
The Yellow Sea, the primary study region of this work, is a semi-enclosed marginal sea with limited riverine input, where atmospheric deposition serves as a major source of trace elements. In addition, this region lies along a major long-range transport pathway connecting inland China, the Shandong Peninsula, and the Korean Peninsula, resulting in extensive transport of pollutants and natural particles from continental regions over the Yellow Sea [17,18]. Despite its importance, long-term studies analyzing the chemical composition and size-resolved quantitative source contributions of aerosols over the Yellow Sea using a consistent observational platform remain scarce. Since 2018, the National Institute of Meteorological Sciences (NIMS) has conducted the Yellow Sea Air Quality (YES-AQ) campaign every spring over the Yellow Sea, with the aim of filling observational gaps and comprehensively characterizing the physical, optical, and chemical properties of long-range transported aerosols in East Asia [19].
In this study, PM10 and PM2.5 samples collected aboard the meteorological research vessel Gisang-1 during the YES-AQ campaign over the Yellow Sea during the spring seasons of 2020–2024 were utilized. Based on these samples, the concentration characteristics of ionic and elemental species were analyzed for PM10–2.5 and PM2.5, and source contributions were quantified using PMF and DN-PMF. In addition, backward trajectory analysis using the Hybrid Single-Particle Lagrangian Integrated Trajectory (HYSPLIT) model together with the Potential Source Contribution Function (PSCF) approach was employed to identify major air-mass transport pathways and potential source regions influencing aerosols over the Yellow Sea.
2. Materials and Methods
2.1. Sampling Procedure and Chemical Analysis
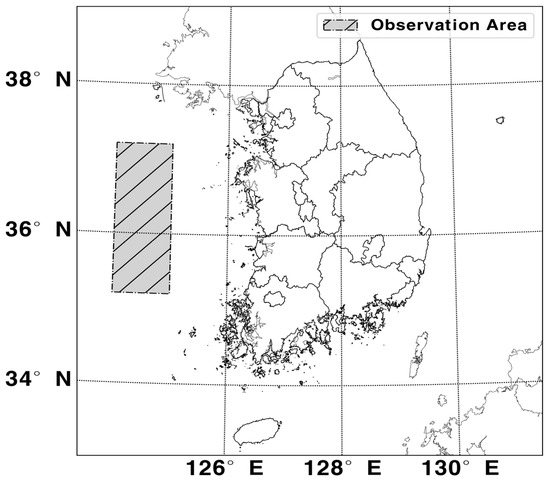
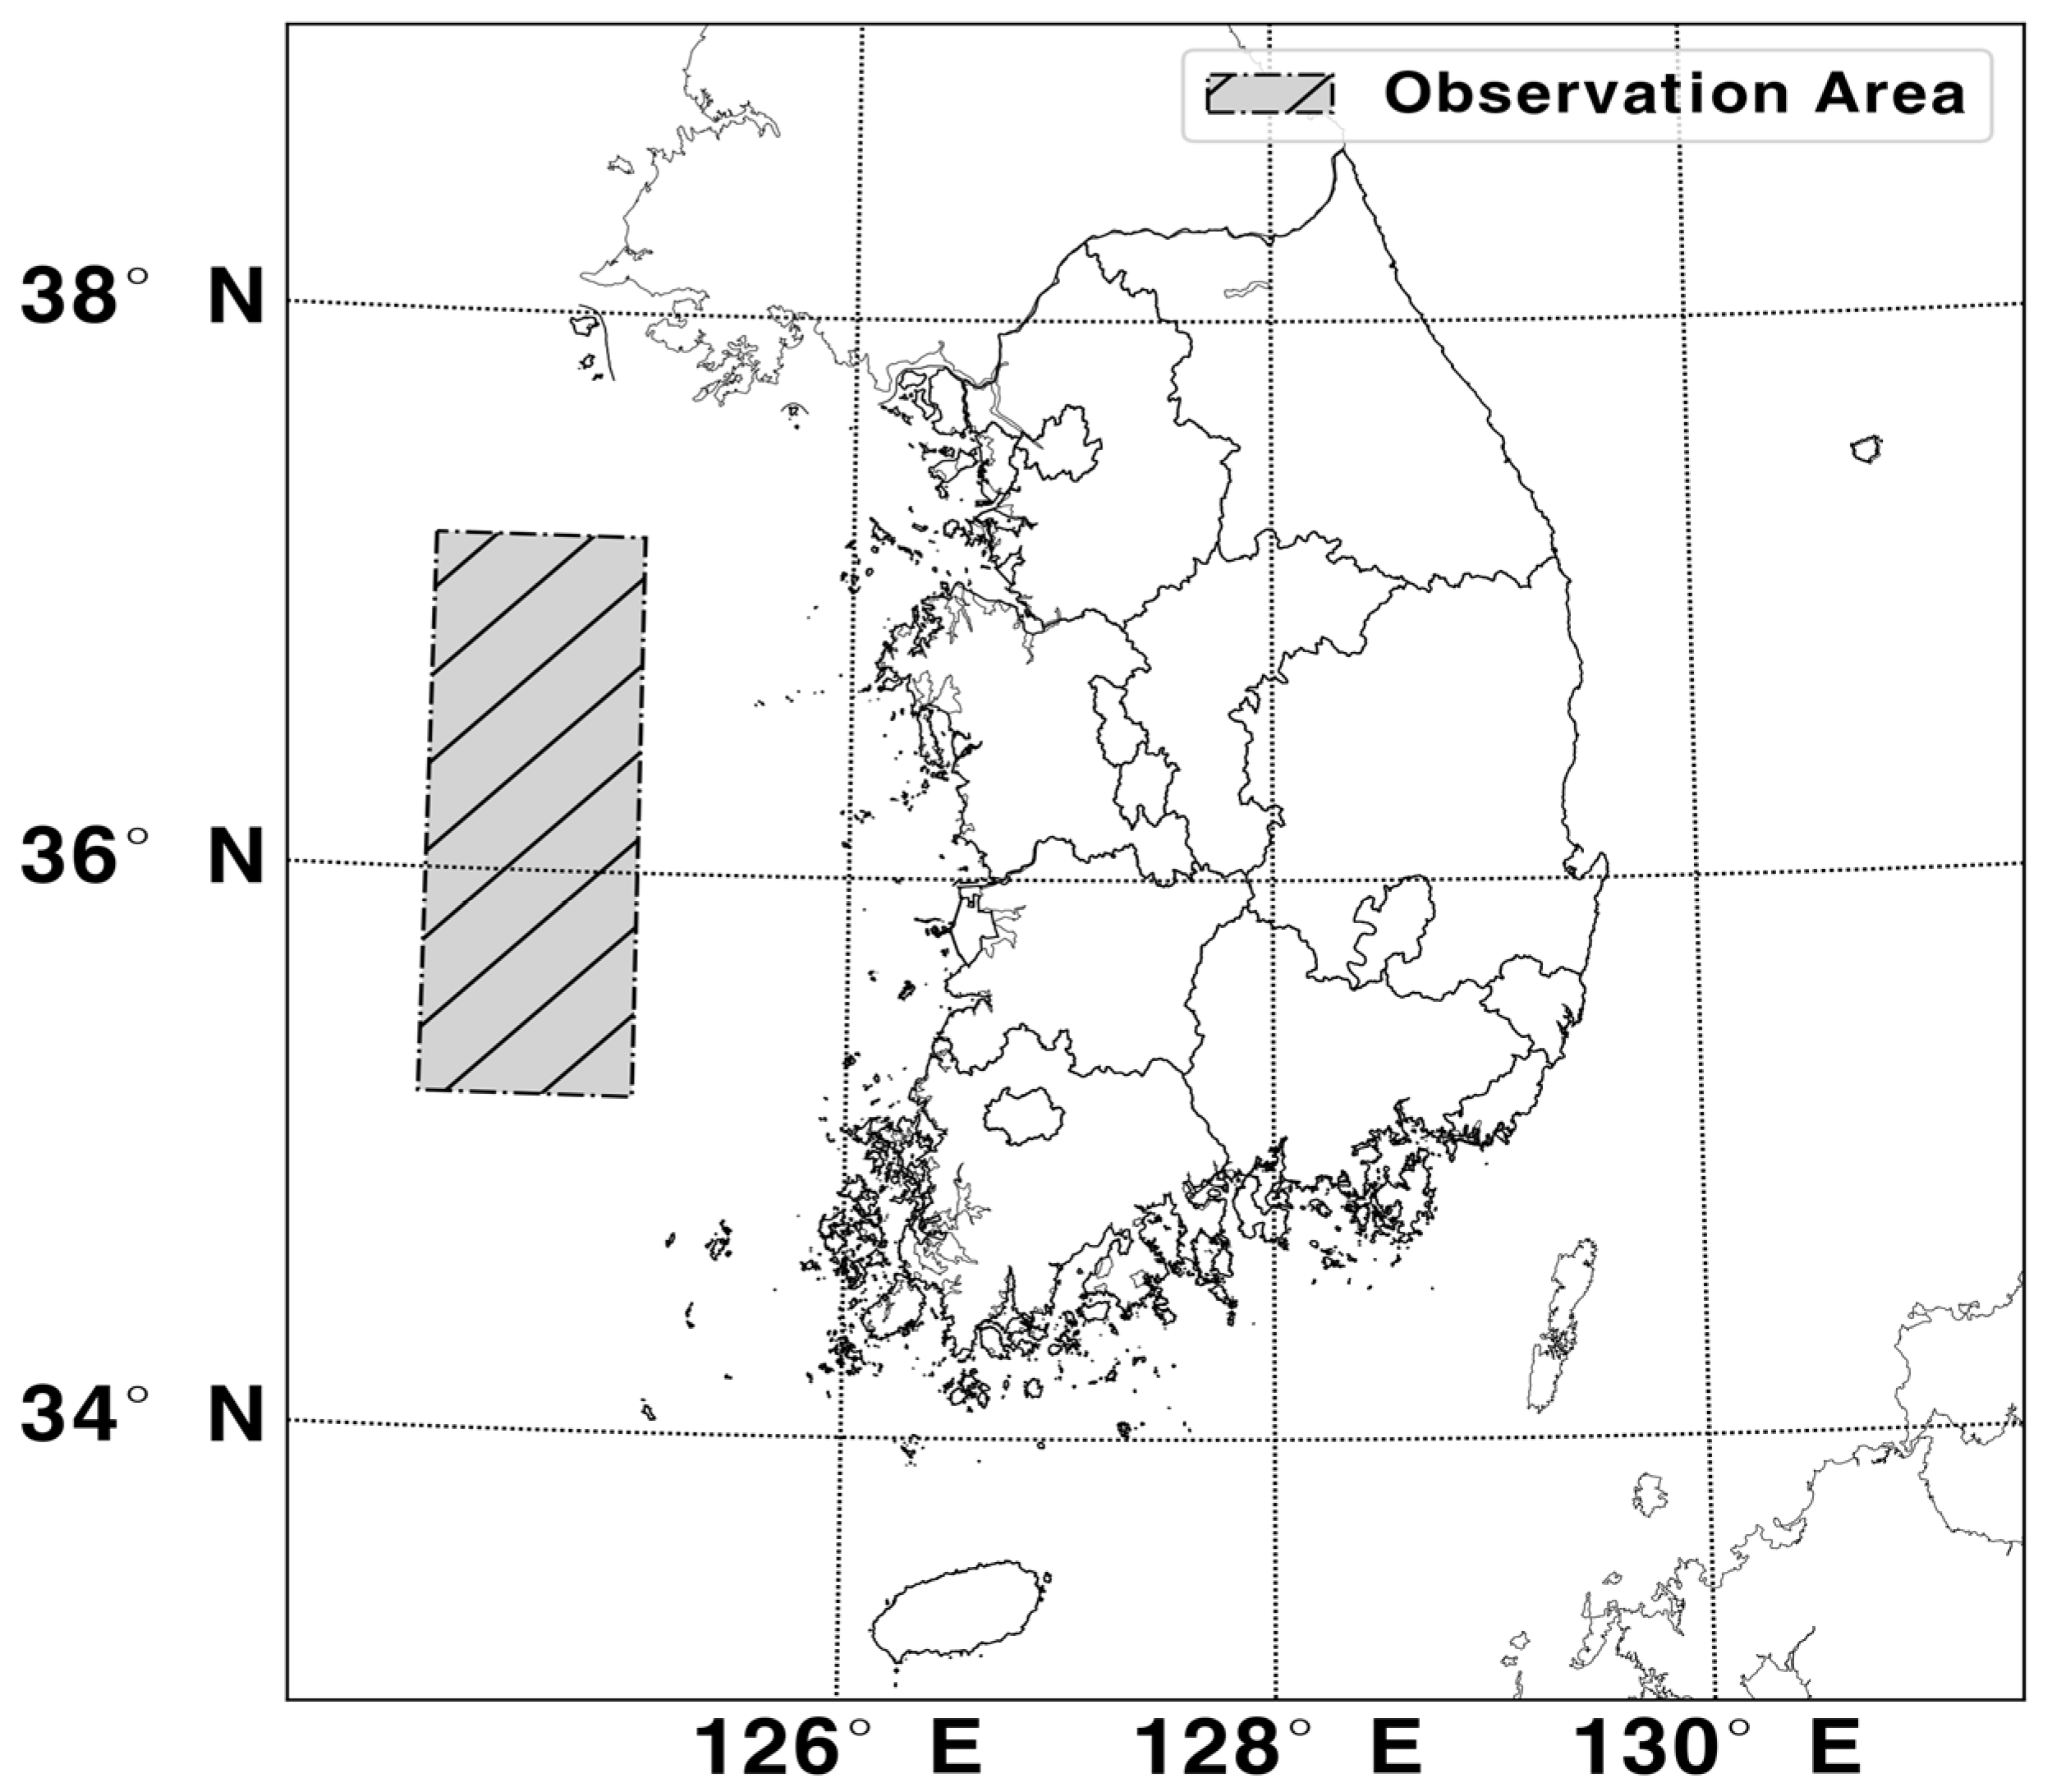
In this study, PM10 and PM2.5 samples were collected over the Yellow Sea (124° E, 35–37° N) using the meteorological research vessel Gisang-1 (Figure 1). Sampling was conducted during the spring seasons from 2020 to 2024, with the sampling periods as follows: 20 March–4 June 2020, 23 March–29 April 2021, 22 March–28 April 2022, 30 March–3 May 2023, and 16 February–17 March 2024. Samples were collected twice daily, separated into daytime (08:30–16:30) and nighttime (18:00–07:00) periods. PM10 and PM2.5 samples were collected simultaneously during the same sampling intervals using two low-volume air samplers installed on the exterior deck of the research vessel (PMS-104 and PMS-114, APM Eng., Republic of Korea), and a total of 174 samples were obtained for each size fraction. The sampling flow rate was maintained at 16.7 L min−1 in accordance with the recommendations of WMO/GAW Report No. 227. All samples were collected on Teflon filters, immediately sealed in Petri dishes after sampling, and stored at −20 °C until analysis. PM10–2.5 concentrations and chemical species were calculated by subtracting the corresponding PM2.5 concentrations from the simultaneously collected PM10 concentrations for each sample.
Figure 1.
Sampling site.
For the analysis of water-soluble ions, each filter was first wetted with a small amount of ethanol and then immersed in 20 mL of ultrapure water, followed by ultrasonic extraction (30 min) and mechanical shaking (200 rpm, 1 h). The extract was then filtered using a PVDF syringe filter (Whatman, 13 mm, pore size 0.45 µm, Marlborough, MA, USA), and analyzed using ion chromatography (Metrohm Modula IC, model 881, Herisau, Switzerland) for NH4+, Na+, K+, Ca2+, Mg2+, SO42−, NO3−, Cl−, F−, HCOO−, CH3COO−, CH3SO3− and C2O42− [20]. The instrumental detection limits (IDL) ranged from 0.1 to 9.7 μg L−1, and the coefficients of variation (CV) ranged from 0.3% to 3.4%. Trace element analysis was conducted following the Korean standard methods for air pollution analysis and the US EPA IO-3 method. The filters were subjected to microwave-assisted acid digestion, followed by analysis using ICP-MS (PerkinElmer ELAN DRC-e, Waltham, MA, USA) and ICP-OES (OPTIMA 7300DV, Waltham, MA, USA). A total of 20 elements were analyzed, including Al, Ba, Ca, Cd, Co, Cr, Cu, Fe, K, Mg, Mn, Mo, Na, Ni, Pb, S, Sr, Ti, V, and Zn, with IDL ranging from 0.6 to 147.7 ng L−1, and CV ranging from 0.7% to 8.3%.
2.2. Positive Matrix Factorization (PMF) Analysis
In this study, the EPA PMF 5.0 model was applied to identify the major emission sources of aerosols over the Yellow Sea. The PMF model is a receptor modeling technique that decomposes the observed concentration matrix () into the product of a source contribution matrix () and a source profile matrix (), with a residual matrix (), as expressed in the following equation:
where represents the concentration of species measured in sample , represents the contribution of source to sample , represents the source profile of species in source , denotes the residual, and is the number of factors. PMF is solved using a weighted least-squares approach that minimizes the objective function Q based on the measurement uncertainties () of each species. To construct the input dataset, samples with missing or zero concentrations were excluded, and samples with ion balance values outside the range of 0.5–1.5 were removed. Concentrations below the detection limit (BDL) were replaced with MDL/2, with corresponding uncertainties assigned as 5 MDL/6, while missing values were substituted with the geometric mean, and the associated uncertainties were set to four times the geometric mean [21,22]. After these QA/QC procedures, a total of 160 samples were used as the final PMF input dataset.
A total of 22 chemical species were selected as PMF input variables, including water-soluble ions (NH4+, Na+, K+, Ca2+, Mg2+, SO42−, NO3−, Cl−, HCOO−, CH3COO−, CH3SO3−, C2O42−) and elemental species (Al, Fe, Zn, V, Cr, Cu, Mn, Ni, Ti, Pb). For species measured in both ionic and elemental forms, only one representative variable was selected based on analytical precision, correlation analysis, and source representativeness. For example, Na+, Mg2+, and SO42− were selected to represent sea salt and secondary formation characteristics instead of elemental Na, Mg, and S. Each species was classified according to its signal-to-noise ratio (S/N) [23].
The optional number of PMF factors was determined by comparing solutions ranging from six to ten factors, considering the distribution of scaled residuals, factor separation, physicochemical interpretability, changes in Q/Qexp, and bootstrap reproducibility. In addition, the DISP (Displacement) method [24] was applied to evaluate the uncertainty ranges of each factor. The DISP analysis estimates the upper and lower bounds of variability for each species within a factor profile to assess the stability of the solution. A narrower DISP range indicates that the species is stably associated with a specific factor as a key component. Based on these evaluation criteria, the final number of factors was determined.
2.3. DN-PMF (Dispersion Normalized PMF) Model
DN-PMF is an approach that accounts for meteorological dilution effects influencing aerosol concentrations by incorporating the ventilation coefficient (VC) [14,15]. The ventilation coefficient was calculated as the product of the mixing layer height (MLH) and wind speed (). In this study, hourly wind speed data measured by onboard meteorological sensors and hourly MLH data obtained from the Copernicus Climate Data Store (CDS) were used. The calculated VC values were temporally matched to the sampling time of each sample and applied accordingly. The PM concentration at time () was converted to a ventilation-corrected concentration () using the following equation:
where represents the ventilation coefficient at time , and denotes the average ventilation coefficient over the entire observation period. The ventilation-corrected concentration matrix () was used as the input dataset for PMF, enabling the extraction of source profiles and contributions with reduced influence of meteorological dilution. The source contributions obtained from DN-PMF were subsequently unnormalized by applying the inverse ventilation correction, allowing interpretation at the original concentration scale.
2.4. PSCF (Potential Source Contribution Function) Model
To investigate the long-range transport characteristics of aerosols over the Yellow Sea and identify potential source regions, 72 h backward trajectories were calculated using the HYSPLIT 4 model [25]. Meteorological fields from the Global Data Assimilation System (GDAS, 1° × 1°) provided by NOAA were used. Backward trajectories were calculated at 1 h intervals for each sample. The arrival height was set to half of the mixing layer height at the time of sampling [26]. The Potential Source Contribution Function (PSCF) method combines air-mass trajectories with chemical composition data to identify potential source regions associated with high contributions of specific factors [27,28]. The study domain was divided into grid cells with a resolution of 1° × 1°. For each grid cell (, ), denotes the total number of trajectory endpoints passing through the cell, and represents the number of endpoints corresponding to cases where the PMF factor contribution exceeded the 75th percentile. The PSCF value was calculated as follows:
To reduce uncertainties associated with grid cells containing small numbers of endpoints, a weighting function proposed by Heo et al. (2013) [28] was applied:
3. Results
3.1. Chemical Compositions of PM10–2.5 and PM2.5
3.1.1. Ionic Components
A total of 174 PM10 and PM2.5 filter samples were collected over the Yellow Sea from 2020 to 2024, mainly within the February–June period. Based on these samples, the chemical composition characteristics of aerosols were investigated by separating them into coarse (PM10–2.5) and fine (PM2.5) particles, enabling a size-resolved evaluation of aerosol properties over the Yellow Sea. To accurately distinguish the influence of sea salt under marine conditions, Ca2+ and SO42− were converted into non-sea salt fractions (nss-Ca2+ and nss-SO42−) [29], and CO32− concentrations were estimated based on Ca2+ and Mg2+ concentrations [30].
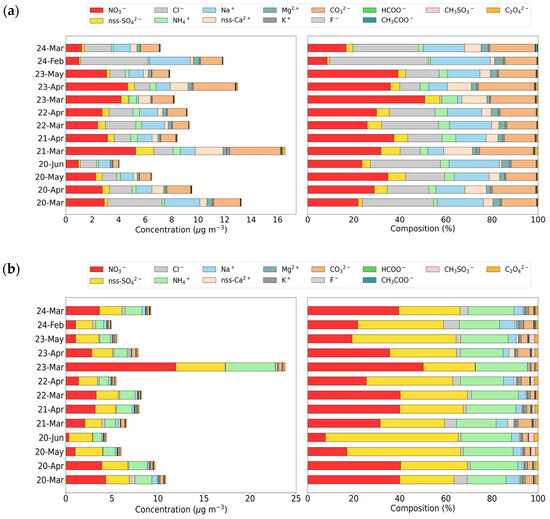
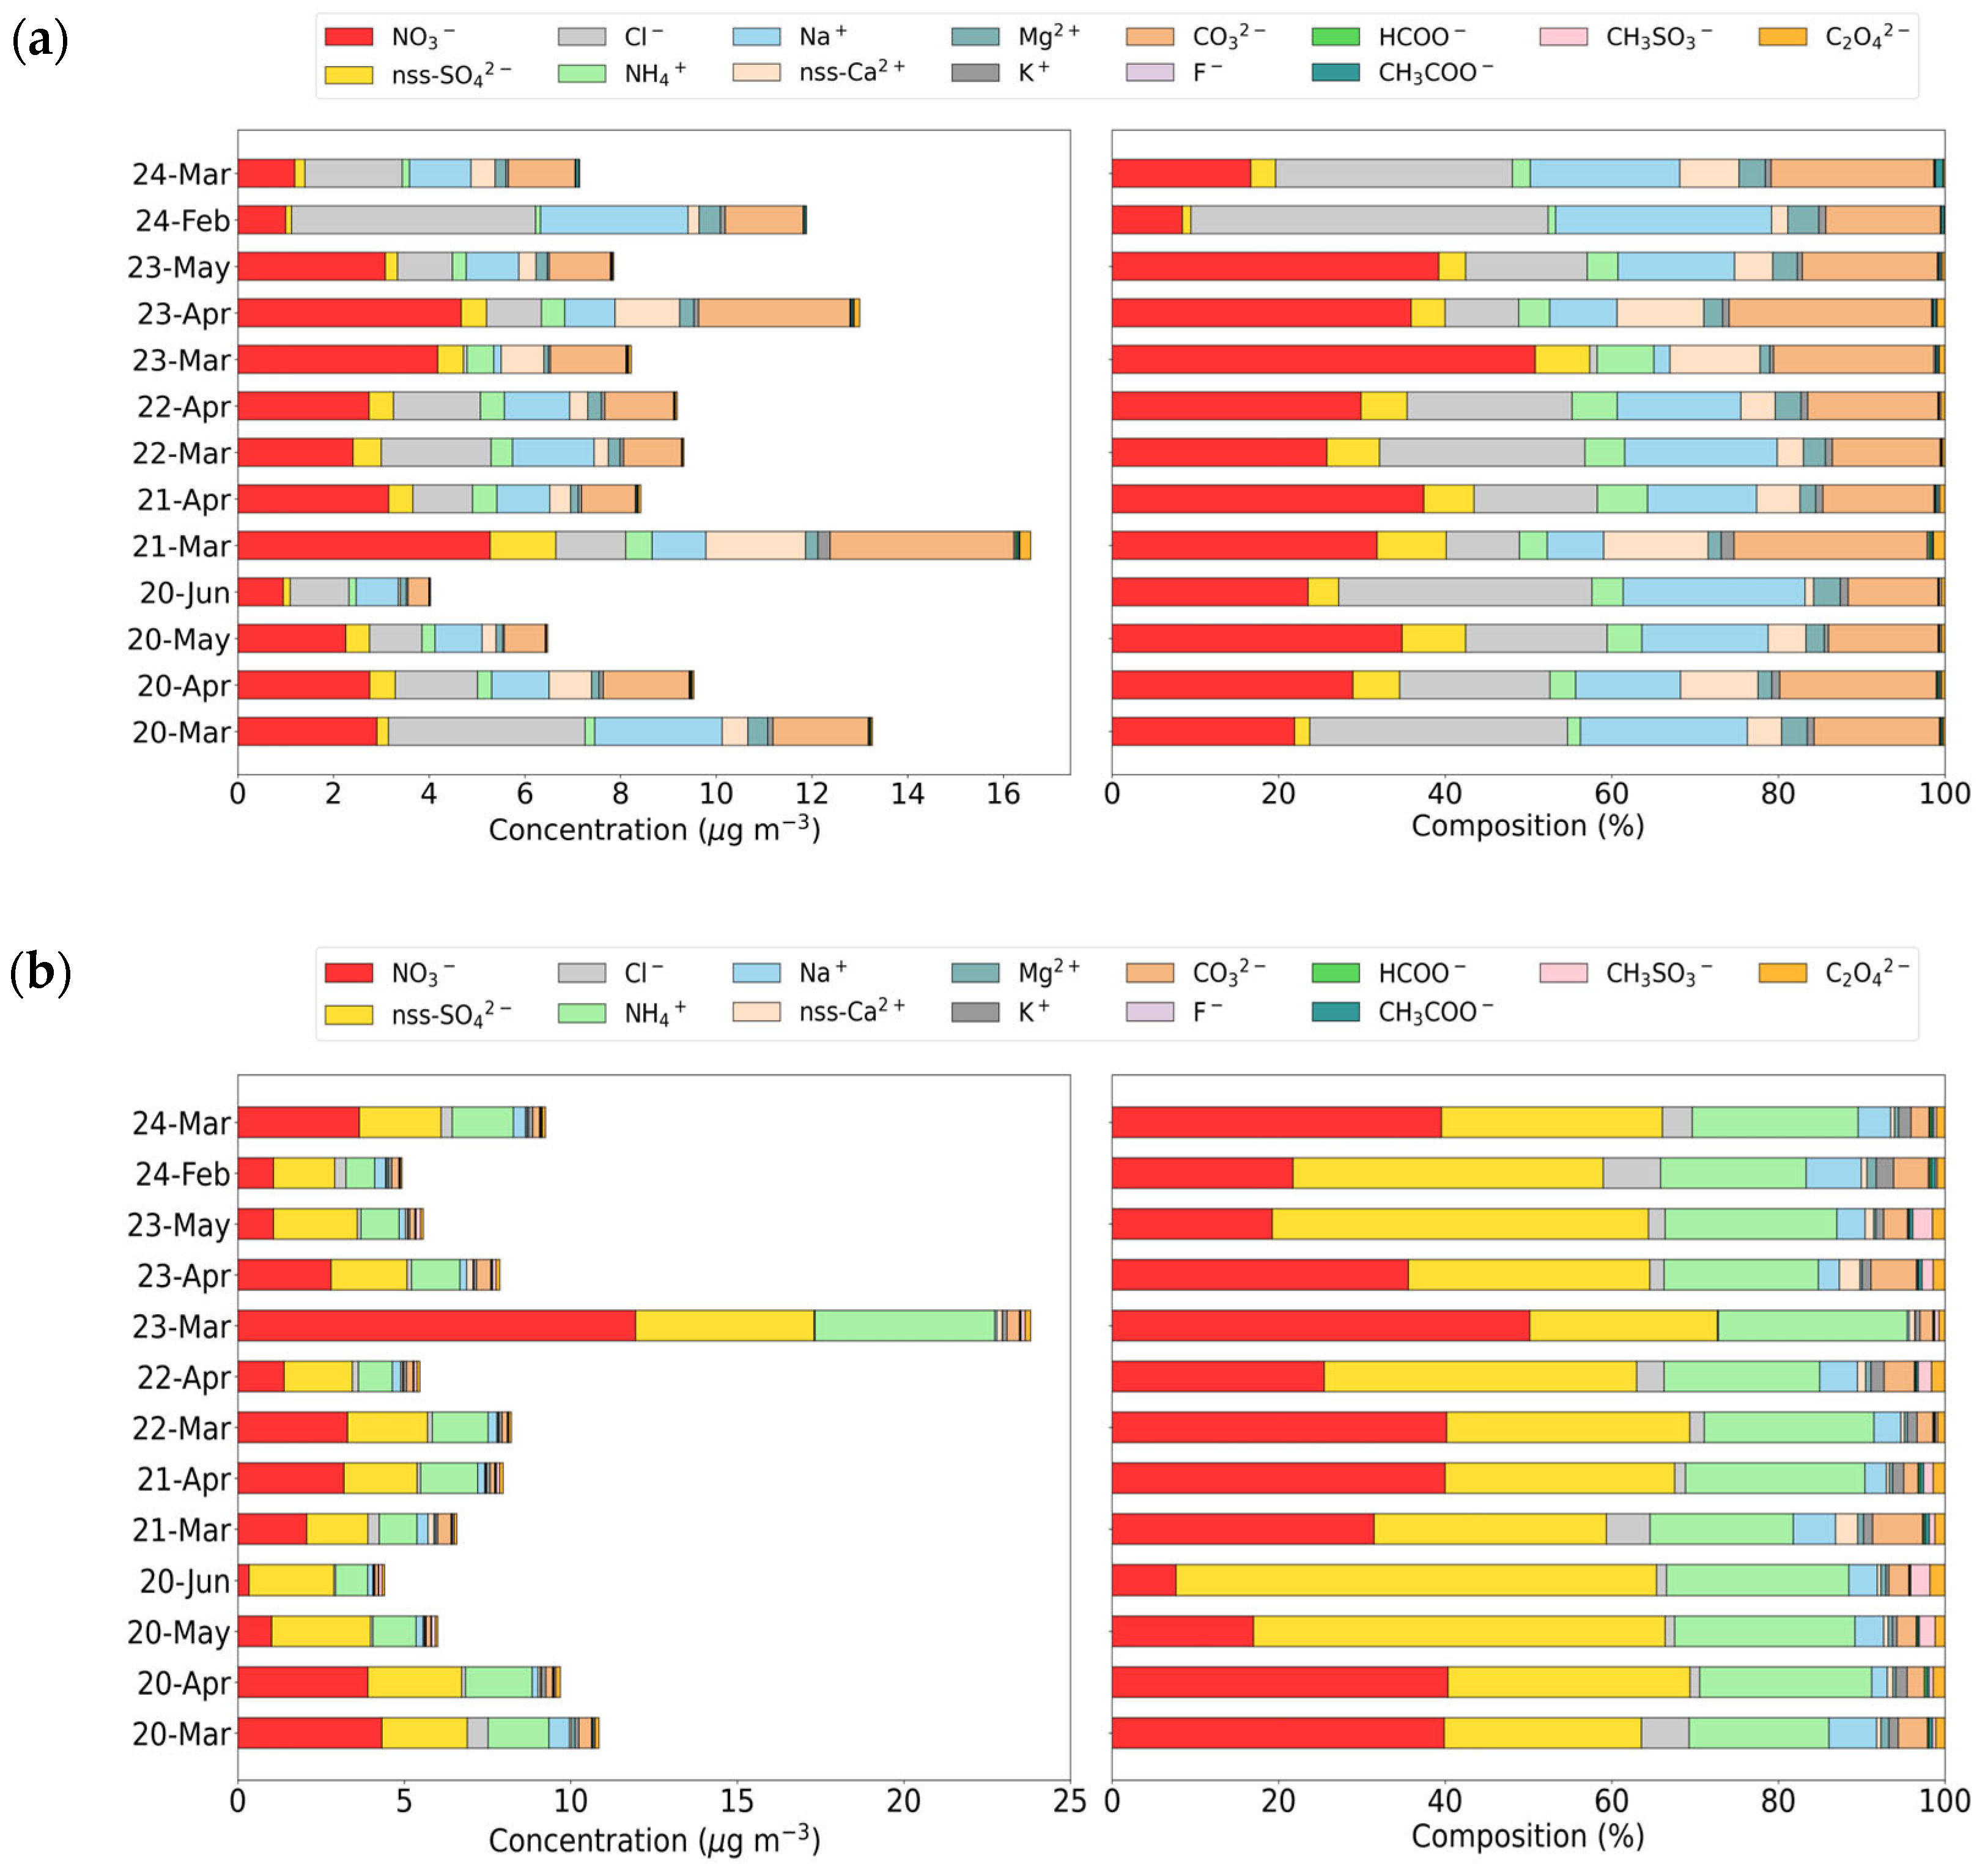
To examine interannual and monthly variations in ionic composition, the dataset (2020–2024) was categorized by month (February–June), and the concentrations and relative contributions of ionic species were compared between coarse and fine particles (Figure 2). In coarse particles, NO3− was the dominant ionic species during most periods from 2020 to 2023. However, in 2024, the contribution of sea salt species (Cl− and Na+) increased, indicating a shift in the dominant ionic composition across years. In contrast, fine particles (PM2.5) were consistently dominated by nss-SO42− and NO3− throughout the entire period. A clear seasonal pattern was observed, with NO3− dominating in March–April and nss-SO42− becoming more prominent in May–June.
Figure 2.
Monthly mean concentrations and compositions of ionic species in Coarse (a) and Fine (b) particles over the Yellow Sea from 2020 to 2024.
For coarse particles, the five-year average total ionic concentration peaked in March, with the highest value observed in March 2021. During this period, simultaneous increases in soil-derived species (nss-Ca2+: 2.08 µg m−3; CO32−: 3.84 µg m−3), and NO3− (5.27 µg m−3) were observed, indicating a typical high-concentration event driven by the combined effects of dust transport and nitrate formation. Similar co-enhancements of Cl−, Na+, nss-Ca2+, and CO32− were observed in March 2020 and 2023, suggesting concurrent intensification of sea salt and soil-derived inputs. In contrast, March 2024 was characterized by enhanced sea salt tracer species and relatively low nss-Ca2+, indicating that coarse particle loading was dominated by sea salt resuspension rather than soil-derived input [28].
For fine particles, total ionic concentration remained relatively stable within the range of 5–12 µg m−3 during most periods. However, in March 2023, the total concentration increased sharply to 24 µg m−3, representing the highest level during the observation period. This event was characterized by simultaneous increases in NO3− (11.95 µg m−3), NH4+ (5.39 µg m−3), and nss-SO42− (5.36 µg m−3), indicating enhanced secondary formation under stagnant atmospheric conditions rather than dust influence. These results suggest that, unlike coarse particles influenced by episodic natural inputs, fine particle variability is primarily governed by secondary formation processes and long-range transport.
Notably, in 2022, both coarse and fine particles exhibited relatively low ionic concentrations, indicating more stable compositional characteristics compared to other years. In March 2022, increases in Na+ (1.71 µg m−3), Cl− (2.30 µg m−3), and NO3− (2.41 µg m−3) were observed in coarse particles, while NO3− (3.30 µg m−3) and NH4+ (1.67 µg m−3) increased in fine particles. Although these features reflect the influence of a haze event, overall variability was weaker than in other years. Compared with other years, 2022 generally exhibited lower concentrations of soil-derived species in coarse particles and secondary inorganic species in fine particles. In addition, no pronounced high-concentration episodes were observed during the measurement period, resulting in lower overall aerosol concentrations and weaker temporal variability.
Overall, the ionic composition of aerosols over the Yellow Sea varied depending on interannual and monthly meteorological conditions and air-mass transport patterns. Coarse particles were primarily influenced by sea salt (Na+, Cl−) and soil-derived components (nss-Ca2+, CO32−), whereas fine particles were dominated by secondary inorganic species (nss-SO42−, NO3−, NH4+). Size-resolved composition analysis showed that secondary species accounted for approximately 68% of fine particles, indicating a substantially higher contribution than in coarse particles. In contrast, sea salt (Na+, Cl−, Mg2+) and soil-derived (nss-Ca2+) components contributed only marginally to fine particles. Furthermore, the PM10–2.5/PM2.5 ratio analysis revealed that NH4+, nss-SO42−, CH3SO3−, and HCOO− were predominantly associated with fine particles, whereas Na+, Cl−, Mg2+, and nss-Ca2+ were mainly distributed in coarse particles, clearly demonstrating distinct size-dependent distribution characteristics of ionic species.
3.1.2. Trace Element Components
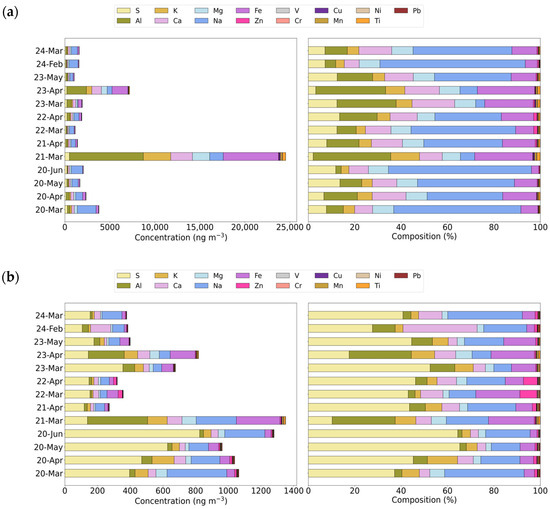
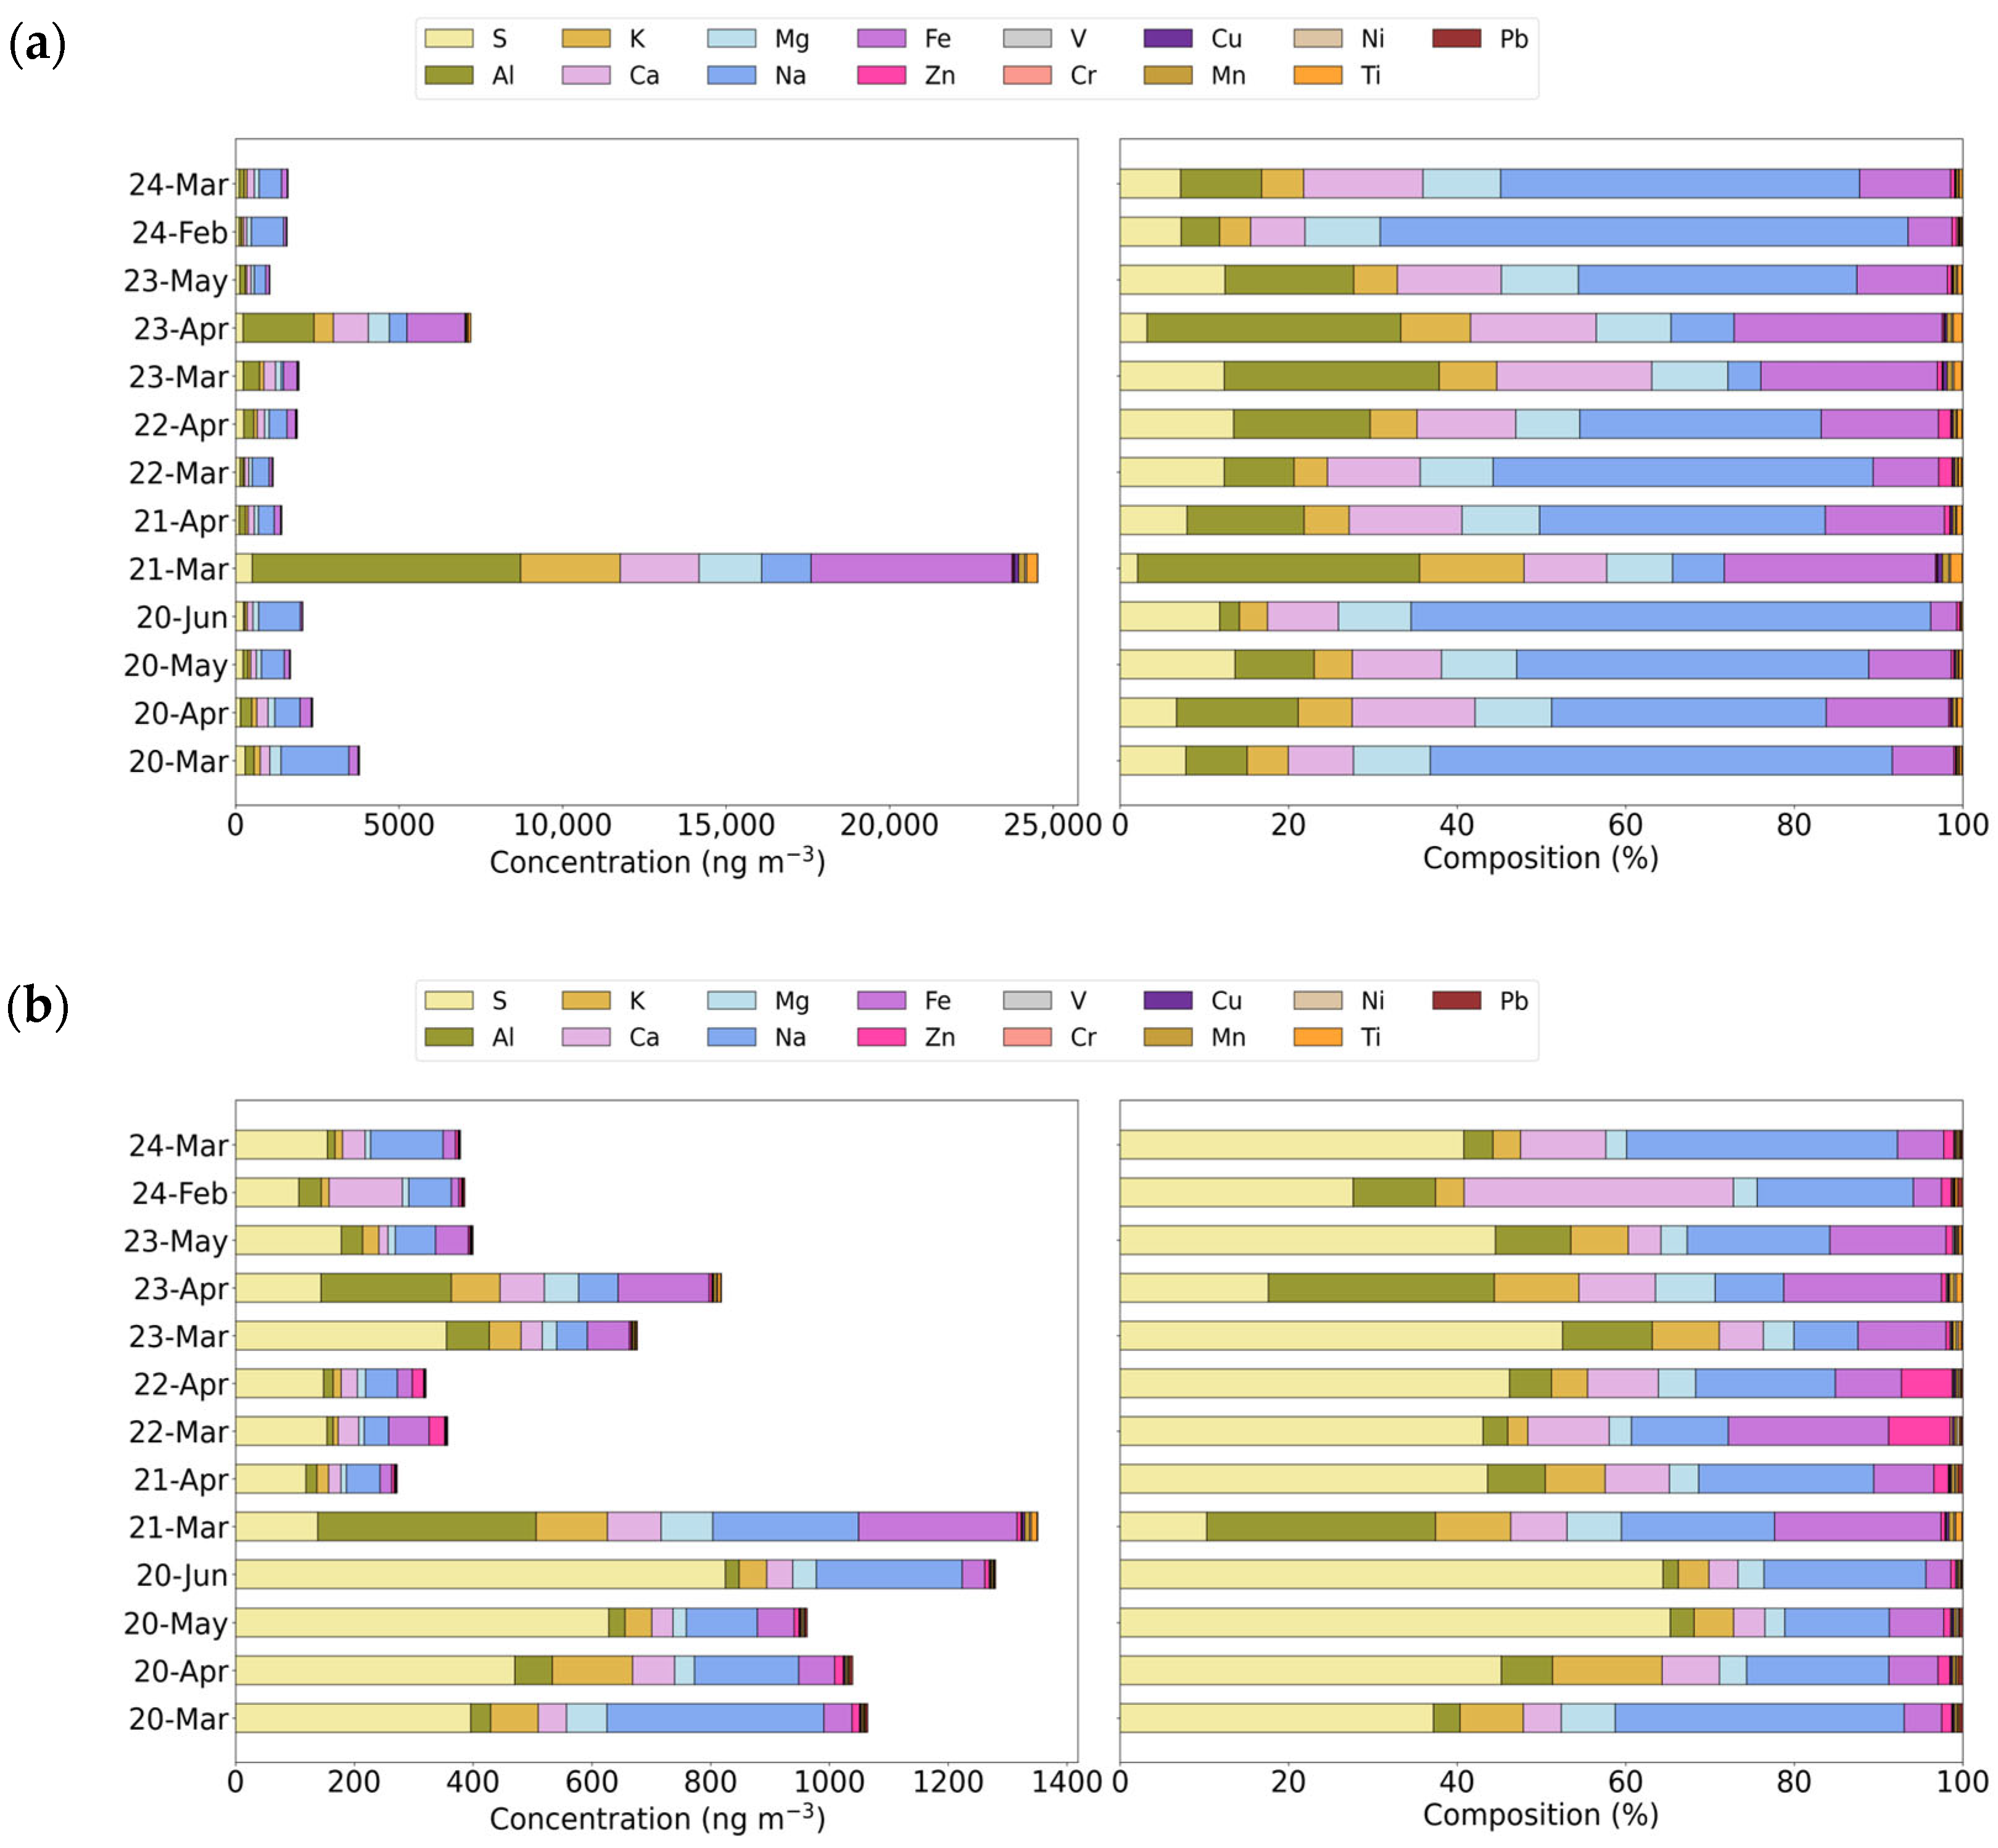
The results of size-resolved trace element analysis over the Yellow Sea from 2020 to 2024 are presented in Figure 3. The analyzed elements were categorized into soil-derived (Al, Ca, Fe), sea salt (Na, Mg), fuel combustion and shipping-related (V, Ni, Cu), and industrial/anthropogenic (Zn, Pb) sources based on widely used classification criteria [31]. Elements such as Al, Ca, Fe, and Ti are generally recognized as tracers of soil sources, while Na and Mg represent sea salt sources; these components are typically enriched in coarse particles. In contrast, Zn, Pb, V, Ni, and Cu are associated with combustion processes, industrial activities, and ship emissions, and their size distributions vary depending on emission characteristics and atmospheric transport processes [32].
Figure 3.
Monthly mean concentrations and compositions of trace elements in Coarse (a) and Fine (b) particles over the Yellow Sea from 2020 to 2024.
Soil-derived elements (Al, Ca, and Fe) exhibited the highest concentrations in coarse particles. The monthly average concentration ranges were Al (48–2171 ng m−3), Fe (64–1668 ng m−3), and Ca (101–775 ng m−3), which were significantly higher than those observed in fine particles (Al: 23–108 ng m−3; Fe: 13–96 ng m−3; Ca: 29–123 ng m−3). This indicates that soil-derived particles are predominantly transported in the coarse size fraction. In particular, in March 2021, exceptionally high concentrations were observed in coarse particles, with Al (8204 ng m−3), Fe (6148 ng m−3), and Ca (2410 ng m−3), representing the highest levels during the observation period. This event is interpreted as being strongly influenced by intense dust transport. In contrast, in 2023, peak concentrations occurred in April, suggesting that both the timing and intensity of soil particle transport varied by year.
Sea salt elements (Na and Mg) were also more abundant in coarse particles and exhibited pronounced interannual and monthly variability. For example, in March 2020, Na (2076 ng m−3) and Mg (345 ng m−3) showed significant increases, whereas in March 2023, Na concentrations remained as low as 75 ng m−3, indicating substantial variability in sea salt influence. In 2024, Na concentrations were higher in February (985 ng m−3) than in March (683 ng m−3), while Mg showed similar average concentrations (~144 ng m−3) during February–March. These variations suggest that the generation and resuspension of sea salt particles are highly sensitive to short-term marine conditions such as wind speed and wave activity. In fine particles, Na and Mg concentrations were only about 5–23% of those in coarse particles, indicating that the contribution of sea salt sources to fine particles is relatively limited.
Elements associated with fuel combustion and ship emissions (V, Ni, and Cu) were observed in both coarse and fine particles, but exhibited higher concentrations and wider variability in coarse particles. The monthly average concentration ranges in coarse particles were V (0.19–4.35 ng m−3), Ni (0.40–13.75 ng m−3), and Cu (0.64–35.77 ng m−3), whereas in fine particles the ranges were narrower (V: 0.21–1.91 ng m−3; Ni: 0.24–2.03 ng m−3; Cu: 0.28–1.81 ng m−3). These results indicate that the influence of fuel combustion and ship emissions is more strongly reflected in coarse particles under varying atmospheric transport conditions, whereas fine particles exhibit relatively stable concentration distributions.
Industrial and anthropogenic metals (Zn and Pb) were also detected in both size fractions, but their concentration characteristics differed. In coarse particles, monthly average concentrations ranged from Zn (5.68–17.17 ng m−3) and Pb (0.28–2.91 ng m−3), with episodic high-concentration events observed. In fine particles, Zn (0.28–2.91 ng m−3) and Pb (1.60–2.66 ng m−3) exhibited relatively stable concentration levels. These size-dependent differences are consistent with previous studies indicating that anthropogenic metals tend to exist as relatively stable background concentrations in fine particles, whereas in coarse particles their concentrations can vary substantially depending on emission intensity and transport conditions [21].
3.2. Source Apportionment Using DN-PMF
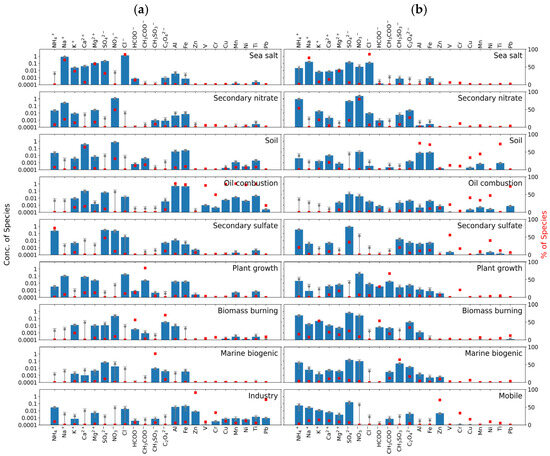
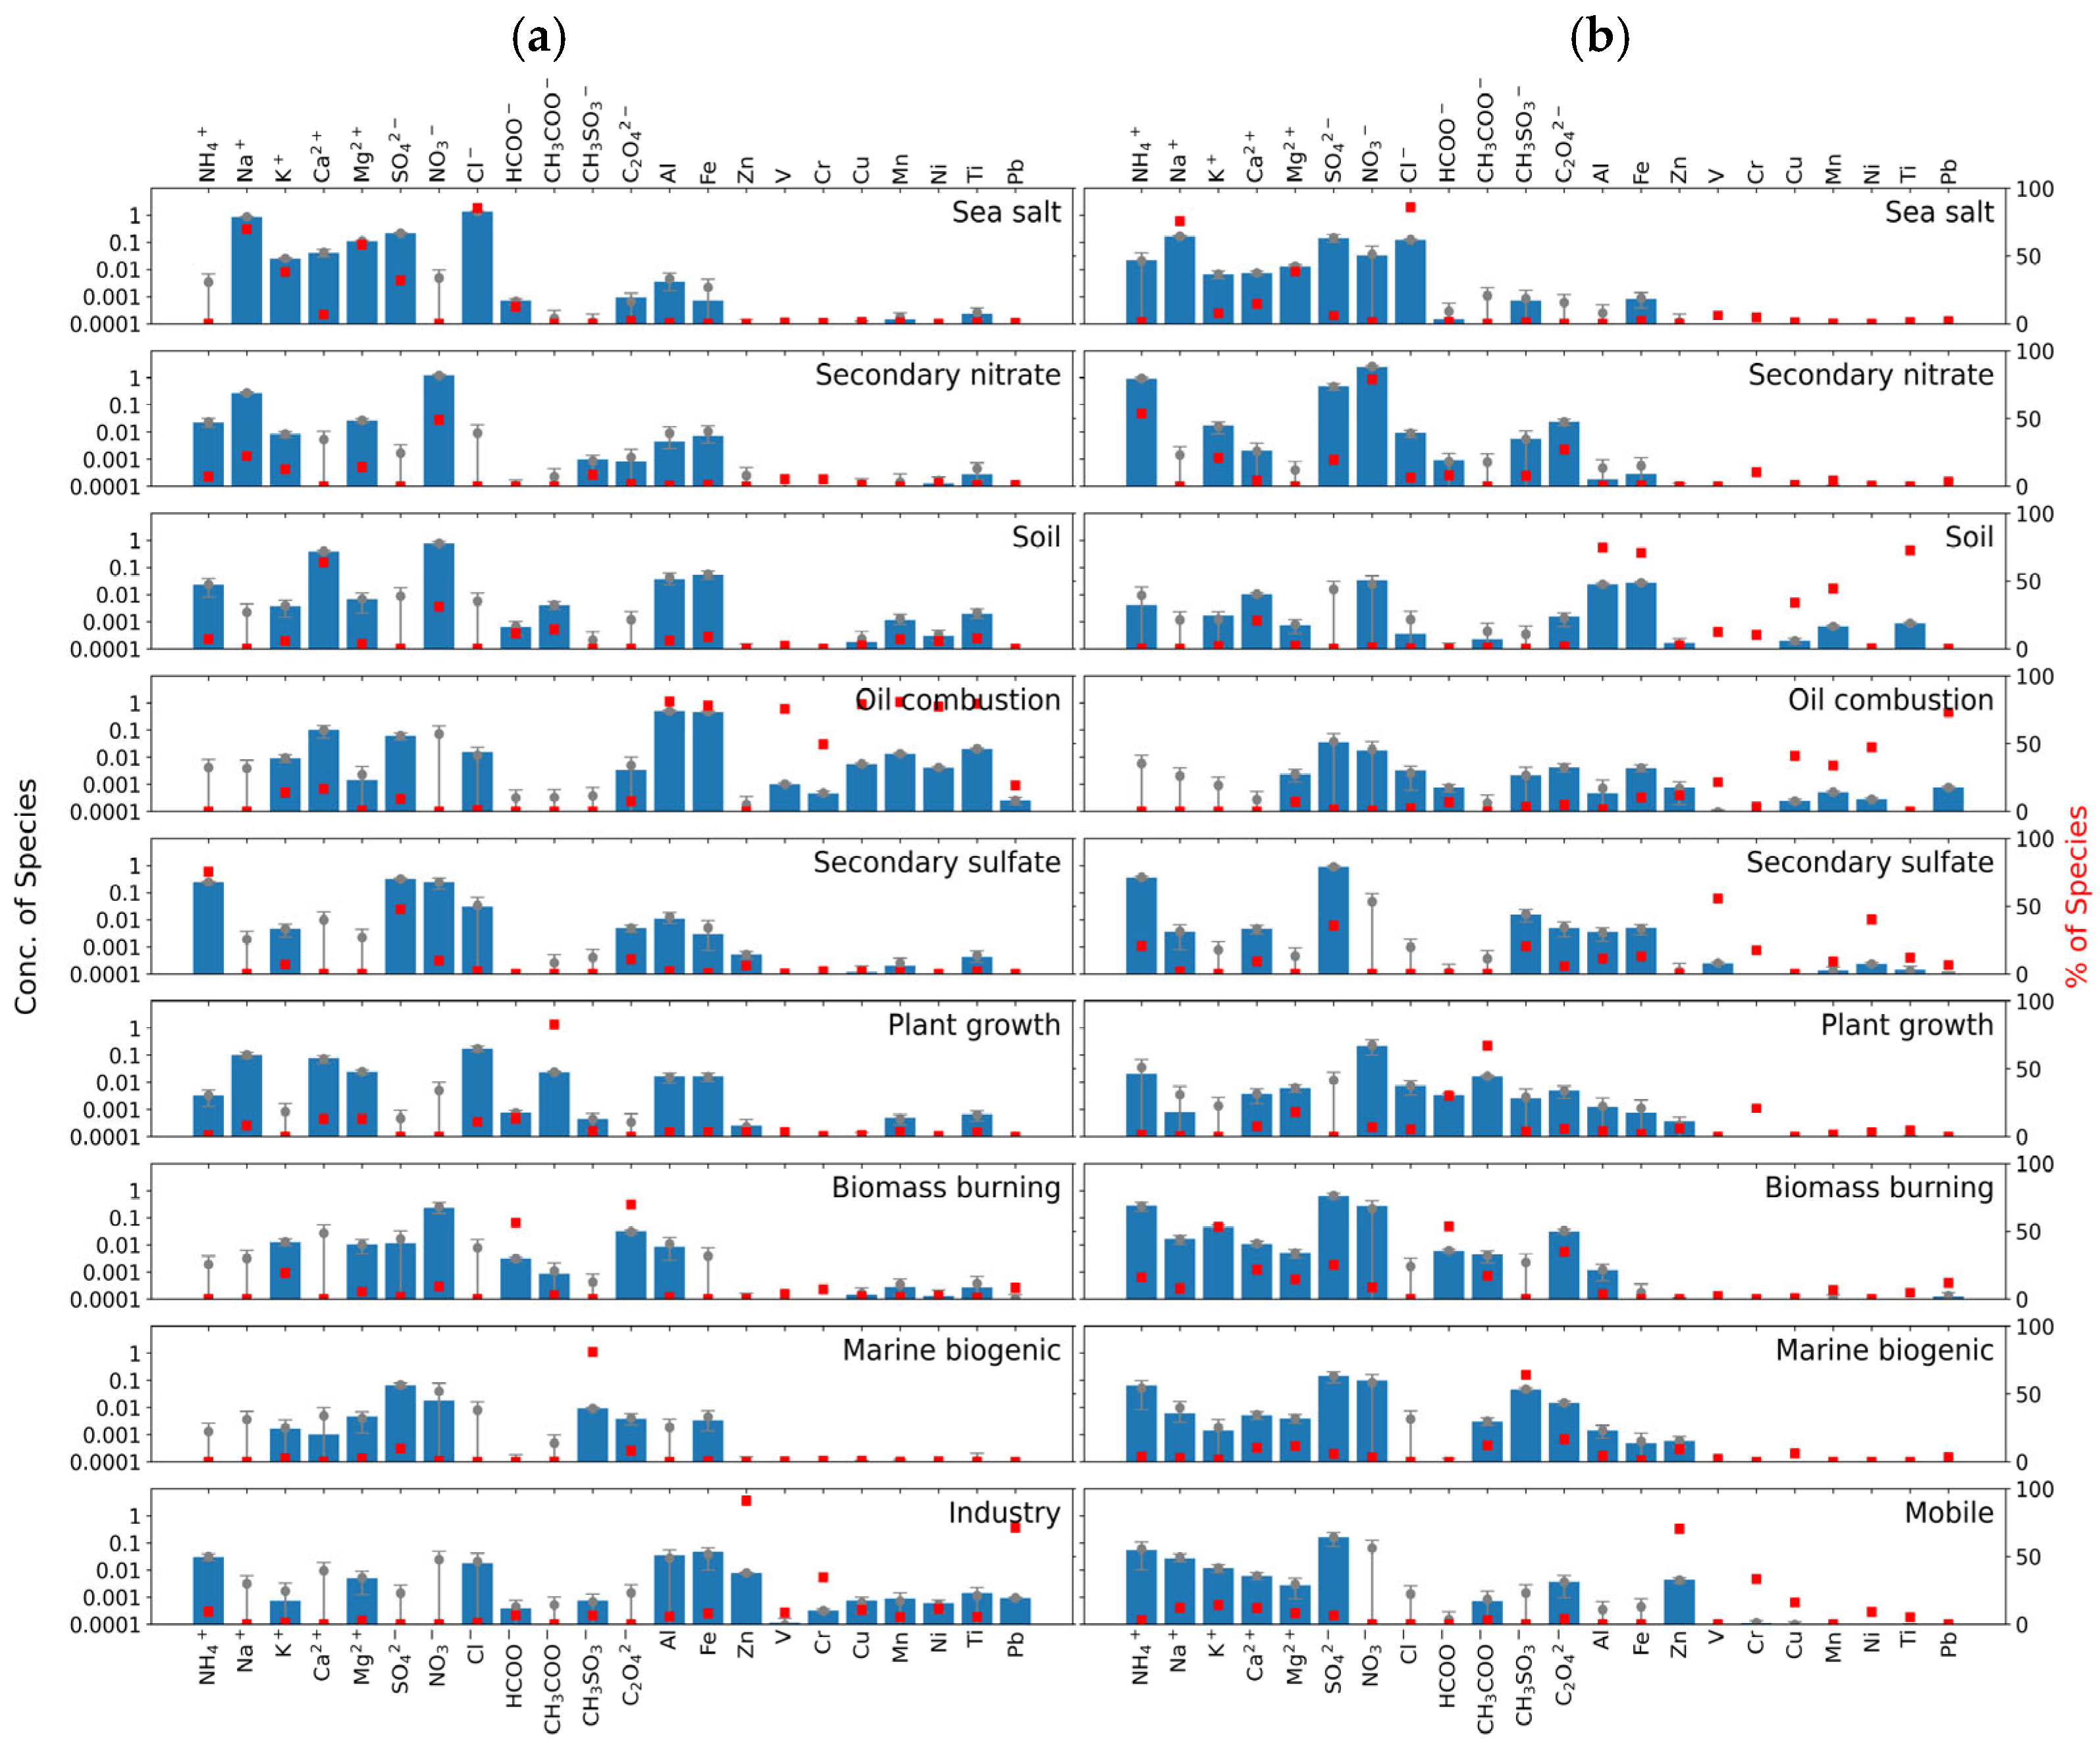
In this study, DN-PMF analysis was conducted using the ionic and elemental composition data of coarse and fine particles described in Section 3.1. A total of 160 samples that passed the QA/QC procedures outlined in Section 2.2 were used as input data. For both coarse and fine particles, 22 chemical species were included as input variables. The stability and uncertainty ranges of each factor were evaluated using DISP analysis, and the DN-PMF results are presented in Figure 4.
Figure 4.
Source profiles for DN-PMF at the Yellow Sea in Coarse (a) and Fine (b) from 2020 to 2024.
The first source identified in both coarse and fine particles was sea salt, characterized by high loadings of Na+, Cl−, and Mg2+, with relatively narrow DISP ranges, indicating stable identification of this factor. Additional contributions from K+, Ca2+, SO42−, and HCOO− were also observed. The major components of sea salt are known to include Na, Cl, SO42−, Ca, K, and Mg [33], and the results of this study are consistent with these characteristics. The average contribution of sea salt was 30.9% in coarse particles, representing the largest contribution, whereas it accounted for 6.28% in fine particles, indicating a stronger influence in the coarse fraction.
The second source was identified as secondary nitrate (ammonium nitrate), characterized by high loadings of NO3− and NH4+ with narrow DISP ranges [34,35]. The average contribution was 18.3% in coarse particles and 48.6% in fine particles, making it the most dominant factor in fine particles. Secondary nitrate is formed through the oxidation of NOX to HNO3, followed by reaction with NH3 to form NH4NO3 [36]. It is known to form more readily under low temperature and high relative humidity conditions, resulting in higher contributions during winter and spring [37].
The third source was identified as soil, characterized by relatively high loadings of Ca2+, Al, Fe, Mn, Ni, and Ti, and stable convergence in the DISP analysis [38]. The average contribution was 15.1% in coarse particles, whereas it was only 1.29% in fine particles, indicating that soil-derived particles are predominantly associated with the coarse fraction.
The fourth source was oil combustion, characterized by high loadings of Ni and V with narrow DISP ranges. This factor is interpreted as reflecting emissions from ship combustion [39,40,41,42]. In coarse particles, additional contributions from K+, Ca2+, SO42−, Al, Fe, Cr, Cu, Mn, Ti, and Pb were observed, whereas in fine particles, Mg2+, HCOO−, C2O42−, Fe, Zn, Cu, Mn, and Pb also contributed. The average contribution was 13.9% in coarse particles and 0.88% in fine particles, indicating a stronger influence in the coarse fraction.
The fifth source was secondary sulfate (ammonium sulfate), characterized by high loadings of SO42− and NH4+, with relatively stable DISP ranges. Secondary sulfate is formed through the oxidation of SO2, followed by reaction with NH3 [43]. The average contribution was 10.1% in coarse particles and 15.6% in fine particles, showing a higher contribution in the fine fraction.
The sixth source was plant growth, characterized by CH3COO− and HCOO−, both of which exhibited relatively narrow DISP ranges, supporting consistent factor interpretation. In particular, CH3COO− showed a high loading and was considered a representative species. These species can exist in particulate form as salts of acetic acid (CH3COOH) and formic acid (HCOOH), and their precursors are known to originate from both direct emissions from vegetation and secondary formation through photochemical oxidation of biogenic VOCs [44,45]. The average contribution was 5.1% in coarse particles and 3.5% in fine particles. In addition, previous studies have reported the presence and seasonal variability of HCOOH and CH3COOH in marine atmospheres [46], suggesting that acetate and formate observed over the Yellow Sea may reflect contributions from both biospheric and photochemical processes under mixed marine–continental air mass conditions.
The seventh source was biomass burning, characterized by relatively high loadings of K+, NO3−, HCOO−, and C2O42−, with stable DISP results. K+ is widely recognized as a tracer of biomass burning emissions [37]. The average contribution was 3.63% in coarse particles and 15.8% in fine particles, indicating a more significant influence in the fine fraction.
The eighth source was marine biogenic, characterized by high loadings of CH3SO3− (MSA) and SO42−, with relatively narrow DISP ranges. CH3SO3− is produced from the atmospheric oxidation of dimethyl sulfide (DMS) emitted by marine phytoplankton and is widely used as a tracer of marine sulfur sources [47]. The average contribution was 1.3% in coarse particles, representing the lowest contribution, but was higher in fine particles (4.8%).
In addition to these common factors, size-specific sources were identified. In coarse particles, an industry factor was separated, characterized by high loadings of metals such as Zn, Cr, Cu, Ni, and Pb, with relatively narrow DISP ranges. These metals are associated with industrial activities such as metallurgy and steel production [48,49]. The average contribution of this factor was 1.73% over the entire observation period. In contrast, a mobile (traffic-related) factor was identified only in fine particles, characterized by high loadings of Zn and Cr, with narrow DISP ranges. Although Na+, K+, and Ca2+ also contributed to some extent, the factor composition was dominated by Zn–Cr combinations associated with traffic emissions. Zn is known to be associated with lubricating oil combustion and tire wear [50,51,52], and the average contribution of this factor was 3.28%. The occurrence of the industry factor in the coarse-particle solution and the mobile source factor in the fine-particle solution is likely related to differences in the covariance structure and size distribution of their tracer species. While the industry factor was associated with the co-occurrence of Zn, Cr, Cu, Ni, and Pb, the mobile source factor was dominated mainly by Zn and Cr. This suggests that similar tracer species may be associated with different source categories depending on particle size and co-varying chemical composition, resulting in distinct factor separation in the PMF analysis [11,16].
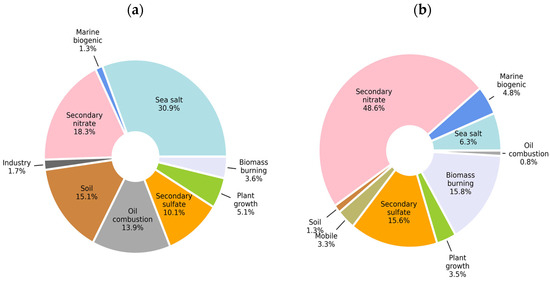
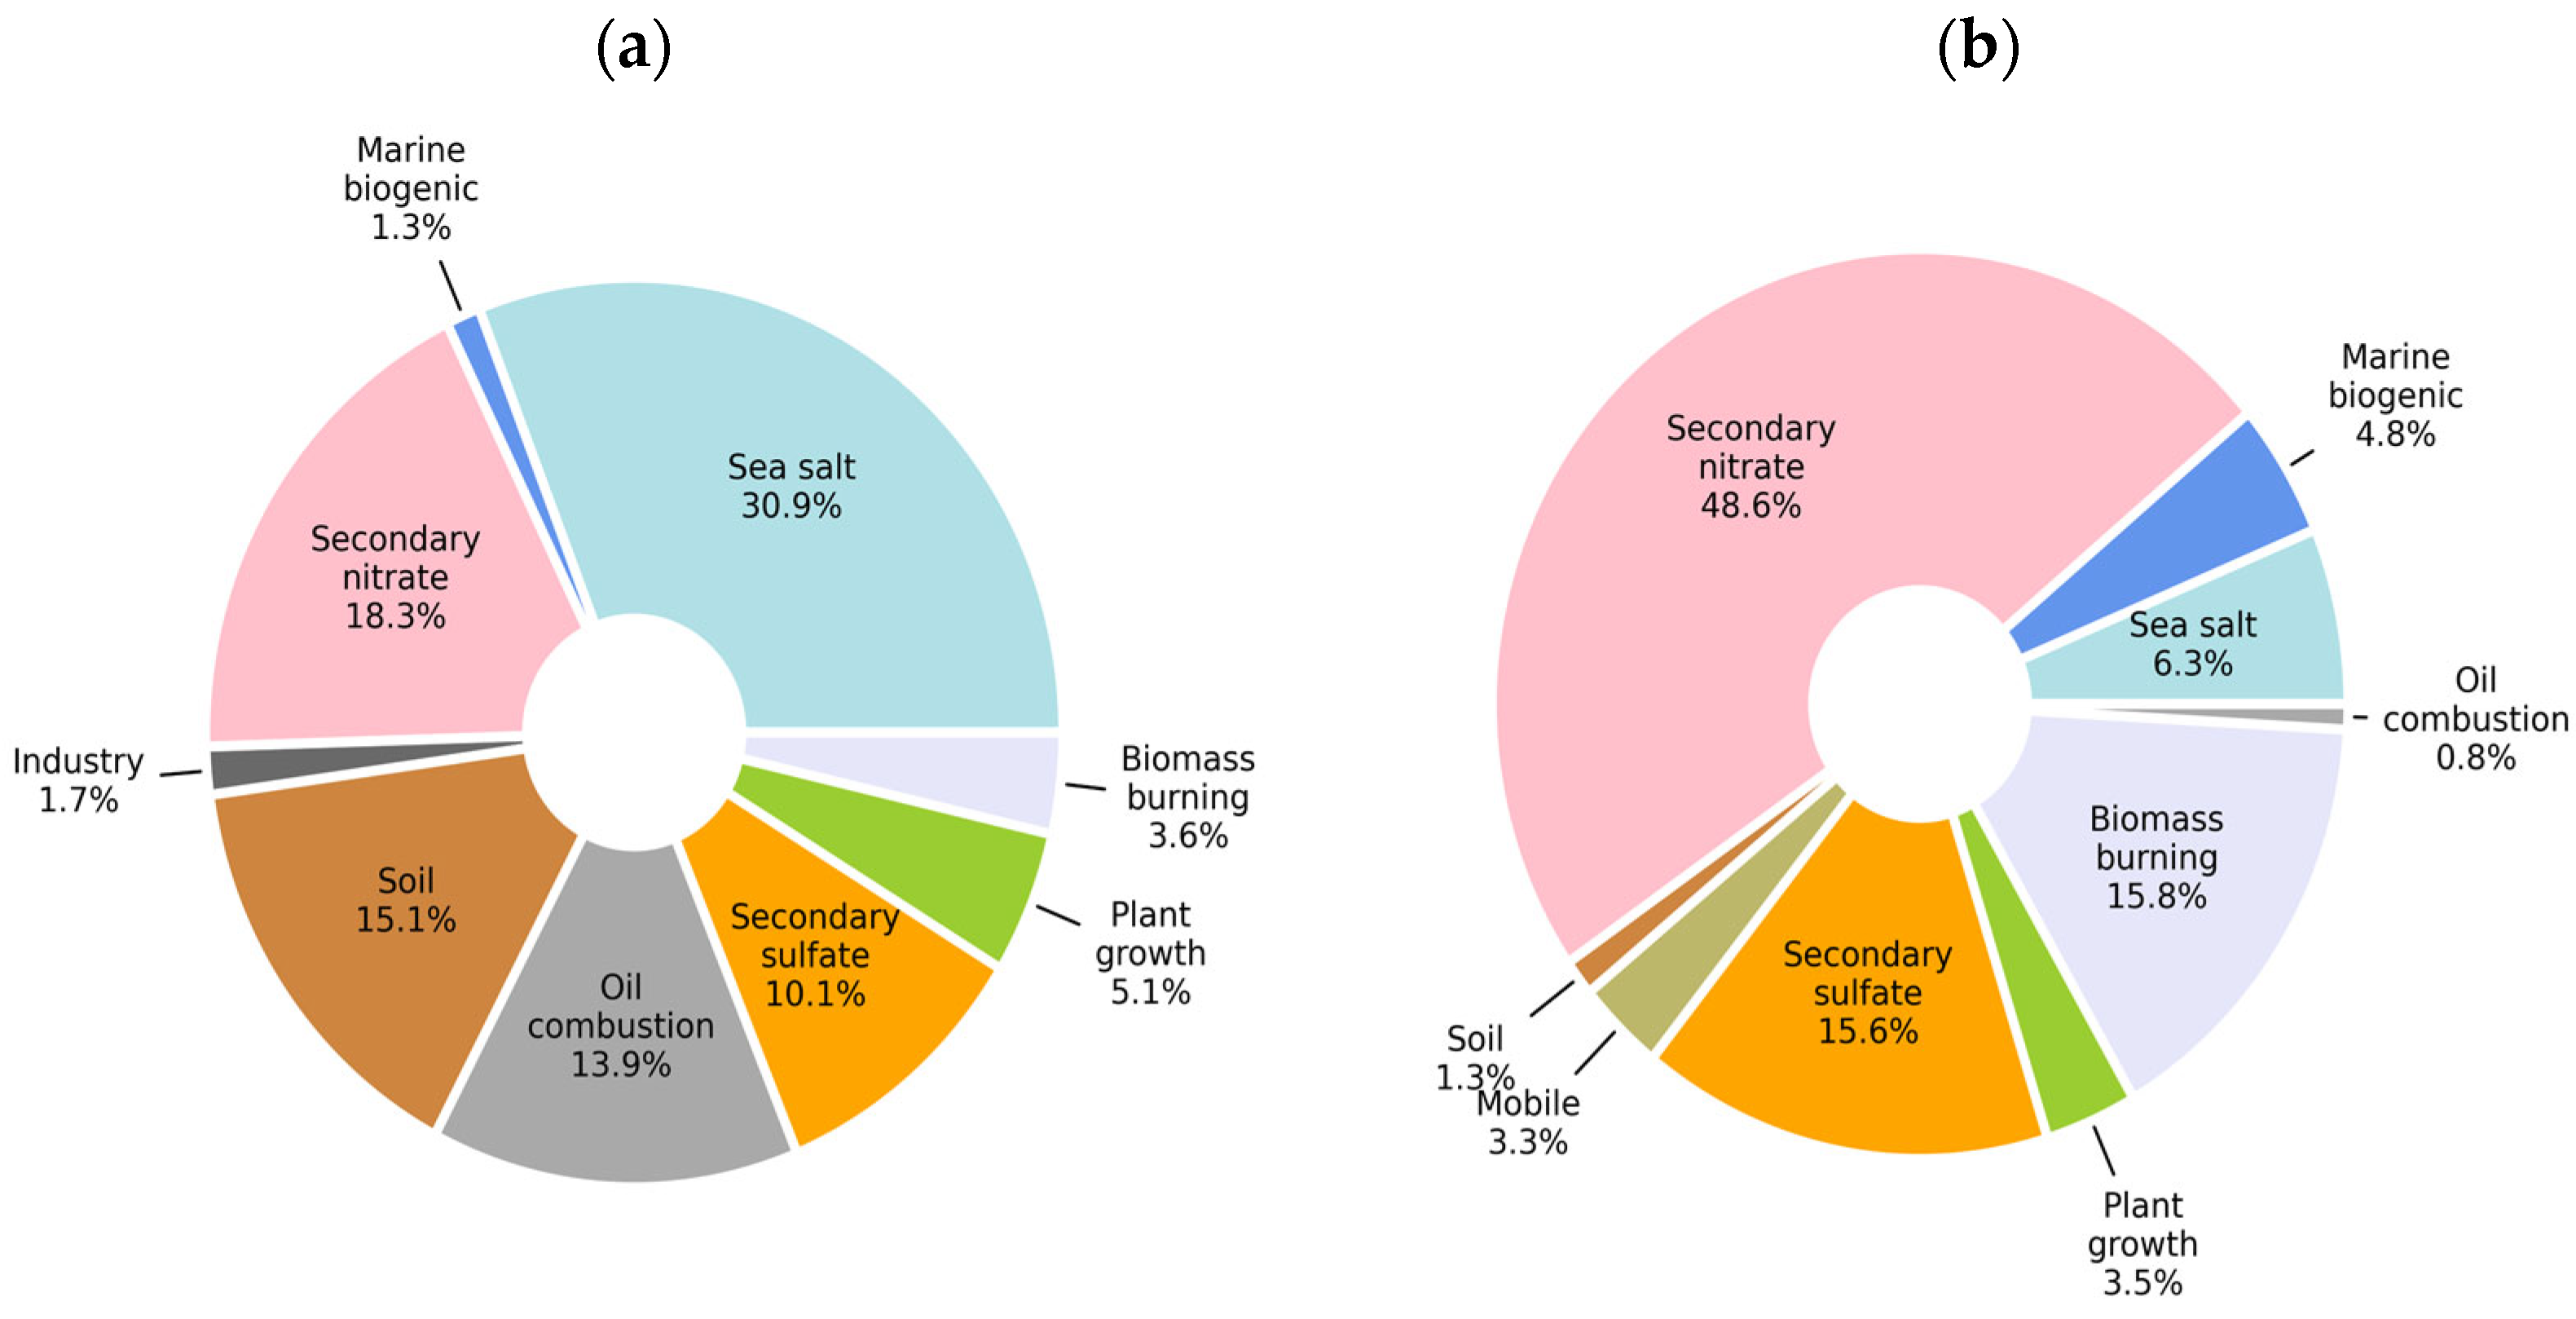
The size-resolved average contributions of all identified sources are summarized in Figure 5. A total of nine major sources were identified in both coarse and fine particles, with eight common factors shared between the two size fractions. However, the industry factor was unique to coarse particles, whereas the mobile factor was unique to fine particles. In coarse particles, sea salt (30.9%) and soil (15.1%) were the dominant contributors, whereas in fine particles, secondary nitrate (48.6%) and secondary sulfate (15.6%) were the major contributors. In addition, the relative importance of other sources, such as oil combustion, biomass burning, and marine biogenic sources, exhibited clear size-dependent differences. These results indicate that even within the same marine region, differences in particle size lead to distinct chemical compositions and source contribution structures.
Figure 5.
Chemical composition fractions of Coarse (a) and Fine (b).
3.3. PSCF Analysis
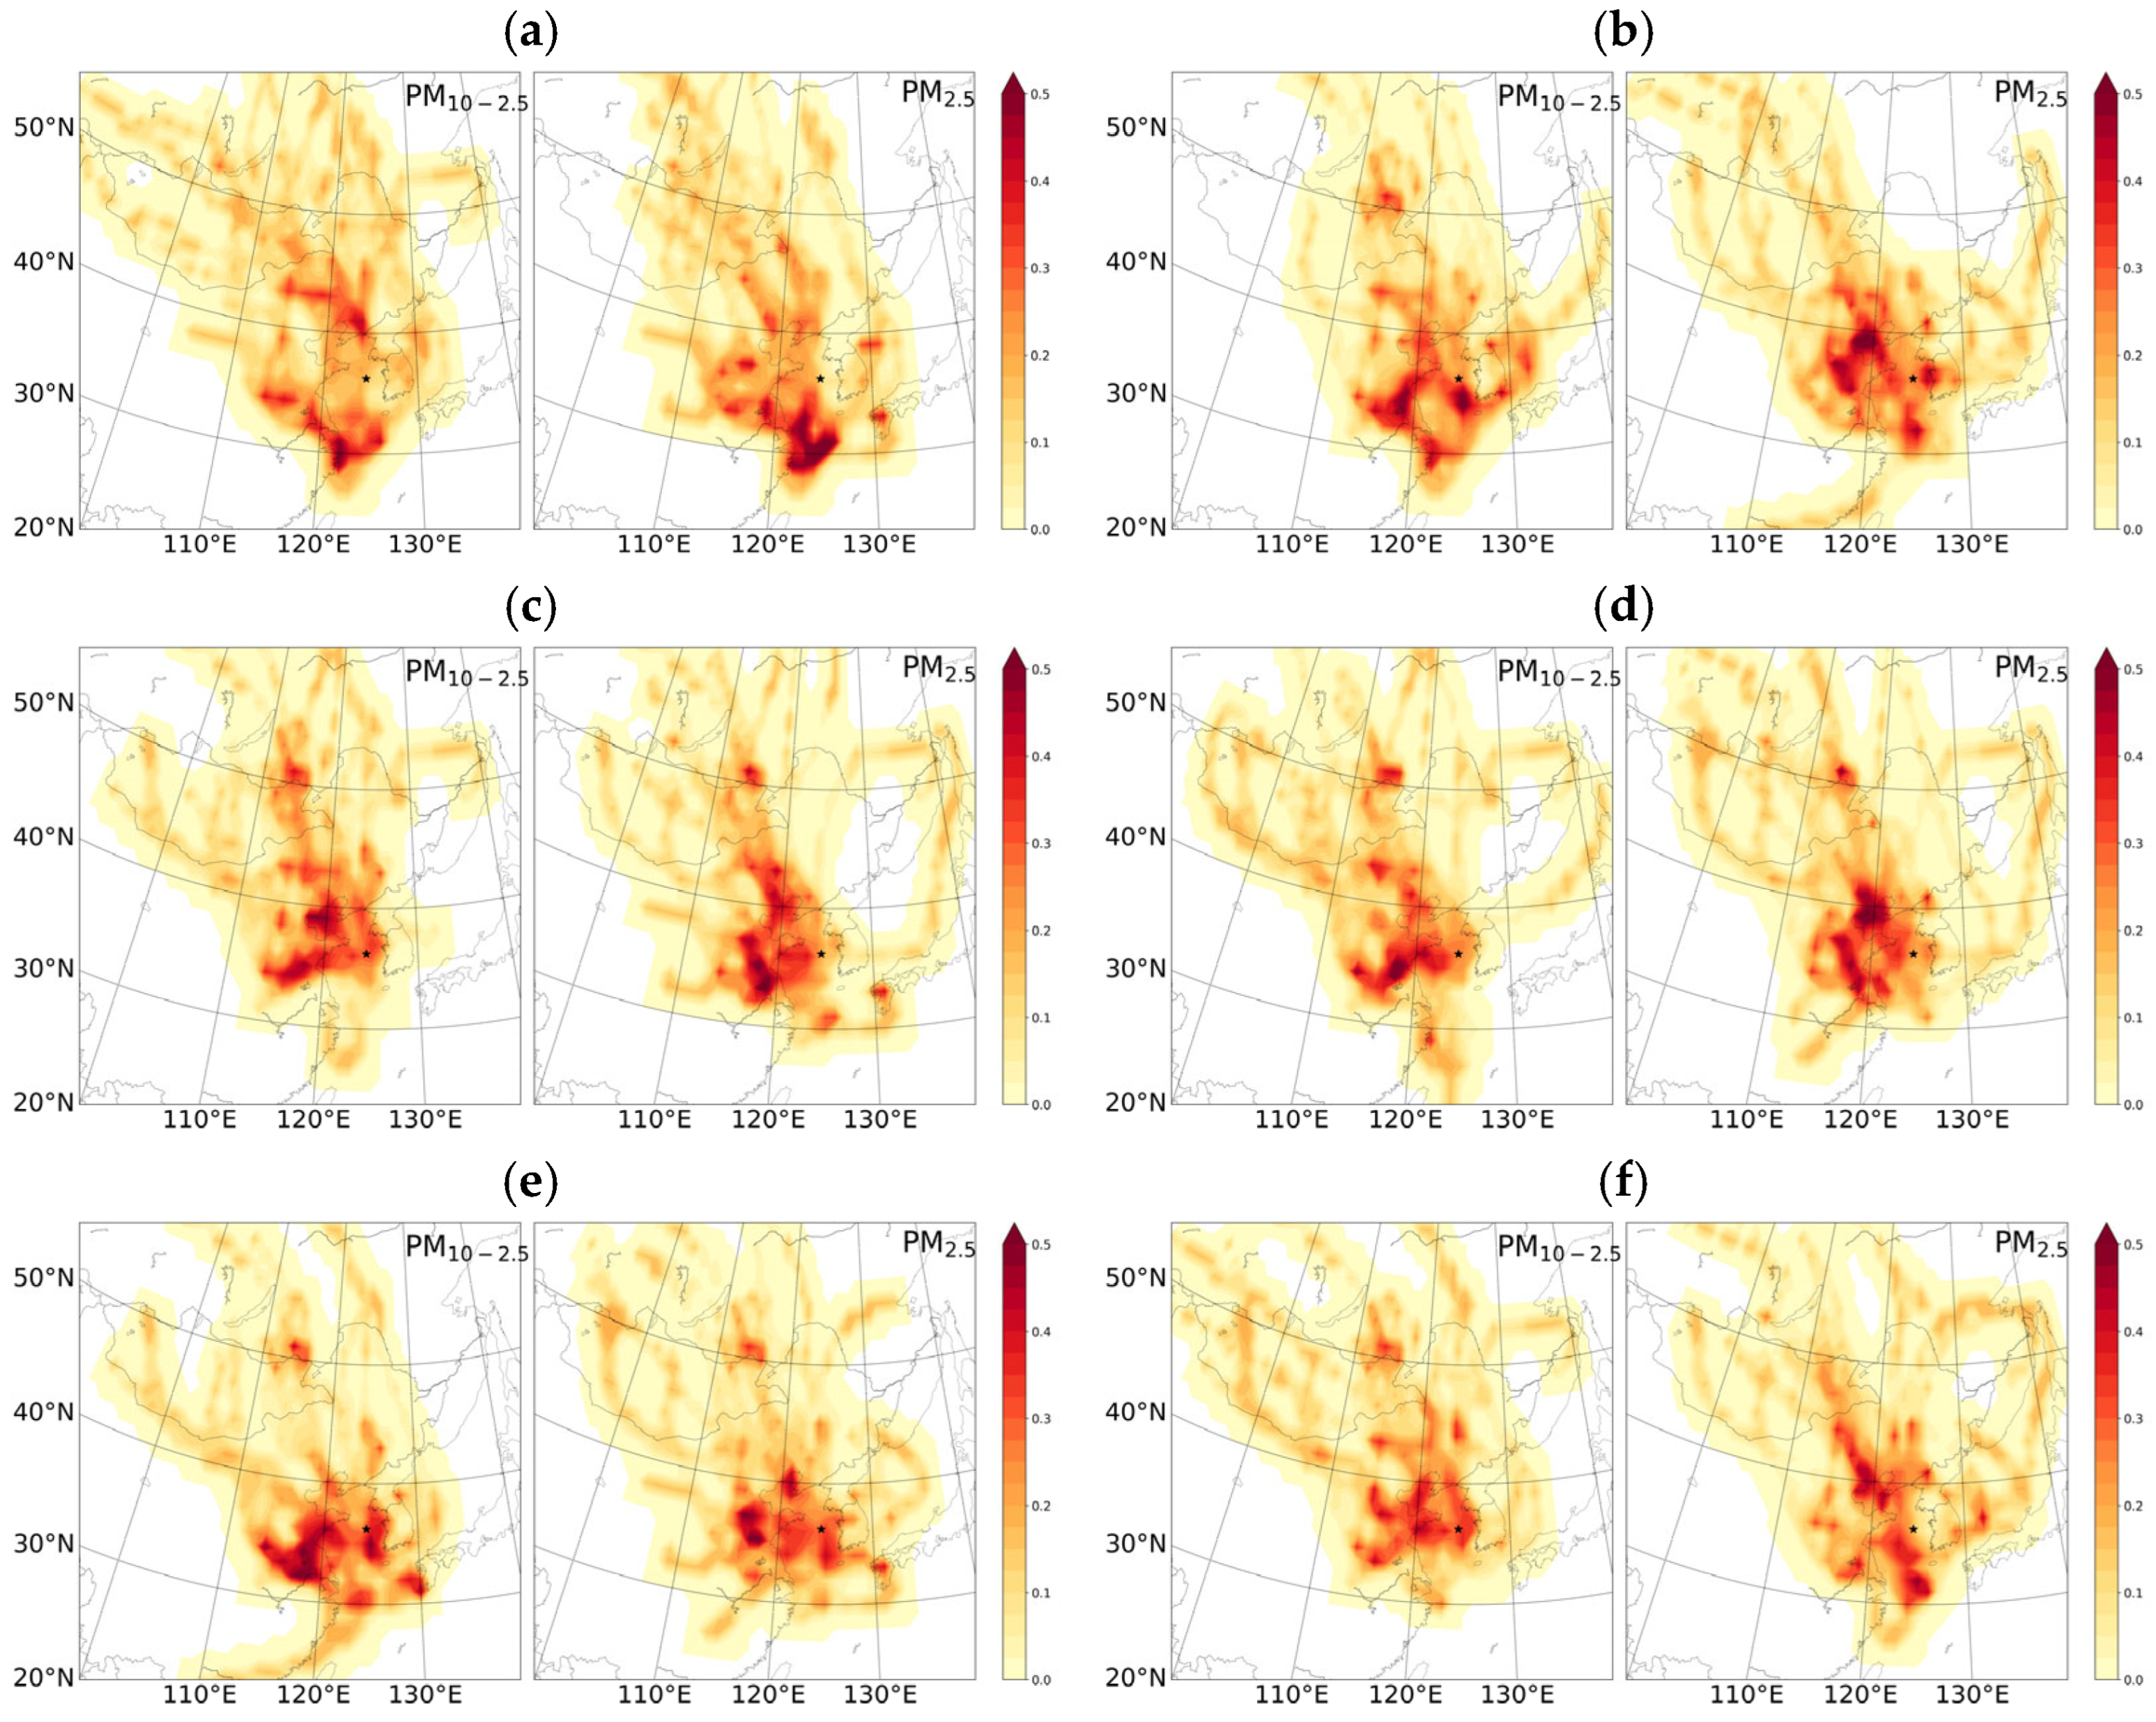
To evaluate the spatial associations of the major sources identified by DN-PMF, PSCF analysis was performed. The PSCF results were used to link source factors with air-mass transport pathways and potential source regions. Among all identified factors, six sources with relatively high contributions and clear interpretability—sea salt, secondary nitrate, soil, oil combustion, secondary sulfate, and biomass burning—were selected and presented in Figure 6.
The PSCF distribution for the sea salt factor (Figure 6a) exhibited relatively high probabilities over the coastal regions of the Yellow Sea and the East China Sea in both coarse and fine particles. This pattern suggests that sea salt particles generated over the ocean were transported by prevailing air masses and contributed to aerosol loading over the observation site. The secondary nitrate factor (Figure 6b) showed a more pronounced spatial pattern in fine particles, with elevated PSCF values over inland regions of eastern China and the Shandong Peninsula. This indicates that secondary nitrate formed in continental regions with substantial anthropogenic precursor emissions was transported over long distances to the Yellow Sea. The PSCF distribution of the soil factor (Figure 6c) displayed relatively high values in coarse particles over northern China and adjacent inland regions, including the northern part of the Shandong Peninsula. This suggests that soil-derived particles originating from inland continental regions were transported to the Yellow Sea under westerly flow conditions. In contrast, fine particles exhibited generally low PSCF values for this factor, consistent with the DN-PMF results indicating that soil sources predominantly contribute to coarse particles.
The oil combustion factor (Figure 6d) showed relatively high PSCF values in coarse particles over coastal areas of the Yellow Sea and the northern East China Sea, particularly near major shipping routes. This pattern indicates that emissions from ship combustion are more strongly reflected in coarse particles under marine transport conditions. The PSCF distribution of the secondary sulfate factor (Figure 6e) exhibited elevated values in fine particles over a broad region, including eastern China, the Shandong Peninsula, and the lower Yangtze River region. This suggests that sulfate formed in continental regions was transported over the Yellow Sea. The biomass burning factor (Figure 6f) showed relatively high PSCF values in fine particles over inland regions of central and southern China. This suggests that seasonal biomass burning activities may act as potential sources influencing fine particles over the Yellow Sea. Overall, the spatial patterns derived from PSCF analysis are consistent with the DN-PMF source apportionment results, confirming the robustness of the identified source contributions and highlighting the importance of long-range transport in shaping aerosol characteristics over the Yellow Sea.
Figure 6.
PSCF plots for the 6 sources (a–f) in coarse and fine resolutions using DN-PMF. The black stars (in (a–f)) represent the sampling sites. (a) Sea salt. (b) Secondary nitrate. (c) Soil. (d) Oil combustion. (e) Secondary sulfate. (f) Biomass burning.
4. Conclusions
This study quantitatively investigated the size-resolved chemical composition and source structure of coarse (PM10–2.5) and fine (PM2.5) particles over the Yellow Sea using ship-based observations conducted during the spring seasons from 2020 to 2024. By analyzing a five-year dataset collected over the same marine region, this study provides robust insights into interannual variability and long-range transport characteristics beyond short-term case studies.
Coarse particles were predominantly influenced by sea salt and soil sources. In particular, during the dust event in March 2021, soil-derived components reached the highest levels observed during the entire study period. In contrast, in 2024, the relative contribution of sea salt components increased, demonstrating that dominant sources can vary even within the same season across different years. Fine particles were consistently dominated by secondary nitrate and secondary sulfate throughout the observation period. In March 2023, simultaneous increases in secondary nitrate and ammonium resulted in the highest fine particle concentrations observed. These results suggest that, unlike coarse particles influenced by episodic natural inputs, fine particles are primarily governed by regional secondary formation processes and atmospheric stagnation conditions.
DN-PMF analysis identified a total of nine major sources, with eight common factors shared between coarse and fine particles, including sea salt, soil, secondary nitrate, secondary sulfate, oil combustion, biomass burning, marine biogenic, and plant growth. In coarse particles, sea salt (30.9%) and soil (15.1%) were the dominant contributors, whereas in fine particles, secondary nitrate (48.6%) and secondary sulfate (15.6%) were the most influential sources. In addition, an industry factor was uniquely identified in coarse particles, while a mobile source factor was separated only in fine particles, highlighting that subtle differences in chemical composition can lead to distinct size-dependent source structures. Furthermore, the DN-PMF approach, incorporating the ventilation coefficient, effectively reduced meteorological dilution effects and improved the robustness of source apportionment under highly variable marine atmospheric conditions.
PSCF analysis further supported the spatial validity of the DN-PMF results. Sea salt and oil combustion factors in coarse particles were associated with coastal and marine regions of the Yellow Sea and the East China Sea, while the soil factor corresponded to inland regions of northern China. In contrast, secondary nitrate, secondary sulfate, and biomass burning factors in fine particles exhibited strong associations with long-range transport from inland regions of eastern China. These findings highlight that the Yellow Sea acts as a transitional receptor region influenced by both marine emissions and continental outflow.
Overall, aerosols over the Yellow Sea exhibit a dual structure depending on particle size. Coarse particles respond sensitively to episodic natural inputs and local marine activities, whereas fine particles more directly reflect regional precursor emissions and secondary formation processes. This study provides a comprehensive size-resolved, DN-PMF-based quantitative analysis derived from five years of consistent ship-based observations, offering important scientific evidence for understanding long-range transport processes and air–sea interactions in East Asia. Future studies incorporating extended observation periods, broader seasonal coverage, and long-term trend analysis will further improve our understanding of emission changes and climate–atmosphere interactions in the region.
Author Contributions
Conceptualization, H.K. and H.J.K.; methodology, H.K.; formal analysis, H.K.; investigation, H.K.; data curation, H.K.; writing—original draft preparation, H.K.; writing—review and editing, H.J.K., J.J., H.-J.Y. and S.O.; visualization, H.K.; supervision, H.J.K.; project administration, H.J.K.; funding acquisition, H.J.K. All authors have read and agreed to the published version of the manuscript.
Funding
This research was funded by the National Institute of Meteorological Sciences (NIMS), Korea Meteorological Administration (KMA), under the project “Development of Asian Dust and Haze Monitoring and Forecasting Technology” (KMA2018-00521, 2360000118).
Institutional Review Board Statement
Not applicable.
Informed Consent Statement
Not applicable.
Data Availability Statement
The data presented in this study are available on request from the corresponding author.
Acknowledgments
The authors would like to thank the operation team of the research vessel Gisang-1 at the National Institute of Meteorological Sciences for their support during the field campaigns.
Conflicts of Interest
The authors declare no conflicts of interest.
Abbreviations
The following abbreviations are used in this manuscript:
| BDL | Below the detection limit |
| CV | Coefficients of variation |
| CDS | Copernicus Climate Data Store |
| DMS | Dimethyl sulfide |
| DN-PMF | Dispersion Normalized Positive Matrix Factorization |
| FA | Factor Analysis |
| HYSPLIT | Hybrid Single-Particle Lagrangian Integrated Trajectory |
| IDL | Instrumental detection limits |
| MLH | Mixing layer height |
| NIMS | National Institute of Meteorological Sciences |
| PM | Particulate matter |
| PMF | Positive Matrix Factorization |
| PSCF | Potential Source Contribution Function |
| PCA | Principal Component Analysis |
| VC | Ventilation coefficient |
| YES-AQ | Yellow Sea Air Quality |
References
- Seinfeld, J.H.; Pandis, S.N. Atmospheric Chemistry and Physics: From Air Pollution to Climate Change; John Wiley & Sons, Inc.: Hoboken, NJ, USA, 1998; 1326p. [Google Scholar]
- Pöschl, U. Atmospheric aerosols: Composition, transformation, climate and health effects. Angew. Chem. Int. Ed. 2005, 44, 7520–7540. [Google Scholar] [CrossRef]
- Kan, H.; London, S.J.; Chen, G.; Zhang, Y.; Song, G.; Zhao, N.; Jiang, L.; Chen, B. Differentiating the effects of fine and coarse particles on daily mortality in Shanghai, China. Environ. Int. 2007, 33, 376–384. [Google Scholar] [CrossRef] [PubMed]
- Dockery, D.W. Health Effects of Particulate Air Pollution. Ann. Epidemiol. 2009, 19, 257–263. [Google Scholar] [CrossRef]
- Dimitriou, K.; Kassomenos, P. Indicators reflecting local and transboundary sources of PM2.5 and PMCOARSE in Rome—Impacts in air quality. Atmos. Environ. 2014, 96, 154–162. [Google Scholar] [CrossRef]
- Koulouri, E.; Saarikoski, S.; Theodosi, C.; Markaki, Z.; Gerasopoulos, E.; Kouvarakis, G.; Mäkelä, T.; Hillamo, R.; Mihalopoulos, N. Chemical composition and sources of fine and coarse aerosol particles in the Eastern Mediterranean. Atmos. Environ. 2008, 42, 6542–6550. [Google Scholar] [CrossRef]
- Shi, J.H.; Zhang, Y.; Gao, H.W.; Zhang, J. Characteristics and sources of atmospheric aerosols over the East China Sea. Acta Sci. Circumstantiae 2011, 31, 1750–1757. [Google Scholar] [CrossRef]
- Jia, H.; Quaas, J. Nonlinearity of the cloud response postpones climate penalty of mitigating air pollution in polluted regions. Nat. Clim. Change 2023, 13, 943–950. [Google Scholar] [CrossRef]
- Ryoo, S.B.; Kim, Y.P.; Kim, H.C.; Lee, J.B.; Kim, B.U.; Bae, C.H. Effects of seasonal management programs on PM2.5 in Seoul and Beijing using dispersion-normalized positive matrix factorization (DN-PMF): Collaborative efforts from the Korea–China joint research. Environ. Int. 2024, 191, 108970. [Google Scholar] [CrossRef]
- Hsu, S.C.; Lin, F.J.; Jeng, W.L. Seawater solubility of natural and anthropogenic metals within ambient aerosols collected from Taiwan coastal sites. Atmos. Environ. 2005, 39, 3989–4001. [Google Scholar] [CrossRef]
- Choi, E.; Jeon, K.; Lee, Y.S.; Heo, J.; Ryoo, I.; Kim, T.; Zhou, C.; Hopke, P.K.; Yi, S.M. Apportioning and Locating PM2.5 Sources Affecting Coastal Cities: Ulsan in South Korea and Dalian in China. Aerosol Air Qual. Res. 2024, 24, 240031. [Google Scholar] [CrossRef]
- Huang, Z.Q.; Ji, W.D.; Tang, R.K.; Huang, R.T.; Yang, X.L.; Yu, T.; Zhang, G.X. Chemical composition of marine aerosol in Western Pacific East Indian Ocean Southern Ocean and Prydz Bay and its source discrimination. J. Oceanogr. Taiwan Strait 2003, 22, 505–517. [Google Scholar]
- Vallius, M.; Lanki, T.; Tiittanen, P.; Koistinen, K.; Ruuskanen, J.; Pekkanen, J. Source apportionment of urban ambient PM2.5 in two successive measurement campaigns in Helsinki, Finland. Atmos. Environ. 2003, 37, 615–623. [Google Scholar] [CrossRef]
- Dai, Q.; Liu, B.; Bi, X.; Wu, J.; Liang, D.; Zhang, Y.; Feng, Y.; Hopke, P.K. Dispersion normalized PMF provides insights into the significant changes in source contributions to PM2.5 after the CoviD-19 outbreak. Environ. Sci. Technol. 2020, 54, 9917–9927. [Google Scholar] [CrossRef]
- Song, L.; Dai, Q.; Feng, Y.; Hopke, P.K. Estimating uncertainties of source contributions to PM2.5 using moving window evolving dispersion normalized PMF. Environ. Pollut. 2021, 286, 117576. [Google Scholar] [CrossRef] [PubMed]
- Cheong, J.; Kim, H.; Kim, B.U.; Kim, H.C.; Bae, C.; Kim, S. Source apportionment of PM2.5 using dispersion-normalized positive matrix factorization (DN-PMF) in three megacities on the western coast of South Korea. Air Qual. Atmos. Health 2024, 17, 2237–2254. [Google Scholar] [CrossRef]
- Gao, Y.; Arimoto, R.; Duce, R.A.; Lee, D.S.; Zhou, M.Y. Input of Atmospheric Trace Elements and Mineral Matter to the Yellow Sea During the Spring of a Low-Dust Year. J. Geophys. Res. 1992, 97, 3767–3777. [Google Scholar] [CrossRef]
- Zhang, G.; Zhang, J.; Liu, S. Characterization of nutrients in the atmospheric wet and dry deposition observed at the two monitoring sites over Yellow Sea and East China Sea. J. Atmos. Chem. 2007, 57, 41–57. [Google Scholar] [CrossRef]
- Jeong, M.J.; Yoo, H.-J.; Ko, H.-J.; Oh, S.M. Characteristics of Aerosol Observed during YES-AQ Campaign in 2023 based on Vessel and Aircraft Measurement. Par. Aerosol Res. 2024, 20, 129–138. [Google Scholar] [CrossRef]
- Ko, H.-J.; Kang, C.-H.; Cha, J.W.; Ryoo, S.-B. Concentration and Pollution Characteristics of Secondary Aerosol Components over the Yellow Sea by Ship-Borne Observation in Spring, 2015. Atmosphere 2017, 27, 29–40. [Google Scholar] [CrossRef]
- Polissar, A.V.; Hopke, P.K.; Paatero, P.; Malm, W.C.; Sisler, J.F. Atmospheric aerosol over Alaska 2. Elemental composition and sources. J. Geophys. Res. Atmos. 1998, 103, 19045–19057. [Google Scholar] [CrossRef]
- Hwang, I.J.; Hopke, P.K. Comparison of source apportionments of fine particulate matter at two san jose speciation trends network sites. J. Air Waste Manag. Assoc. 2006, 56, 1287–1300. [Google Scholar] [CrossRef] [PubMed]
- Paatero, P.; Hopke, P.K. Discarding or downweighting high-noise variables in factor analytic models. Anal. Chim. Acta 2003, 490, 277–289. [Google Scholar] [CrossRef]
- Brown, S.G.; Eberly, S.; Paatero, P.; Norris, G.A. Methods for estimating uncertainty in PMF solutions: Examples with ambient air and water quality data and guidance on reporting PMF results. Sci. Total Environ. 2015, 518–519, 626–635. [Google Scholar] [CrossRef]
- Millán-Vázquez, F.; Sosa-Echevería, R.; Alarcón-Jiménez, A.L.; Figueroa-Lara, J.d.J.; Torres-Rodríguez, M.; Valle-Hernández, B.L.; Mugica-Álvarez, V. Temporal Variation and Potential Sources of Water-Soluble Inorganic Ions in PM2.5 in Two Sites of Mexico City. Atmosphere 2023, 14, 1585. [Google Scholar] [CrossRef]
- Su, L.; Yuan, Z.; Fung, J.C.H.; Lau, A.K.H. A comparison of HYSPLIT backward trajectories generated from two GDAS datasets. Sci. Total Environ. 2015, 506–507, 527–537. [Google Scholar] [CrossRef] [PubMed]
- Begum, B.A.; Biswas, S.K.; Markwitz, A.; Hopke, P.K. Identification of sources of fine and coarse particulate matter in Dhaka, Bangladesh. Aerosol Air Qual. Res. 2010, 10, 345–353. [Google Scholar] [CrossRef]
- Heo, J.; McGinnis, J.E.; de Foy, B.; Schauer, J.J. Identification of potential source areas for elevated PM2.5, nitrate and sulfate concentrations. Atmos. Environ. 2013, 71, 187–197. [Google Scholar] [CrossRef]
- Ho, K.F.; Lee, S.C.; Chan, C.K.; Yu, J.C.; Chow, J.C.; Yao, X.H. Characterization of chemical species in PM2.5 and PM10 aerosols in Hong Kong. Atmos. Environ. 2003, 37, 31–39. [Google Scholar] [CrossRef]
- Kchih, H.; Perrino, C.; Cherif, S. Investigation of desert dust contribution to source apportionment of PM10 and PM2.5 from a southern Mediterranean coast. Aerosol Air Qual. Res. 2015, 15, 454–464. [Google Scholar] [CrossRef]
- Calvo, A.I.; Alves, C.; Castro, A.; Pont, V.; Vicente, A.M.; Fraile, R. Research on aerosol sources and chemical composition: Past, current and emerging issues. Atmos. Res. 2013, 120–121, 1–28. [Google Scholar] [CrossRef]
- Karanasiou, A.A.; Sitaras, I.E.; Siskos, P.A.; Eleftheriadis, K. Size distribution and sources of trace metals and n-alkanes in the Athens urban aerosol during summer. Atmos. Environ. 2007, 41, 2368–2381. [Google Scholar] [CrossRef]
- Gupta, D.; Eom, H.-J.; Cho, H.-R.; Ro, C.-U. Hygroscopic behavior of NaCl–MgCl2 mixture particles as nascent sea-spray aerosol surrogates and observation of efflorescence during humidification. Atmos. Chem. Phys. 2015, 15, 11273–11290. [Google Scholar] [CrossRef]
- Waked, A.; Favez, O.; Alleman, L.Y.; Piot, C.; Petit, J.E.; Delaunay, T.; Verlinden, E.; Golly, B.; Besombes, J.L.; Jaffrezo, J.L.; et al. Source apportionment of PM10 in a north-western Europe regional urban background site (Lens, France) using positive matrix factorization and including primary biogenic emissions. Atmos. Chem. Phys. 2014, 14, 3325–3346. [Google Scholar] [CrossRef]
- Khan, J.Z.; Sun, L.; Tian, Y.; Shi, G.; Feng, Y. Chemical characterization and source apportionment of PM1 and PM2.5 in Tianjin, China: Impacts of biomass burning and primary biogenic sources. J. Environ. Sci. 2021, 99, 196–209. [Google Scholar] [CrossRef] [PubMed]
- Chow, J.C.; Liu, C.S.; Cassmassi, J.; Watson, J.G.; Zhiqiang, L.; Pritchett, L.C. A neighborhood-scale Study of PM10 Source Contributions in Rubidoux, Calfornia. Atmos. Environ. Part A Gen. Top. 1992, 26, 693–706. [Google Scholar] [CrossRef]
- Nava, S.; Calzolai, G.; Chiari, M.; Giannoni, M.; Giardi, F.; Becagli, S.; Severi, M.; Traversi, R.; Lucarelli, F. Source apportionment of PM2.5 in Florence (Italy) by PMF analysis of aerosol composition records. Atmosphere 2020, 11, 484. [Google Scholar] [CrossRef]
- Hopke, P.K. Receptor Modeling in Environmental Chemistry; John Wiley & Sons: New York, NY, USA, 1985. [Google Scholar]
- Wu, Y.S.; Fang, G.C.; Lee, W.J.; Lee, J.F.; Chang, C.C.; Lee, C.Z. A review of atmospheric fine particulate matter and its associated trace metal pollutants in Asian countries during the period 1995–2005. J. Hazard. Mater. 2007, 143, 511–515. [Google Scholar] [CrossRef]
- Viana, M.; Amato, F.; Alastuey, A.; Querol, X.; Moreno, T.; Dos Santos, S.G.; Herce, M.D.; Fernández-Patier, R. Chemical tracers of particulate emissions from commercial shipping. Environ. Sci. Technol. 2009, 43, 7472–7477. [Google Scholar] [CrossRef]
- Jeong, J.H.; Shon, Z.H.; Kang, M.; Song, S.K.; Kim, Y.K.; Park, J.; Kim, H. Comparison of source apportionment of PM2.5 using receptor models in the main hub port city of East Asia: Busan. Atmos. Environ. 2017, 148, 115–127. [Google Scholar] [CrossRef]
- Schembari, C.; Bove, M.C.; Cuccia, E.; Cavalli, F.; Hjorth, J.; Massabò, D.; Nava, S.; Udisti, R.; Prati, P. Source apportionment of PM10 in the Western Mediterranean based on observations from a cruise ship. Atmos. Environ. 2014, 98, 510–518. [Google Scholar] [CrossRef]
- Hwang, I.J.; Hopke, P.K. Estimation of source apportionment and potential source locations of PM2.5 at a west coastal IMPROVE site. Atmos. Environ. 2007, 41, 506–518. [Google Scholar] [CrossRef]
- Paulot, F.; Wunch, D.; Crounse, J.D.; Toon, G.C.; Millet, D.B.; Decarlo, P.F.; Vigouroux, C.; Deutscher, N.M.; Abad, G.G.; Notholt, J.; et al. Importance of secondary sources in the atmospheric budgets of formic and acetic acids. Atmos. Chem. Phys. 2011, 11, 1989–2013. [Google Scholar] [CrossRef]
- Seco, R.; Peñuelas, J.; Filella, I. Short-chain oxygenated VOCs: Emission and uptake by plants and atmospheric sources, sinks, and concentrations. Atmos. Environ. 2007, 41, 2477–2499. [Google Scholar] [CrossRef]
- Keene, W.C.; Galloway, J.N. The biogeochemical cycling of formic and acetic acids through the troposphere: An overview of current understanding. Tellus B 1988, 40, 322–334. [Google Scholar] [CrossRef]
- Von Glasow, R.; Crutzen, P.J. Atmospheric Chemistry and Physics Model study of multiphase DMS oxidation with a focus on halogens. Atmos. Chem. Phys. 2004, 4, 589–608. [Google Scholar] [CrossRef]
- Park, J.; Kim, H.; Kim, Y.; Heo, J.; Kim, S.W.; Jeon, K.; Yi, S.M.; Hopke, P.K. Source apportionment of PM2.5 in Seoul, South Korea and Beijing, China using dispersion normalized PMF. Sci. Total Environ. 2022, 833, 155056. [Google Scholar] [CrossRef]
- Liu, X.; Chiang, K.P.; Liu, S.M.; Wei, H.; Zhao, Y.; Huang, B.Q. Influence of the Yellow Sea Warm Current on phytoplankton community in the central Yellow Sea. Deep. Sea Res. Part I Oceanogr. Res. Pap. 2015, 106, 17–29. [Google Scholar] [CrossRef]
- Dabek-Zlotorzynska, E.; Celo, V.; Ding, L.; Herod, D.; Jeong, C.H.; Evans, G.; Hilker, N. Characteristics and sources of PM2.5 and reactive gases near roadways in two metropolitan areas in Canada. Atmos. Environ. 2019, 218, 116980. [Google Scholar] [CrossRef]
- Hao, Y.; Gao, C.; Deng, S.; Yuan, M.; Song, W.; Lu, Z.; Qiu, Z. Chemical characterisation of PM2.5 emitted from motor vehicles powered by diesel, gasoline, natural gas and methanol fuel. Sci. Total Environ. 2019, 674, 128–139. [Google Scholar] [CrossRef]
- Tsai, J.H.; Chen, S.J.; Lin, S.L.; Huang, K.L.; Hsueh, C.K.; Lin, C.C.; Li, P.M. Emissions of PM2.5-bound polycyclic aromatic hydrocarbons and metals from a diesel generator fueled with biodiesel converted from used cooking oil. Aerosol Air Qual. Res. 2019, 19, 1555–1565. [Google Scholar] [CrossRef]
Disclaimer/Publisher’s Note: The statements, opinions and data contained in all publications are solely those of the individual author(s) and contributor(s) and not of MDPI and/or the editor(s). MDPI and/or the editor(s) disclaim responsibility for any injury to people or property resulting from any ideas, methods, instructions or products referred to in the content. |
© 2026 by the authors. Licensee MDPI, Basel, Switzerland. This article is an open access article distributed under the terms and conditions of the Creative Commons Attribution (CC BY) license.