


Abstract
To better understand the characteristics and causes of acid rain pollution in Huangshan City, China, in the context of reduced atmospheric pollutant emissions, this study systematically analyzes precipitation monitoring data from Huangshan City for the period 2013–2025. The analytical methods included volume-weighted mean, neutralization factor, and linear regression analysis. The results indicate that, with 2017 as a turning point, acid rain in Huangshan City transitioned from high-level fluctuations to a stabilization phase at medium-to-low levels. However, the annual mean pH remained below 5.6, indicating that the acid rain problem persists. Regarding pollutant emission reductions, sulfur dioxide (SO2) control has achieved significant results, but nitrogen oxide (NOx) pollution remains prominent due to factors such as a sharp increase in vehicle ownership. Analysis of the chemical composition of precipitation shows that the SO42−/NO3− ratio decreased from 4.09 to 0.92, and the acid rain type has shifted from sulfate-dominated to mixed sulfate-nitrate-dominated. In precipitation, highly specific ion pairings are observed: Ca2+ with SO42− (r = 0.989) and NH4+ with NO3− (r = 0.839). These two ion pairs together account for 81.4% of the total cations, forming two independent neutralization mechanisms—below-cloud and in-cloud—which explains the relative stability of precipitation pH despite a decline in total ion concentration. Furthermore, interannual variability in precipitation amount, particularly extreme wet events, is a key external factor driving fluctuations in acid rain frequency under stable emission conditions. The dominant driver of acid rain frequency variability has shifted from emission-dominated to precipitation-dominated.
1. Introduction
Since the Industrial Revolution, acid rain has evolved into a global environmental problem, causing frequent ecological disasters and sustained economic losses [1]. Acid rain is acidic deposition generated by wet (rain, snow, hail, fog) and dry (gaseous and particulate) acidic substances in the atmosphere [2,3]. Generally, human activities such as fossil fuel combustion, industrial production, and automobile exhaust emission release acidic substances, including sulfur dioxide (SO2) and nitrogen oxides (NOx) [4]. Meanwhile, natural processes such as volcanic eruptions, forest fires, biological decomposition, sea spray, and lightning also emit NOx and sulfur-containing gases [5]. Acid rain may lead to acidification of aquatic ecosystems and soils, reduced crop yields, shrinking forest habitats, and corrosion of various infrastructure [6]. Therefore, analyzing the chemical composition of precipitation helps to explain atmospheric quality conditions and provides a basis for identifying different potential associated factors [7].
Over the past three decades, China’s economic growth, accompanied by a significant increase in energy consumption, has made it the world’s third-largest acid deposition area after North America and Central Europe [7]. According to the National Ecological and Environmental Quality Bulletin released by China in 2020, the area with acid rain in China was about 466,000 square kilometers, accounting for 4.8% of the national land area. It is mainly distributed in the area south of the Yangtze River and east of the Yunnan-Guizhou Plateau, including most areas of Zhejiang and Shanghai, northern Fujian, central Jiangxi, east-central Hunan, central Guangdong, southern Guangxi, and southern Chongqing [8]. Huangshan is a typical representative of the acid rain area south of the Yangtze River, which has been significantly affected by acid deposition for a long time, with a high degree of acid rain pollution, posing a continuous pressure on the conservation of forest ecosystems and cultural heritage in this area. The formation of acid rain in this region exhibits multiple superimposed factors. First, Huangshan City is located downwind of the economically developed industrial zone in eastern coastal China (the Yangtze River Delta). Under the influence of northerly airflows in winter, it readily receives transboundary transport of pollutants from highly polluted areas such as southern Jiangsu and northern Zhejiang. Second, the city’s basin topography, surrounded by mountains, inhibits horizontal dispersion of pollutants; coupled with frequent temperature inversions, acidic precursors accumulate in the lower atmosphere. Third, the subtropical monsoon humid climate brings abundant precipitation and high humidity, providing favorable conditions for gas-phase and aqueous-phase oxidation of SO2 and NOx. Fourth, intensive agricultural activities in both local and surrounding areas emit high concentrations of NH3, which not only participate in neutralization processes but also influence secondary aerosol formation. The superposition of these geographical, meteorological, and anthropogenic factors imposes significant acid deposition stress on Huangshan City. However, current studies on acid deposition in Huangshan mainly focus on descriptive analyses of pollution characteristics, while investigations into the impacts of pollution control measures and dynamic changes in ambient air quality on precipitation chemistry remain relatively lacking [9,10,11].
Huangshan is a world natural and cultural heritage site, and its ecological environment quality has attracted much attention. Although the comprehensive air quality index of Huangshan City has long ranked among the top in Anhui Province, and the concentrations of major pollutants such as PM2.5, PM10, and SO2 are generally lower than the national average, the problem of acid rain pollution in this area remains prominent [12]. This study aims to investigate the main causes of the continued occurrence of acid rain in Huangshan City against the backdrop of an overall decline in major atmospheric pollutant concentrations and to analyze its temporal changes and potential associations using different methods.
2. Methodology
2.1. Study Area
Huangshan City is located at the southernmost tip of Anhui Province, between 117°02′ E 118°55′ E and 29°24′ N 30°24′ N [13]. In terms of topographic pattern, Huangshan City is located in a typical mountain–basin terrain with a variety of landforms, dominated by medium and low mountains and hills. The altitude of mountain bodies is generally 400–500 m, with numerous peaks above 1000 m [14]. This basin structure, surrounded by mountains and low-lying in the middle, lays the foundation for the formation of local meteorological conditions and is prone to inducing mountain temperature inversions and mountain–valley wind circulation. In terms of soil and geology, most of the medium and low mountains in Huangshan City are covered with yellow soil and mountain yellow-brown soil, with thick soil layers and high gravel content. The hilly areas are mostly red soil and purple soil, with heavy texture, acidity, and poor fertility. The piedmont basins and plain valleys are mostly sandy loam, and both sides of rivers and streams are mostly alluvial soil. Climatically, Huangshan City belongs to a typical subtropical monsoon humid climate zone, characterized by mild and rainy weather and distinct four seasons [15]. The annual average temperature is 6–15 °C, and most areas have no severe cold in winter, with a frost-free period of 236 days. Benefiting from the combined effect of monsoon circulation and basin terrain, precipitation is abundant, with an average annual precipitation of 1670 mm and a maximum of 2708 mm. Precipitation is mostly concentrated from May to August. Adjacent to industrial provinces such as Zhejiang and Jiangxi and located on the atmospheric pollutant transport channel, Huangshan City is vulnerable to external pollutants.
2.2. Data Sources and Chemical Analysis
Based on precipitation and pH data from 2013 to 2025, combined with conductivity and water-soluble ion concentration data from the same period, a systematic statistical analysis was conducted on precipitation samples collected at 3 acid rain monitoring stations affiliated with the Huangshan Environmental Monitoring Central Station from 2013 to 2025. The monitoring indicators included precipitation, pH, conductivity, water-soluble anions (F−, Cl−, NO3−, and SO42−), and water-soluble cations (Na+, NH4+, K+, Mg2+, and Ca2+). The three monitoring stations are located at No. 89 East Huangshan Road, No. 89 Yan’an Road, and Fenghu Yanliu. Among them, No. 89 East Huangshan Road and No. 89 Yan’an Road are located in the main urban area (Tunxi District), and Fenghu Yanliu is located in Xiuning County. Precipitation was collected by an intelligent acid deposition sampler (ZJC-V, Zhejiang Hengda Instrument and Meter Co., Ltd., Hangzhou, China); pH value was determined by a portable multi-parameter water quality analyzer (Multi 3630 IDS, WTW, Munich, Germany); conductivity was measured by a conductivity meter (DDSJ-308A, Shanghai Leici Instrument Co., Shanghai, China); and the concentrations of various anions and cations were analyzed by an ion chromatograph (ICS-1000, Dionex, Sunnyvale, CA, USA). The collection, treatment, and determination of all samples strictly followed the Technical Specifications for Environmental Monitoring (HJ/T 165-2004) [16] to ensure the accuracy and reliability of the data. In terms of data processing, the average precipitation pH value was calculated by the hydrogen ion concentration-rainfall weighted method, and acid rain frequency was defined as the proportion of precipitation samples with a pH value less than 5.6.
2.3. Data Analysis
2.3.1. Volume-Weighted Average Concentration
The volume-weighted average concentration of major ions in precipitation is a core indicator for accurately evaluating the chemical composition of precipitation and wet deposition flux [17]. Compared with the simple arithmetic average, this method can more scientifically characterize the chemical characteristics of precipitation and its deposition effect by considering the differences in precipitation volume of different precipitation events. Its main calculation formula is as follows:
where is the volume-weighted average concentration of a certain ion in the calculation period (μeq/L), is the concentration of the ion in the i-th precipitation event (μeq/L), is the precipitation volume of the i-th precipitation event (mm), and n is the total number of precipitation events in the calculation period.
2.3.2. Neutralization Factor
The neutralization capacity of various alkaline ions in rainwater can be estimated by the neutralization factor (NF) [18]. The specific calculation formula is
where is the equivalent concentration of alkaline ions (Ca2+, NH4+, Mg2+) (μeq/L), is the equivalent concentration of SO42− (μeq/L), and is the equivalent concentration of NO3− (μeq/L).
2.3.3. Ion Balance Check and Data Quality Control
To ensure the reliability of the precipitation ion analysis data, the ion balance error (CBE) was calculated for each precipitation sample. The calculation formula is
where is the sum of sodium ions, potassium ions, calcium ions, magnesium ions, and ammonium ions, is the sum of fluoride ions, chloride ions, sulfate ions, and nitrate ions.
The samples with |CBE| ≤ 10% are defined as having “acceptable” data quality [19].
The method detection limits (MDLs) for each ion are as follows: SO42− mg/L, NO3− mg/L, NH4+ mg/L, Ca2+ mg/L, Mg2+ mg/L, Na+ mg/L, K+ mg/L, Cl− mg/L, F− mg/L. For samples with concentrations below the MDL, half of the MDL (MDL/2) was used as a substitute when calculating volume-weighted mean concentrations.
3. Results and Discussion
3.1. Atmospheric Pollutant Emissions
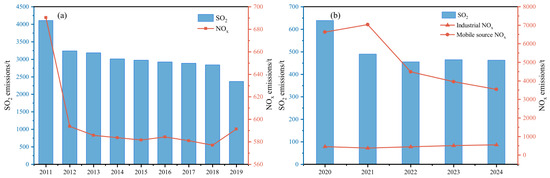
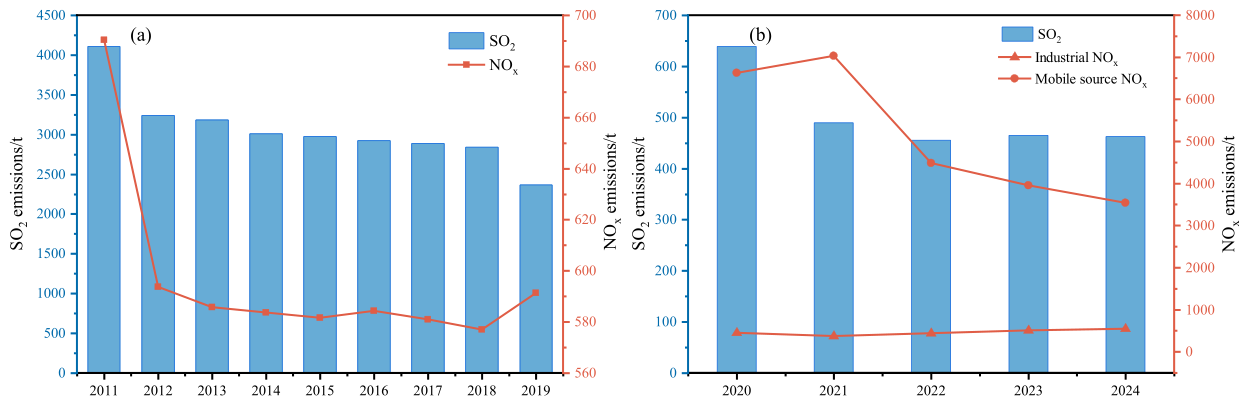
The annual emission changes in SO2 and NOx in the atmosphere of Huangshan City from 2011 to 2024 are shown in Figure 1a,b. Among them, the SO2 and NOx emission data used in the study were sourced from the Ecological Environment Statistical Yearbook provided by the Huangshan Municipal Bureau of Ecology and Environment. The emissions from 2011 to 2019 were calculated based on the coefficients of the first national pollution source census, and those from 2020 to 2024 were calculated based on the coefficients of the second national pollution source census. It can be seen from the figures that SO2 emissions decreased year by year and gradually stabilized at a low level of about 460 tons per year, while NOx emissions remained stable at a high level. This variation trend reflects that China has achieved remarkable results in controlling SO2 during the 12th Five-Year Plan period, and although NOx control has achieved certain results, pollution is still at a high level [20].
Figure 1.
(a) Total emissions of SO2 and NOx from 2011 to 2019; (b) Emissions of SO2, industrial NOx, and mobile source NOx from 2020 to 2024.
From 2021 to 2024, SO2 emissions have been controlled at an extremely low level of 460–490 tons, no longer being the main contradiction leading to acid rain. On the contrary, the total NOx emissions are still large, among which industrial source NOx emissions show an increasing trend year by year, while mobile sources (including motor vehicles and machinery, etc.) NOx emissions show a decreasing trend year by year. Nevertheless, mobile source emissions still occupy an absolute dominant position, accounting for as high as 80–90%, and their annual fluctuations are mainly affected by changes in mobile source emissions.
According to the Huangshan Statistical Yearbook, the motor vehicle ownership in Huangshan City increased from 118,900 in 2013 to 387,900 in 2024, with an increase of about 226%. The rapid increase in the number of motor vehicles is the most direct reason why mobile source NOx emissions are much higher than industrial source emissions, and also a key practical factor leading to the failure to fundamentally solve the acid rain problem and the continuous fluctuation of acid rain frequency at medium and low levels (50–70%). At the same time, more vehicles mean more continuous and dispersed NOx emissions, potentially making the occurrence of acid rain more susceptible to the randomness of meteorological diffusion conditions.
3.2. Interannual Variation Characteristics of Acid Rain
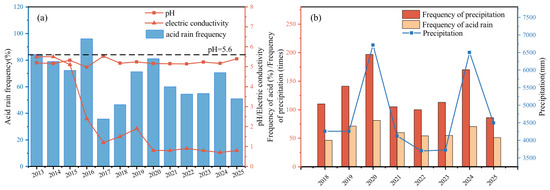
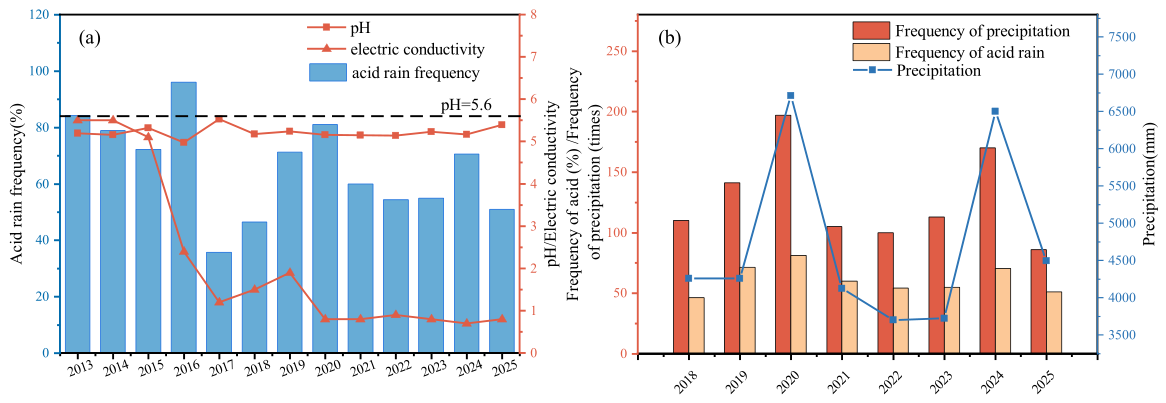
This study focuses on the precipitation pH value, electrical conductivity (EC), and acid rain frequency in Huangshan City from 2013 to 2025, and the changes in these indicators are shown in Figure 2a. The Action Plan for Air Pollution Prevention and Control (the Ten Air Pollution Prevention and Control Measures) issued by China in 2013 has played a significant regulatory role in the decline of atmospheric pollutant concentrations and the evolution of composite pollution characteristics in China through the implementation of systematic emission reduction measures [12,21], and the changes in relevant indicators in Huangshan City also show obvious phased characteristics under this influence. It can be clearly seen from Figure 2a that 2013–2016 was a period of high-level fluctuations, during which the average acid rain frequency was about 78%, and the histogram shows that its value was high with a large fluctuation range. The line chart of pH value shows a low and frequently fluctuating state with an annual average of about 5.01, within the acid rain range (pH < 5.6). The line of conductivity is also at a high level, indicating a high total concentration of dissolved ions in precipitation. The year 2017 was a turning point, with a cliff-like drop in acid rain frequency in Figure 2a, which is exactly consistent with the final assessment and conclusion time of the Ten Air Pollution Prevention and Control Measures nationwide in 2017 [22]. The line of pH value rose significantly, indicating a weakening of precipitation acidity; the line of conductivity also decreased significantly. This series of changes indicates that the implementation of the Ten Air Pollution Prevention and Control Measures has achieved obvious results in Huangshan City, and acid rain pollution has begun to enter a controlled stage. From 2018 to 2025 was a period of stabilization at medium and low levels. During 2018–2025, the pH value line stabilized in a slightly acidic but non-strongly acidic range, and the conductivity line stabilized at an extremely low level below 1.0 μS/cm. This shows that the acid rain pollution situation in Huangshan City has been further improved and stabilized. However, during this period, the frequency of acid rain fluctuated considerably. As can be seen from Figure 2b, precipitation amount and acid rain frequency exhibited highly synchronized interannual variability. The years 2020 and 2024 were two notable peak years for precipitation (reaching 6711 mm and 6500 mm, respectively), with corresponding peaks in acid rain frequency (81.1% and 70.5%). In contrast, during 2022–2023, precipitation remained at a relatively low level (approximately 3700 mm), and the acid rain frequency stabilized at a lower level of 54–55%. A similar relationship was also observed between rainfall frequency and acid rain frequency. This indicates that during a plateau period when emission intensities were relatively stable, interannual variability in precipitation, especially extreme wet events, served as a key external factor driving anomalous increases in acid rain frequency [23,24].
Figure 2.
(a) Changes in precipitation pH, conductivity, and acid rain frequency from 2013 to 2025; (b) changes in rainfall frequency, acid rain frequency, and precipitation amount from 2018 to 2025.
In summary, through the analysis of Figure 2, we can clearly see that the interannual evolution of acid rain in Huangshan City presents three stages: “high-level fluctuation”, “policy turning point”, and “stabilization at medium and low levels”, and in the current stage, the occurrence of acid rain is more sensitive to precipitation.
3.3. Seasonal Variation Characteristics of Acid Rain
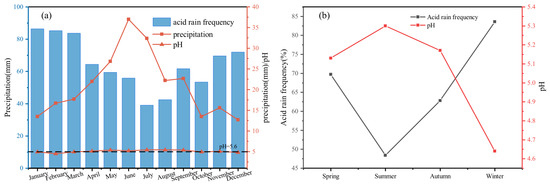
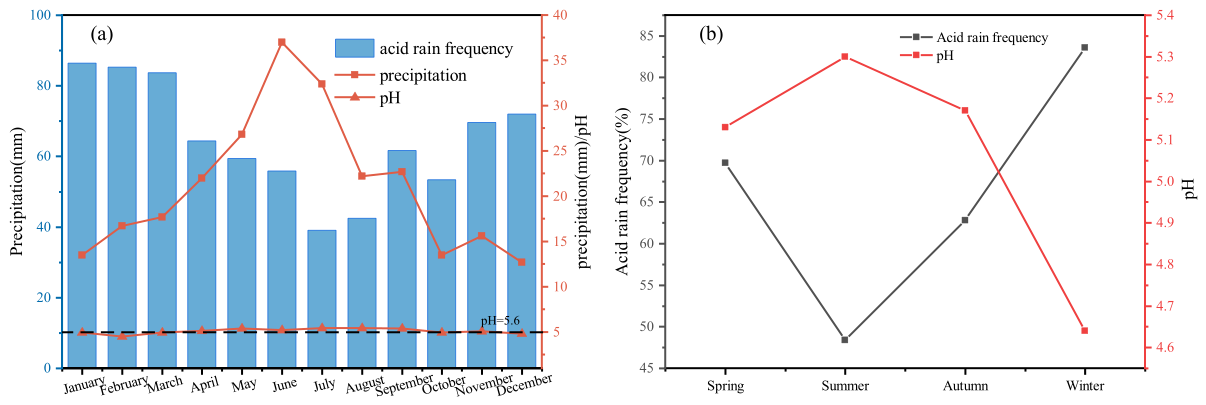
The relationships between acid rain frequency, pH value, and precipitation volume with months and seasons in Huangshan are shown in Figure 3. It can be seen from the figure that precipitation volume fluctuates greatly in different months, with the highest values in June and July and the lowest values in November and December; acid rain frequency also changes in different months, with the highest value in May and the lowest values in January and February; the pH value is relatively stable but slightly decreases in June. In terms of seasons, acid rain frequency is the highest in winter with the least precipitation and the lowest pH value; acid rain frequency is the lowest in summer with the highest precipitation and the highest pH value. The seasonal variation characteristics of acid rain in Huangshan are restricted by multiple factors. On a macro scale, the seasonal variation in acid rain in Huangshan is mainly dominated by the changes in pollutant transport paths caused by the East Asian monsoon circulation and the differences in the sources of in-cloud neutralization substances, reflecting the typical characteristics of acid rain at alpine background stations in eastern China with the change in atmospheric circulation [25]. Specifically, southeasterly winds prevail in summer, and air masses mainly come from the ocean, which are relatively clean and contain more alkaline ions, increasing alkaline substances in precipitation. At the same time, abundant rainfall has a significant dilution effect; precipitation is less in winter, and atmospheric pollutants (such as SO2 and NOx) are easy to accumulate, leading to enhanced precipitation acidity. In addition, northerly or northwest wind prevails in winter, transporting pollutants from industrial areas such as North China and the Yangtze River Delta to Huangshan, further increasing the content of acidic substances in precipitation [26,27,28]. In addition to monsoon circulation, local terrain and climatic conditions also play an important role. Huangshan City is located in a mountain–basin terrain, which makes it easy to form mountain–valley wind circulation and temperature inversion layers. At night, the superposition of mountain wind and temperature inversion layer makes the atmospheric stratification stable and inhibits the vertical diffusion of pollutants; during the day, valley wind brings the accumulated pollutants back to the valley. This local “up and down circulation” process leads to the continuous retention of gaseous pollutants over the local area, and the acidic gases retained in the upper air combine with water vapor to eventually form acid rain. In addition, this area belongs to a subtropical monsoon humid climate with abundant water vapor throughout the year, which also provides favorable conditions for the formation of acid rain [29].
Figure 3.
(a) Variations in precipitation, pH, and acid rain frequency in different months; (b) variations in pH and acid rain frequency in different seasons.
3.4. Precipitation Ions Analysis
3.4.1. Ion Composition and Interannual Variation Trend
According to the balance analysis results of precipitation ion equivalent concentrations in Huangshan City from 2013 to 2025, the ratio of the average equivalent concentration of total anions to that of total cations was 0.836, with an ion balance error of 8.94%. The error value is less than 10%, indicating good data quality and high reliability of the determined results of anions and cations. In terms of total amount, the cation concentration is slightly higher than the anion concentration, which may be related to undetermined anions (such as HCO3−, CO32−, or organic acid anions) in precipitation or affected by partial determination errors or local pollution sources. Overall, the chemical composition of precipitation in Huangshan City is relatively stable with good ion balance, providing a reliable data foundation for subsequent analysis of acid rain causes and potential associated factors.
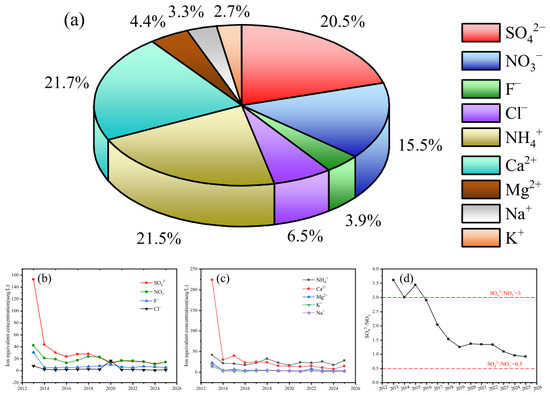
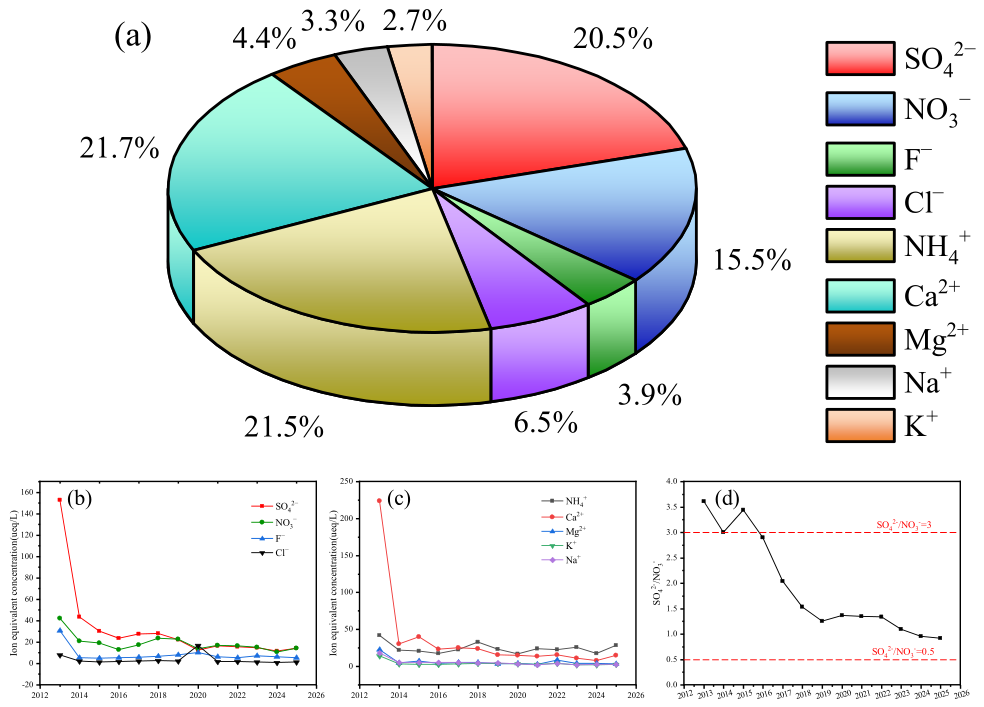
The proportion of various anions and cations from 2013 to 2025 is shown in Figure 4a. During this period, SO42− still accounted for the largest proportion of anions, with an average of 20.5%, followed by NO3− with an average of 15.54%. It can be seen from Figure 4c that the concentrations of SO42− and NO3− showed an overall downward trend from 2013 to 2025, with a particularly significant decrease in SO42−, which is mainly due to the positive results achieved by the implementation of atmospheric sulfur emission control measures in Huangshan, such as energy structure transformation, industrial desulfurization, and loose coal governance [30]. In the same period, the decrease in NO3− is mainly attributed to the continuous advancement of measures such as industrial denitrification and motor vehicle emission control. The equivalent concentration ratio of SO42−/NO3− can be used to judge the type of acid rain [31]: a ratio greater than 3.0 indicates a sulfuric acid type (coal-fired type), a ratio between 0.5 and 3.0 indicates a mixed sulfuric–nitric acid type, and a ratio less than or equal to 0.5 indicates a nitric acid type (motor vehicle type). It can be seen from Figure 4d that the SO42−/NO3− ratio showed an overall downward trend with the increase in years, dropping from a peak of 3.44 to 0.92, which is consistent with the variation trend of atmospheric pollutants SO2 and NOx mentioned above, indicating that the type of acid rain in Huangshan is gradually shifting from sulfuric acid type to mixed sulfuric–nitric acid type, and it is necessary to strengthen NOx control.
Figure 4.
(a) Proportion of different anions and cations, (b) variation in different cations, (c) variation in different anions, and (d) variation in SO42−/NO3− ratio from 2013 to 2025.
Ca2+ and NH4+ accounted for a relatively high proportion of cations, with an average of 21.63% and 21.51%, respectively. This indicates that the neutralization of precipitation acidity mainly comes from soil dust (Ca2+ is mainly from the crust or dust) and ammonia emitted from agricultural and human activities [32]. It can be seen from Figure 4b that the concentration of Ca2+ decreased significantly from 2013 to 2025, which is mainly due to the continuous advancement of comprehensive control measures such as dust control, mine renovation, and soil protection [33]. In contrast, NH4+ showed a fluctuating upward trend, which may be due to the increase in agricultural ammonia emissions and the more significant neutralization effect of atmospheric ammonia on acidic gases after the sharp decrease in Ca2+. From the perspective of atmospheric chemical mechanisms, the decline in the SO42−/NO3− ratio reflects a shift in the emission structure of precursor pollutants: the substantial reduction in SO2 emissions directly leads to a decrease in SO42− concentration, whereas the limited reduction in NOx emissions keeps NO3− at a relatively high level. This trend is highly consistent with the implementation timeline of China’s “Air Pollution Prevention and Control Action Plan” (commonly known as the “Ten Measures”). In addition to the influence of emission source structure, the conversion efficiency from NO2 to NO3− is significantly regulated by meteorological conditions, exhibiting a nonlinear response characteristic.
3.4.2. Major Alkaline Ion Neutralization Effect
Based on the equivalent concentrations of various cations in Huangshan City from 2013 to 2025, the neutralization capacities of five cations (NH4+, Ca2+, Mg2+, Na+, and K+) calculated by Formula 2 were 0.60, 0.60, 0.12, 0.09, and 0.08, respectively, proving that NH4+ and Ca2+ are the main neutralizing ions in precipitation in Huangshan City. The neutralization percentage estimated by the neutralization factor (NF) may be overestimated to a certain extent because this method fails to deduct the alkaline ions contained in soil-derived evaporites (such as sulfates and chlorides) that have combined with anions [34]. To evaluate the neutralization process more accurately, linear regression analysis can be used to quantify the specific neutralization contribution of major alkaline ions to acidic ions [35,36]. In the linear regression analysis, SO42− and NO3− were taken as dependent variables, and NH4+ and Ca2+ as independent variables. The important relevant data of linear regression analysis are shown in Table 1 and Table 2. In the precipitation events of Huangshan, about 97.5% of SO42− and 88.1% of NO3− can be explained by the regression independent variables NH4+ and Ca2+. Linear regression analysis revealed the combination law of acidic ions and alkaline ions in the precipitation of Huangshan. For sulfate, Ca2+ is its most important neutralizer (β = 0.633, p < 0.0001), and about 79.4% of SO42− exists in the form of CaSO4, reflecting the significant impact of crustal source substances on precipitation chemistry [37]. For nitrate, NH4+ is the main neutralizer (β = 0.422, p = 0.050), and about 82.6% of NO3− exists in the form of NH4NO3, indicating the important role of agricultural ammonium salts [7].
Table 1.
Linear regression analysis data with SO42− as the dependent variable and NH4+, Ca2+ as independent variables.
Table 2.
Linear regression analysis data with NO3− as the dependent variable and NH4+, Ca2+ as independent variables.
The study also found the selective combination characteristics between ions: Ca2+ preferentially combines with SO42−, and its neutralization efficiency for NO3− is only 14% of that for SO42−; NH4+ hardly combines with SO42− but specifically combines with NO3−. This differentiation pattern reflects the differences in chemical characteristics of different pollutants and also affects the control mechanism of precipitation acidity in Huangshan City.
3.4.3. Ion Correlation Analysis
To further analyze the internal relations and potential associations of various chemical components in precipitation in Huangshan City, the Pearson correlation coefficient was used to conduct correlation analysis on the physical and chemical indicators of precipitation, as shown in Table 3 [38,39]. The correlation coefficient r can be used to measure the strength and direction of the linear relationship between two continuous variables. Conductivity has a strong correlation with SO42− (r = 0.688), NO3− (r = 0.645), Ca2+ (r = 0.633), and Na+ (r = 0.668), indicating that these ions are the dominant components of precipitation ion strength. The correlation between ions shows obvious cluster characteristics. There is an extremely strong correlation between SO42− and Ca2+ (|r| > 0.9), indicating their common source or strong coupling process. At the same time, NO3− and NH4+ also show a strong positive correlation (r = 0.839), which is completely consistent with the mechanism of their formation of NH4NO3 secondary aerosols, highlighting the key role of NH3 released from agricultural or biological sources in fixing atmospheric HNO3, and further confirming the dominant neutralization contribution of NH4+ to NO3− in the regression analysis (β = 0.422, accounting for 82.6%) [40]. Atmospheric NH3 mainly originates from agricultural activities (fertilizer application, livestock and poultry farming) and biomass burning, while HNO3 is produced from the photochemical oxidation of NOx (mainly from vehicle and industrial emissions) [41,42]. The two react in the gas or aqueous phase to form NH4NO3. This reaction is reversible and regulated by temperature and relative humidity. The low temperature and high humidity conditions in winter and spring in Huangshan City favor the accumulation of NH4NO3 in the particulate phase. When precipitation occurs, these pre-existing NH4NO3 aerosols are scavenged into raindrops, resulting in a high degree of synchrony between NH4+ and NO3− in rainwater. High temperatures promote the decomposition of NH4NO3 back into NH3 and HNO3 gases. The high temperatures in summer in Huangshan City cause the decomposition of NH4NO3, reducing the amount of NO3− available for scavenging by precipitation, which is one of the factors contributing to the lower frequency of acid rain in summer [43]. The above characteristics of selective ion pairing can be further explained by the differences between in-cloud and below-cloud processes. The preferential association of Ca2+ with SO42− mainly occurs during the below-cloud scavenging stage: H2SO4 droplets formed from SO2 oxidation undergo heterogeneous neutralization reactions with CaCO3-rich dust particles as they fall. In contrast, the preferential association of NH4+ with NO3− mainly reflects in-cloud processes: NH3 and HNO3 rapidly react in the liquid phase within clouds to form NH4NO3, which is subsequently deposited to the ground via precipitation. The difference in timescales between the two mechanisms explains why the Ca2+–SO42− correlation coefficient (0.989) is higher than that of NH4+–NO3− (0.839) [44]. In addition, there is a moderate to strong positive correlation between Ca2+ and NH4+ (r = 0.748), indicating a certain degree of mixing of crustal source and agricultural source ions during transport and deposition, but the two have significant selectivity for the neutralization objects of acidic anions: Ca2+ specifically combines with SO42−, while NH4+ specifically combines with NO3− [45]. The extremely strong correlation between Cl− and K+ (r = 0.964) may point to common sources such as biomass combustion [30]. The correlation coefficients between pH and most ions are small (|r| ≤ 0.15), which just confirms that precipitation in Huangshan City is a buffer system with a relatively balanced acid-base ion: high concentrations of crustal–source Ca2+ and anthropogenic–source NH4+ provide a strong neutralization capacity, making precipitation acidity (pH) not controlled by the concentration of a single acidic ion but by the net balance of specific ion pairs such as SO42− with Ca2+ and NO3− with NH4+ [30]. Therefore, correlation analysis and a linear regression model jointly reveal that precipitation chemistry in Huangshan City is controlled by the mixed crustal–anthropogenic sources and agricultural-secondary transformation sources, and the specific pairing between ions and strong buffer capacity is the key characteristic of its acidity evolution.
Table 3.
Correlation coefficients of pH, conductivity, and precipitation chemical composition.
3.5. Regional Comparison of Acid Rain Conditions in Huangshan City
To clarify the relative level of acid rain pollution in Huangshan City compared to different regions across China, we systematically compared it with Nanjing, Guilin, Jinyun Mountain in Chongqing, Dazhou, Beijing, and the regional average of the Yangtze River Delta (Table 4). The comparison results show that the average acid rain frequency in Huangshan City from 2018 to 2025 (55%) is approximately 3.2 times the national average level in 2024 (17.1%), significantly higher than that in Nanjing (20.9%, 2020–2021) and Dazhou (27.49%, 2008–2022), and on the same order of magnitude as Guilin (42.5–74.9%, 2013–2017) and the Yangtze River Delta regional average (57.1 ± 18.7%, 2010–2018), whereas Beijing’s frequency has dropped to 0% since 2017. Regarding acid rain types, Huangshan City, Jinyun Mountain (Chongqing), and Beijing all show a consistent trend of transitioning from sulfate-type to sulfate–nitrate mixed-type acid rain, reflecting the general effectiveness of SO2 emission reduction policies at the national scale. The above comparison indicates that the acid rain frequency in Huangshan City is at the upper-middle level among the acid rain areas of southern China, and its improvement rate lags behind cities such as Nanjing and Dazhou, highlighting the critical influence of delayed NOx control and basin topography constraints on acid rain mitigation.
Table 4.
Comparison of acid rain conditions between Huangshan City and typical cities/regions in China.
Compared with Guilin, although the acid rain frequencies in the two cities are on the same order of magnitude, their evolution mechanisms differ. In Guilin, the acid rain frequency was similarly high (42.5–74.9%) during 2013–2017, but the decline rates of Ca2+ and NH4+ concentrations exceeded those of SO42− and NO3−, disrupting the original net ion pair balance and leading to a rebound in acid rain conditions in the later stage of treatment [7]. In contrast, in Huangshan City, the NH4+ concentration shows a fluctuating upward trend (Figure 4b), with a significant neutralization contribution to NO3− (β = 0.422, accounting for 82.6%), and this strong neutralization capacity maintains the stability of the precipitation buffering system. This comparison underscores the key role of maintaining the neutralization capacity of Ca2+ and NH4+ in consolidating the effectiveness of acid rain control.
3.6. Uncertainties and Limitations of the Study
The following limitations exist in this study: First, the three monitoring sites are mainly located in the central and eastern urban areas and do not cover high-altitude mountainous regions; thus, the representativeness of the conclusions for forest ecosystems requires further validation. Second, quantitative PMF source apportionment was not conducted, so the percentage contributions of various pollution sources could not be precisely quantified. Third, among meteorological factors, only precipitation amount and extreme precipitation events were analyzed, without incorporating a multi-factor integrated model that includes temperature, humidity, wind speed, and other variables. Fourth, the distinction between in-cloud and subcloud processes was inferred indirectly from ion ratios, lacking direct evidence from time-resolved sampling or isotopic analysis. These limitations suggest that future research should add monitoring at high-altitude sites, conduct PMF modeling, and perform isotopic tracer analysis to further advance the understanding of the causal mechanisms underlying acid rain in Huangshan City.
4. Discussion
- (1)
- The acid rain pollution situation has shown a significant phased improvement, but the situation remains severe. During the study period, acid rain pollution in Huangshan City experienced an evolution from “high-level fluctuations” to “stabilization at medium and low levels”. With 2017 as a key turning point, the acid rain frequency dropped off a cliff from the previous high level (e.g., as high as 96% in 2016) and has basically stabilized below 60% since then, except for an abnormal rebound in 2024. This change is highly consistent with the final assessment time of the National Action Plan for Air Pollution Prevention and Control (the Ten Air Pollution Prevention and Control Measures), indicating that macro emission reduction policies have played a decisive role in regional acid rain control. However, unlike the trajectory in Southwest China, characterized by “severe first, then mild, with rapid improvement,” Huangshan exhibits a pattern of “effective policies but lagging improvement.” In terms of harm types, while soil acidification and forest degradation are predominant in Southwest China, Huangshan, as a UNESCO World Natural and Cultural Heritage site, faces a unique cultural heritage risk: the corrosion of ancient stone materials (such as cliff inscriptions and memorial archways) caused by acid rain. The acid rain frequency still reached 50.9% in 2025, indicating that acid rain, as a wet deposition pollution, still has a long-term risk in Huangshan City and cannot be ignored.
- (2)
- The type of acid rain is shifting from sulfuric acid type to mixed sulfuric-nitric acid type, and the contribution of mobile source pollution is becoming increasingly prominent. Precipitation chemical analysis showed that the equivalent concentration ratio of SO42− to NO3− in precipitation in Huangshan City decreased significantly from 4.09 in 2013 to 1.10 in 2018, marking the shift in the dominant type of acid rain from the traditional sulfuric acid type (coal-fired type) to the mixed sulfuric–nitric acid type. This shift is directly related to the change in the local pollutant emission structure: the control of sulfur dioxide (SO2) emissions has achieved remarkable results, and the concentration has been stably at an extremely low level for a long time, while the reduction range of nitrogen oxide (NOx) emissions is relatively limited, among which the rapid growth of motor vehicle ownership (from 118,900 in 2013 to 387,900 in 2024) has made mobile sources the absolute main body of NOx emissions. Therefore, the contribution of motor vehicle exhaust emissions to acid rain formation can no longer be ignored.
- (3)
- Precipitation exhibits highly specific selective ion pairing between Ca2+ and SO42− (r = 0.989) and between NH4+ and NO3− (r = 0.839), with these two pairs accounting for 81.4% of the total cation concentration. Linear regression analysis shows that Ca2+ dominates the neutralization of SO42− (explanatory power of 97.5%), while NH4+ dominates the neutralization of NO3− (explanatory power of 85.7%). From the perspective of atmospheric chemical mechanisms, the Ca2+–SO42− pairing mainly occurs during the below-cloud scavenging stage (heterogeneous neutralization of H2SO4 droplets with CaCO3-rich dust), whereas the NH4+–NO3− pairing primarily reflects in-cloud processes (rapid liquid-phase reaction of NH3 and HNO3 within clouds to form NH4NO3, which is subsequently deposited to the ground via precipitation). This specific ion pairing, combined with the characteristics of high forest coverage and low background of alkaline substances due to fewer atmospheric particulates in the local area, together form a system with a relatively balanced acid-base ion but limited buffer capacity. This makes the precipitation pH value not controlled by the concentration of a single acidic ion but by the net balance of specific ion pairs, explaining why the pH value can remain relatively stable when the total ion concentration (conductivity) changes.
- (4)
- During the plateau period, when emission intensities are relatively stable, interannual variability in precipitation, especially extreme wet events, serves as a key external factor driving anomalous increases in acid rain frequency. As emissions of major acid precursors have been effectively controlled and have entered a period of low-level stabilization, the main driving factor for acid rain occurrence has shifted. Interannual analysis shows that anomalous fluctuations in acid rain frequency are closely related to precipitation amount. Given that the baseline level of pollutant “feedstock” still exists, abundant and frequent precipitation acts like an efficient scavenging process, washing down large amounts of acidic substances accumulated in the atmosphere, leading to a sharp increase in the proportion of acid rain samples. Therefore, the occurrence of acid rain in Huangshan City has currently shifted from being primarily driven by “emissions” to a stage where it is more susceptible to the random influence of “precipitation variability”.
- (5)
- The spatiotemporal pattern of acid rain is jointly shaped by regional transport and local geographical and climatic characteristics. In Huangshan City, acid rain pollution exhibits pronounced seasonal variations, with the highest frequency and lowest pH value occurring in winter and the opposite pattern in summer. This is primarily governed by the East Asian monsoon circulation: northerly winds from industrial regions such as North China and the Yangtze River Delta prevail in winter, bringing exogenous pollutants, whereas in summer, the area is influenced by relatively clean marine air masses. Furthermore, the unique mountain–basin terrain of Huangshan City hinders the horizontal diffusion of pollutants, leading to their retention and thereby exacerbating the transformation and accumulation of local acidic substances. Comparative studies indicate that the neutralization effect of precipitation in Huangshan City is stronger than that in southeastern China but weaker than that in northern China, which precisely reflects its regional background characteristics as a north–south transition zone influenced by multiple sources.
5. Conclusions
In summary, acid rain pollution in Huangshan City is the result of the combined action of regional emission reduction policies, local emission structure transformation, unique geographical and climatic conditions, and complex atmospheric chemical processes. Future prevention and control work should focus on strengthening the control of mobile source NOx emissions on the basis of consolidating the achievements of SO2 emission reduction and pay attention to the coordinated governance of agricultural ammonia emissions. In addition, a linkage early warning mechanism between acid rain pollution and meteorological conditions should be established to cope with the amplification effect of increasingly frequent extreme weather events on wet deposition pollution under the background of climate change.
The core innovations of this study are reflected in two aspects. First, it breaks away from the conventional aggregate thinking in neutralization factor analysis, simultaneously revealing highly specific ion pairings of Ca2+-SO42− (r = 0.989) and NH4+-NO3− (r = 0.839) in regional precipitation monitoring. From an atmospheric chemistry perspective, it elucidates the difference between the two mechanisms: Ca2+-SO42− represents subcloud heterogeneous neutralization, while NH4+-NO3− involves in-cloud pre-formation followed by scavenging. This finding decomposes the neutralization capacity from “aggregate assessment” into “functional differentiation,” explaining why precipitation pH remained relatively stable despite a decline in total ion concentration. Second, it introduces an analytical perspective of “emission-meteorology dominance shift,” revealing the dominant role of extreme precipitation during the emission plateau phase and identifying 2017 as the policy effectiveness threshold. This perspective challenges the implicit assumption in traditional research that “emissions determine everything,” providing a new framework for understanding the driving mechanisms of acid rain fluctuations during the emission reduction plateau period.
Author Contributions
Conceptualization, L.C.; methodology, L.C.; software, Y.W.; validation, J.L. and F.X.; formal analysis, C.P. and Z.X.; investigation, L.C.; resources, C.P. and Y.F.; data curation, L.C. and Y.W.; writing—original draft preparation, L.C.; writing—review and editing, Z.X.; visualization, L.C. and J.L.; supervision, Z.X. and C.P.; project administration, Z.X. and C.P.; funding acquisition, Z.X. All authors have read and agreed to the published version of the manuscript.
Funding
This work was supported in part by the Open Research Fund of Key Laboratory for Vehicle Emission Control and Simulation of the Ministry of Ecology and Environment, Chinese Research Academy of Environmental Sciences (VECS2024K03), and the Fundamental Research Funds for the Central Public Interest Scientific Institution (2024YSKY-03).
Institutional Review Board Statement
Not applicable.
Informed Consent Statement
Not applicable.
Data Availability Statement
The data on motor vehicles, SO2 emissions, and NOx emissions from 2016 to 2024 are sourced from the Anhui Provincial Statistical Yearbook and the Huangshan Municipal Statistical Yearbook. These data are publicly available through the official websites of the Anhui Provincial Bureau of Statistics and the Huangshan Municipal Bureau of Statistics. The NOx emission data for 2011–2015 and the original monitoring data of precipitation in Huangshan City (including pH, electrical conductivity, ion concentrations, etc.) are not publicly accessible due to the data management policies of the relevant institutions. Requests for these data should be directed to the corresponding author.
Conflicts of Interest
Yimei Wang were employed by the Anhui Kexin Environmental Protection Co., Ltd. The remaining authors declare that the research was conducted in the absence of any commercial or financial relationships that could be construed as a potential conflict of interest.
References
- Zhang, Y.; Li, J.; Tan, J.; Li, W.; Singh, B.P.; Yang, X.; Bolan, N.; Chen, X.; Xu, S.; Bao, Y.; et al. An overview of the direct and indirect effects of acid rain on plants: Relationships among acid rain, soil, microorganisms, and plants. Sci. Total Environ. 2023, 870, 161998. [Google Scholar] [CrossRef]
- Likens, G.E. Ambio’s legacy on monitoring, impact, and management of acid rain. Ambio 2020, 49, 1105–1116. [Google Scholar]
- Zong-jie, L.; Song, L.L.; Jing-zhu, M.; Li, Y.G. The characteristics changes of pH and EC of atmospheric precipitation and analysis on the source of acid rain in the source area of the Yangtze River from 2010 to 2015. Atmos. Environ. 2017, 156, 61–69. [Google Scholar]
- Yun, J.; Zhu, C.; Wang, Q.; Hu, Q.; Yang, G. Catalytic conversions of atmospheric sulfur dioxide and formation of acid rain over mineral dusts: Molecular oxygen as the oxygen source. Chemosphere 2019, 217, 18–25. [Google Scholar] [CrossRef]
- Abbasi, T.; Poornima, P.; Kannadasan, T.; Abbasi, S.A. Acid rain: Past, present, and future. Int. J. Environ. Eng. 2013, 5, 229–272. [Google Scholar] [CrossRef]
- Shi, Z.; Zhang, J.; Xiao, Z.; Lu, T.; Ren, X.; Wei, H. Effects of acid rain on plant growth: A meta-analysis. J. Environ. Manag. 2021, 297, 113213. [Google Scholar] [CrossRef]
- Li, L.; Li, H.; Peng, L.; Li, Y.; Zhou, Y.; Chai, F.; Mo, Z.; Chen, Z.; Mao, J.; Wang, W. Characterization of precipitation in the background of atmospheric pollutants reduction in Guilin: Temporal variation and source apportionment. J. Environ. Sci. 2020, 90, 188–200. [Google Scholar] [CrossRef]
- Cui, L.; Liang, J.; Fu, H.; Zhang, L. The contributions of socioeconomic and natural factors to the acid deposition over China. Chemosphere 2020, 243, 125284. [Google Scholar] [CrossRef]
- Jang, J.-H.; Hong, J.; Kim, J.B.; Park, S.; Hwang, K.; Kim, J.; Kim, J.Y.; Bae, G.-N.; Kim, S.; Kim, K.H. Influence of atmospheric ammonia on secondary inorganic aerosol formation in PM2.5 during spring 2024 in the Hongseong area, Republic of Korea. Atmos. Environ. 2025, 358, 121363. [Google Scholar]
- Xu, Z.; Fu, Y.; Ying, Q.; Hopke, P.K.; Shu, X.; Yang, X.; Qiao, X.; Tang, Y. Atmospheric deposition of pollutants at three altitudes on Mount Emei, Sichuan Basin, southwestern China. Sci. Total Environ. 2024, 957, 177806. [Google Scholar] [PubMed]
- Zeng, J.; Xu, W.; Kuang, Y.; Xu, W.; Liu, C.; Zhang, G.; Zhao, H.; Ren, S.; Zhou, G.; Xu, X. The Impact of Agroecosystems on Nitrous Acid (HONO) Emissions during Spring and Autumn in the North China Plain. Toxics 2024, 12, 331. [Google Scholar] [CrossRef]
- Jia, L.; Sun, J.; Fu, Y. Spatiotemporal variation and influencing factors of air pollution in Anhui Province. Heliyon 2023, 9, e15764. [Google Scholar] [CrossRef] [PubMed]
- Sun, J.; Lu, C.; Yin, Y.; Gao, S.; Li, J.; Zhang, Y. Impact of stochastic collisions on cloud droplet number concentration and relative dispersion during Meiyu frontal system. Atmos. Res. 2024, 285, 106645. [Google Scholar] [CrossRef]
- Lv, T.; Zhao, R.; Wang, N.; Xie, L.; Chen, S.; Ding, H.; Fang, Y. Effect of Environmental and Spatial Factors on Multi-Diversity in Mt. Huangshan. Ecol. Evol. 2025, 15, e12890. [Google Scholar] [CrossRef]
- Zhang, J.H.; Zhang, Y.; Zhou, J.; Liu, Z.-H.; Zhang, H.-L.; Tian, Q. Tourism water footprint: An empirical analysis of Mount Huangshan. Asia Pac. J. Tour. Res. 2017, 22, 1193–1206. [Google Scholar] [CrossRef]
- Laouali, D.; Galy-Lacaux, C.; Diop, B.; Delon, C.; Orange, D.; Lacaux, J.P.; Akpo, A.; Lavenu, F.; Gardrat, E.; Castera, P. Long term monitoring of the chemical composition of precipitation and wet deposition fluxes over three Sahelian savannas. Atmos. Environ. 2012, 62, 554–566. [Google Scholar] [CrossRef]
- Wang, Y.; Yu, W.; Pan, Y.; Wu, D. Acid neutralization of precipitation in Northern China. J. Air Waste Manag. Assoc. 2012, 62, 68–76. [Google Scholar] [CrossRef]
- Fritz, S.J. A Survey of Charge-Balance Errors on Published Analyses of Potable Ground and Surface Waters. Ground Water 1994, 32, 539–546. [Google Scholar] [CrossRef]
- Feng, T.; Shi, Y.; Wang, X.; Wan, X.; Mi, Z. Synergies of air pollution control policies: A review. J. Environ. Manag. 2025, 376, 112856. [Google Scholar] [CrossRef] [PubMed]
- HJ/T 165-2004; Technical Specifications for Acid Deposition Monitoring. Environmental Science Press: Beijing, China, 2004.
- Wang, H.; Gui, H.; Wang, H.; Liu, G. Break point identification and spatiotemporal dynamic evolution of air pollutants: An empirical study from Anhui province, east China. Front. Environ. Sci. 2022, 10, 876345. [Google Scholar] [CrossRef]
- Dang, R.; Liao, H. Radiative forcing and health impact of aerosols and ozone in China as the consequence of clean air actions over 2012–2017. Geophys. Res. Lett. 2019, 46, 12504–12513. [Google Scholar] [CrossRef]
- Ahmad Romli, R.H.; Mochamad Aryono, A.; Adi, M. Spatiotemporal Modeling of Acid Rain Chemistry in Tropical Java Using Mixed-Effects Models: Deposition Patterns and Threshold Exceedance. J. Meteorol. Dan Geofis. 2025, 26, 55–72. [Google Scholar] [CrossRef]
- Indrawati, A.; Tanti, D.A.; Ambarsari, N.; Ma’ruf, I.F.; Sumaryati, N.; Setyawati, W.; Pusfitasari, E.D.; Nugroho, G.A.; Cholianawati, N.; Sinatra, T.; et al. Spatiotemporal distribution in chemical composition of wet atmospheric deposition in Bandung Indonesia. Environ. Sci. Pollut. Res. 2024, 31, 64295–64313. [Google Scholar] [CrossRef] [PubMed]
- Tang, Y.; Huang, A.; Wu, P.; Huang, D.; Xue, D.; Wu, Y. Drivers of Summer Extreme Precipitation Events Over East China. Geophys. Res. Lett. 2021, 48, e2021GL094099. [Google Scholar] [CrossRef]
- Li, Z.; He, Y.; Pang, H.; Jia, W.; He, X.; Zhang, N.; Ning, B.; Yuan, L.; Song, B.; Theakstone, W.H. Chemistry of snow deposited during the summer monsoon and in the winter season at Baishui glacier No. 1, Yulong mountain, China. J. Glaciol. 2009, 55, 407–418. [Google Scholar] [CrossRef]
- Li, Z.; Feng, Q.; Guo, X.; Gao, Y.; Pan, Y.; Wang, T.; Li, J.; Guo, R.; Jia, B.; Song, Y.; et al. The evolution and environmental significance of glaciochemistry during the ablation period in the north of Tibetan Plateau, China. Quat. Int. 2015, 363, 116–124. [Google Scholar]
- Li, Z.; Li, Z.; Wang, T.; Gao, Y.; Cheng, A.; Guo, X.; Guo, R.; Jia, B.; Song, Y.; Han, C.; et al. Composition of wet deposition in the central Qilian Mountains, China. Environ. Earth Sci. 2014, 72, 309–319. [Google Scholar]
- Lin, H.; You, Q.; Jiao, Y. Water Vapor Transportation and Its Influences on Precipitation in Summer over Qinghai-Xizang Plateau and Its Surroundings. Plateau Meteorol. 2016, 35, 309–317. (In Chinese) [Google Scholar]
- Shi, C.; Deng, X.; Yang, Y.; Huang, X.; Wu, B. Precipitation chemistry and corresponding transport patterns of influencing air masses at Huangshan Mountain in East China. Adv. Atmos. Sci. 2014, 31, 1361–1372. [Google Scholar] [CrossRef]
- Li, W.; Gao, J. Acid deposition and integrated zoning control in China. Environ. Manag. 2002, 30, 169–182. [Google Scholar] [CrossRef] [PubMed]
- Miao, Y.; Zhang, C.; Xiao, Q.; Zhao, H.J. Dynamic Variations and Sources of Nitrate During Dry Season in the Lijiang River. Environ. Sci. 2018, 39, 3012–3020. (In Chinese) [Google Scholar]
- Larssen, T.; Lydersen, E.; Tang, D.; He, Y.; Gao, J.; Liu, H.; Duan, L.; Seip, H.M.; Vogt, R.D.; Mulder, J.; et al. Acid Rain in China. Environ. Sci. Technol. 2006, 40, 418–425. [Google Scholar] [CrossRef]
- Xu, Z.; Wu, Y.; Liu, W.J.; Liang, C.-S.; Ji, J.P.; Zhao, T.; Zhang, X. Chemical composition of rainwater and the acid neutralizing effect at Beijing and Chizhou city, China. Atmos. Res. 2015, 156, 188–198. [Google Scholar] [CrossRef]
- Migliavacca, D.; Teixeira, E.; Wiegand, F.; Machado, A.; Sanchez, J. Atmospheric precipitation and chemical composition of an urban site, Guaiba hydrographic basin, Brazil. Atmos. Environ. 2005, 39, 247–256. [Google Scholar] [CrossRef]
- Niu, H.; He, Y.; Lu, X.X.; Shen, J.; Du, J.; Zhang, T.; Pu, T.; Xin, H.; Chang, L. Chemical composition of rainwater in the Yulong Snow Mountain region, Southwestern China. Atmos. Res. 2014, 143, 118–128. [Google Scholar] [CrossRef]
- Chandra Mouli, P.; Venkata Mohan, S.; Reddy, S.J. Rainwater chemistry at a regional representative urban site: Influence of terrestrial sources on ionic composition. Atmos. Environ. 2005, 39, 7207–7217. [Google Scholar] [CrossRef]
- Conradie, E.H.; Van Zyl, P.G.; Pienaar, J.J.; Beukes, J.P.; Galy-Lacaux, C.; Venter, A.D.; Mkhatshwa, G.V. The chemical composition and fluxes of atmospheric wet deposition at four sites in South Africa. Atmos. Environ. 2016, 136, 105–116. [Google Scholar] [CrossRef]
- Rao, P.S.P.; Tiwari, S.; Matwale, J.L.; Pervez, S.; Tunved, P.D.; Safai, P.; Srivastava, A.K.; Bisht, D.S.; Singh, S.; Hopke, P.K. Sources of chemical species in rainwater during monsoon and non-monsoonal periods over two mega cities in India and dominant source region of secondary aerosols. Atmos. Environ. 2016, 135, 158–169. [Google Scholar] [CrossRef]
- Zhang, X.; Jiang, H.; Zhang, Q.; Zhang, X. Chemical characteristics of rainwater in northeast China, a case study of Dalian. Atmos. Res. 2012, 112–113, 118–126. [Google Scholar] [CrossRef]
- Dadrasi, A.; Weinzettel, J.; Salmani, F.; Vačkářová, D. High-Resolution Spatial Analysis of Organic and Chemical Nitrogen Fertilizer Sources on NH3 Emissions. E3S Web Conf. 2025, 635, 03002. [Google Scholar] [CrossRef]
- Lin, C.; Ooka, R.; Kikumoto, H.; Kim, Y.; Zhang, Y.; Flageul, C.; Sartelet, K. Impact of gas dry deposition parameterization on secondary particle formation in an urban canyon. Atmos. Environ. 2024, 333, 120633. [Google Scholar] [CrossRef]
- Peng, W.; Zhu, B.; Kang, H.; Chen, K.; Lu, W.; Lu, C.; Kang, N.; Hu, J.; Chen, H.; Liao, H. Inconsistent 3-D Structures and Sources of Sulfate Ammonium and Nitrate Ammonium Aerosols During Cold Front Episodes. J. Geophys. Res. Atmos. 2024, 129, e2023JD039958. [Google Scholar] [CrossRef]
- Guo, Z.; Zhang, G.; Peng, X.; Sun, W.; Liu, F.; Li, M.; Pan, X.; Du, X.; Wang, J.; Wang, Z.; et al. In situ measurement evidence of selective aqueous-phase formation of ammonium, nitrate, and sulfate in clouds. Atmos. Res. 2026, 330, 108514. [Google Scholar] [CrossRef]
- Zhu, H.; Li, Y.; Wu, L.; Yu, S.; Xin, C.; Sun, P.; Xiao, Q.; Zhao, H.; Zhang, Y.; Qin, T. Impact of the atmospheric deposition of major acid rain components, especially NH4, on carbonate weathering during recharge in typical karst areas of the Lijiang River basin, southwest China. Appl. Geochem. 2020, 116, 104654. [Google Scholar] [CrossRef]
- Zhang, Z.; Shen, L.; Zhu, B.; Yue, J.; Wang, H.; Zhang, Q. Chemical characteristics and potential sources of precipitation in Nanjing. Trans. Atmos. Sci. 2015, 38, 473–482. (In Chinese) [Google Scholar]
- Wang, J.; Zhang, L.; Wang, C.; Xia, L.; Huang, C.; Li, T. Effects of acid deposition on the hydrochemistry of Jinyunshan Lake. J. Earth Environ. 2023, 14, 242–252. (In Chinese) [Google Scholar]
- Li, Q.; Liu, X.; Zhang, J. Changing trends of acid rain types in the Yangtze River Delta region. J. Nanjing For. Univ. (Nat. Sci. Ed.) 2021, 45, 168–174. (In Chinese) [Google Scholar]
- Xiao, Q.; Yang, G.; Chen, Q. Variation Characteristics of Acid Rain and Its Relationship with Meteorological Factors in Dazhou. Plateau Mt. Meteorol. Res. 2024, 44, 77–82. (In Chinese) [Google Scholar]
- Sun, S.; Liu, S.; Li, L.; Zhao, W. Components, acidification characteristics, and sources of atmospheric precipitation in Beijing from 1997 to 2020. Atmos. Environ. 2021, 266, 118707. [Google Scholar] [CrossRef]

Disclaimer/Publisher’s Note: The statements, opinions and data contained in all publications are solely those of the individual author(s) and contributor(s) and not of MDPI and/or the editor(s). MDPI and/or the editor(s) disclaim responsibility for any injury to people or property resulting from any ideas, methods, instructions or products referred to in the content. |
© 2026 by the authors. Licensee MDPI, Basel, Switzerland. This article is an open access article distributed under the terms and conditions of the Creative Commons Attribution (CC BY) license.