


Abstract
The El Niño–Southern Oscillation (ENSO) is the main driver of interannual climate variability, strongly influencing precipitation, temperature, and extreme events worldwide. In South America, its impacts are well documented. However, studies examining different ENSO types—Eastern Pacific (EP), Central Pacific (CP), and Mixed (MX), defined according to the location of sea surface temperature (SST) anomalies in the tropical Pacific—remain limited, particularly for the Brazilian subtropical climate. This study investigates rainfall variability in the Brazilian subtropical region associated with different ENSO types. Composite analyses of precipitation, wind, and SST anomalies were performed, and monthly rainfall data from 703 stations were used to identify homogeneous regions. The results show the intensity and spatial coherence of rainfall signals vary according to El Niño type, with EP events favoring widespread wet conditions and CP events producing more heterogeneous or locally negative anomalies. For La Niña, the intensity and seasonal distribution of negative rainfall anomalies vary by ENSO type: stronger impacts occur in summer (EP), spring (MX), and autumn (CP). These findings improve the understanding of ENSO-related rainfall variability in the Brazilian subtropical region and provide valuable insights for the management of climate-related risks in an area frequently affected by rainfall extremes.
1. Introduction
The El Niño–Southern Oscillation (ENSO) is one of the main drivers of interannual global climate variability, influencing patterns of precipitation and extreme events in different regions of the planet [1,2,3,4,5]. ENSO arises from ocean–atmosphere interactions in the East-Central equatorial Pacific, where anomalies in sea surface temperature are accompanied by modifications in the zonal pressure gradient and trade wind intensity.
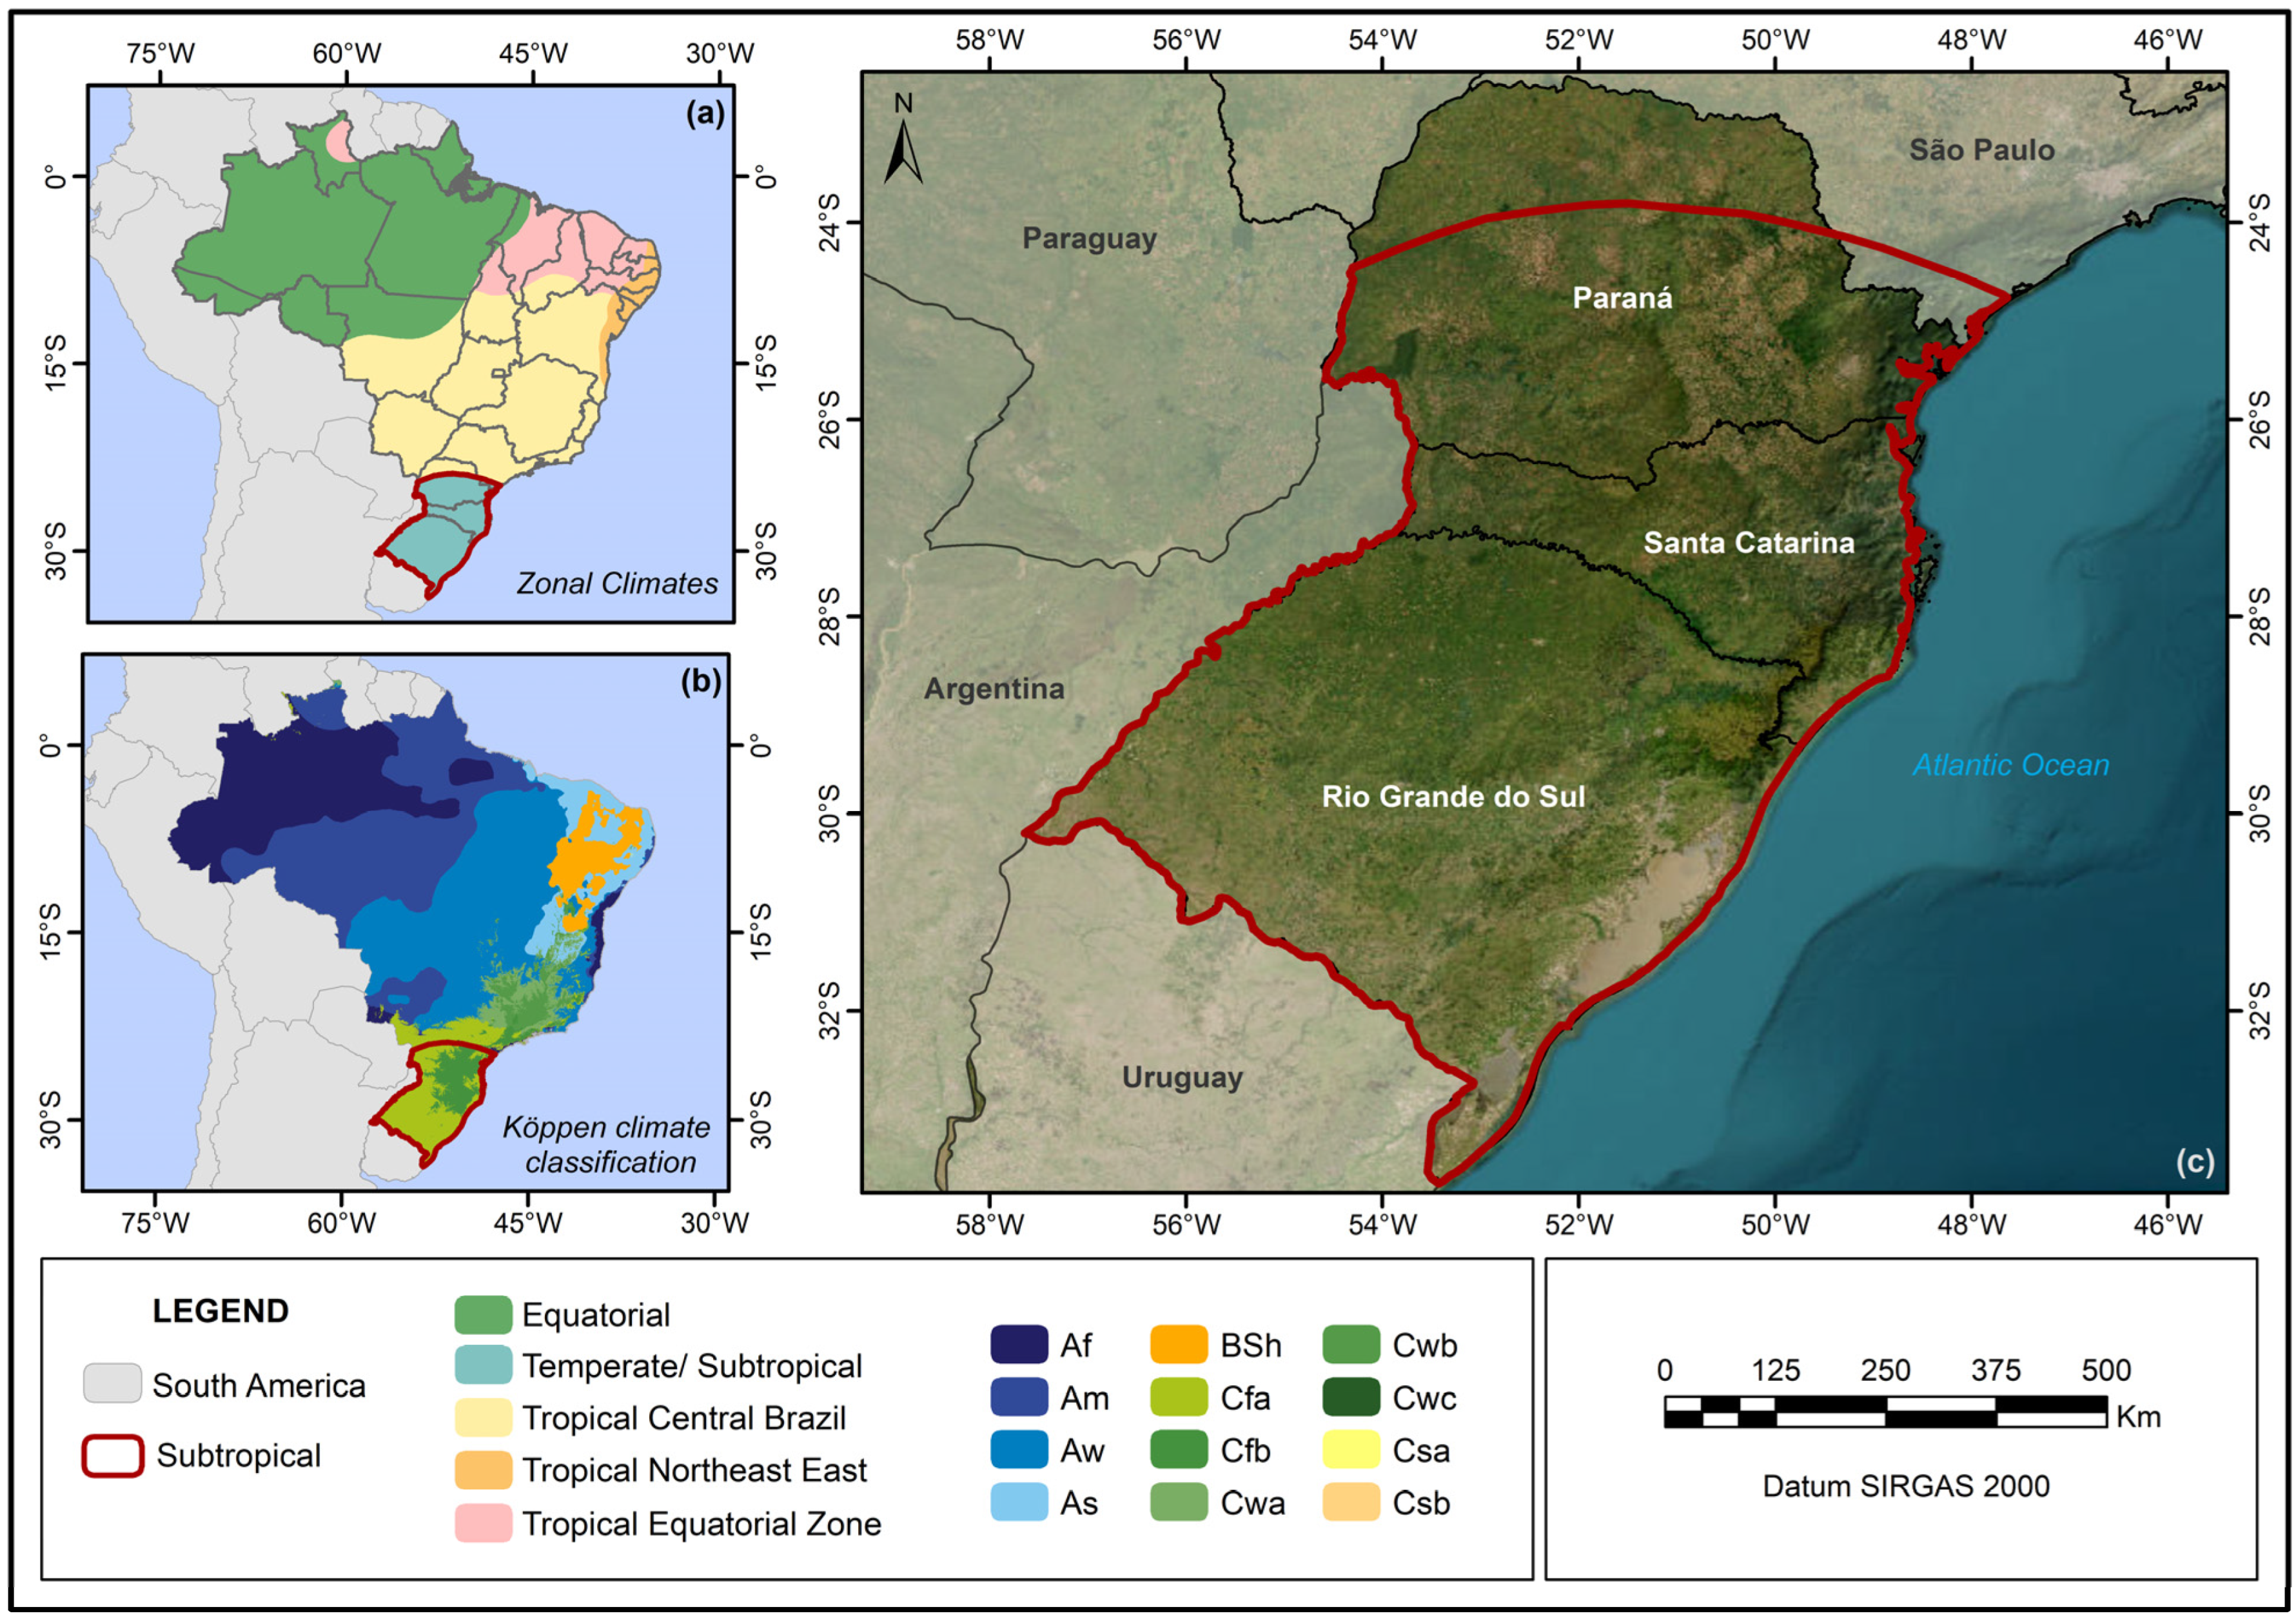
Several scientific studies that highlight the spatio-temporal variability of this phenomenon in different regions of the world [5]. In South America (SA), the warm (cold) phase, called El Niño—EN (La Niña—LN), is characterized by warmer (colder) than usual sea surface temperature (SST) in the East-Central Equatorial Pacific, altering atmospheric and oceanic processes and climatological variables over the continent. The subtropical climate present in southern Brazil and adopted as the study area in this investigation (Figure 1), is characterized by regular precipitation throughout the year [6], with a continuous supply of moisture from the Atlantic Ocean, the Amazon region, and frontal systems [7,8].
Figure 1.
Location and climatic characterization of the Brazilian subtropical climate. (a) Climate Zones [9], (b) Köppen climate classification [10], (c) Brazilian subtropical climate and southern states of Brazil.
The main modulators of rainfall in this area are the South American Low-Level Jet (SALLJ) and frontal systems [5,7]. Mesoscale convective systems and frontal systems are the most important rain-producing weather systems in this region, during spring/summer and fall/winter, respectively [6,7,8,11]. This region is strongly impacted by positive and negative precipitation responses associated with ENSO events, being one of the most sensitive areas in SA to these teleconnections, as highlighted by several studies [6,12,13,14,15,16].
In general, in this area (Figure 1), during EN (LN) years, precipitation is above (below) climatological averages, with impacts on flood (drought) events. Furthermore, the study area has been impacted by intense rainfall anomalies in recent years, such as the 2020/2021 droughts in various parts of southern Brazil [17,18] and the 2024 floods in the state of Rio Grande do Sul [19]. These disaster cases corroborate evidence of increasing extreme events worldwide and in Brazil [20,21]. Therefore, a better understanding of rainfall patterns is necessary in the Brazilian subtropical climate, especially in relation to ENSO, the main mode of interannual variability in the SA.
Even though ENSO events are widely studied, the phenomenon is highly complex. Previous studies have associated the complexity of the ENSO events with its intensity, spatial pattern, temporal evolution, and the combination of these factors [22]. In terms of intensity, ENSO events can be classified as weak, moderate, and strong based on SST anomalies [2]. Recent investigations have highlighted seasonal variations in ENSO intensity, associated with changes in the Walker circulation, Rossby waves propagation and, consequently, precipitation patterns in different SA regions [23].
The spatial pattern differentiates them into Eastern Pacific (EP), Central Pacific (CP), and Mixed (MX) events, according to the areas of maximum SST anomalies, which occur in Niño 3, Niño 4, and between the Niño 3 and Niño 4 regions, respectively [5,16,24,25,26,27]. Furthermore, their temporal evolution or duration divides ENSO events into one-year events and multi-year events (two or three years) [28], which can be cyclical or episodic, depending on their transition [29,30].
In recent decades, the comprehension of the complexity of these ENSO patterns has been intensified by the increased occurrence of multi-year LN and CP-type EN [31]. In addition, the frequency and intensity of EN events are projected to increase due to global warming [32].
Most studies consider the entire South American domain ([5,15,23,33,34,35]; among others), which limits detailed analyses of Brazilian regions. Previous analyses for southeastern SA demonstrated that EP and CP El Niño events produce distinct rainfall responses due to differences in large-scale circulation patterns [16]. However, regional-scale investigations focusing specifically on the Brazilian subtropical climate remain limited. Thus, the main objective of this paper is to analyze the rainfall variability in the Brazilian subtropical climate associated with ENSO diversity (EP, CP, and MX), also considering homogeneous rainfall regions in the study area.
The present study advances by focusing specifically on the Brazilian subtropical climate, incorporating both EN and LN typologies and applying a rainfall regionalization. Thus, we provide a refined regional-scale assessment of ENSO diversity impacts that has not yet been addressed for this climatic domain. The results contribute to the understanding of seasonal variability of precipitation in the subtropical climate associated with ENSO typologies, as well to improve the management of climate-related risks in an area that has been frequently impacted by both positive and negative rainfall extremes.
2. Materials and Methods
2.1. Database
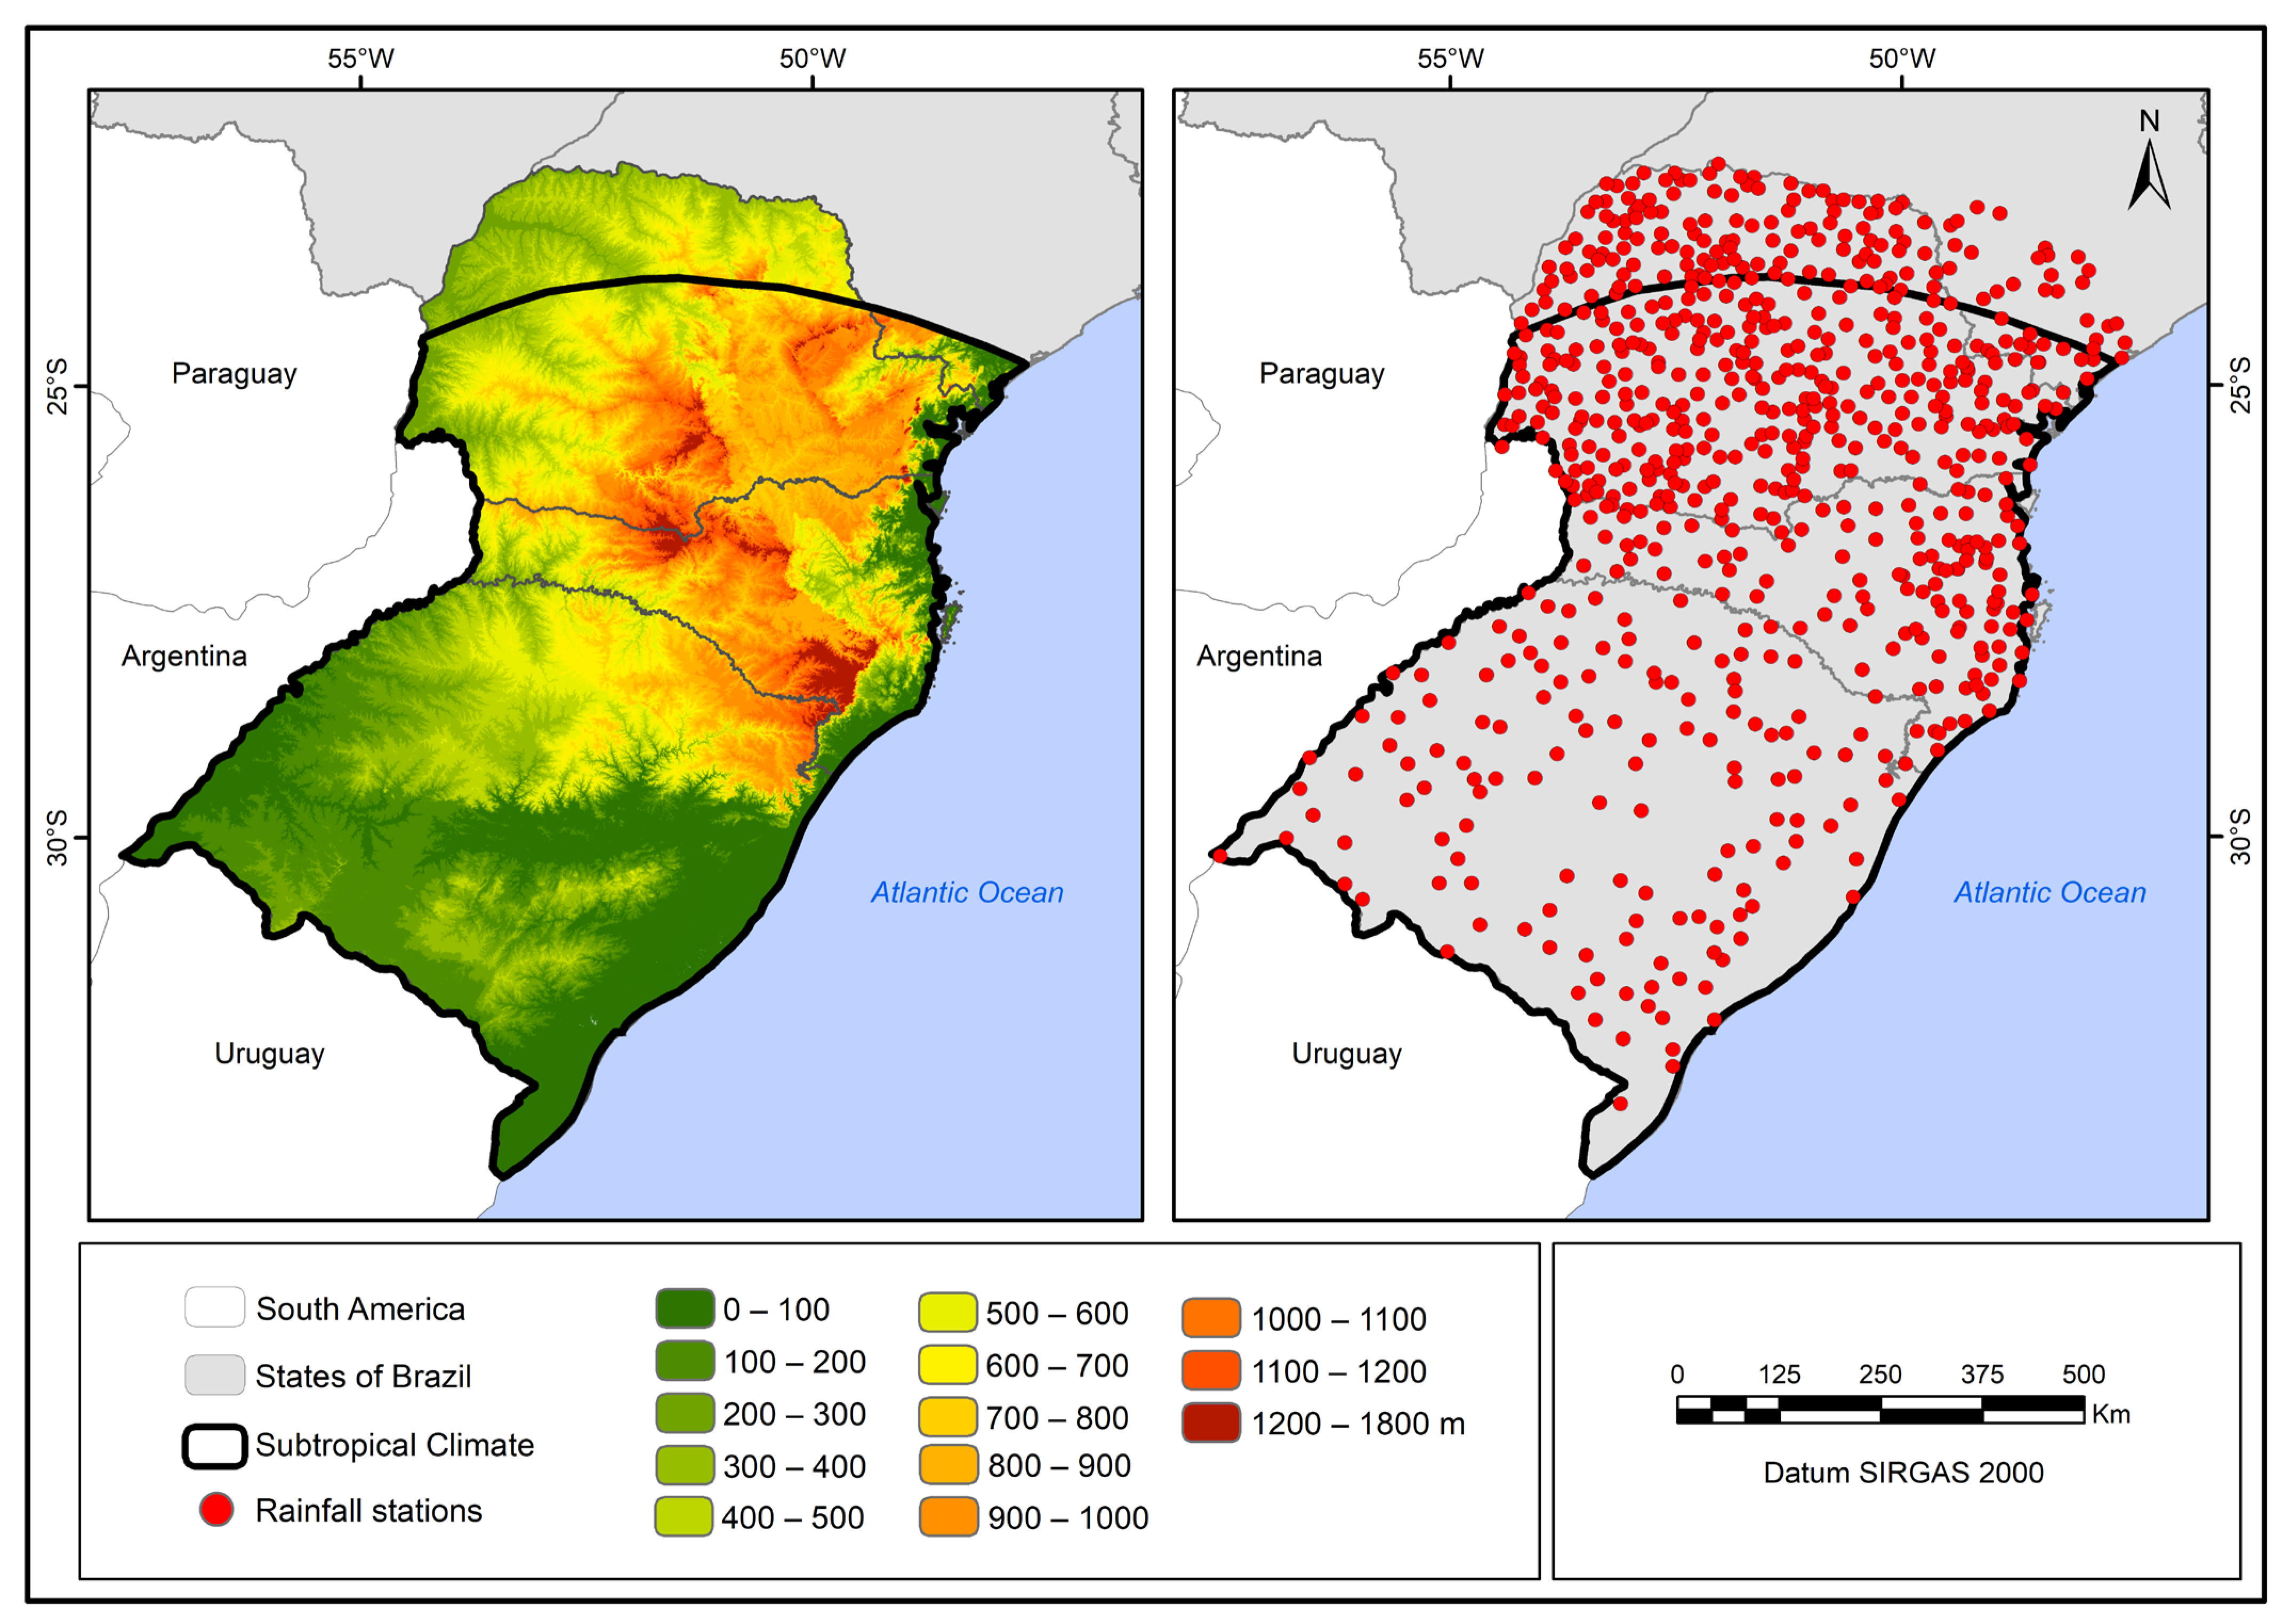
To characterize precipitation variability in homogeneous regions, monthly data from 703 stations were used (Figure 2), of which 551 are located entirely within the Brazilian subtropical climate, while 152 are in the transition zone to the tropical climate, allowing spatial sampling of data in different climatic and relief contexts of the study region (Figure 2). These data were obtained from the Hidroweb platform of the National Water Agency (ANA), available at https://www.snirh.gov.br/hidroweb/serieshistoricas, accessed on 24 February 2026. Additionally, monthly precipitation data from the Global Precipitation Climatology Centre (GPCC), with a horizontal resolution of 0.25° × 0.25° [36], were used to compose the monthly anomalies in different types of ENSO.
Figure 2.
Relief and rainfall stations in the Brazilian subtropical climate. Database adapted from [6].
Furthermore, Extended Reconstructed Sea Surface Temperature version 5—ERSSTv5 [37] was used, derived from the International Comprehensive Ocean-Atmosphere Dataset (ICOADS), with a spatial resolution of 2° × 2°. We also employed the monthly data of 850 hPa and 200 hPa wind from NCEP/NCAR reanalysis [38] in the atmospheric fields. The analyses were conducted for the period 1976–2019, due to greater consistency of data [6]. The time period was selected based on the availability of observed data from 703 stations in the study area.
2.2. Correction and Processing of Rainfall Data
Corrections to the monthly rainfall data from the 703 stations of Hidroweb were performed using the NIPALS (Non-linear Iterative Partial Least Squares) algorithm, which was selected for the imputation of missing data in the historical time series. This algorithm is based on principal component analysis and regressions for predicting missing values [39]. Additionally, four homogeneity tests were applied: Pettitt, Standard Normal Homogeneity Test (SNHT), Buishand, and Von Neumann, to ensure data consistency [6].
The definition of homogeneous rainfall zones was based on Ward’s method. Initially, the stations used in this research were grouped using the Agglomerative Hierarchical Clustering technique, a multivariate method whose objective is to separate data into groups that are not previously known [40]. This procedure was performed based on Ward’s method, using the K-means algorithm.
Rainfall in homogeneous regions was characterized by defining standard years [41] and calculating the coefficient of variation in rainfall. The definition of standard years was carried out to detect extremely dry years (rainfall < the 10th percentile—P10), dry years (P10 to P35), normal/typical years (P35 to P65), rainy years (P65 to P90), and extremely rainy years (>P90), considering the annual rainfall in the period from 1976 to 2019.
The annual coefficient of variation (CV) of rainfall was calculated using the equation: CV = Standard Deviation/Mean. These indices (standard years and coefficient of variation) were used to characterize the different homogeneous rainfall regions of the Brazilian subtropical climate in relation to rainfall patterns in different ENSO typologies.
2.3. Identification of ENSO Events
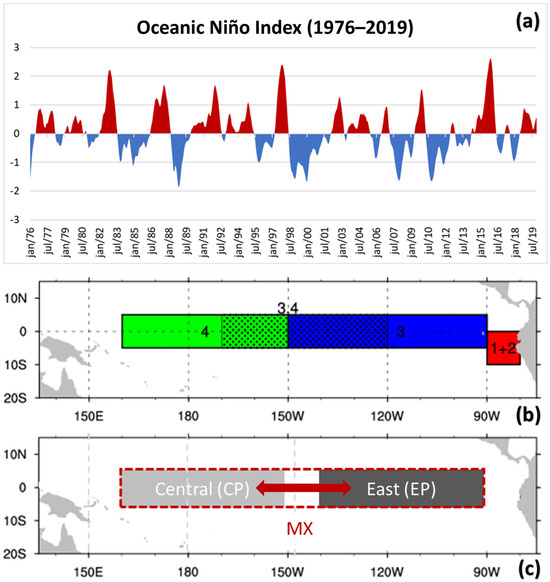
The determination of ENSO episodes is based on the dates contained in the Oceanic Niño Index (ONI)—Figure 3a, available at: https://www.cpc.ncep.noaa.gov/products/analysis_monitoring/ensostuff/ONI_v5.php, accessed on 24 February 2026. ENSO events are selected if they are equal to or greater than +0.5 °C (equal to or less than −0.5 °C) for the warm phase (cold phase), persistent for 5 consecutive quarters [2].
Figure 3.
(a) Oceanic Niño Index (1976–2019): positive values are shown in red, whereas negative values are shown in blue, (b) Niño regions (NOAA): red—Niño 1+2 (0–10° S, 90° W–80° W), blue—Niño 3 (5° N–5° S,150° W–90° W), black dotted—Niño 3.4 (5° N–5° S, 170–120° W), and green—Niño 4 (5° N–5° S, 160° E–150° W), (c) ENSO regions used in [33,34] and adapted for this study, including ENSO MX.
The characterization of the intensity of the events was based on Golden Gate Weather Services, available at: https://ggweather.com/enso/oni.htm, accessed on 24 February 2026. This classification is divided into: weak when SST anomalies ranged from 0.5 to 0.9 (−0.5 to −0.9), moderate from 1.0 to 1.4 (−1.0 to −1.4), strong from 1.5 to 1.9 (−1.5 to −1.9), and very strong when SST variations were ≥2.0 (≤−2.0) for EN (LN) events.
In this study, the characterization of events is based on the following procedures [33,34]: EP ENSO occurs with SST anomalies in the adapted Niño 3 region (140° W–90° W, 5° N–5° S—with less 10° of longitude on the west side, to obtain separate regions—Figure 3b,c) and CP ENSO in the Niño 4 region (160° E–150° W, 5° N–5° S; Figure 3b,c).
MX events were also included in the analysis based on previous studies [16,26,42] (Figure 3c), defined as events that, throughout their space–time evolution (with emphasis on the mature phase of ENSO: DJF), moved between Niño 3 and Niño 4 regions or presented spatial configurations between these two regions (Figure 3c). Thus, maximum SST anomalies are not restricted to the Niño 3 or Niño 4 regions, but occur in the transition zone between them during the mature phase of ENSO (DJF). The separation of LN typologies is more complex compared to EN events, given that the majority present characteristics of overlaps between the Niño 3 and Niño 4 regions.
In the present study, the characterization of ENSO typologies was based on the monthly spatial evolution of SST anomalies during the period of June (year 0) to May (year +1), with emphasis on DJF (Table 1). Following the classification of ENSO events into different typologies, the compositions of SST anomalies in DJF for EP, CP, and MX events were spatially represented. The ENSO typology classification follows the conceptual and methodological framework previously adopted for southeastern SA [16].
Table 1.
ENSO events: types in the mature phase (DJF) and intensities (1976–2019).
2.4. Analysis of Composite Rainfall Anomalies and Statistical Significance Test
Anomaly composite techniques, widely used in meteorology, were applied to precipitation, SST, and wind fields, considering the years associated with different ENSO typologies. We analyzed the composition of seasonal precipitation anomalies from June (year 0) to May (year +1) for years classified for different types of ENSO events (EP, CP, and MX). Additionally, composite analyses of atmospheric anomaly fields were performed, based on 850 hPa and 200 hPa winds. A two-tailed Student’s t-test was applied to the composites to determine the areas of statistical significance at the 90% confidence level. The analyses were conducted using the Grid Analysis and Display System (GrADS) software (OpenGrADS 2.2.1 version), considering the climatology from 1991 to 2020 for the composition of the anomalies. The maps were finalized using ArcMap 10.5.
3. Results and Discussion
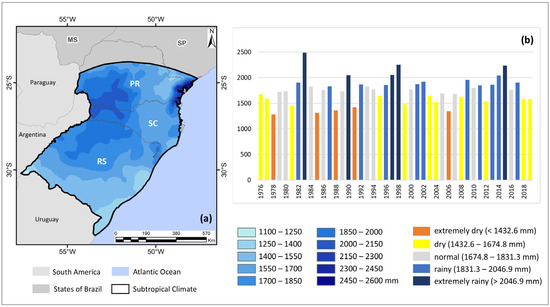
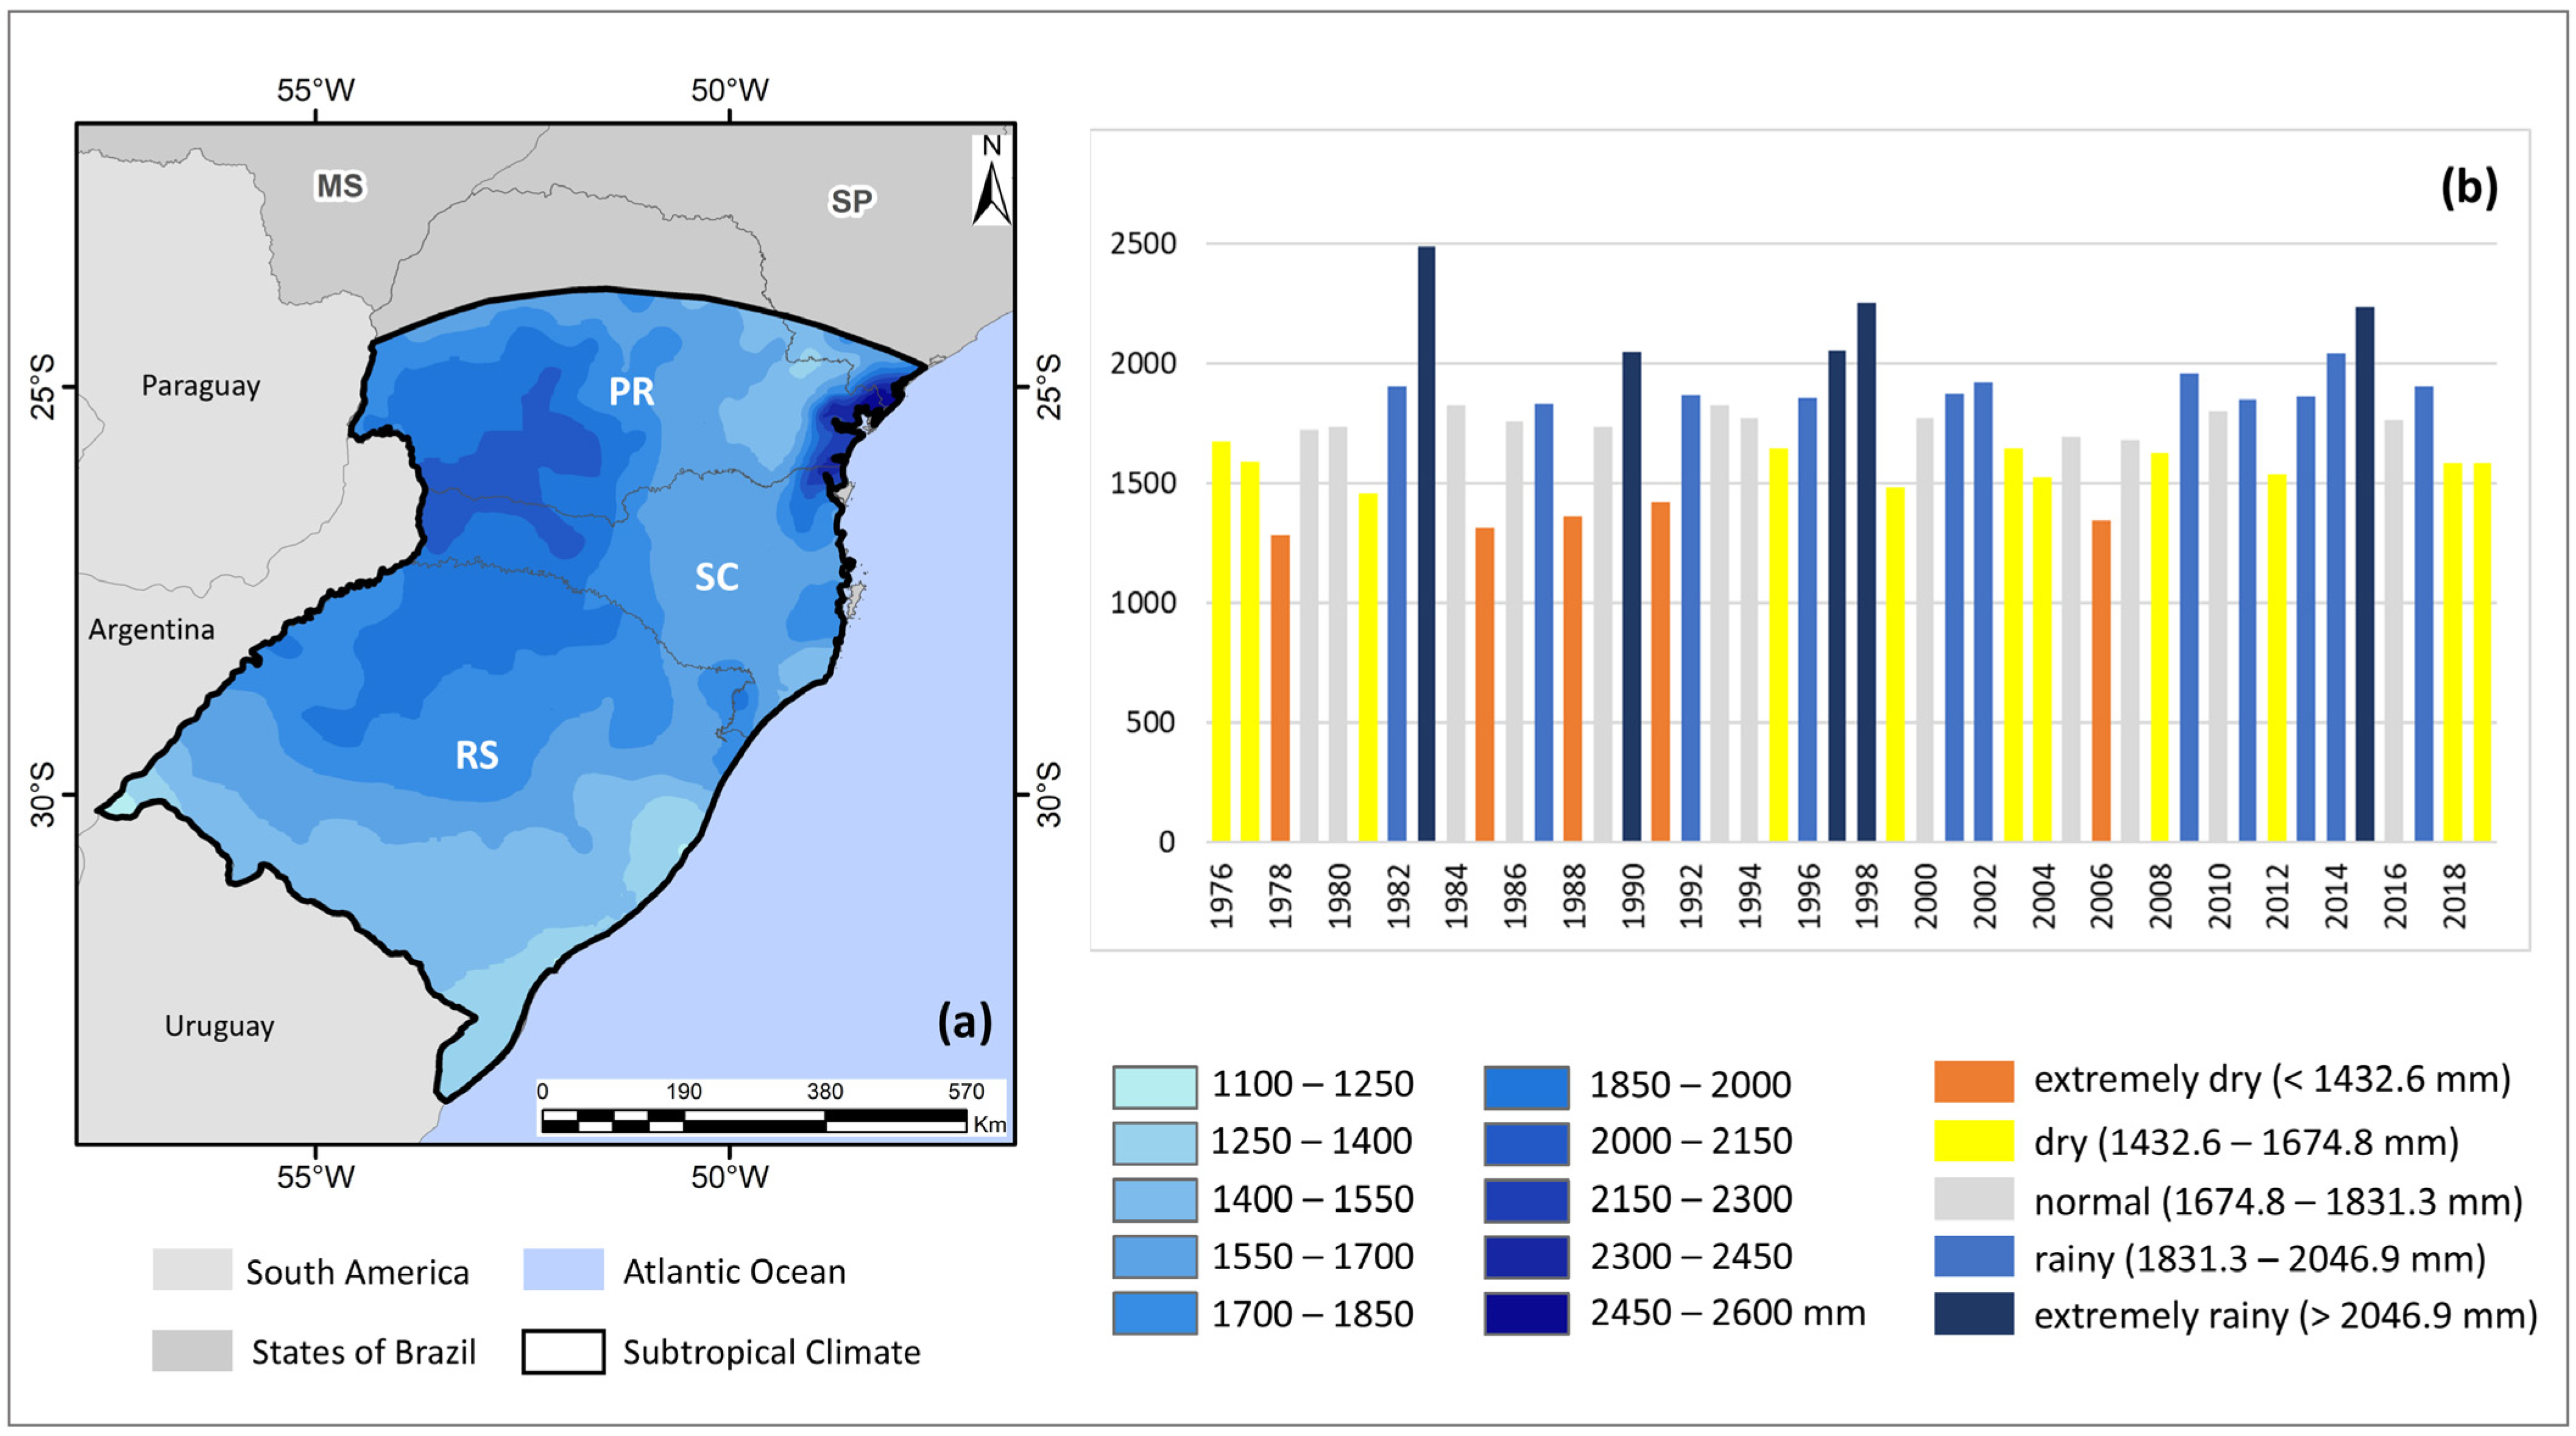
In the Brazilian subtropical climate, annual rainfall varied between 1100 and 2600 mm from 1976 to 2019 (Figure 4a), considering the annual average of rainfall stations located in the Brazilian subtropical climate. The highest rainfall amounts are recorded in the coastal region of the Paraná State (PR), and between southwestern and western Santa Catarina State (SC). The lowest rainfall amounts occur in southern Rio Grande do Sul State (RS), with rainfall ranging from 1100 to 1300 mm (Figure 4a).
Figure 4.
(a) Mean annual precipitation (mm) and (b) interannual variability of precipitation (mm), including the classification of standard years in the Brazilian subtropical climate (1976–2019).
Regarding seasonal characteristics, summer, autumn and spring have the highest rainfall values, with variations in summer ranging from 250 to 1100 mm, in the autumn from 260 to 700 mm and in spring from 300 to 650 mm on average during the period from 1976 to 2019. In winter, rainfall is somewhat less significant, with average values ranging from 150 to 470 mm. Thus, a certain regularity is observed in the annual and seasonal distribution of precipitation, with no dry season or months without precipitation in the study area, with lower values only in winter.
The interannual variability of precipitation, characterized by standard years according to [41] between 1976 and 2019, shows that the years 1978, 1985, 1988, 1991, and 2006 were categorized as extremely dry, while the years 1983, 1990, 1997, 1998, and 2015 were identified as extremely rainy (Figure 4b). The years of very strong EN (such as 1982–1983, 1997–1998, and 2015–2016—see Table 1) were marked by considerable positive rainfall patterns in the Brazilian subtropical climate. Some years of the EP La Niña (EPLN), such as 1985 and 2006, presented extremely dry characteristics (Figure 4b and Table 1).
Regarding ENSO events, 30 ENSO episodes were identified in the years 1976 to 2019, of which 16 EN and 14 LN, with different typologies (EP, CP and MX) and intensities (Table 1). Of these events, 7 were categorized as EP (4 EN and 3 LN), 8 as CP (4 EN and 4 LN) and 15 as MX (8 EN and 7 LN). EP events stand out in terms of intensity, with very strong value recorded (Table 1). In terms of frequency of occurrence, MX events stand out (15 events).
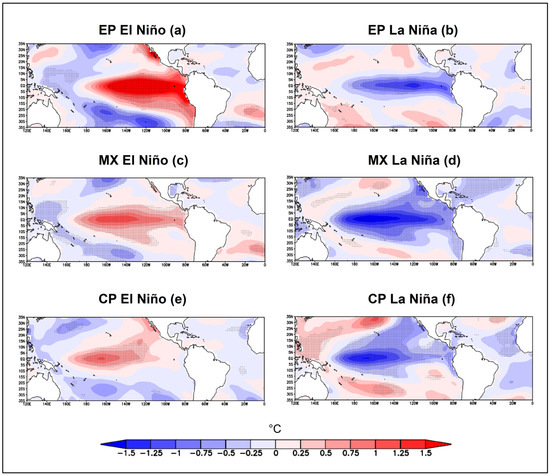
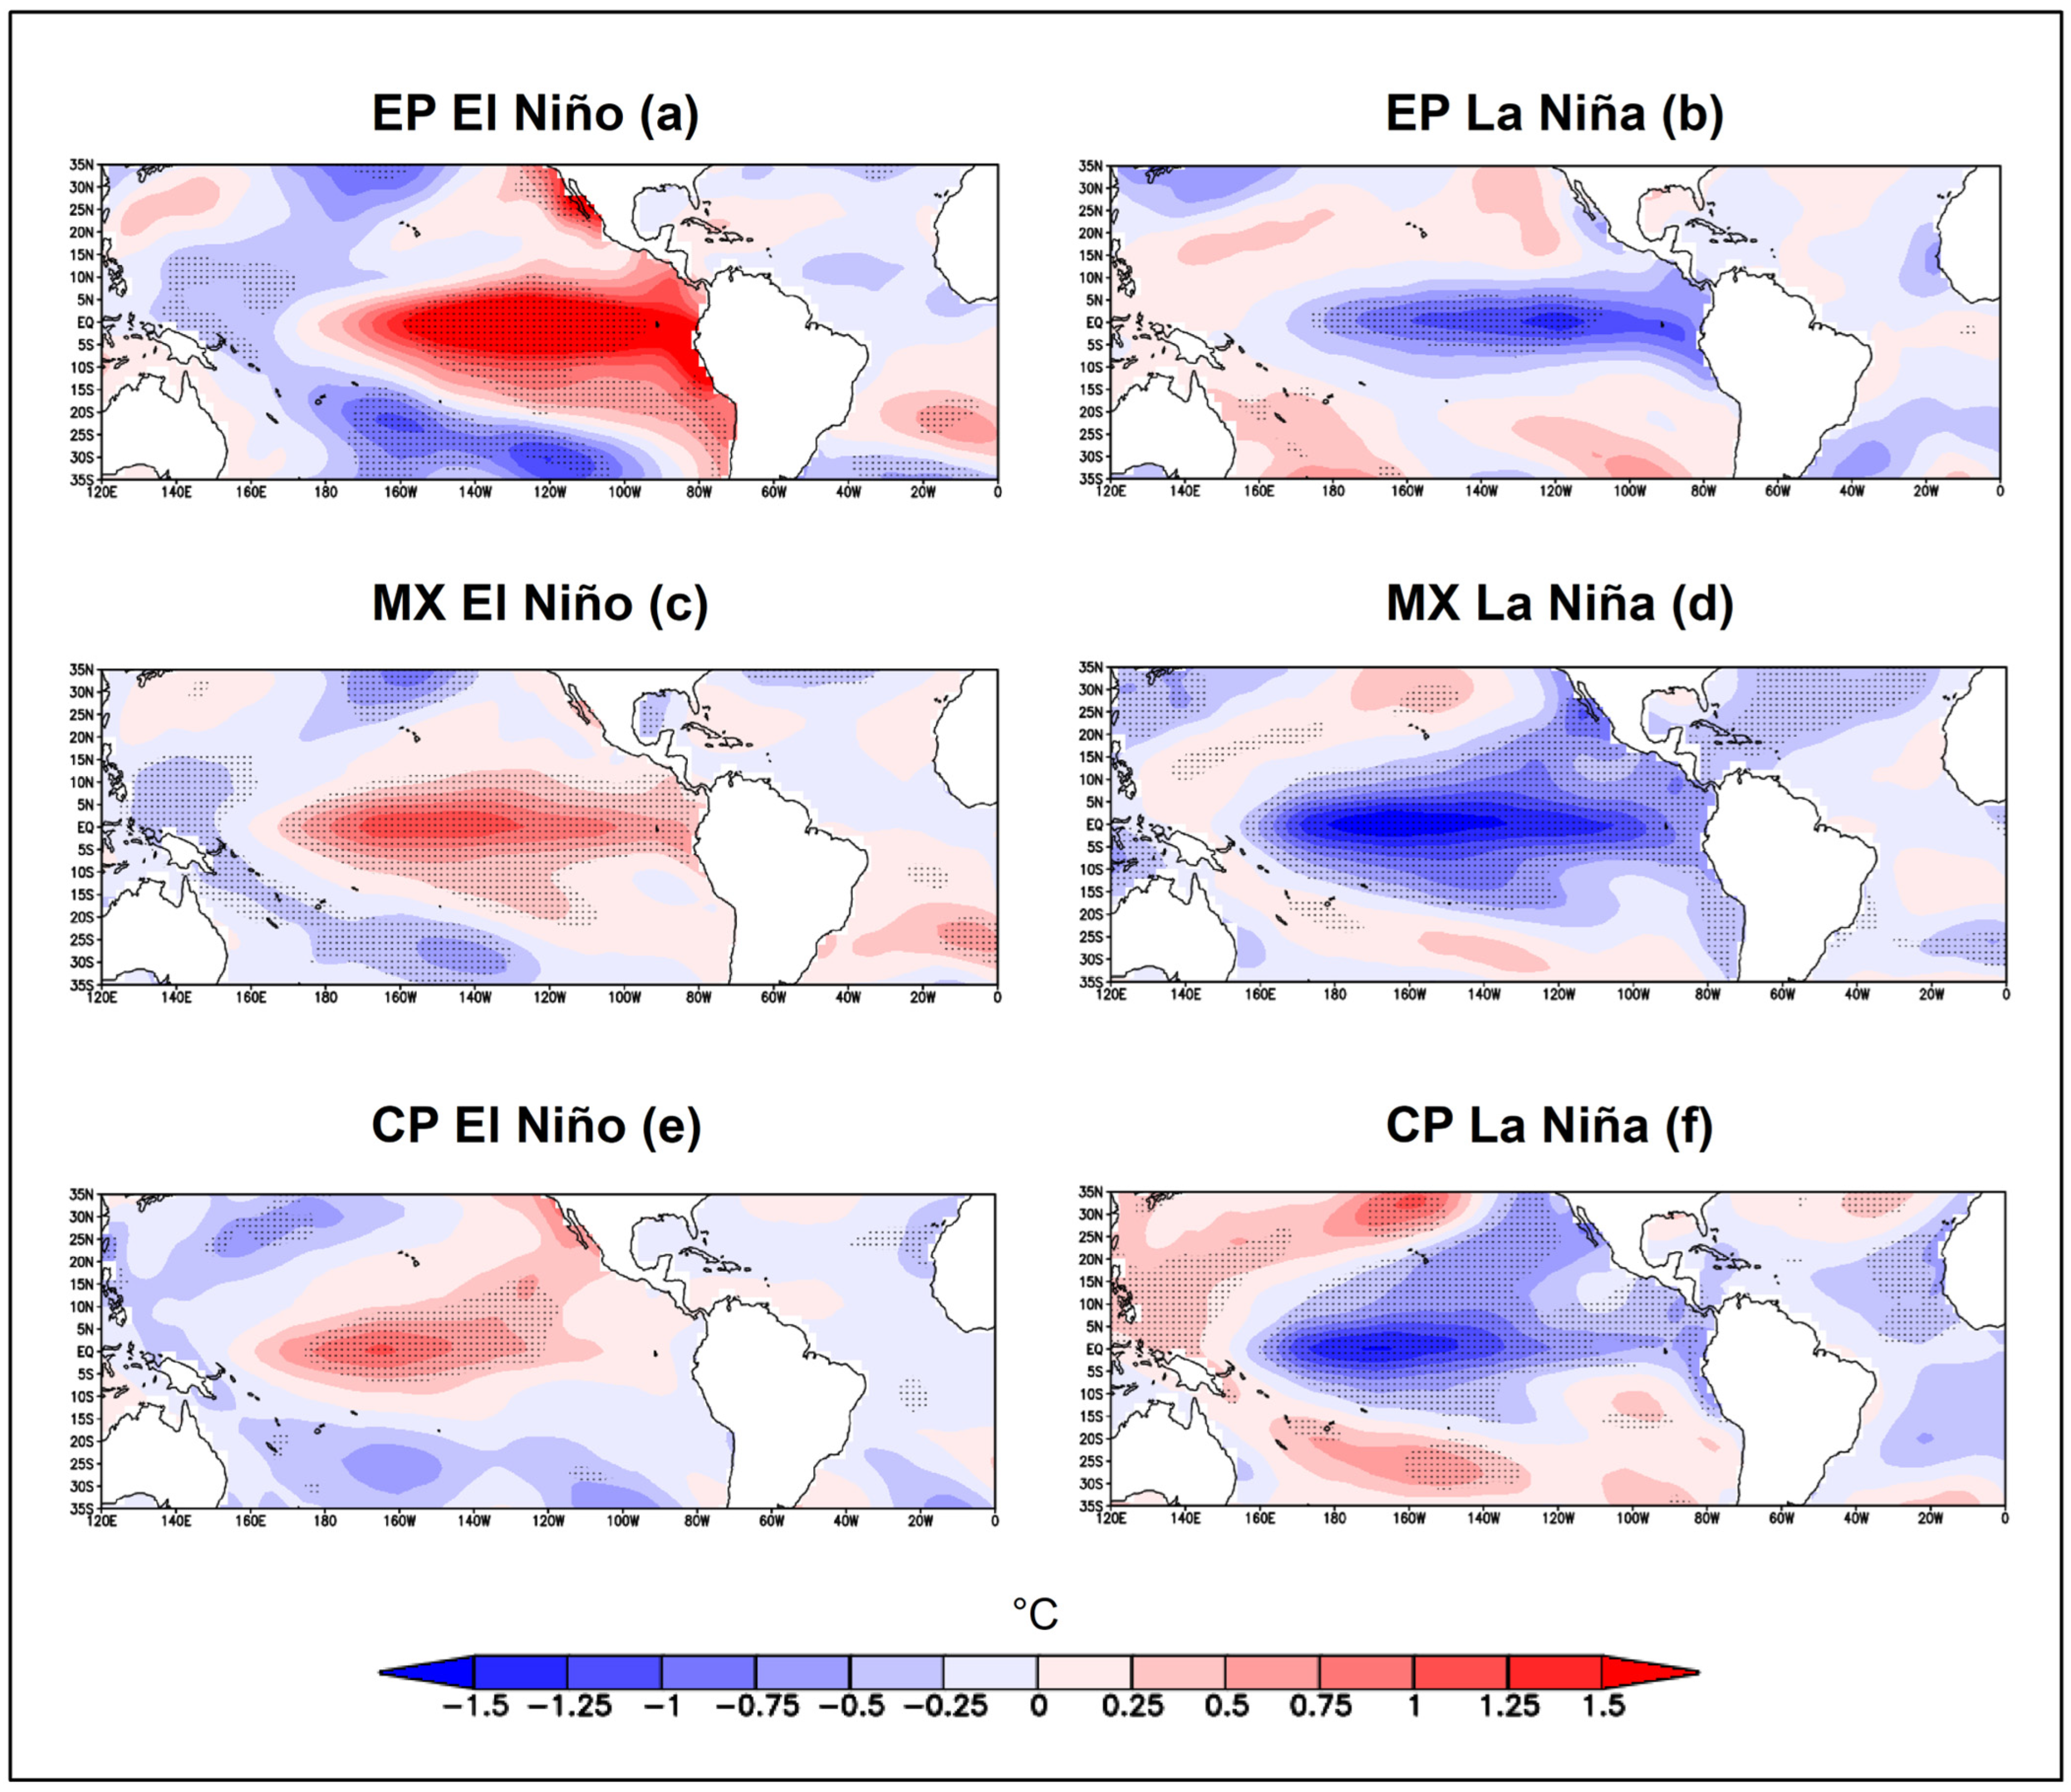
In EP events (Figure 5a,b), maximum SST anomalies occur in the equatorial Eastern Pacific (Niño 3 region), occupying a larger extent and being more intense during EN (Figure 5a) than LN (Figure 5b). In MX events (Figure 5c,d), the maximum SST anomalies occur concomitantly between the Niño 3 and Niño 4 regions. In contrast to EP events, the MX SST anomalies have a broader meridional extent in LN (Figure 5d) than EN (Figure 5c). For CP events (Figure 5e,f), the SST anomalies are in the Central Pacific (Niño4 region), being more intense in LN events (Figure 5f).
Figure 5.
Composites of SST anomalies in DJF (1976–2019) for (a) East Pacific El Niño—EP El Niño, (b) East Pacific La Niña—EP La Niña, (c) Mixed El Niño—MX El Niño, (d) Mixed La Niña—MX La Niña, (e) Central Pacific El Niño—CP El Niño and (f) Central Pacific La Niña—CP La Niña (1976–2019). Dotted areas are significant at the 90% level based on a two-tailed Student t-test.
Composite SST anomalies in the mature phase of ENSO (DJF) highlight a horseshoe or boomerang-shaped pattern noted between the equatorial Pacific SST anomalies inversely with those of the North and South Pacific (Figure 5). This process occurs in all ENSOs, but with a more evident and intense pattern in EP El Niño—EPEN (Figure 5a) and CP La Niña—CPLN (Figure 5f).
Distinct configurations of the Walker circulation observed during EP and CP events arise from the longitudinal displacement of peak SST anomalies in the equatorial Pacific. The shift in maximum SST anomalies causes ascending motions over the tropical Pacific to be more intense and extend over a larger region during EPEN than during CP El Niño—CPEN. In the case of LN years, the descending motion over the Pacific is more intense during CPLN compared to EPLN, conditions highlighted in previous studies [43,44]. These ocean-atmospheric processes interfere with rainfall patterns in the study area, as shown in the analyses developed in this investigation.
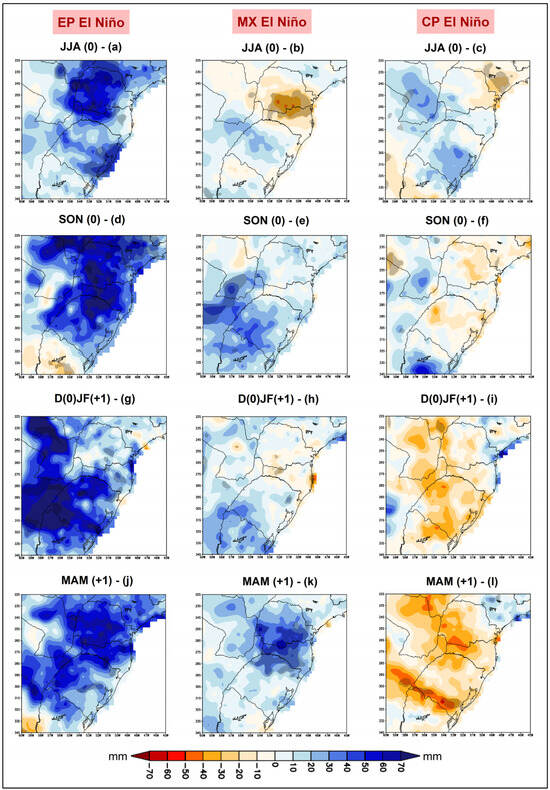
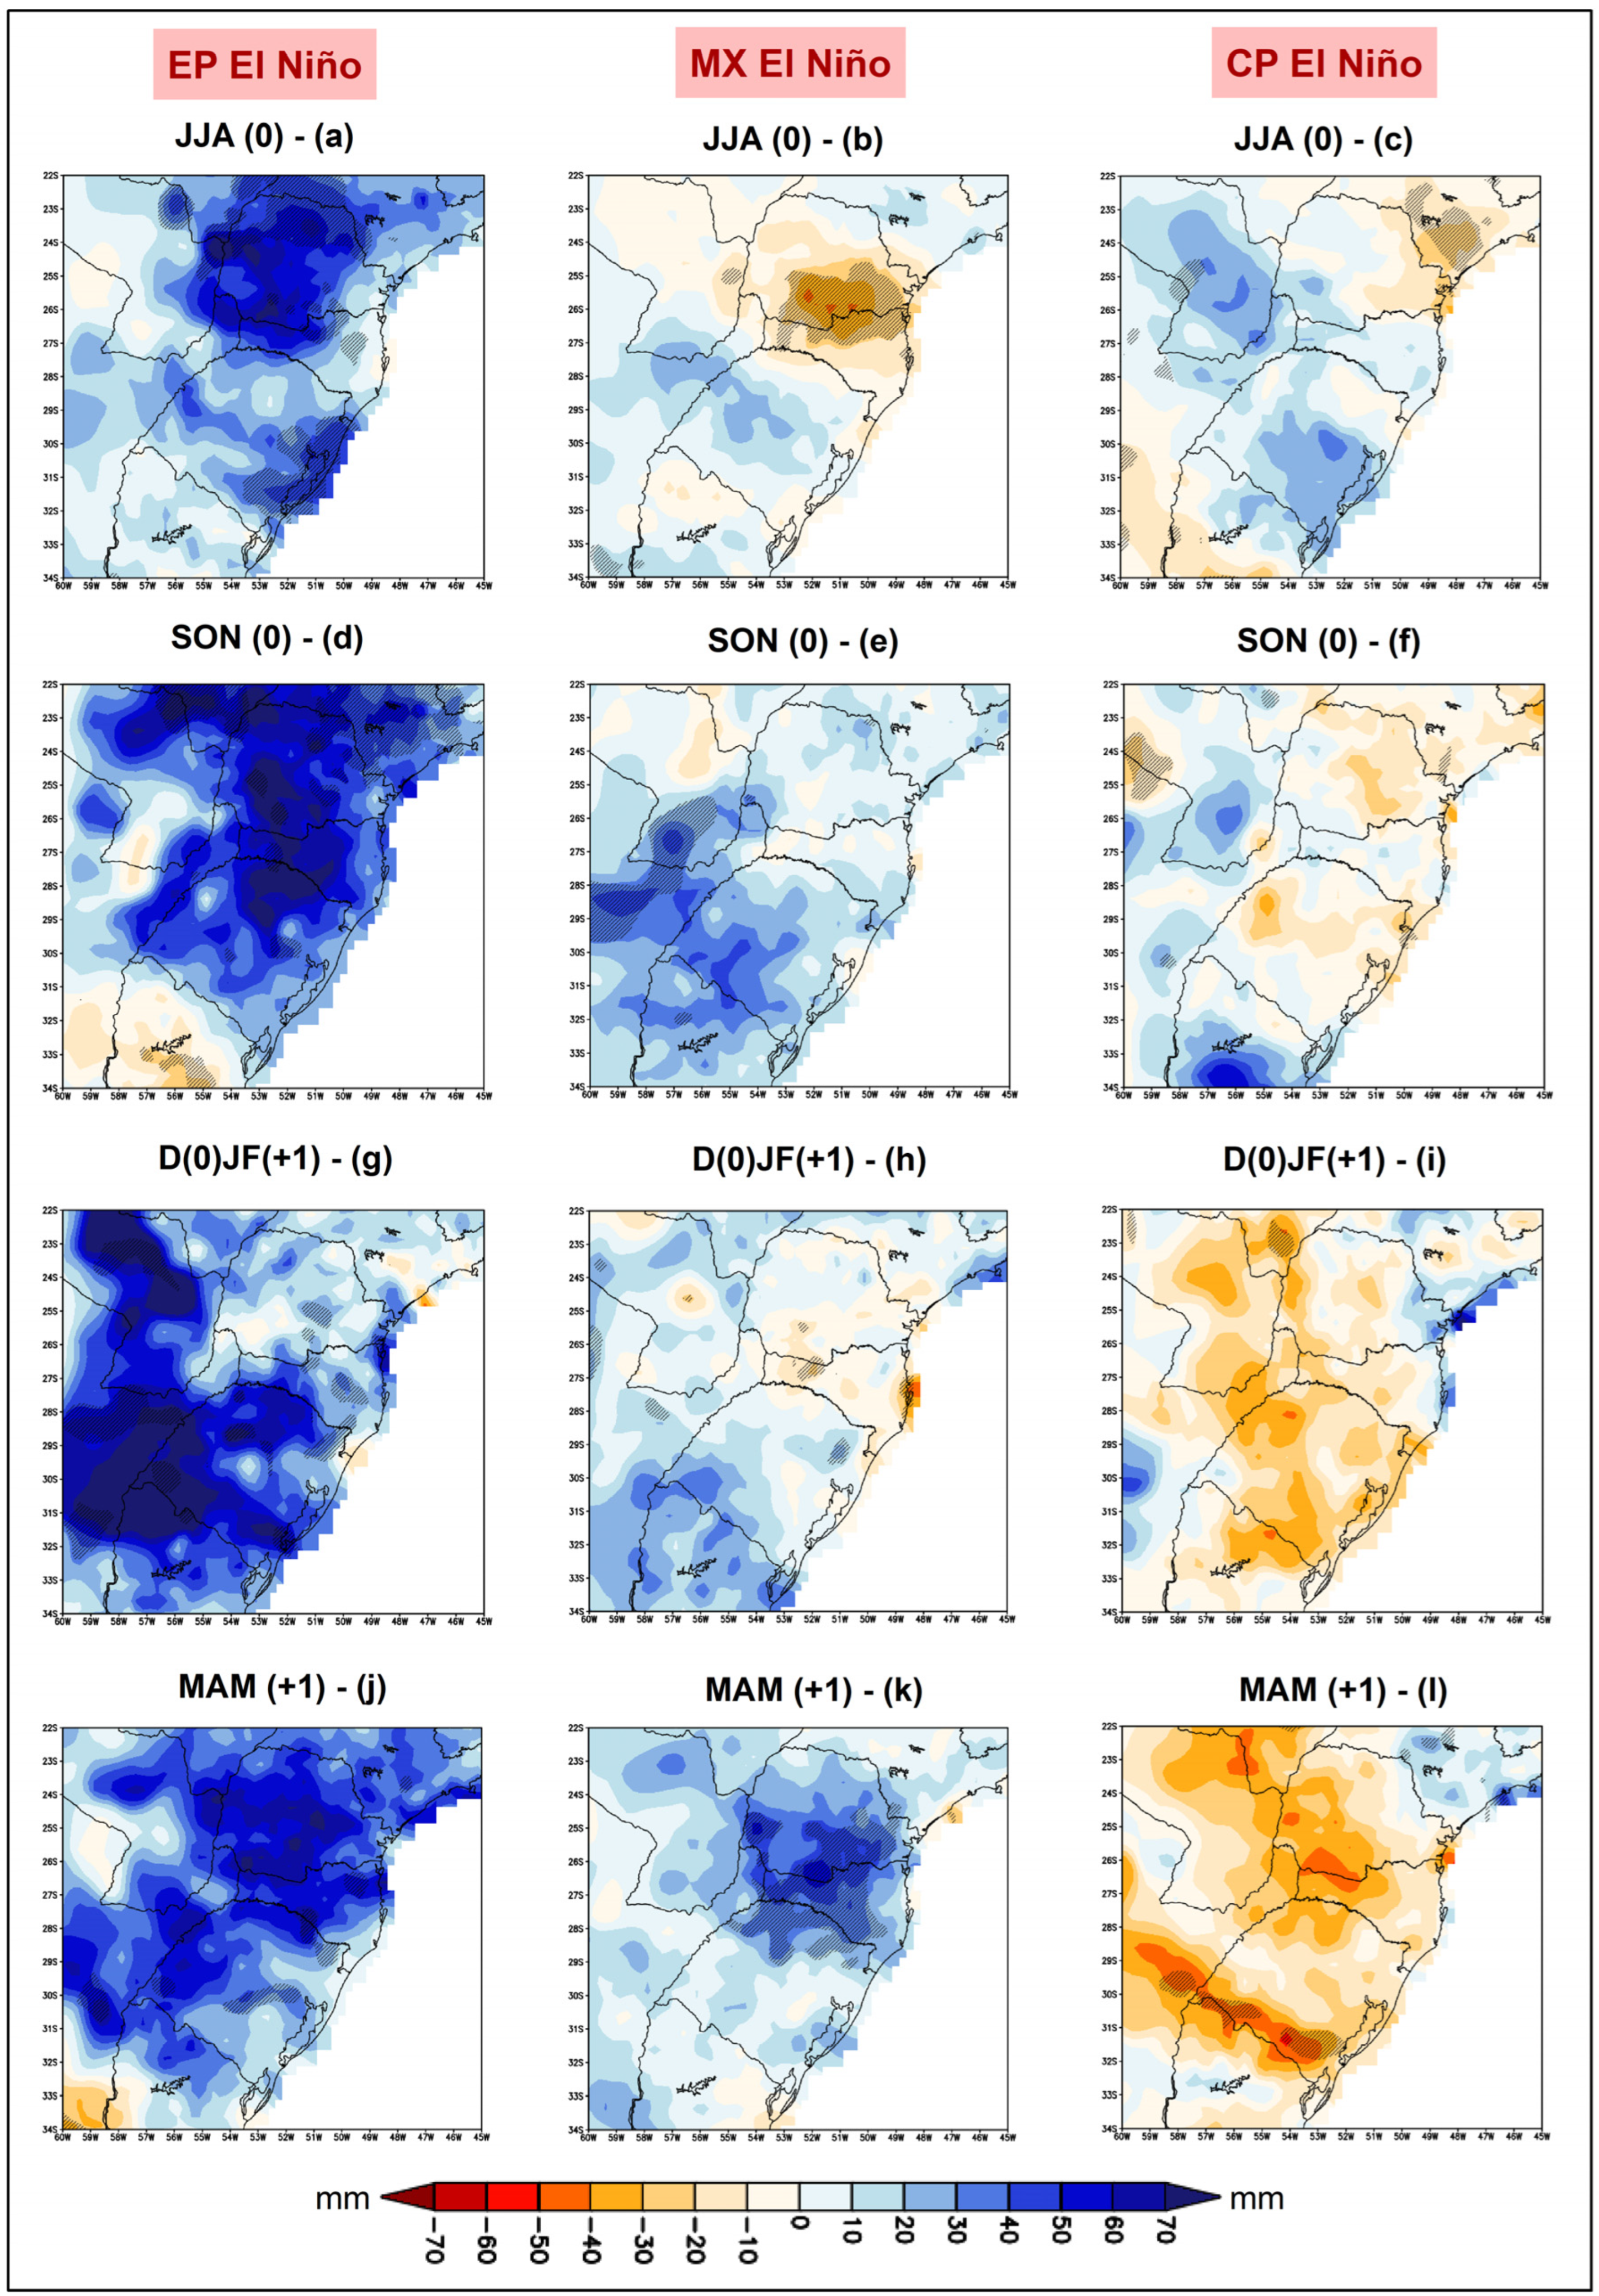
Regarding the seasonal rainfall anomaly composites (Figure 6), in EPEN (Table 1 and Figure 6—first column), positive rainfall anomalies are observed, with increases in all seasons of the year, although with few regions showing statistical significance. The spring season (SON0) is the most prominent season of the year, with positive precipitation responses throughout the southern region of Brazil (Figure 6d).
Figure 6.
Composites of seasonal precipitation anomalies (1976–2019) in the Brazilian subtropical climate during different types of El Niño: East Pacific El Niño—EP El Niño (left column), Mixed El Niño—MX El Niño (middle column) and Central Pacific El Niño—CP El Niño (right column). (a–c) JJA (0); (d–f) SON (0); (g–i) D(0)JF(+1); and (j–l) MAM (+1). Hatched areas indicate statistical significance at the 90% confidence level.
In JJA (0), the increases in rainfall are more significant in the state of Paraná and on the southeast coast of Rio Grande do Sul (Figure 6a). In summer (D0JF+1), positive rainfall signals are prominent in the southern portion of the study area, particularly in Rio Grande do Sul (Figure 6g). In MAM (+1), the configurations of precipitation patterns are similar to other seasons of the year, with evidence in the states of Paraná and Santa Catarina (Figure 6j).
Regarding MX El Niño—MXEN (Table 1 and Figure 6—second column), rainfall decreases are observed on the border between Paraná and Santa Catarina in JJA (0)—Figure 6b. In SON (0), positive signals of precipitation are more expressive in the southwest of the study region, but without statistical significance (Figure 6e). In the summer (D0JF+1), weak negative responses are observed in parts of Paraná and Santa Catarina (Figure 6h), and in autumn (Figure 6k), rainfall increases are strong in south-central Paraná and in a large part of Santa Catarina. In MXEN the anomalies are less intense compared to EPEN (Figure 6—first and second columns).
Seasonal precipitation anomalies for CPEN (Table 1 and Figure 6—third column) present distinct patterns from those evidenced in EPEN and MXEN, with a predominance of negative rainfall conditions, but with few areas of statistical significance. The seasons with the greatest variations in rainfall patterns between EPEN and CPEN are D(0)JF(+1) (Figure 6g,i) and MAM (+1) (Figure 6j,l). In autumn (MMA+1), negative anomalies predominate throughout the study area, but with statistical significance only in the south of Rio Grande do Sul (Figure 6l), showing a contrary pattern to what occurs in EPEN (Figure 6j) and MXEN (Figure 6k).
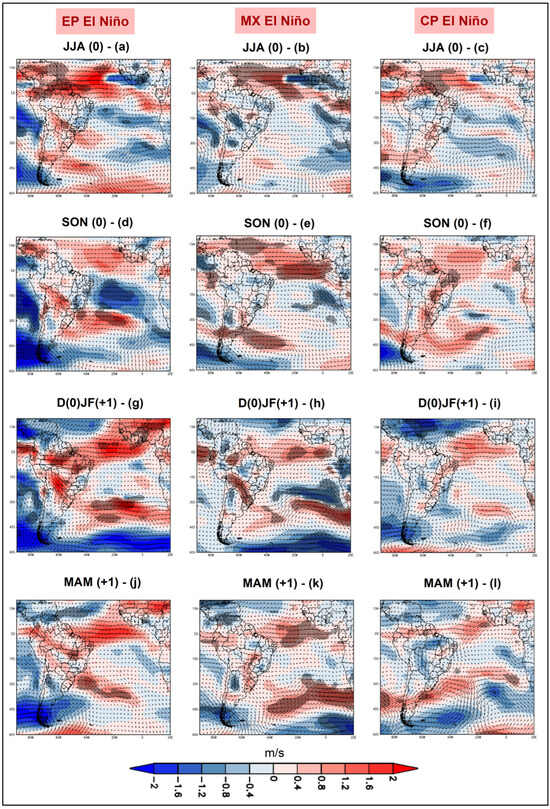
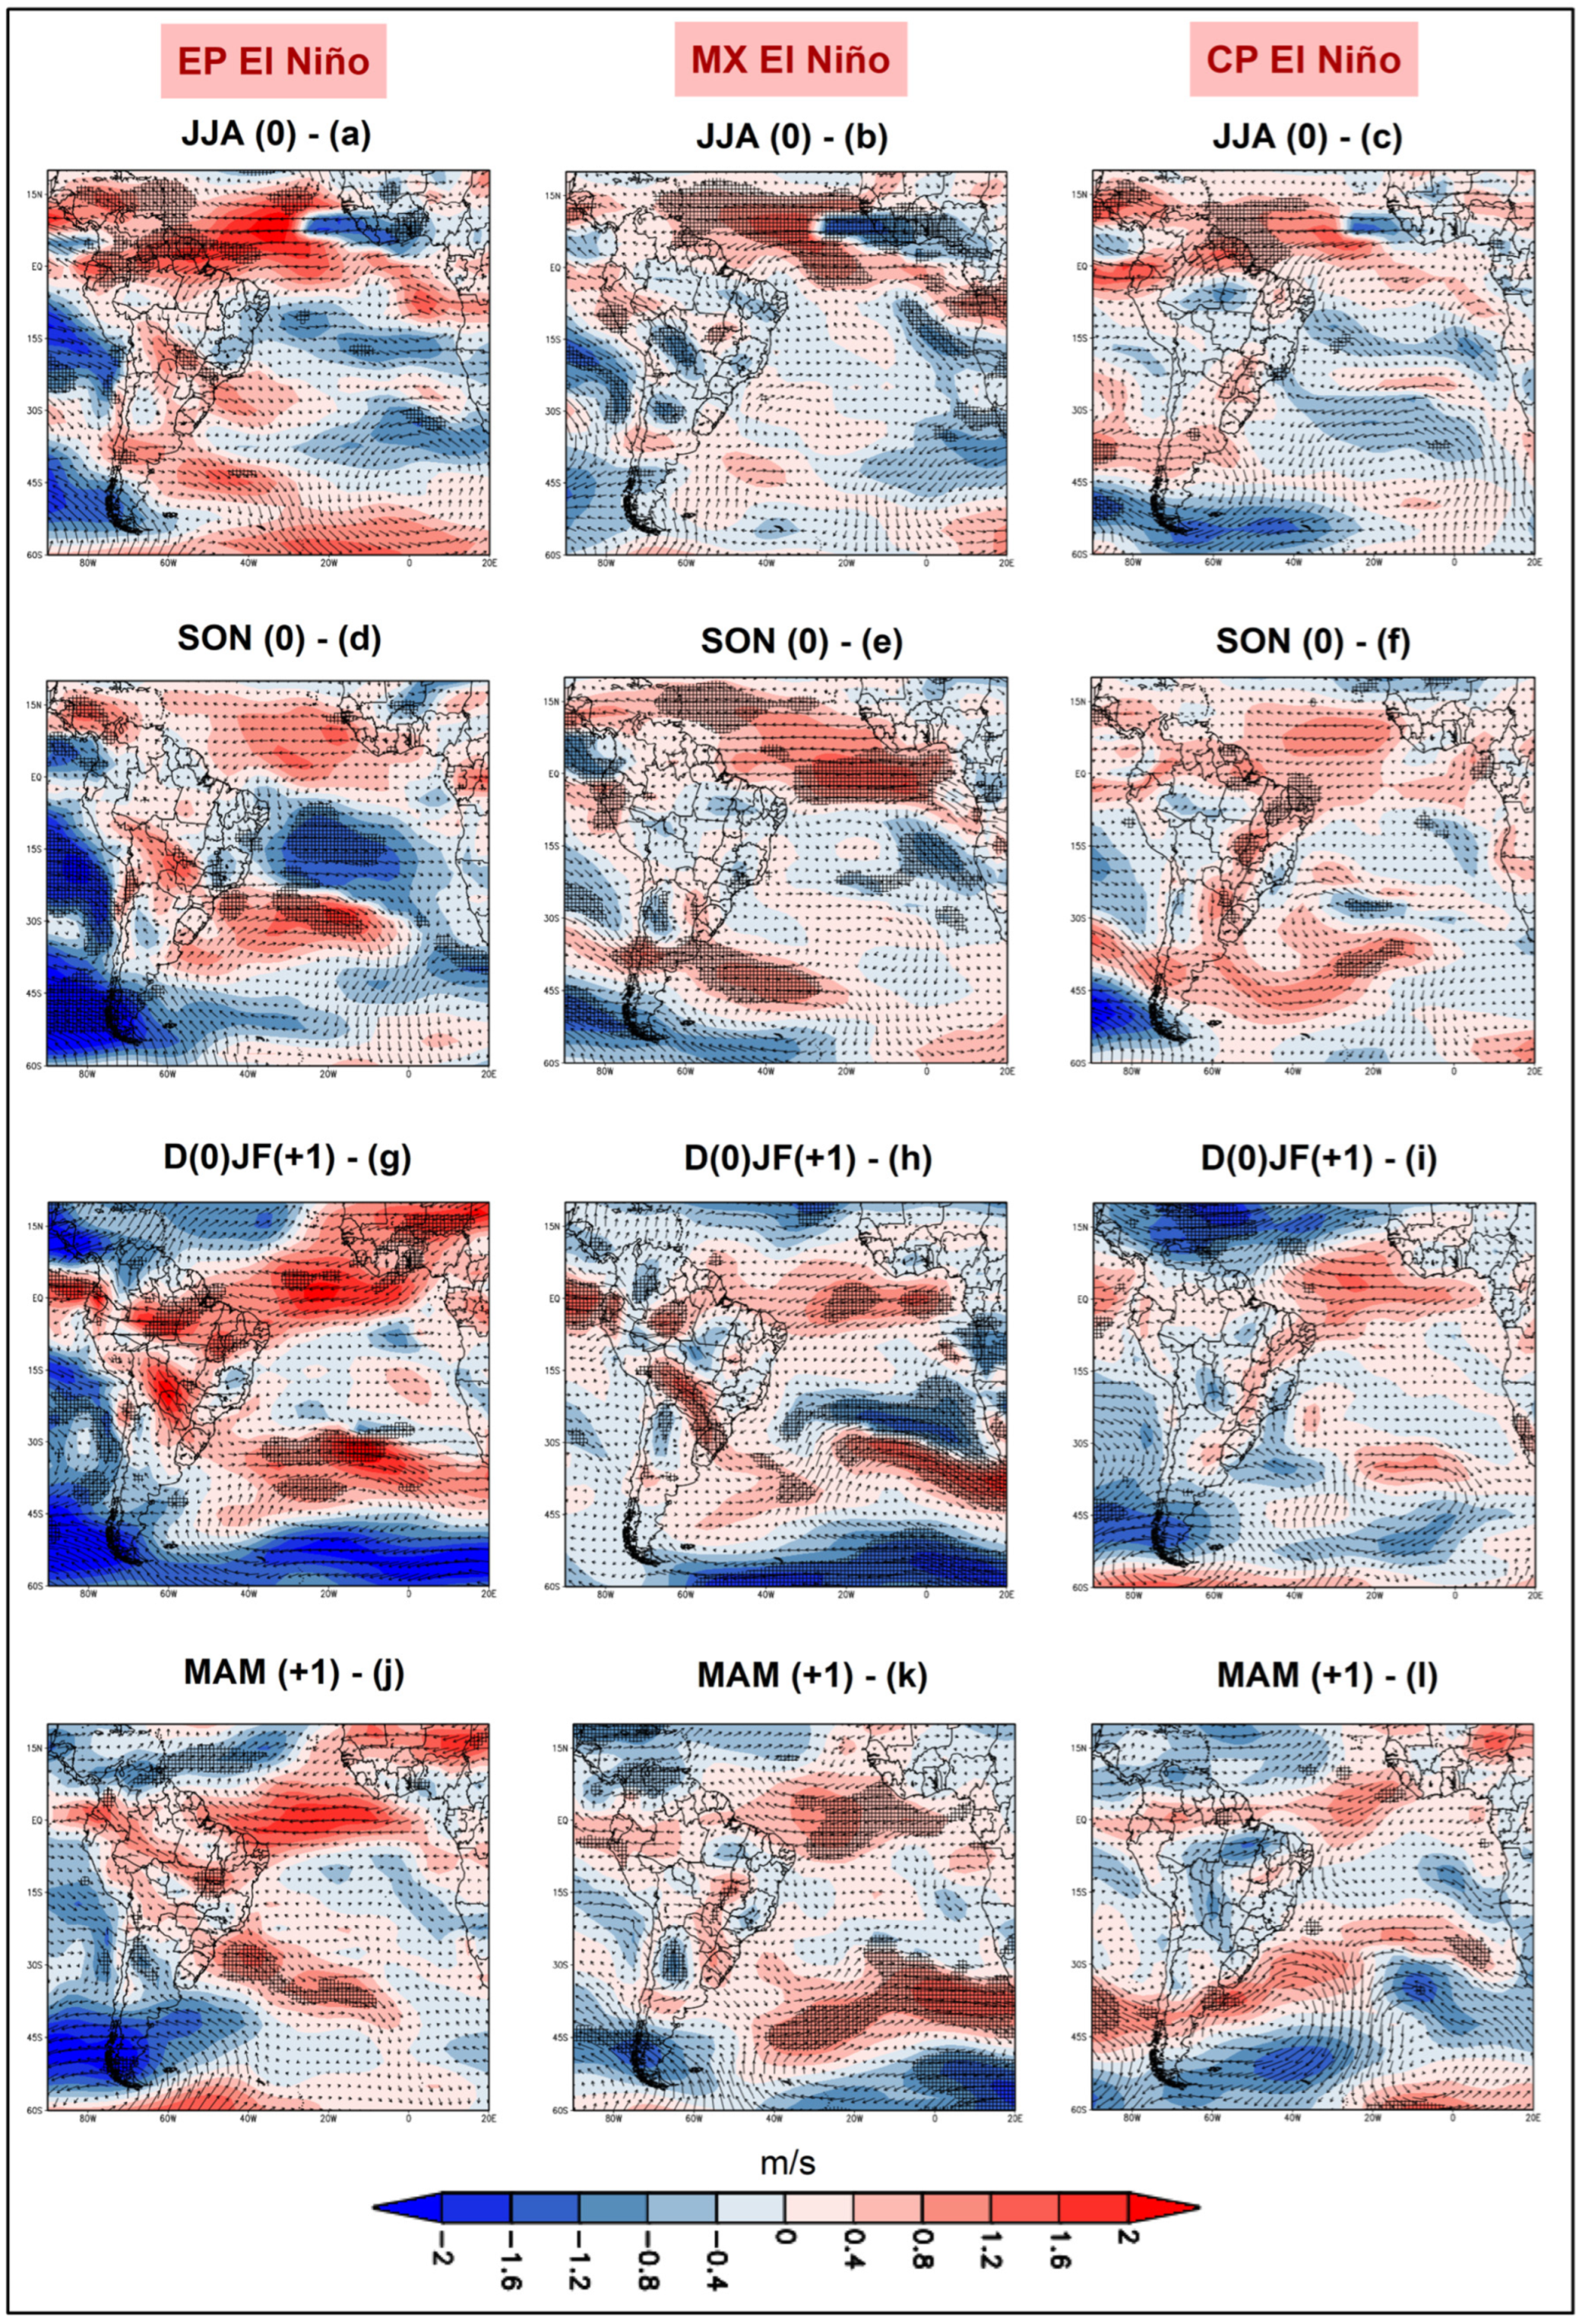
The atmospheric mechanisms associated with the different types of ENSO are explored in the 850 hPa vector wind (Figure 7 and Supplementary Materials for winds at 200 hPa). Analyses reveal that the heaviest precipitation in SON (0) in EPEN results from a stronger SALLJ-type circulation (Figure 7d). The enhanced flow along the South Atlantic Convergence Zone (SACZ) region is also intensified in D(0)JF(+1) (Figure 7g). In SON (0) and D(0)JF(+1) (Figure 7d,g), the SALLJ-type circulation patterns follow a path slightly positioned north of the climatological circulation, contributing to increased rainfall during this period as well. This pattern is consistent with previous analyses [45]. The strengthening of the SALLJ-type circulation during EP El Niño events observed here is consistent with previous findings for southeastern SA [16].
Figure 7.
Composites of 850 hPa wind vector anomalies (m/s) over South America (1976–2019) during East Pacific El Niño—EP El Niño (left column), Mixed El Niño—MX El Niño (middle column) and Central Pacific El Niño—CP El Niño (right column). (a–c) JJA (0); (d–f) SON (0); (g–i) D(0)JF(+1); and (j–l) MAM (+1). Hatched areas indicate statistical significance at the 90% confidence level.
In MXEN events, a weaker SALLJ-type circulation is observed in JJA (0) (Figure 7b), associated with negative precipitation patterns over Paraná and Santa Catarina (Figure 6b). Positive precipitation anomalies in the subtropical region predominate during SON (0)—Figure 6e (between southern Paraguay and northeastern Argentina) and MAM (+1) (between Paraná, Santa Catarina, and northern Rio Grande do Sul)—Figure 6k. In the southern spring (SON0), increased precipitation is associated with the strengthening of the subtropical jet stream (see Supplementary Materials—Figure S1), while in the southern autumn (MAM+1) there are low-level winds originating in central Brazil (Figure 7k).
On the other hand, in CPEN (Figure 6 and Figure 7—third column), a weakening of the SALLJ-type circulation is observed, promoting less transport of moisture from the Amazon and the tropical Atlantic, and consequently, the predominance of negative precipitation anomalies for southern Brazil, especially in D(0)JF(+1) and MAM (+1)—Figure 6i,l, Figure 7i,l.
Analyses at high atmospheric levels (200 hPa—Supplementary Materials—Figure S1) suggest the strengthening of the subtropical jet around 30° S over SA in EPEN, intensifying extratropical cyclones, frontal systems, mesoscale convective systems, and extreme precipitation in the study area, especially in spring and summer. These conditions are only observed in spring for MXEN. On the other hand, in CPEN events, the positioning of the subtropical jet at higher latitudes (around 40° S) is observed, which prevents precipitation in the Brazilian subtropical climate. These conditions are consistent with the precipitation anomalies found in this investigation (Figure 6) and are detailed in previous study [16].
Analyses previously developed for southeastern SA [16] demonstrated that, in EP-type events, the SALLJ, the subtropical jet stream (around 30° S—see Supplementary Materials—Figure S1), and the Pacific-South America (PSA) pattern [46] are strengthened, and Rossby waves are better structured compared to CPEN. In CP-type events, these dynamics are especially displaced and weakened, which contributes to the configuration of negative rainfall anomalies in southern Brazil, particularly in MAM (+1)—Figure 6l. These results are also documented in other studies for SA [5,26,27,33,34,44].
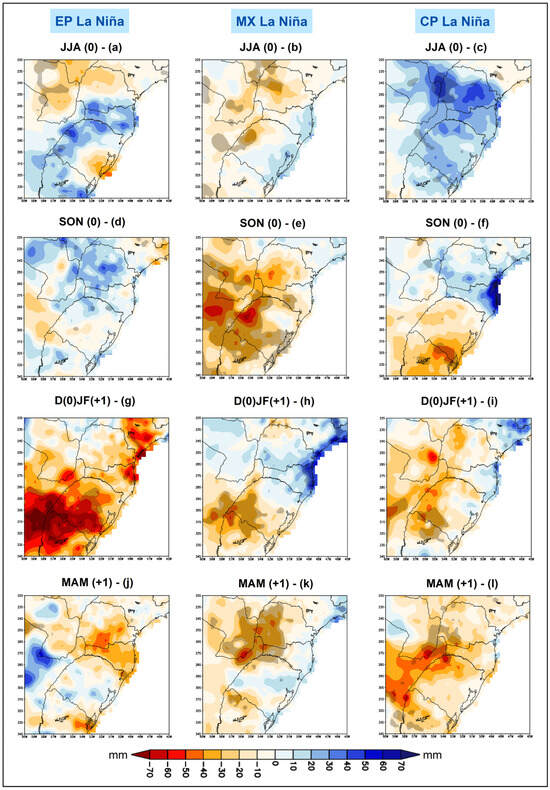
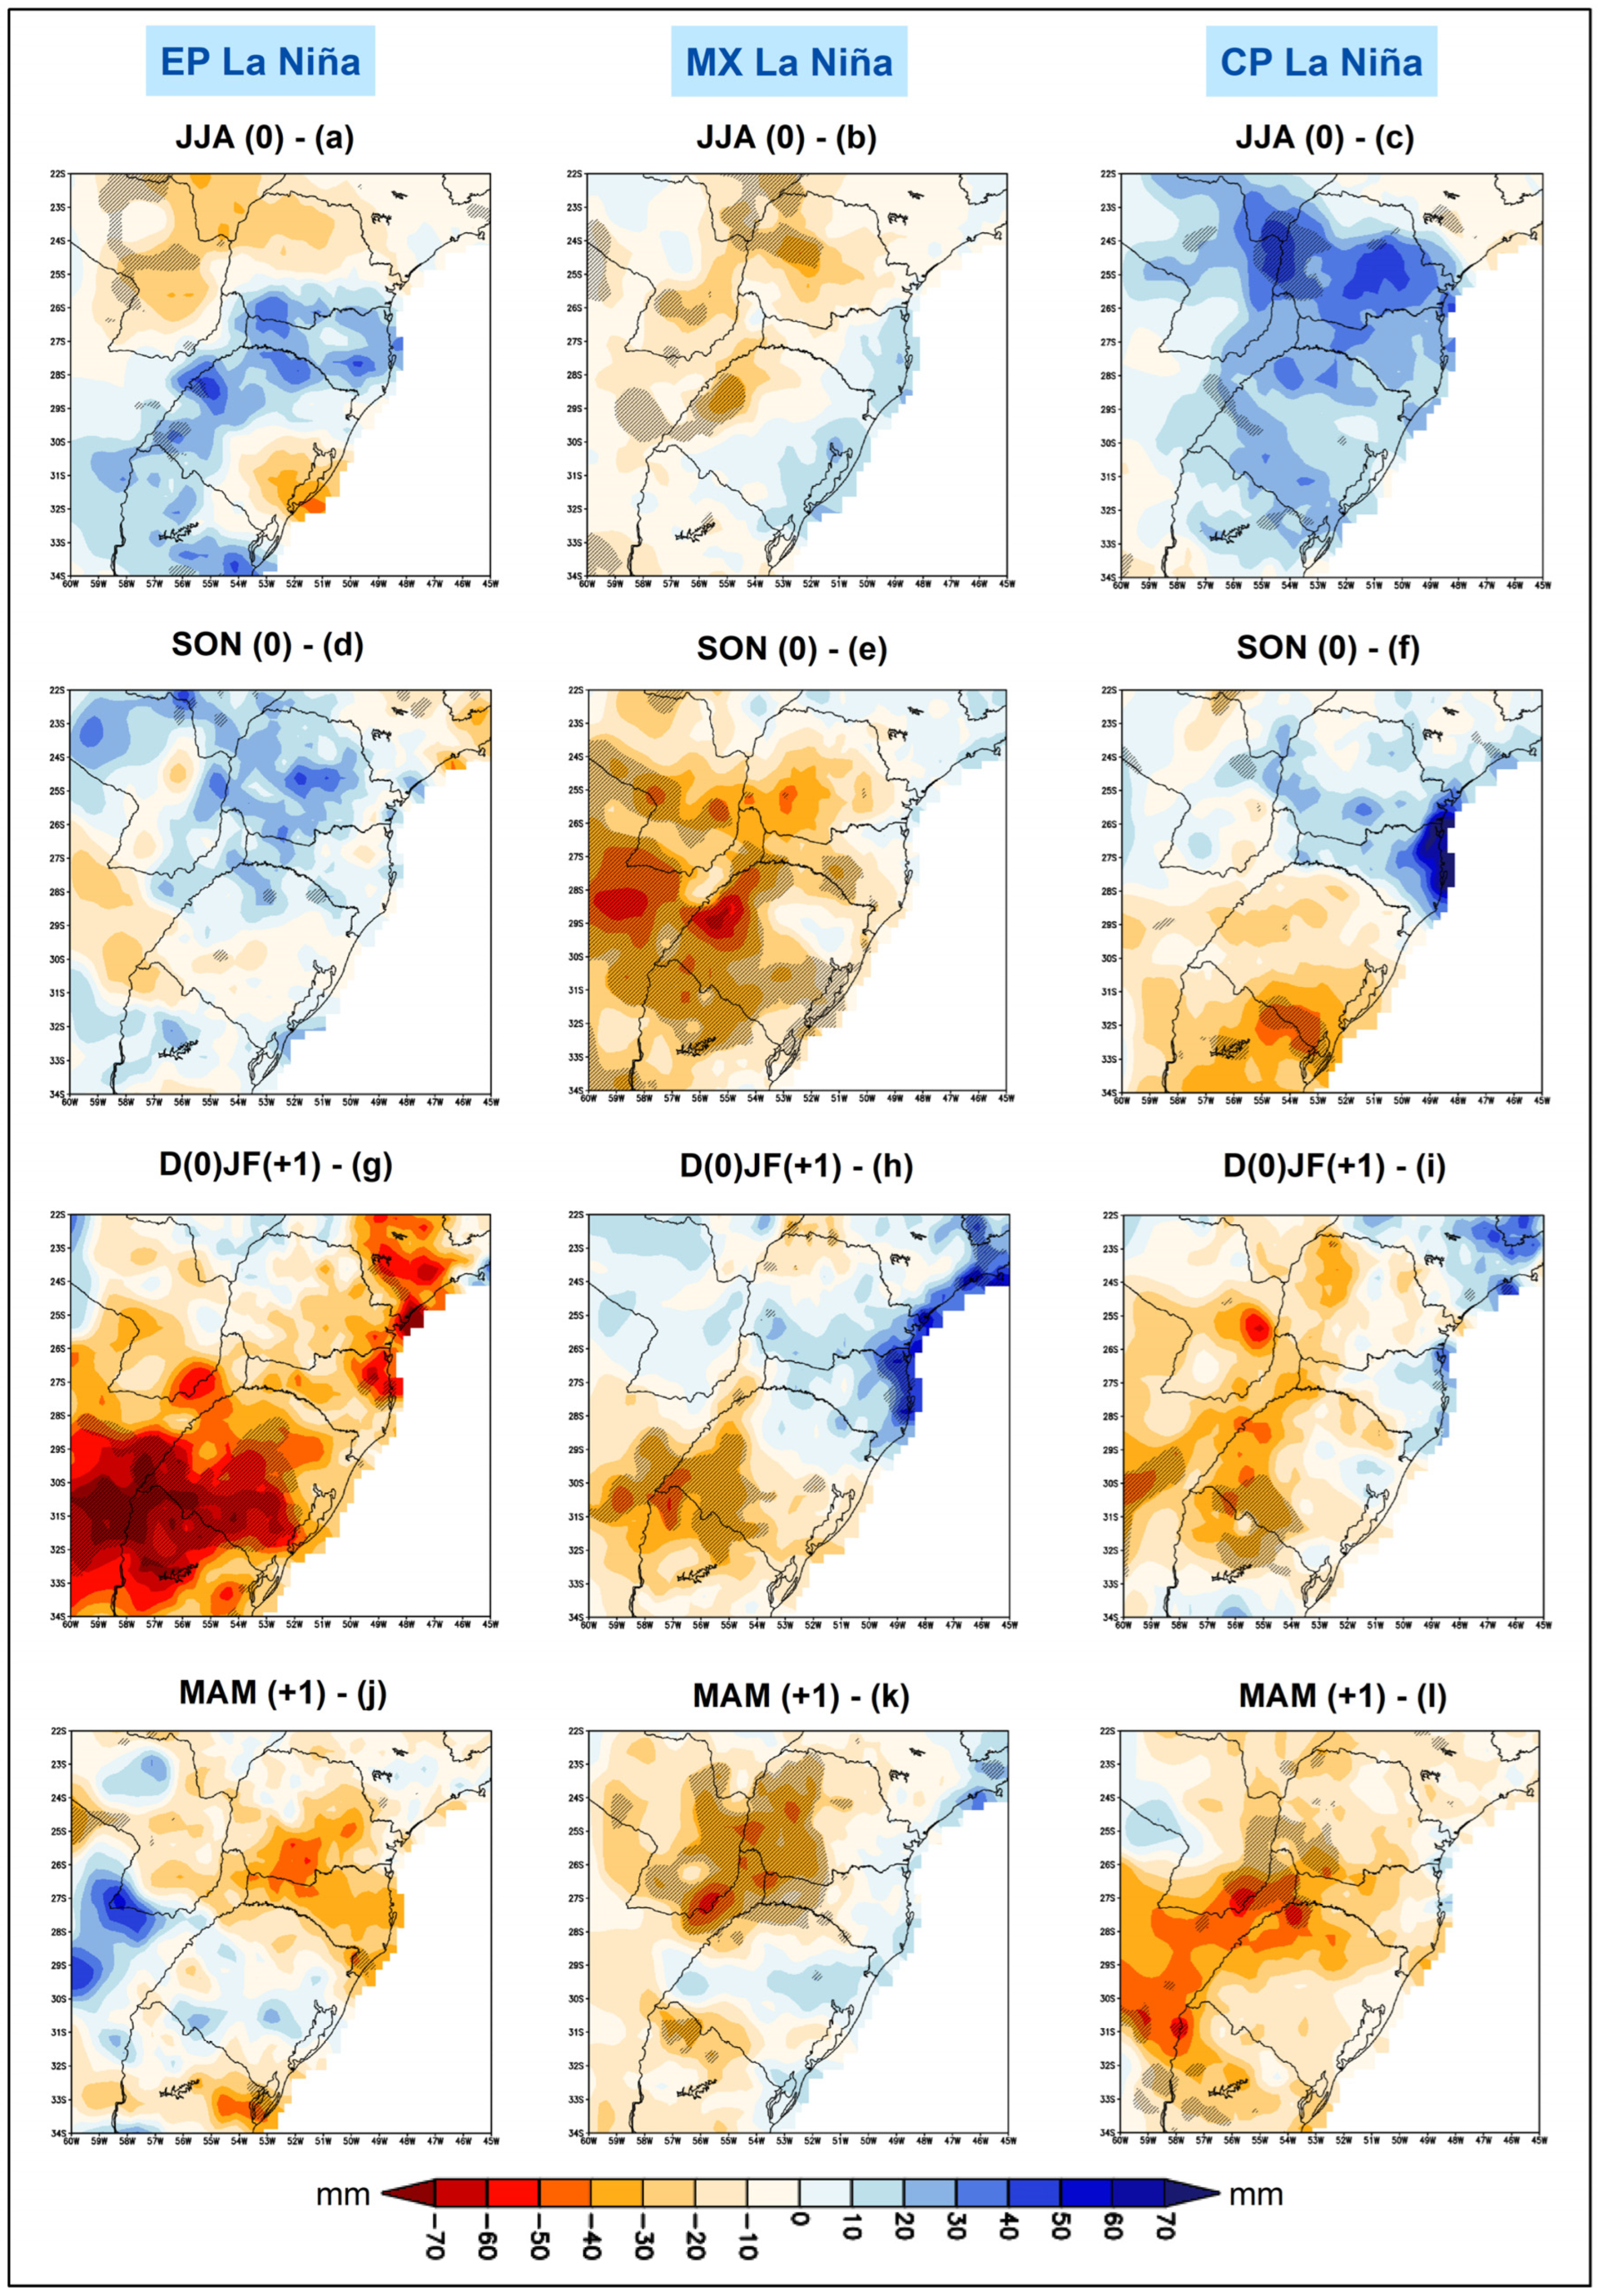
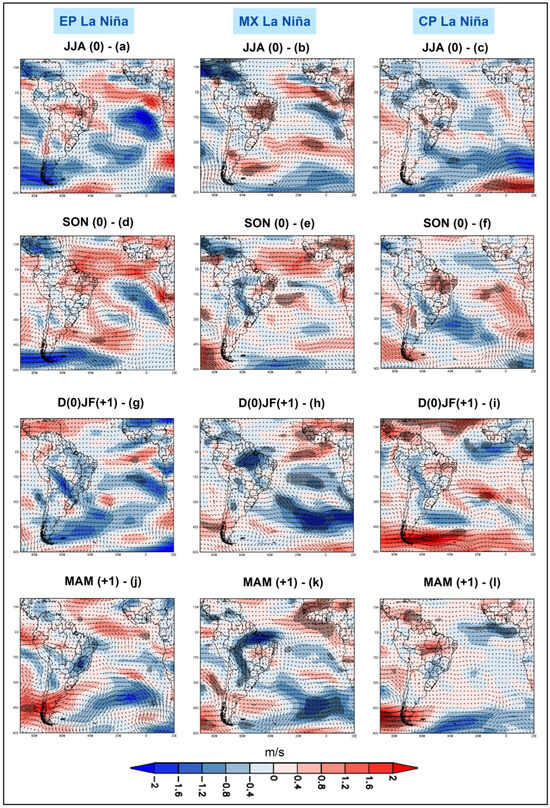
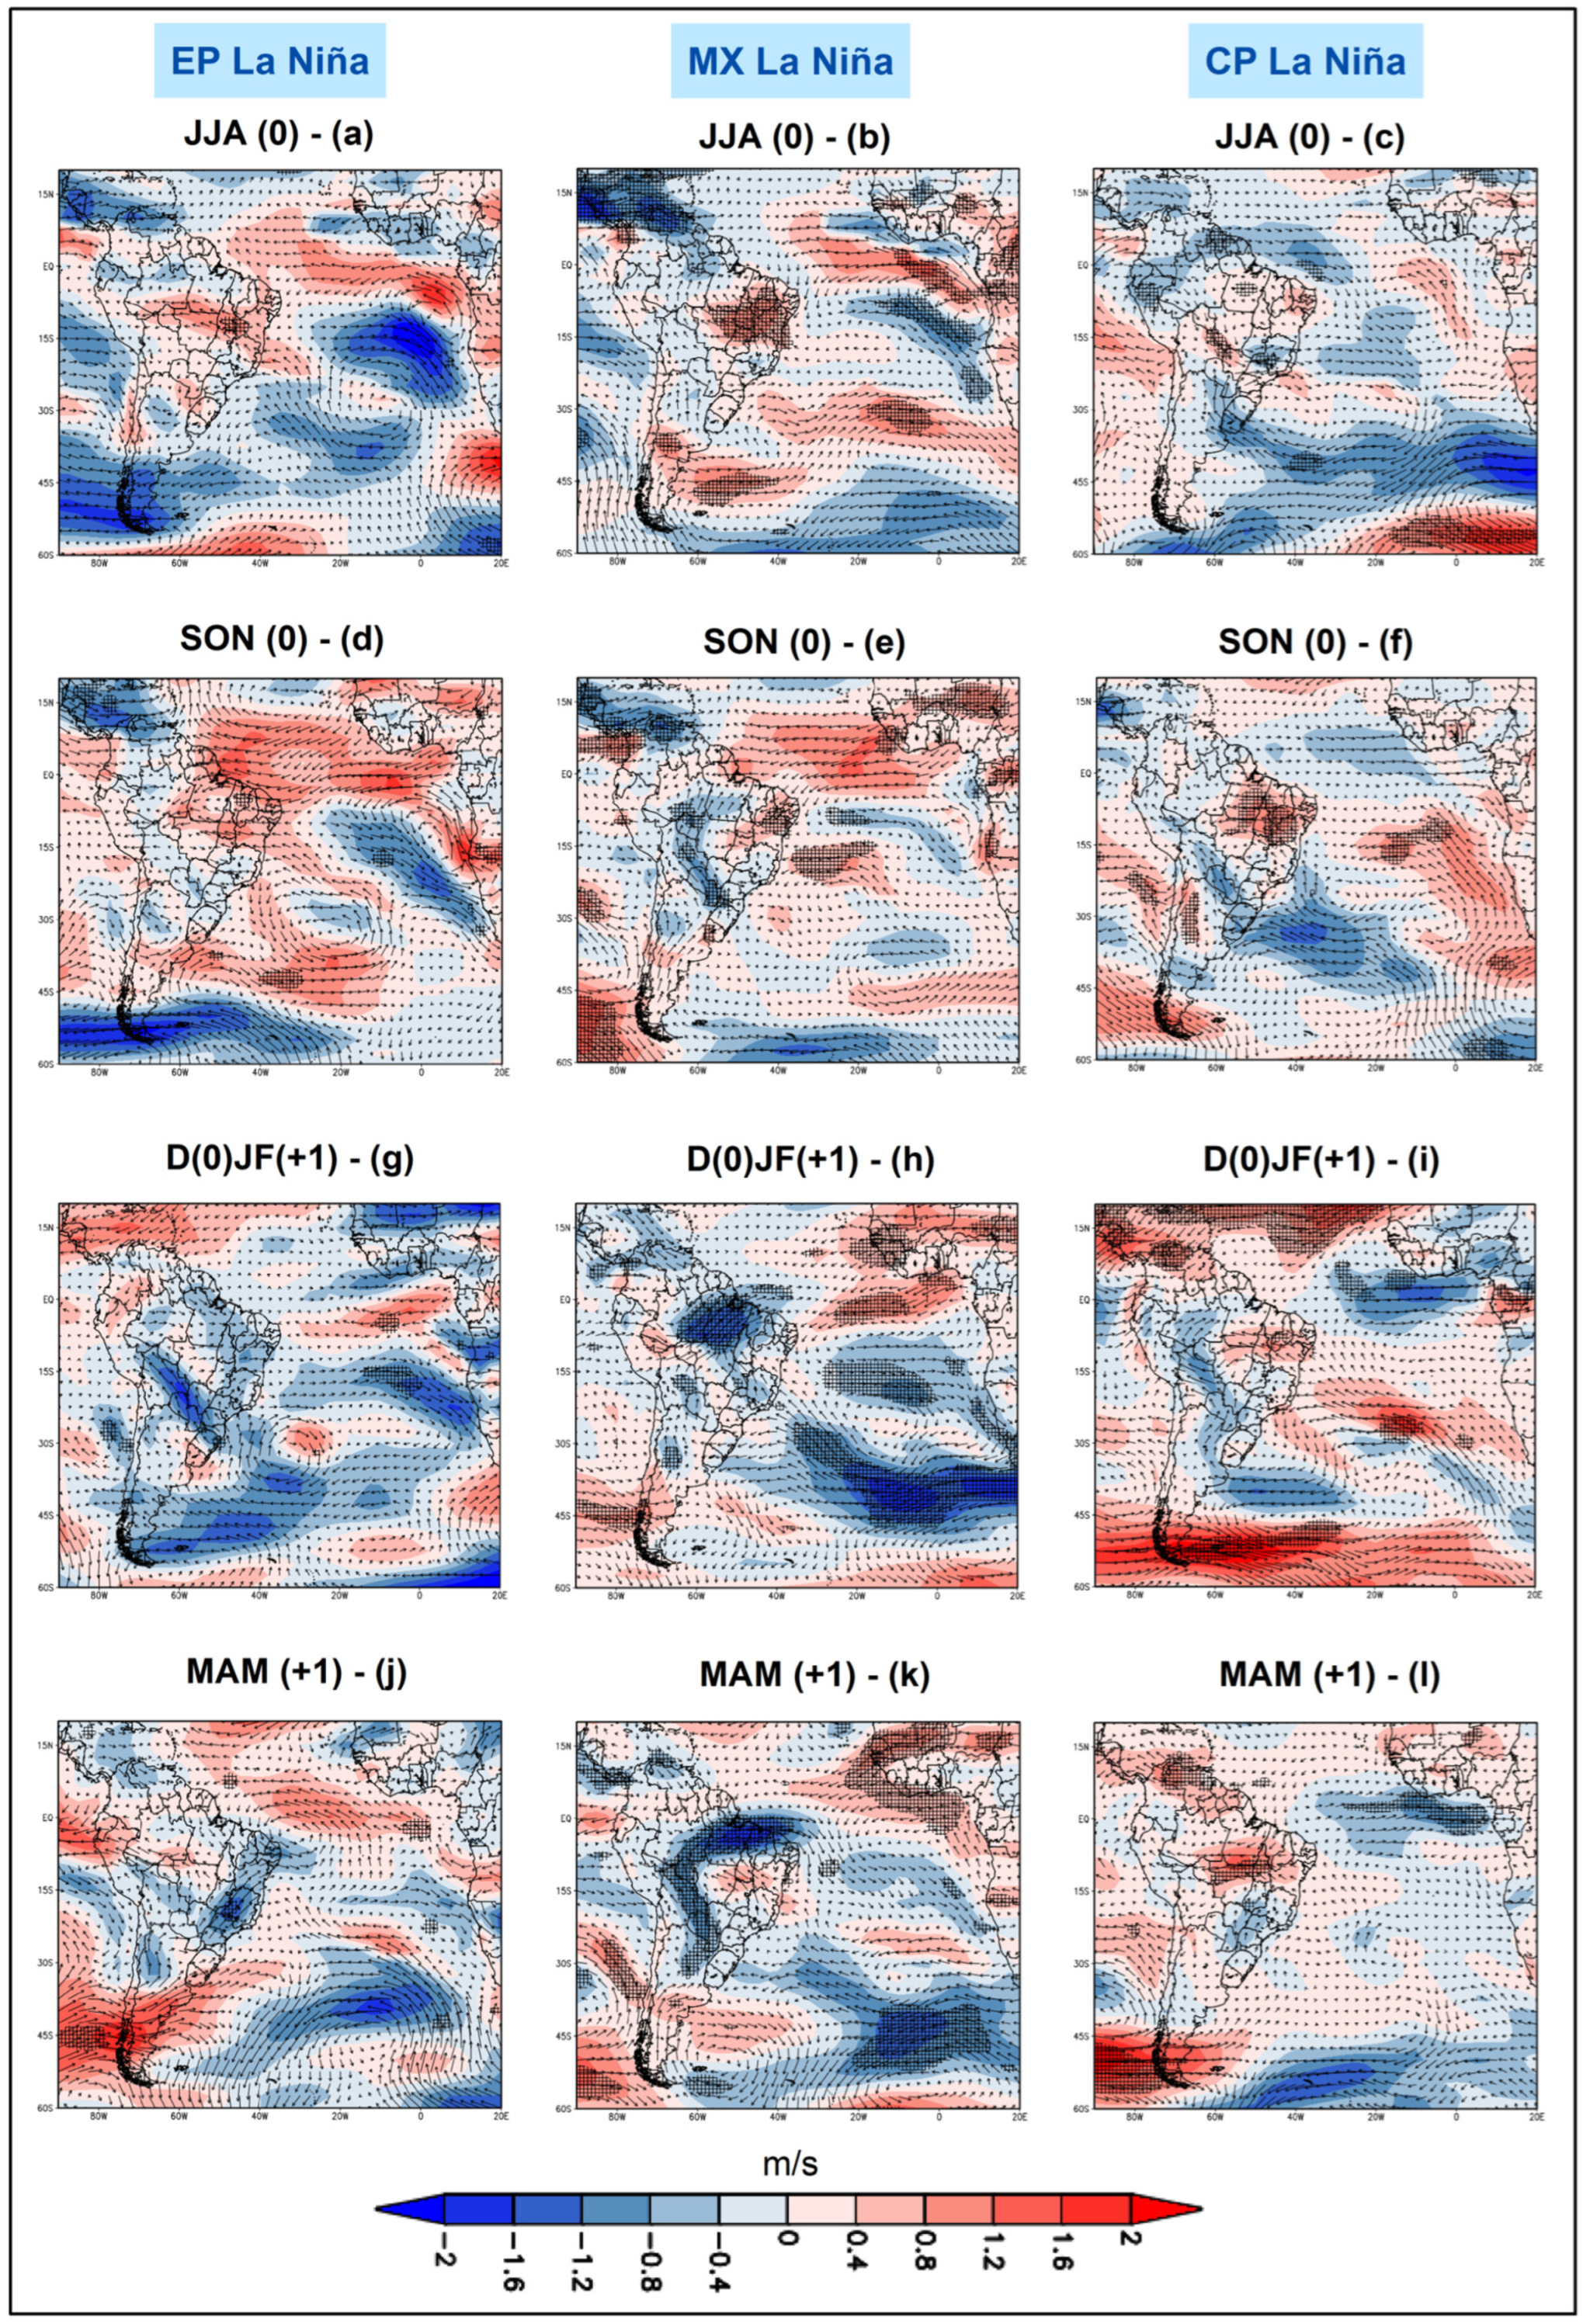
Regarding the LN-related rainfall patterns, the seasonal rainfall anomaly composites for EPLN (see Table 1 and Figure 8—first column) show larger negative precipitation anomalies in D(0)JF(+1) and MAM (+1)—Figure 8g,j. The most significant negative rainfall responses both in terms of spatial extent and magnitude occur in D(0)JF(+1), located mainly in the states of Paraná, Santa Catarina, and Rio Grande do Sul (Figure 8g). In this case, there is a weakening of the SALLJ-type circulation (Figure 9g), as well as a strengthening of the subtropical jet over the southeast SA (Supplementary Materials—Figure S2).
Figure 8.
Composites of seasonal precipitation anomalies (1976–2019) in the Brazilian subtropical climate during different types of La Niña: East Pacific La Niña—EP La Niña (left column), Mixed La Niña—MX La Niña (middle column) and Central Pacific La Niña—CP La Niña (right column). (a–c) JJA (0); (d–f) SON (0); (g–i) D(0)JF(+1); and (j–l) MAM (+1). Hatched areas indicate statistical significance at the 90% confidence level.
Figure 9.
Composites of 850 hPa wind vector anomalies (m/s) over South America (1976–2019) during East Pacific La Niña—EP La Niña (left column), Mixed La Niña—MX La Niña (middle column), and Central Pacific La Niña—CP La Niña (right column). (a–c) JJA (0); (d–f) SON (0); (g–i) D(0)JF(+1); and (j–l) MAM (+1). Hatched areas indicate statistical significance at the 90% confidence level.
Although the strengthening of the subtropical jet enhances upper-level divergence, which dynamically favors ascending motion and the development of convection over southeastern South America, there was no increase in precipitation over southern Brazil (see Figure 8g). In this context, the relatively weak SALLJ-type circulation plays a crucial role by limiting the low-level moisture transport from the Amazon region, thereby reducing moisture convergence over the subtropical region.
This configuration highlights an imbalance between dynamic and thermodynamic contributions to convection: while upper-level divergence promotes upward motion, the lack of sufficient moisture in the lower troposphere constrains the development of deep convection. As a result, the atmospheric column exhibits limited moisture availability and reduced column-integrated water vapor, restricting the vertical growth of convective updrafts. Consequently, precipitation tends to be weaker and less widespread, despite the presence of favorable dynamical forcing aloft.
The composites of seasonal precipitation conditions for Mixed La Niña—MXLN (see Table 1 and Figure 8—second column) allows us to verify that the most relevant negative precipitation anomalies occur in spring—SON (0), covering most of southern Brazil (Figure 8e). In MAM (+1), negative precipitation anomalies are observed along the border between Brazil (States of Paraná and Santa Catarina), Paraguay, and Argentina (Figure 8k). In both transitional seasons (SON0 and MAM+1), a pronounced weakening of the SALLJ-type circulation is observed (Figure 9e,k). During the austral spring (SON0), a concurrent weakening of the subtropical jet (Figure S2e) leads to a reduction in upper-tropospheric divergence, thereby inhibiting ascending motions. In contrast, during the austral autumn (MAM+1), the weakening of the South Atlantic Subtropical High (Figure 9k) contributes to the reduced intensity of the SALLJ-type circulation. In D(0)JF(+1), weak negative anomalies are concentrated in Rio Grande do Sul (Figure 8h), and in MAM (+1) along the border between Brazil (States of Paraná and Santa Catarina), Paraguay and Argentina (Figure 8k).
In the case of the composites of seasonal precipitation anomalies for CPLN (see Table 1 and Figure 8—third column), there are increases in precipitation in JJA (0), especially in the state of Paraná (Figure 8c) and decreases in the other seasons of the year (Figure 8f, Figure 8i, and Figure 8l). In SON (0), negative precipitation anomalies are concentrated in Rio Grande do Sul (Figure 8f). During the summer (D0JF+1), these dynamics shift to the western portion of the study region, with statistical significance only in Rio Grande do Sul (Figure 8i). In autumn (MAM+1), negative rainfall anomalies are located mainly in the northwest of Rio Grande do Sul and west of Santa Catarina and Paraná (Figure 8l).
Positive precipitation anomalies during the austral winter are associated with an intensified SALLJ-like circulation pattern over Bolivia, Paraguay, and the Central-West region of Brazil (Figure 9c). Additionally, a strengthening of the subtropical jet enhances upper-tropospheric divergence, thereby favoring ascending motion (Figure S2c). In contrast, from austral summer to autumn, the weakening of the subtropical jet (Figure S2i,l) leads to reduced ascending motion and limits the formation of precipitation-producing clouds.
Intense rainfall deficit occurs primarily in D(0)JF(+1) during EPLN (Figure 8g), and in SON (0) during MXLN (Figure 8e), while during CPLN, moderate rainfall deficit persists from SON (0) through MAM (+1)—Figure 8f,i,l. Thus, in the case of LN, variations are noted in terms of intensities of negative rainfall responses in the study area, contrary to what was found in EN, with changes in rainfall patterns between ENSO typologies (Figure 6).
A previous study [14] suggests that atmospheric circulation seems to be altered both by large-scale disturbances (changes in Walker and Hadley cells and Rossby waves) and by local factors (air temperature and soil humidity) that promote significant intraseasonal changes, especially in the austral summer. The differences in terms of negative rainfall signals between LN typologies result from changes in the Walker cell (during CPLN, Walker circulation anomalies in the Central Pacific are stronger than during EPLN), the PSA pattern, and the strengthening (weakening) of the jets that transport more (less) moisture to southeast SA. These results are consistent with previous findings in the literature [5,26,33,34,44]. Higher frequency of SACZ events is also observed in LN years [47]. This fact reinforces the dipole pattern, with maximum precipitation over its southeast region and reductions in southern Brazil.
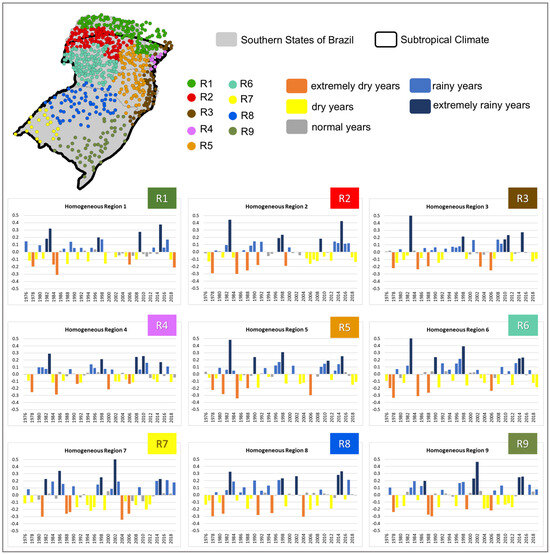
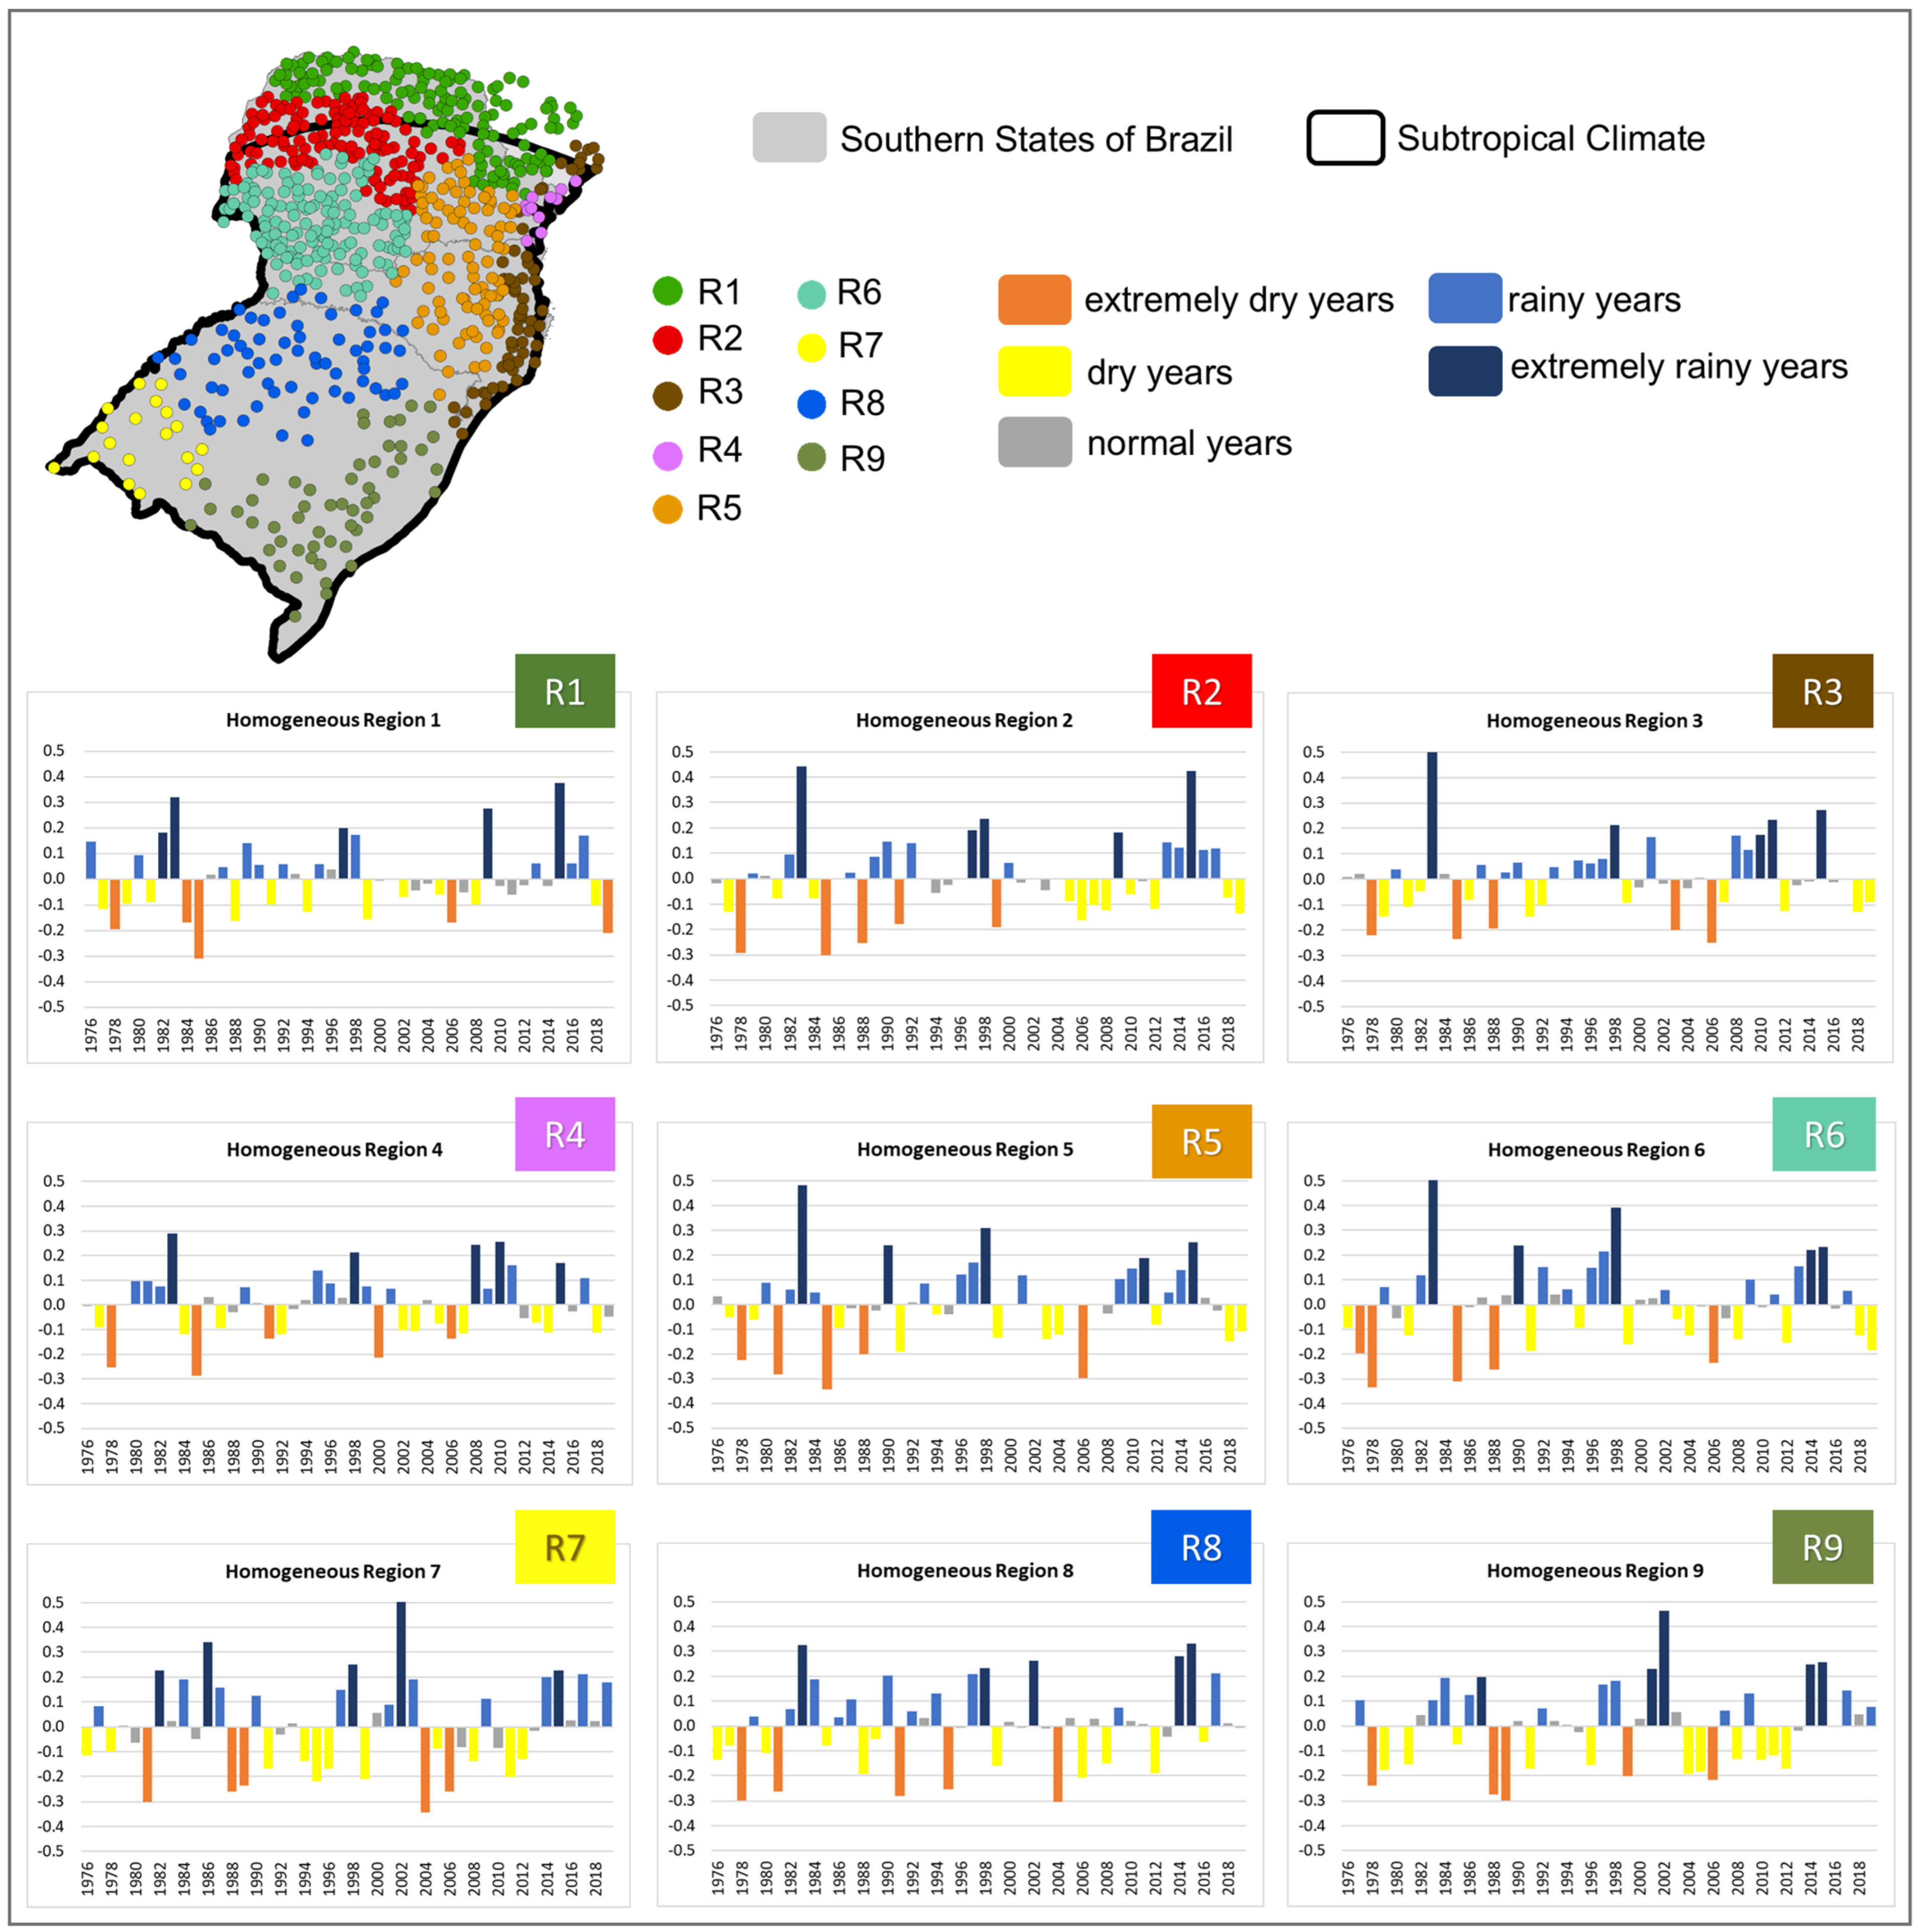
To better highlight precipitation variability and the effects of different ENSO types, the spatial domain of study was divided into nine homogeneous rainfall regions that reflect the rainfall diversity of the Brazilian subtropical climate (Figure 10). The regions with the highest rainfall totals are R3, R4, R6 and R8, located along the coastal zone (R3 and R4), in the western portion of the states of Paraná and Santa Catarina (R6) and north of Rio Grande do Sul (R8), respectively. In these regions, mean annual precipitation totals reach 1735.4 mm, 2453.9 mm, 1967.4 mm and 1852.5 mm, respectively, based on the 1976–2019 climatology.
Figure 10.
Coefficient of precipitation variation (−0.5 to 0.5) and classification of standard years by homogeneous rainfall regions in the Brazilian subtropical climate (1976–2019): extremely dry years (orange), dry years (yellow), normal/typical years (gray), rainy years (light blue) and extremely rainy years (dark blue).
The regions located in the northern and eastern portions of the study area (R1, R2, R3, and R4) exhibit tropical climate characteristics, with enhanced precipitation during summer and marked decreases during winter. In contrast, the regions located in the southern portion of the study region (Rio Grande do Sul—R7, R8, and R9) are characterized by a more regular monthly distribution of rainfall.
The analysis of rainfall variations associated with different ENSO types in these regions (Figure 10) shows that strong EPEN years (1982–1983, 1997–1998, and 2015–2016—Table 1) were generally marked by positive rainfall patterns across the homogeneous regions of the spatial domain of study. Conversely, in some La Niña years (e.g., 1985, 2006, and 2018), a predominance of dry and extremely dry conditions was observed across most of the study regions.
The years of strong EPEN intensity (1983, 1998, and 2015) were characterized as extremely rainy for the study area, with average annual variations of +603.4 mm (1983), +483.5 mm (2015), and +432.5 mm (1998), resulting in CVs of 50% variation in relation to the climatology from 1976 to 2019 (Figure 10). The most prominent regions were R6 and R3 (1983), R6 and R4 (1998), and R2 and R8 (2015).
In MXEN (Figure 10 and Table 1), greater variations between rainy and dry years are noted, with emphasis on 1988, with a predominance in the “extremely dry” classification in the study area, with average annual anomalies of −341.8 mm and emphasis on R6. In the CPEN (Figure 10 and Table 1), dry and extremely dry years predominate in the homogeneous regions defined in this study, with particular emphasis on the year 1978 (−428.9 mm annual average, especially in regions 6, 4, and 8).
The EPLN years (Figure 10 and Table 1) are characterized as extremely dry in most homogeneous regions. The years 1985 (average annual anomaly of −394.5 mm, with emphasis on R4 and R6), 2006 (average annual anomaly of −370.7 mm, with emphasis on R5, R6, and R3), and 2018 (average annual anomaly of −125.7 mm, with emphasis on regions R4, R6, R5 and R3) stand out.
In MXLN (Figure 10 and Table 1), greater variations in rainfall conditions are observed, with the presence of both rainy and dry years in the homogeneous regions of this study. Dry and extremely dry years predominate in R7 and R9, while R4 was the region that presented the greatest variations (year 2000 with annual anomalies of −523.9 mm and 2008 with +600.3 mm). In the CPLN (Figure 10 and Table 1), variations in years with wetter (2001 and 2009) and drier (1999 and 2012) weather patterns were observed in the study area, with particular emphasis on R2, R6 and R7 (1999), R3 and R9 (2001), R1 and R2 (2009) and R6, R8 and R9 (2012).
Overall, the rainfall variations in the homogeneous regions adopted in the present study reflect and corroborate the mappings in Figure 6 and Figure 8. In EP-type El Niños, rainy and extremely rainy years predominate; in MXEN, greater variations between rainfall patterns are noted; and in CPEN, predominantly dry and extremely dry years stand out. Regarding LN, conventional patterns (EPLN) were characterized as dry and extremely dry, while MXLN and CPLN showed greater variations between homogeneous regions.
4. Conclusions
The main objective of this study was to analyze rainfall variability in the Brazilian subtropical climate associated with different ENSO typologies, considering both large-scale atmospheric mechanisms and regional rainfall behavior in homogeneous precipitation regions.
Previous studies have demonstrated that variations in ENSO typologies result from changes in the large-scale atmospheric circulation [5,13,14,15,16,27,33,34,44]. These results corroborate previous findings and highlight how these mechanisms modulate rainfall variability in the Brazilian subtropical climate. This study advances previous analyses [16] by providing a refined regional assessment based on station-level data, reinforcing the importance of ENSO diversity for rainfall variability in the Brazilian subtropical climate.
By combining composite analyses of precipitation, wind fields, and SST anomalies with the assessment of homogeneous rainfall regions, this study provides a detailed regional perspective on the impacts of ENSO diversity. The findings reveal the magnitude and organization of rainfall responses depend strongly on ENSO typology, with EPEN events favoring extensive wet conditions and CPEN events producing more variable and, in some areas, opposite precipitation signals. MXEN events exhibit intermediate and more spatially heterogeneous rainfall patterns.
This regional-scale assessment demonstrates that ENSO diversity impacts are not spatially homogeneous within southeastern SA [16]. In the Brazilian subtropical climate, EPEN events produce more spatially coherent and statistically significant positive precipitation anomalies, particularly in SON (0) and DJF (+1), whereas CP events exhibit more heterogeneous patterns, with decreases in rainfall.
For LN, the results indicate a predominance of negative rainfall signals across most homogeneous regions, although the magnitude, spatial extent, and seasonal timing of these anomalies vary substantially among ENSO typologies. EPLN events are associated with the most intense summer rainfall deficits, while MX and CPLN events produce more variable and seasonally distinct dry conditions. These differences are closely linked to changes in the position and intensity of the SALLJ, the subtropical jet, and large-scale circulation patterns affecting moisture transport toward southern Brazil.
Overall, the results highlight the importance of considering ENSO diversity when assessing rainfall variability in the Brazilian subtropical climate and reveal asymmetric regional sensitivity to longitudinal SST shifts in the equatorial Pacific. Recognizing the distinct regional and seasonal impacts of ENSO typologies improves the understanding of climate variability and contributes to more accurate climate risk management and adaptation strategies in a region increasingly affected by both floods and droughts.
Supplementary Materials
The following supporting information can be downloaded at: https://www.mdpi.com/article/10.3390/atmos17060579/s1, Figure S1: Composites of 200 hPa zonal wind anomaly (1976–2019) during East Pacific El Niño—EP El Niño (left column), Mixed El Niño—MX El Niño (middle column) and Central Pacific El Niño—CP El Niño (right column). (a–c) JJA (0). (d–f) SON (0). (g–i) D(0)JF(+1). (j–l) MAM (+1). Dotted areas indicate statistical significance at the 90% confidence level. Figure S2: Composites of 200 hPa zonal wind anomaly (1976–2019) during East Pacific La Niña—EP La Niña (left column), Mixed La Niña—MX La Niña (middle column) and Central Pacific La Niña—CP La Niña (right column). (a–c) JJA (0). (d–f) SON (0). (g–i) D(0)JF(+1). (j–l) MAM (+1). Dotted areas indicate statistical significance at the 90% confidence level.
Author Contributions
Conceptualization, G.G., L.L. and F.M.; methodology, G.G., L.L. and C.B.C.; software, G.G. and C.B.C.; validation, G.G.; formal analysis, G.G., L.L. and C.B.C.; investigation, G.G.; data curation, G.G.; writing—original draft preparation, G.G.; writing—review and editing, G.G.; L.L., C.B.C. and F.M.; visualization, G.G.; L.L., C.B.C. and F.M.; supervision, L.L. and F.M.; project administration, F.M.; funding acquisition, F.M. All authors have read and agreed to the published version of the manuscript.
Funding
CAPES (Higher Education Personnel Improvement Coordination—Ministry of Education/Brazil) doctoral scholarship. NAPI Project—Climate Emergency. Funded by the Araucária Foundation—State of Paraná—Brazil. National Council for Scientific and Technological Development (CNPq, Brazil, Grant No. 440861/2023-3).
Institutional Review Board Statement
Not applicable.
Informed Consent Statement
Not applicable.
Data Availability Statement
The original raw data presented in the study are publicly available in secondary databases. Precipitation data from rainfall stations were made available by Hidroweb/National Water Agency, available at: https://www.snirh.gov.br/hidroweb/serieshistoricas, accessed on 24 February 2026. GPCC (GPCC Global Precipitation Climatology Centre) data were provided by Schneider et al. (2022) [36] from the website at https://opendata.dwd.de/climate_environment/GPCC/html/fulldata-monthly_v2022_doi_download.html, accessed on 24 February 2026. NOAA Extended SST V5 (ERSST) were provided by the NOAA, Boulder, Colorado, USA, from their website at https://psl.noaa.gov/data/gridded/data.noaa.ersst.v5.html, accessed on 24 February 2026 and ONI index data at https://www.cpc.ncep.noaa.gov/products/analysis_monitoring/ensostuff/ONI_v5.php, accessed on 24 February 2026. Wind data were from NCEP/NCAR Reanalysis I (Kalnay et al., 1996 [38]), available at: https://psl.noaa.gov/data/gridded/data.ncep.reanalysis.html, accessed on 24 February 2026.
Acknowledgments
The first author acknowledges CAPES (Higher Education Personnel Improvement Coordination—Ministry of Education/Brazil) for the financial support of the research in the form of a doctoral scholarship. We also thank the NAPI project—Climate Emergency, from the Araucaria do Paraná Foundation, for funding this article.
Conflicts of Interest
The authors declare no conflicts of interest.
Abbreviations
The following abbreviations are used in this manuscript:
| CP | Central Pacific |
| CPEN | Central Pacific El Niño |
| CPLN | Central Pacific La Niña |
| EN | El Niño |
| ENSO | El Niño-Southern Oscillation |
| EP | East Pacific |
| EPEN | East Pacific El Niño |
| EPLN | East Pacific La Niña |
| LN | La Niña |
| MX | Mixed |
| MXEN | Mixed El Niño |
| MXLN | Mixed La Niña |
| PR | Paraná |
| RS | Rio Grande do Sul |
| SA | South America |
| SC | Santa Catarina |
References
- Philander, S.G. El Niño, La Niña and Southern Oscillation; Academic Press: San Diego, CA, USA, 1990. [Google Scholar]
- Trenberth, K.E. The Definition of El Niño. Bull. Am. Meteorol. Soc. 1997, 78, 2771–2777. [Google Scholar] [CrossRef]
- McPhaden, M.J.; Zebiak, S.E.; Glantz, M.H. ENSO as an Integrating Concept in Earth Science. Science 2006, 314, 1740–1745. [Google Scholar] [CrossRef] [PubMed]
- Wang, C.; Deser, C.; Yu, J.-Y.; Dinezio, P.; Clement, A. El Niño—Southern Oscillation (ENSO): A review. In Coral Reefs of the Eastern Pacific; Glymn, P., Manzello, D., Enochs, I., Eds.; Springer Science Publisher: Berlin/Heidelberg, Germany, 2016; pp. 85–106. [Google Scholar] [CrossRef]
- Cai, W.; McPhaden, M.J.; Grimm, A.M.; Rodrigues, R.R.; Taschetto, A.S.; Garreaud, R.D.; Dewitte, B.; Poveda, G.; Ham, Y.G.; Santoso, A.; et al. Climate impacts of the El Niño–Southern Oscillation on South America. Nat. Rev. Earth Environ. 2020, 1, 215–231. [Google Scholar] [CrossRef]
- Goudard, G. Interações Oceano-Atmosfera e Efeitos na Variabilidade Pluvial do Clima Subtropical Brasileiro. Ph.D. Thesis, Universidade Federal do Paraná, Curitiba, Brazil, 2023; 323p. [Google Scholar]
- Reboita, M.S.; Gan, M.A.; da Rocha, S.P.; Ambrizzi, T. Regimes de precipitação na América do Sul: Uma revisão bibliográfica. Rev. Bras. Meteorol. 2010, 25, 185–204. [Google Scholar] [CrossRef]
- Teixeira, M.D.S.; Satyamurty, P. Trends in the frequency of intense precipitation events in southern and southeastern Brazil during 1960–2004. J. Clim. 2011, 24, 1913–1921. [Google Scholar] [CrossRef]
- IBGE. Instituto Brasileiro de Geografia e Estatística. In Mapa de Clima do Brasil; IBGE: Rio de Janeiro, Brazil, 2002. [Google Scholar]
- Alvares, C.A.; Stape, J.L.; Sentelhas, P.C.; Gonçalves, J.D.M.; Sparovek, G. Köppen’s climate classification map for Brazil. Meteorol. Z. 2013, 22, 711–728. [Google Scholar] [CrossRef]
- Grimm, A.M. Clima da Região Sul. In Clima das Regiões Brasileiras e a Variabilidade Climática; Cavalcanti, I.F.A., Ferreira, N.J., Eds.; Oficina de Textos: São Paulo, Brazil, 2021; pp. 70–84. [Google Scholar]
- Grimm, A.M.; Ferraz, S.E.T.; Gomes, J. Precipitation anomalies in Southern Brazil associated with El Niño and La Niña events. J. Clim. 1998, 11, 2863–2880. [Google Scholar] [CrossRef]
- Grimm, A.M. The El Niño impact on summer monsoon in Brazil: Regional processes versus remote influences. J. Clim. 2003, 16, 263–280. [Google Scholar] [CrossRef]
- Grimm, A.M. How do La Niña events disturb the summer monsoon system in Brazil? Clim. Dyn. 2004, 22, 123–138. [Google Scholar] [CrossRef]
- Grimm, A.M.; Tedeschi, R.G. ENSO and extreme rainfall events in South America. J. Clim. 2009, 22, 1589–1609. [Google Scholar] [CrossRef]
- Goudard, G.; Limberger, L.; Carpenedo, C.B. Influence of Eastern, Central and Mix El Niño on the variability of rainfall in southeastern South America. Front. Earth Sci. 2024, 12, 1134782. [Google Scholar] [CrossRef]
- Grimm, A.M.; Almeida, A.S.; Beneti, C.A.A.; Leite, E.A. O efeito combinado de oscilações climáticas na produção de extremos: A seca de 2020 no Sul do Brasil. Rev. Bras. Recur. Hídricos—RBRH 2020, 25, e48. [Google Scholar] [CrossRef]
- Fernandes, V.R.; do Amaral Cunha, A.P.M.; Pineda, L.A.C.; Leal, K.R.D.; Costa, L.C.; Broedel, E.; de Azeredo França, D.; dos Santos Alvalá, R.C.; Seluchi, M.E.; Marengo, J. Secas e os impactos na região sul do Brasil. Rev. Bras. Climatol. 2021, 28, 561–584. [Google Scholar] [CrossRef]
- Clarke, B.; Barnes, C.; Rodrigues, R.; Zachariah, M.; Alves, L.M.; Haarsma, R.; Pinto, I.; Yang, W.; Vahlberg, M.; Vecchi, G.; et al. Climate change and El Niño behind extreme precipitation leading to major floods in southern Brazil in 2024. npj Nat. Hazards 2026, 3, 4. [Google Scholar] [CrossRef]
- Du, H.; Alexander, L.V.; Donat, M.G.; Lippmann, T.; Srivastava, A.; Salinger, J.; Kruger, A.; Choi, G.; He, H.S.; Fujibe, F.; et al. Precipitation from persistent extremes is increasing in most regions and globally. Geophys. Res. Lett. 2019, 46, 6041–6049. [Google Scholar] [CrossRef]
- Regoto, P.; Dereczynski, C.; Chou, S.C.; Bazzanela, A.C. Observed changes in air temperature and precipitation extremes over Brazil. Int. J. Climatol. 2021, 41, 5125–5142. [Google Scholar] [CrossRef]
- Mamani, L.; Andreoli, R.V.; de Souza, I.P.; Kayano, M.T.; Cevalho, W.; Sales, D.; Ferreira de Souza, R.A. The Cyclic and Episodic Transition of Strong El Niño and Implications for South American Precipitation During Their Peak and Decay Stages. Int. J. Climatol. 2024, 45, e8710. [Google Scholar] [CrossRef]
- Tedeschi, R.G.; Sampaio, G. Influences of different intensities of El Niño–Southern Oscillation on South American precipitation. Int. J. Climatol. 2022, 42, 7987–8007. [Google Scholar] [CrossRef]
- Ashok, K.; Behera, S.K.; Rao, S.A.; Weng, H.Y.; Yamagata, T. El Niño Modoki and its possible teleconnection. J. Geophys. Res. 2007, 112, C11007. [Google Scholar] [CrossRef]
- Kao, H.-Y.; Yu, J.-Y. Contrasting eastern-Pacific and central-Pacific types of ENSO. J. Clim. 2009, 22, 615–632. [Google Scholar] [CrossRef]
- Andreoli, R.V.; Oliveira, S.S.; Kayano, M.T.; Viegas, J.; Souza, R.A.F.; Candido, L.A. The influence of different El Niño types on the South American rainfall. Int. J. Climatol. 2016, 37, 1374–1390. [Google Scholar] [CrossRef]
- Kayano, M.T.; Andreoli, R.V.; Souza, R.A.F.; Garcia, S.R.; Calheiros, A.J. El Niño e La Niña dos últimos 30 anos: Diferentes tipos. Rev. Climanalise. Edição Comemorativa 2016, 30, 7–12. [Google Scholar]
- Wu, X.; Okumura, Y.M.; Dinezio, P.N. What controls the duration of El Niño and La Niña events? J. Clim. 2019, 32, 5941–5965. [Google Scholar] [CrossRef]
- Lin, J.; Qian, T. Impacts of the ENSO lifecycle on stratospheric ozone and temperature. Geophys. Res. Lett. 2019, 46, 10646–10658. [Google Scholar] [CrossRef]
- Kim, J.W.; Yu, J.Y. Single-and multi-year ENSO events controlled by pantropical climate interactions. Clim. Atmos. Sci. 2022, 5, 88. [Google Scholar] [CrossRef]
- Li, X.; Yu, J.Y.; Ding, R. El Niño-La Niña asymmetries in the changes of ENSO complexities and dynamics since 1990. Geophys. Res. Lett. 2024, 51, e2023GL106395. [Google Scholar] [CrossRef]
- Wang, B.; Luo, X.; Yang, Y.M.; Sun, W.; Cane, M.A.; Cai, W.; Yeh, S.W.; Liu, J. Historical change of El Niño properties sheds light on future changes of extreme El Niño. Proc. Natl. Acad. Sci. USA 2019, 116, 22512–22517. [Google Scholar] [CrossRef] [PubMed]
- Tedeschi, R.G.; Grimm, A.M.; Cavalcanti, I.F.A. Influence of Central and East ENSO on extreme events of precipitation in South America during austral spring and summer. Int. J. Climatol. 2015, 35, 2045–2064. [Google Scholar] [CrossRef]
- Tedeschi, R.G.; Grimm, A.M.; Cavalcanti, I.F.A. Influence of Central and East ENSO on precipitation and its extreme events in South America during austral autumn and winter. Int. J. Climatol. 2016, 36, 4797–4814. [Google Scholar] [CrossRef]
- Costa, J.A.C.; Andreoli, R.V.; Kayano, M.T.; de Souza, I.P.; de Souza, R.A.F.; Cerón, W.L. The South American precipitation trends under (or not) El Niño-Southern Oscillation influences and relationship with large-scale circulation. Int. J. Climatol. 2024, 44, 3154–3168. [Google Scholar] [CrossRef]
- Schneider, U.; Hänsel, S.; Finger, P.; Rustemeier, E.; Ziese, M. GPCC Full Data Monthly Product Version 2022 at 0.25: Monthly Land-Surface Precipitation from Rain-Gauges Built on GTS-Based and Historical Data; Global Precipitation Climatology Centre: Offenbach am Main, Germany, 2022. [Google Scholar] [CrossRef]
- Huang, B.; Thorne, P.W.; Banzon, V.F.; Boyer, T.; Chepurin, G.; Lawrimore, J.H.; Menne, M.J.; Smith, T.M.; Vose, R.S.; Zhang, H.M. Extended Reconstructed Sea Surface Temperature version 5 (ERSSTv5), Upgrades, validations, and intercomparisons. J. Clim. 2017, 30, 8179–8205. [Google Scholar] [CrossRef]
- Kalnay, E.; Kanamitsu, M.; Kistler, R.; Collins, W.; Deaven, D.; Gandin, L. The NMC/NCAR 40-year reanalysis project. Bull. Am. Meteorol. Soc. 1996, 77, 437–472. [Google Scholar] [CrossRef]
- Wold, H. Nonlinear iterative partial least squares (NIPALS) modelling: Some current developments. In Multivariate Analysis–III; Academic Press: Cambridge, MA, USA, 1973; pp. 383–407. [Google Scholar] [CrossRef]
- Wilks, D.S. Statistical Methods in the Atmospheric Sciences, 2nd ed.; Elsevier: San Diego, CA, USA, 2006. [Google Scholar]
- Nascimento Junior, L. As Chuvas no Paraná: Variabilidade, Teleconexões, e Impactos de Eventos Extremos. Master’s Thesis, Universidade Estadual Paulista, Presidente Prudente, Brazil, 2013; 162p. [Google Scholar]
- Yu, J.; Kim, S.T. Identifying the types of major El Niño events since 1870. Int. J. Climatol. 2012, 33, 2105–2112. [Google Scholar] [CrossRef]
- Hill, K.J.; Taschetto, A.S.; England, M.H. Sensitivity of South American summer rainfall to tropical Pacific Ocean SST anomalies. Geophys. Res. Lett. 2011, 38, L01701. [Google Scholar] [CrossRef]
- Tedeschi, R.G. As Influências de Tipos Diferentes de ENOS na Precipitação e nos Seus Eventos Extremos Sobre a América do Sul—Observações, Simulações e Projeções. Ph.D. Thesis, Instituto Nacional de Pesquisas Espaciais, São José dos Campos, Brazil, 2013; 256p. [Google Scholar]
- Montini, T.L.; Jones, C.; Carvalho, L.M. The South American low-level jet: A new climatology, variability, and changes. J. Geophys. Res. Atmos. 2019, 124, 1200–1218. [Google Scholar] [CrossRef]
- Mo, K.C.; Higgins, R.W. The Pacific–South American modes and tropical convection during the Southern Hemisphere winter. Mon. Weather. Rev. 1998, 126, 1581–1596. [Google Scholar] [CrossRef]
- Drumond, A.R.M.; Ambrizzi, T. Inter ENSO variability and its influence over the South American monsoon system. Adv. Geosci. 2006, 6, 167–171. [Google Scholar] [CrossRef]

Disclaimer/Publisher’s Note: The statements, opinions and data contained in all publications are solely those of the individual author(s) and contributor(s) and not of MDPI and/or the editor(s). MDPI and/or the editor(s) disclaim responsibility for any injury to people or property resulting from any ideas, methods, instructions or products referred to in the content. |
© 2026 by the authors. Licensee MDPI, Basel, Switzerland. This article is an open access article distributed under the terms and conditions of the Creative Commons Attribution (CC BY) license.