


Abstract
The dryline is a sharp boundary between moist air from the Gulf of Mexico and dry air from the desert Southwest. In West Texas, this boundary often surges east during the day and retreats west at night. Understanding exactly why it moves back and forth is critical for predicting where severe thunderstorms will form. Yet the physical drivers of dryline life cycle remain poorly understood and frequently under-predicted. This study utilizes a variable-resolution Model for Prediction Across Scales (MPAS) configuration (3–60 km) with the YSU non-local planetary boundary layer (PBL) scheme to investigate a representative dryline event from April 2017. The control simulation was validated against NWS Surface Analysis, demonstrating a high spatial correlation in both synoptic-scale pressure distributions and mesoscale moisture gradients, successfully resolving a nocturnal retrogression of approximately 170 km, with the dryline retreating from its peak afternoon surge at 100.7° W to a recovery point of 102.5° W between 0000 UTC and 0600 UTC 10 April. This recovery occurred at an average speed of 28.3 km/h, consistently constrained beneath a resilient capping inversion. To decouple the environmental drivers of this motion, two targeted sensitivity experiments were conducted: (1) Mechanical Forcing: A 50% reduction in regional topography confirms that the West Texas sloping ramp acts as a “topographic pump.” Without this gradient, the hydrostatic pressure falls were insufficient to drive the nocturnal retreat, causing the boundary to stall eastward. (2) Thermodynamic Regulation: A 50% reduction in soil moisture revealed an “energy swap,” the near-total partitioning of net radiation into sensible heat drove the planetary boundary layer to a higher peak value—a 600 m increase over the control simulation. These results provide a comprehensive physical framework for dryline mobility, demonstrating that while terrain plays an important role in the extent of the diurnal oscillation, soil moisture governs the vertical structure and moisture gradient intensity. Our findings suggest that high-resolution vertical layering and accurate land-surface initialization are prerequisites for capturing the inversion layer dynamics essential for dryline forecasting. However, these findings are based on a single event and require validation across a broader range of dryline cases.
1. Introduction
The dryline of the U.S. Great Plains represents one of the most significant mesoscale boundaries in atmospheric science, characterized by a sharp horizontal gradient in moisture that frequently serves as a preferred site for convective initiation [1]. The dryline has been recognized as a primary focal point for the initiation of deep moist convection, including severe thunderstorms and tornadoes, particularly during the spring and early summer [2,3,4]. While the general behavior of the dryline—its eastward propagation during the day and westward retrogression at night—is well-documented, recent observational studies have revealed a complexity in its fine-scale structure and evolution that challenges classical conceptual models [5]. In the complex terrain of West Texas, including the Trans-Pecos and Permian Basin, the dryline’s lifecycle is governed by a delicate balance between synoptic-scale westerlies and terrain-driven moisture recovery from the Gulf of Mexico. Most existing studies rely on data from single-platform mobile transects or fixed mesonet stations, which, while valuable, lack the spatial continuity to capture simultaneous evolution across the synoptic and meso-gamma scales. Furthermore, operational models like the High-Resolution Rapid Refresh (HRRR) have been shown to smooth out sharp moisture gradients, misplace boundary positions by tens of kilometers, and fail to resolve the distinct steps observed in moisture fields [5]. The limitations of current observational networks and operational models need to a new approach to dryline research. Previous observational work by White and Lu [5] identified a critical structural feature during dryline events of 8–10 April 2017: a persistent capping inversion located between 1500 m and 2000 m MSL (Mean Sea Level). While that study provided high-fidelity observational evidence of the dryline’s behavior, the relative importance of local surface forcing versus boundary layer parameterization in maintaining this “lid” remains poorly understood.
Despite decades of research, a significant research gap exists in our ability to simulate the nocturnal retrograde (westward retreat) of the dryline. Many numerical models exhibit an eastward bias, where the dryline remains too far east or fails to retreat overnight, leading to significant errors in regional moisture and severe weather forecasting [6]. This suggests that current modeling frameworks may not adequately resolve the non-local mixing processes or the surface feedbacks—such as terrain slope and soil moisture—that drive the dryline’s diurnal oscillation.
The significance of this research lies in its systematic isolation of these surface drivers using a global variable-resolution modeling approach. The reason for using a global version of the Model for Prediction Across Scales (MPAS) is to eliminate lateral boundary condition errors, providing a seamless interaction between global synoptic forcing and 3 km mesoscale features [7]. With its variable-resolution mesh capabilities, MPAS offers a unique tool to simulate the dryline environment with convection-allowing resolution (down to <3 km) over specific regions of interest while maintaining a consistent synoptic-scale background, avoiding the boundary artifacts of nested-grid simulations.
This study implements a sensitivity matrix to quantify how local perturbations in terrain height and soil moisture influence dryline mobility. By comparing a control run (CTL) against these modified surface states, we aim to provide a comprehensive roadmap of which land-surface parameters most significantly govern the dryline’s intensity and position. These findings are crucial for improving short-range weather forecasts and understanding how land-use changes in West Texas may shift dryline dynamics in a changing climate.
2. Model Description and Methodology
2.1. The MPAS Modeling Framework
The simulations in this study were conducted using the Model for Prediction Across Scales (MPAS-Atmosphere) version 8.3.1. MPAS is a collaborative project developed by the Los Alamos National Laboratory and the National Center for Atmospheric Research (NCAR). It is designed for both global atmospheric research and regional numerical weather prediction [7]. MPAS utilizes a non-hydrostatic numerical solver that integrates the fully compressible equations of motion. The defining feature of MPAS is its horizontal mesh, which is based on Spherical Centroidal Voronoi Tesselations (SCVTs). Unlike traditional structured latitude–longitude grids that suffer from the “pole problem” or nested-grid discontinuities, the SCVT mesh allows for a smooth, continuous transition between coarse and high-resolution regions [8]. This design aimed to reduce numerical errors at the boundaries between various grid resolutions. Many studies have been conducted to the advantages of MPAS variable-resolution meshes [9,10,11], which contribute to the computational efficiency of high-resolution simulations for regions of interest compared to that of the global models using uniform grids or meshes.
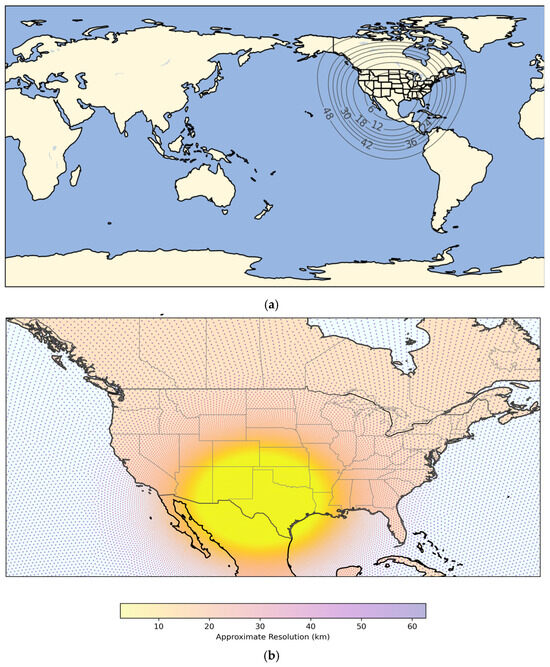
For this study, a global variable-resolution mesh was employed, featuring a 3 km refinement over the West Texas study area (32° N, 102° W) transitioning to a 60 km global background (Figure 1a,b). This 3 km resolution is critical for resolving the steep moisture gradients and boundary layer instabilities associated with dryline evolution [7]. Nevertheless, the 3 km grid spacing remains in the ‘grey zone’ for turbulent eddies and does not explicitly resolve the most energetic turbulent scales or the earliest stages of convective initiation. These processes are still partially parameterized. MPAS was selected for this case study because of:
Figure 1.
Global 60 − 3 km variable-resolution mesh of MPAS model. The center of high resolution (3 km) is located at the Trans-Pecos and Permian Basin of Texas (32° N, 102° W): (a) global mesh resolution contours; (b) zoom in to North America with shaded resolutions.
- (1)
- Elimination of Lateral Boundary Conditions (LBCs). In traditional regional models like the Weather Research and Forecasting (WRF) model [12], LBC errors can propagate into the domain of interest and distort the dryline position. By running MPAS as a global model with local refinement, the synoptic-scale environment (e.g., the upper-level trough over the Rockies) interacts naturally with the localized dryline without numerical boundary noise;
- (2)
- Topographic Fidelity. The unstructured Voronoi mesh provides a more isotropic representation of the topography of Trans-Pecos and Permian Basin compared to rectangular grids. This allows for a more realistic simulation of the slope-induced pressure gradients that drive the nocturnal retrograde motion observed;
- (3)
- Physical Consistency. MPAS shares a common set of physics with the Weather Research and Forecasting (WRF) model, allowing for the direct application of the YSU planetary boundary layer (PBL) scheme [13] and the Noah Land Surface Model [14], which are foundational to our analysis of the capping inversion.
2.2. Data Sources and Initialization
The initial conditions for this study were derived from the European Centre for Medium-Range Weather Forecasts (ECMWF) ERA5 reanalysis dataset [15]. ERA5 was selected for its high-fidelity representation of the April 2017 synoptic environment and its ability to provide consistent atmospheric and soil state variables for the region.
2.2.1. Atmospheric and Surface Initial Conditions
The model was initialized using ERA5 hourly data on both pressure levels and surface levels at a horizontal resolution of approximately 31 km (0.25°). The following parameters were ingested to establish the initial state at 0000 UTC on 9 April 2017:
- (1)
- Atmospheric State: Three-dimensional fields of temperature, geopotential, specific humidity, and u/v wind components across 37 pressure levels.
- (2)
- Surface and Soil State: Surface pressure, 2 m temperature, and 2 m dewpoint. Soil temperature and volumetric soil water content were extracted for the four standard layers (0–7, 7–28, 28–100, and 100–289 cm) to initialize the Noah Land Surface Model [14].
Throughout the 48 h simulation, sea surface temperatures (SST) and sea-ice cover were updated using the hourly ERA5 surface fields to maintain consistent lower boundary conditions.
2.2.2. Pre-Processing and Vertical Grid Refinement
Data ingestion into the MPAS unstructured Voronoi mesh was performed by utilizing the MPAS-Atmosphere initialization tool.
- (1)
- Horizontal Mapping: The 0.25° ERA5 Gaussian grid was interpolated to the variable-resolution mesh (3 km refinement) using a 16-point quadratic interpolation.
- (2)
- Vertical Coordinate System: The 37 ERA5 pressure levels were mapped onto 55 hybrid sigma-pressure vertical levels. To specifically address the capping inversion, the vertical grid spacing was refined in the lowest 2 km AGL, providing approximately 15 levels within the PBL. This refinement is necessary for the YSU PBL scheme to accurately resolve the non-local mixing and entrainment processes [13].
2.2.3. Physical Parameterizations
To accurately resolve the complex boundary layer processes governing the West Texas dryline, a suite of sophisticated physical parameterizations was selected. The PBL is parameterized using the Yonsei University (YSU) scheme [13]. Unlike local TKE-closure schemes [16], YSU is a non-local first-order closure scheme that explicitly accounts for entrainment at the top of the PBL through an added term in the counter-gradient transport [13]. This characteristic is critical for maintaining the structural integrity of the elevated capping inversion typically observed during West Texas dryline events. Surface layer physics are governed by the Revised Monin–Obukhov scheme [17], which provides the necessary heat and moisture fluxes to the PBL. These fluxes are mediated by the Noah Land Surface Model [14], which manages soil moisture and temperature across four layers, as well as vegetation-dependent evapotranspiration.
Radiative processes are represented by the Rapid Radiative Transfer Model for GCMs (RRTMG) for both longwave and shortwave spectra [18], accounting for cloud-radiative feedbacks. Microphysical processes are parameterized using the WSM6 scheme [19], which includes six classes of water species and is suitable for high-resolution (3 km) cloud-permitting simulations. Finally, to address terrain-induced flow distortions in the region of Trans-Pecos and Permian Basin, the YSU Gravity Wave Drag (GWDO) scheme [20] is employed to account for sub-grid scale orographic effects.
2.2.4. Spin-Up and Analysis Period
The MPAS model started to run at 0000 UTC 9 April 2017, where a 24 h spin-up period was utilized to allow the model’s microphysics and boundary layer turbulence to adjust to the high-resolution topography of the region. The analysis mainly focuses on the 6 h window from 0000 to 0600 UTC 10 April, capturing the peak dryline intensity and the subsequent nocturnal retreat.
3. Experimental Design and Surface Modifications
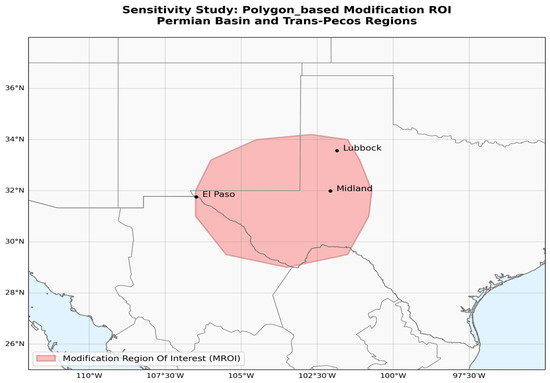
To isolate the terrestrial drivers of the dryline lifecycle, a series of controlled sensitivity experiments were conducted by perturbing the initial conditions. Unlike uniform global adjustments, the modifications were restricted to a high-resolution polygon-based Modification Region of Interest (MROI) defined by a 13-point polygon encompassing the Trans-Pecos and Permian Basin (approximately 29.0° N–34.2° N, 106.5° W–100.7° W) (Figure 2) to ensure numerical stability and prevent artificial discontinuities at the edges of modifications.
Figure 2.
Polygon-based Modification Region of Interest (MROI) (shaded) located in the Trans-Pecos and Permian Basin regions.
3.1. MROI Masking and Numerical Buffering
To maintain model stability and prevent spurious pressure gradients at the boundaries of the modified region, a spatial weighting function was implemented. Modifications were applied to cells falling within the MROI with a Distance-Based Fading Buffer. For continuous variables, a distance-based scaling was employed where the magnitude of the perturbation was greatest at the MROI centroid and faded linearly toward the edges based on normalized distance (dnorm). This ensures a smooth transition between the modified West Texas environment and the surrounding control state.
3.2. Topographic Modification (TER)
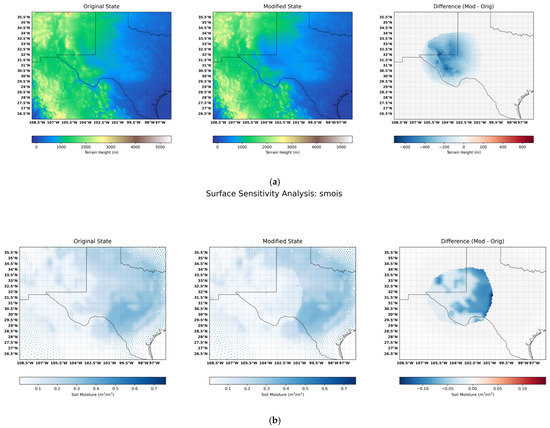
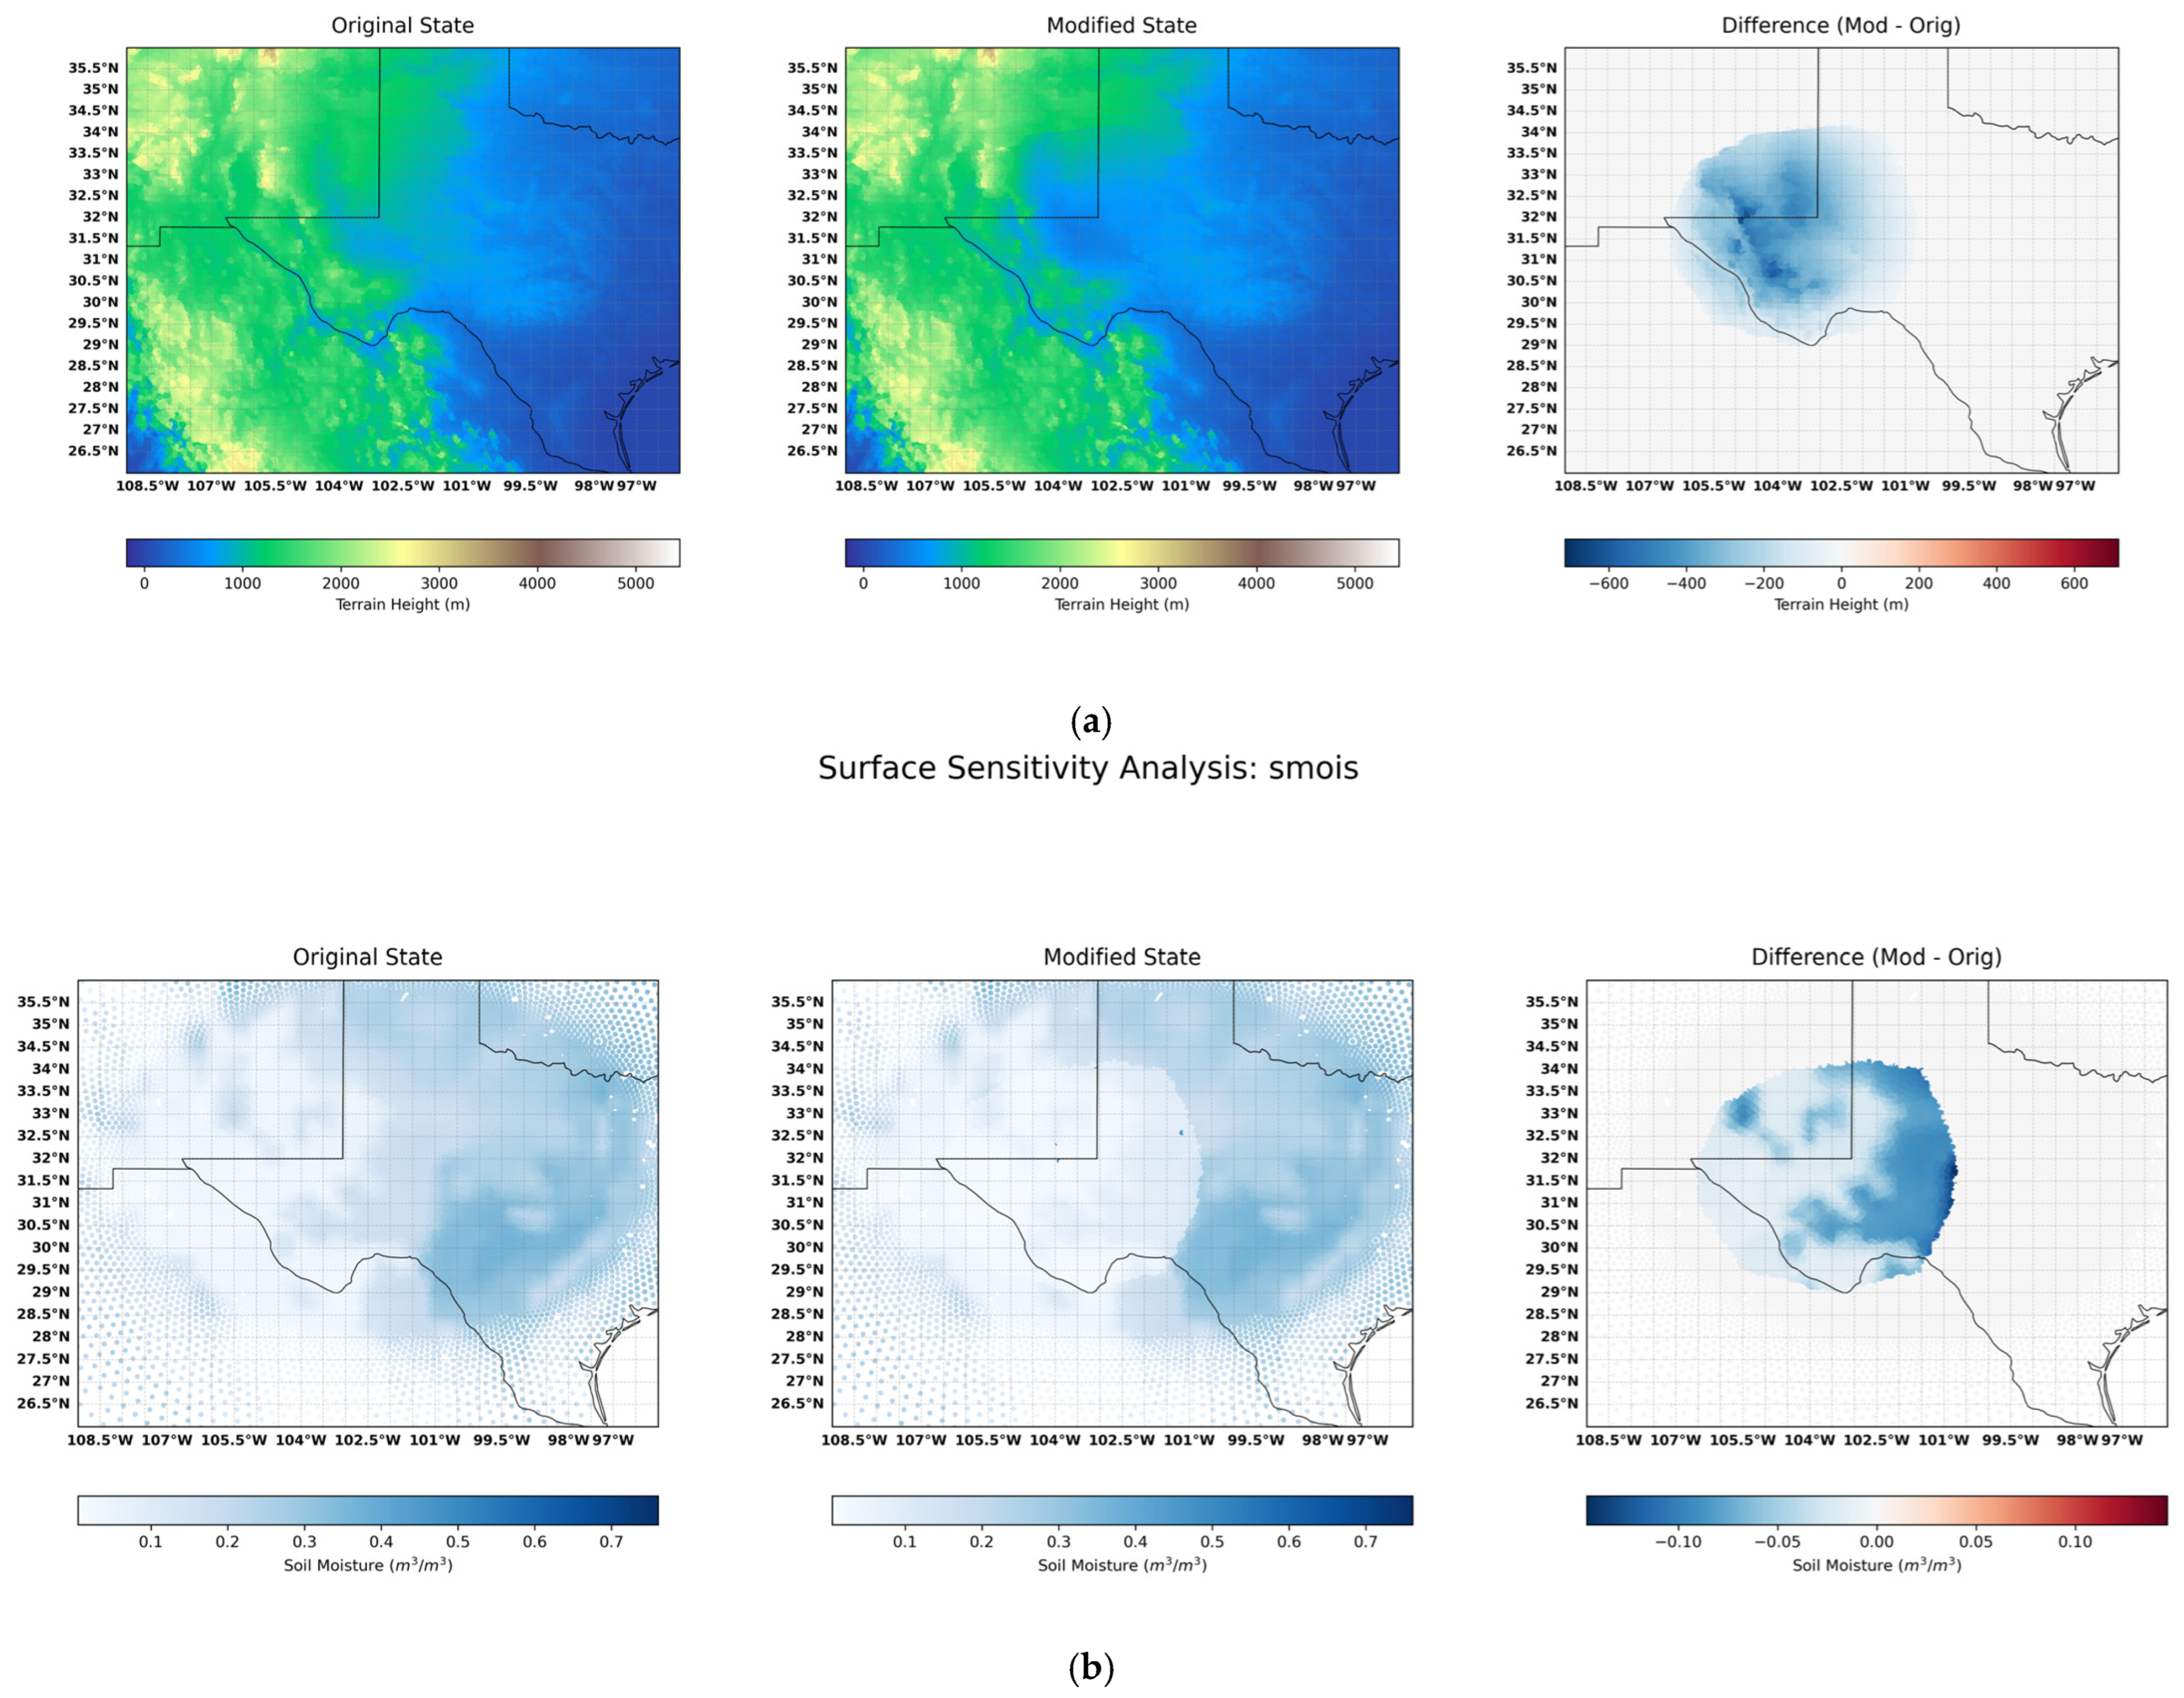
The terrain modification targeted the terrain height variable within the initial static file prior to the final initialization. The use of a normalized weighting function to smooth terrain modifications is a standard practice in mesoscale modeling [1,21]. A 50% reduction in terrain height was applied at the MROI center (Figure 3a). As Squitieri and Gallus [21] did in their work, we adopted a scaling factor (β) calculated as (1):
where dnorm varies linearly between the center and boundary:
β = 0.5 + (0.5 × dnorm)
Figure 3.
Comparison of initial surface conditions for the sensitivity runs. (a) Terrain scaling and (b) soil moisture scaling.
dnorm = 0 at the MROI center (yielding the full 50% reduction).
dnorm = 1 at the MROI boundary (returning to 100% of the original terrain height).
This approach preserves the general slope of the Trans-Pecos and Permian Basin while reducing the overall elevation, allowing for a direct test of how the regional sloping ramp influences the dryline’s afternoon surge and nocturnal retrograde speed. A 2D Gaussian smoother was applied at the boundaries of the MROI to prevent numerical instability and spurious pressure gradients at the transition between the modified and control terrain. This test specifically evaluates whether a less steep slope reduces the nocturnal retrograde [1].
3.3. Soil Moisture Sensitivities (SMOIS)
Soil moisture perturbation sensitivity was implemented directly in model initial conditions to perturb the surface energy balance [21]: Initial volumetric soil water content was reduced by 50% across all four soil layers within the masked MROI (Figure 3b). This modification targets the Bowen Ratio, testing how reduced latent heat flux affects the persistence of the observed inversion. In the “decreased soil moisture” run, we anticipate a broken inversion, as higher surface temperatures accelerate the premature erosion of the capping lid [22]. Table 1 shows all experiments conducted in this study.
Table 1.
Sensitivity experiment summary.
3.4. Dryline Detection Methodology
To objectively determine the longitudinal position of the dryline for both the surge (0000 UTC) and retreat (0600 UTC) phases, we utilized a Horizontal Gradient Maximum Method. This approach isolates the boundary as the location of the greatest moisture contrast rather than a single subjective dewpoint value.
- (1)
- Variable Selection: The 2 m specific humidity (q2) field was chosen to minimize the influence of transient surface-layer fluctuations while capturing the core thermodynamic boundary.
- (2)
- Mathematical Identification: The dryline position (Ldl) was defined as the longitude at which the westward horizontal moisture gradient reached its maximum along the 32° N transect:
- (3)
- Resolution and Gridding: Before calculation, the unstructured MPAS cell data were interpolated to a high-resolution 0.05° rectilinear grid using a linear barycentric method. This ensured that the gradient calculation remained consistent across the MROI, particularly as the dryline moved through variable-resolution areas of the mesh.
4. Results and Discussion
4.1. Model Synoptic Validation and Observational Comparison
To establish the credibility of the control simulation, the MPAS output was compared directly to the NWS Surface Analysis charts for 10 April 2017 at synoptic scale (Figure 4a,b). The synoptic graph (Figure 4a) from model output captures the broad moisture tongue from the Gulf and the core pressure systems very well. Comparing it to the NWS Surface Analysis (Figure 4b), the model agrees well with the positioning for the low pressure in the Rockies and the dryline “bulge” in West Texas. The model places a low pressure over the Colorado/Kansas border, which matches the NWS analysis. This low-pressure system is the engine that pulls the dryline east. The 10–14 °C dewpoint gradient (the transition from green to blue) aligns almost perfectly with the NWS scalloped line through the Texas Panhandle. It is noticed that dew point gradient is actually sharper than the NWS analysis, which is expected because the model runs at 3 km resolution. The model successfully captures the ‘dryline bulge’ into West Texas near 100.7° W, providing a verified baseline for the subsequent sensitivity experiments.
The fidelity of the nocturnal retreat phase was verified by comparing the 0600 UTC model state to the NWS Surface Analysis. As shown in Figure 5a,b, the NWS analysis for 0600Z (Figure 5b) shows the dryline (scalloped line) has retreated to the high plains of the Texas Panhandle and eastern New Mexico. The model’s sharp moisture transition (the jump from light green to dark blue) sits almost exactly on that same line (102.5° W) (Figure 5a). The NWS chart shows the surface low moving into western Kansas/Nebraska. The model output (contour lines) shows the same thing—a broad area of lower pressure that is maintaining the southerly “pump” of moisture from the Gulf. The NWS report that dewpoints of the 50–60 °F (10–15 °C) surge back into West Texas. The model output shows the same “tongue” of 14–18 °C dewpoints correctly filling that space. Therefore, we can conclude that the MPAS model captures the westward recovery of the moisture boundary with high spatial accuracy. The simulated 12 °C (Figure 5a) dewpoint isotherm aligns with the observed dryline position near 102.5° W, confirming a verified nocturnal retrograde of approximately 170 km from the peak afternoon surge position. This close agreement between simulated and observed moisture gradients demonstrates that the model is correctly resolving the interaction between the topographic pressure gradient and the boundary layer moisture transport.
Figure 4.
Synoptic and mesoscale verification at 0000 UTC 10 April 2017. (a) MPAS control simulation output of 2 m dewpoint temperature (shaded; °C) and mean sea-level pressure (contours; hPa); Red dash line box is the outline of Figure 6. (b) NWS Surface Analysis showing the observed dryline position (scalloped line) and sea-level pressure (isobars).
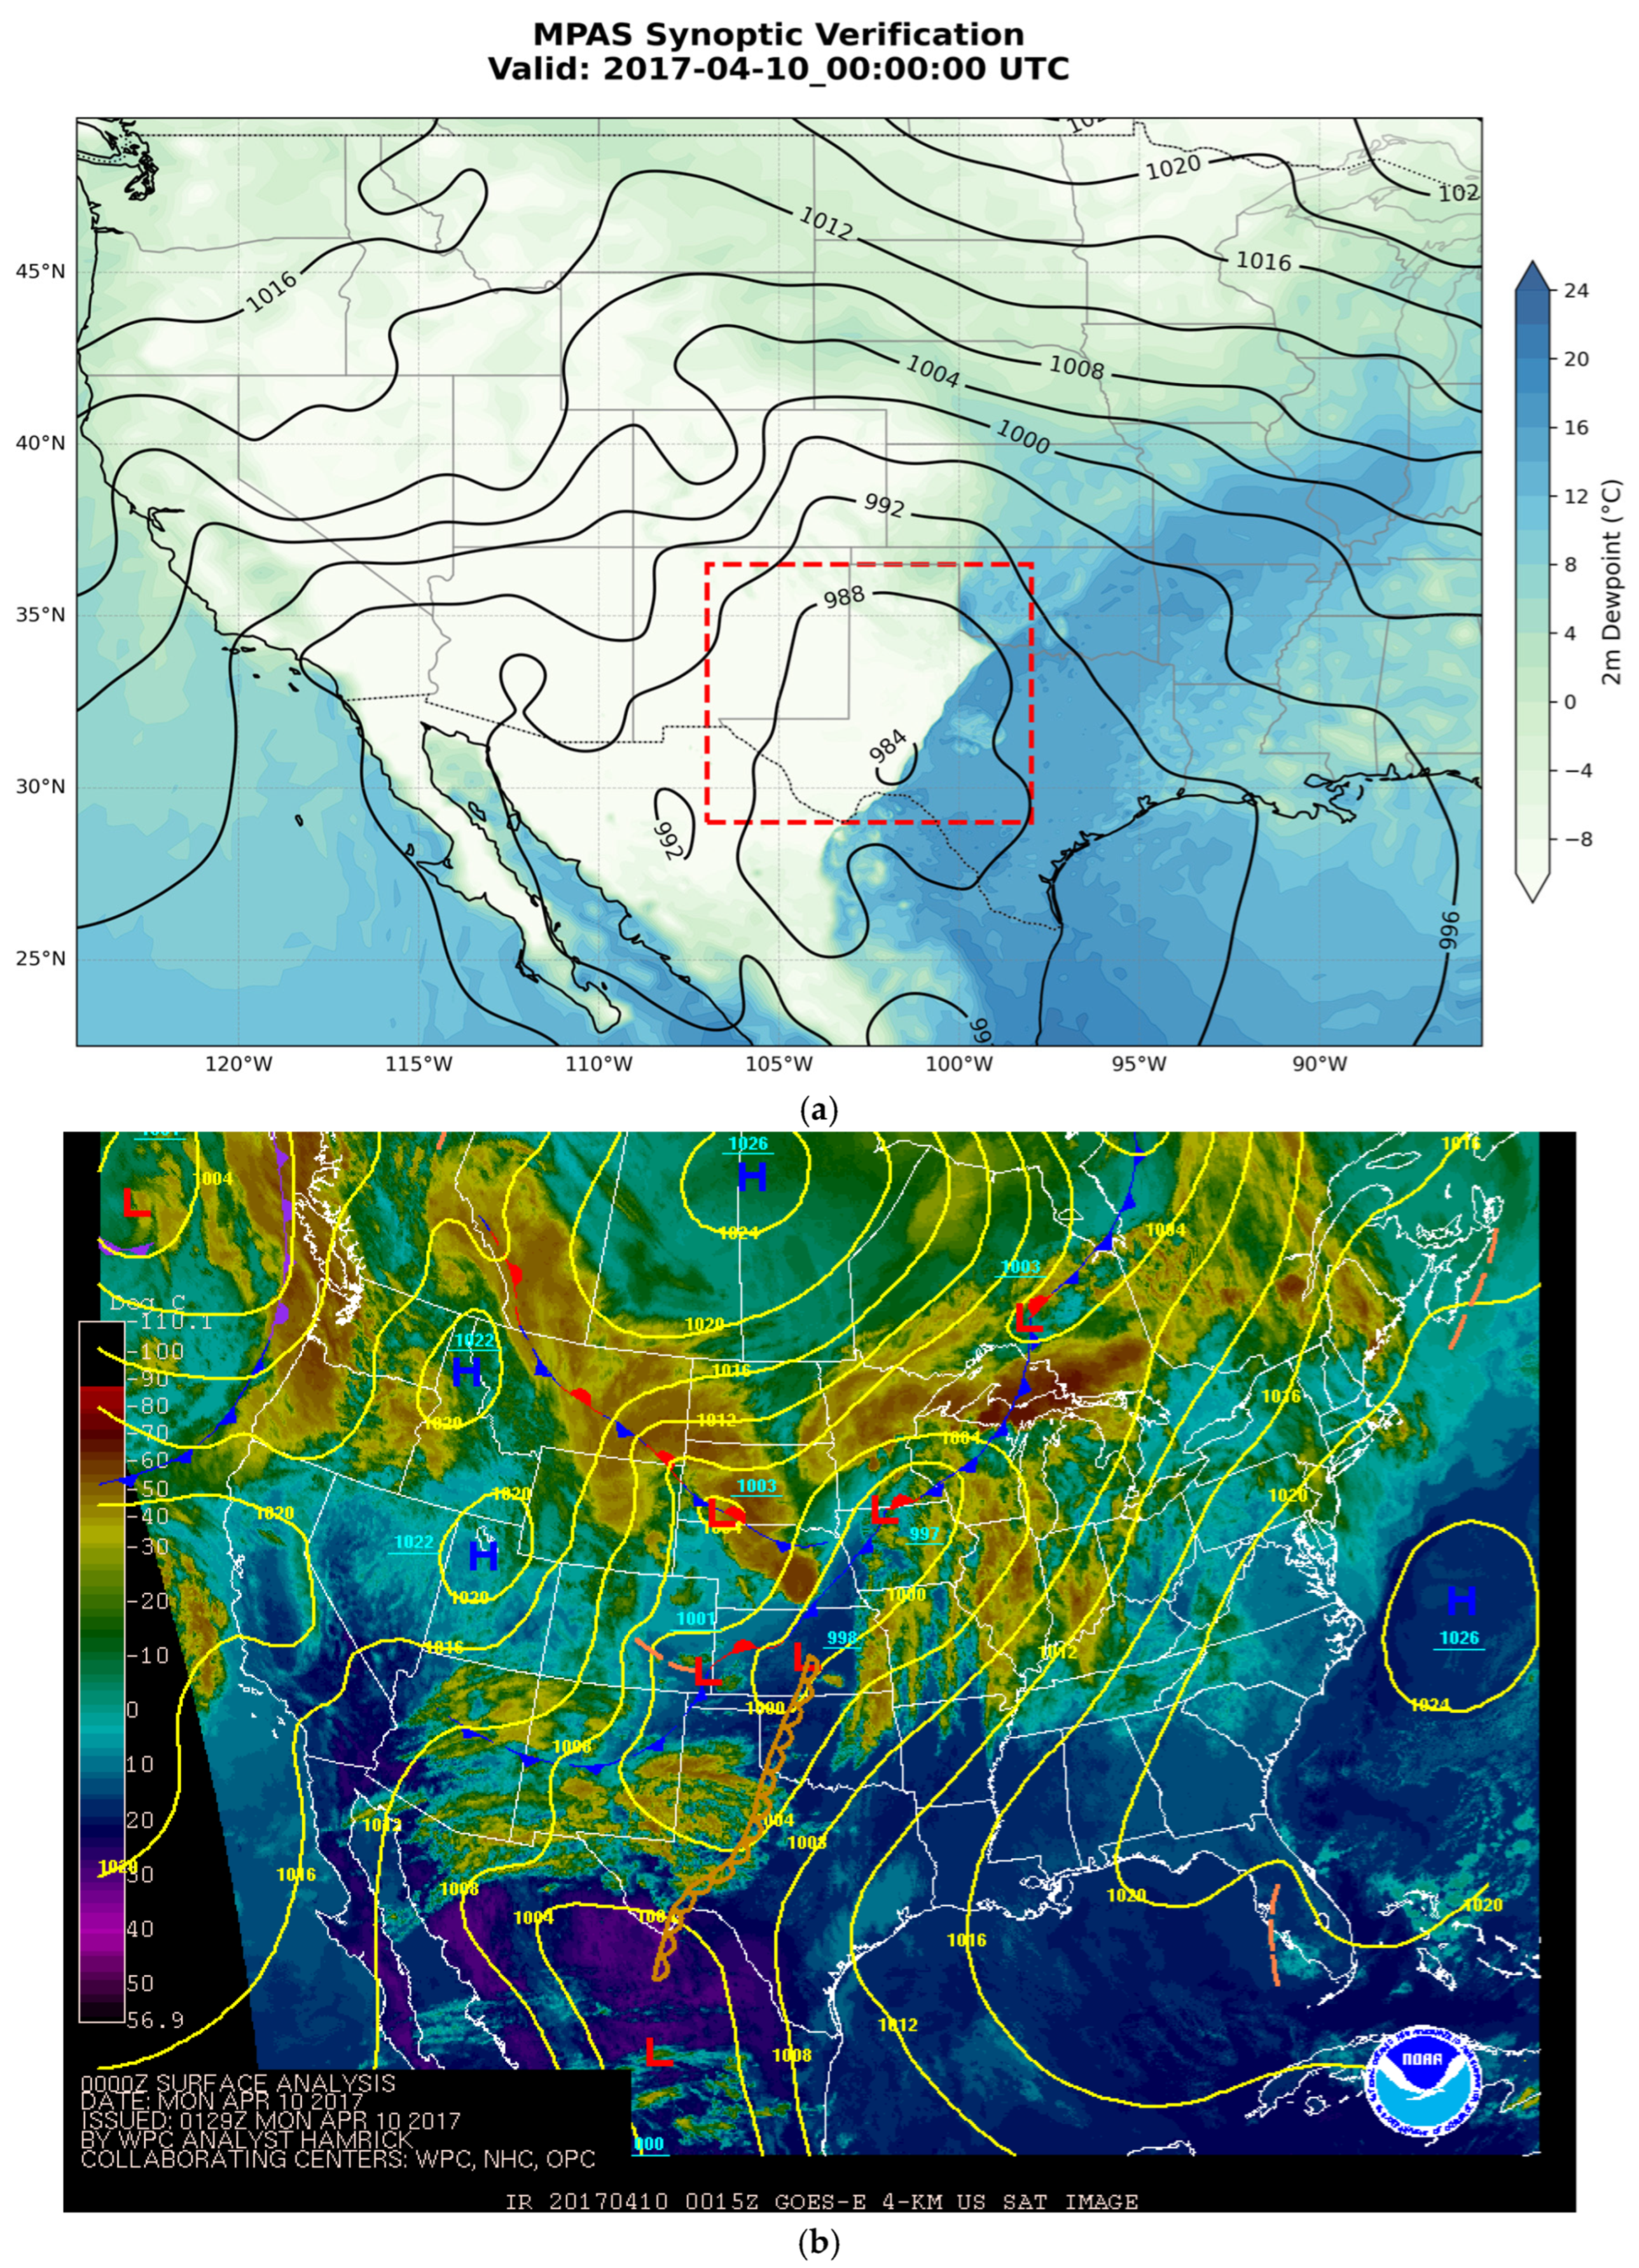
Figure 5.
Synoptic and mesoscale verification at 0600 UTC 10 April 2017. (a) MPAS control simulation output of 2 m dewpoint temperature (shaded; °C) and mean sea-level pressure (contours; hPa); Red dash line box is the outline of Figure 7. (b) NWS Surface Analysis showing the observed dryline position (scalloped line) and sea-level pressure (isobars).
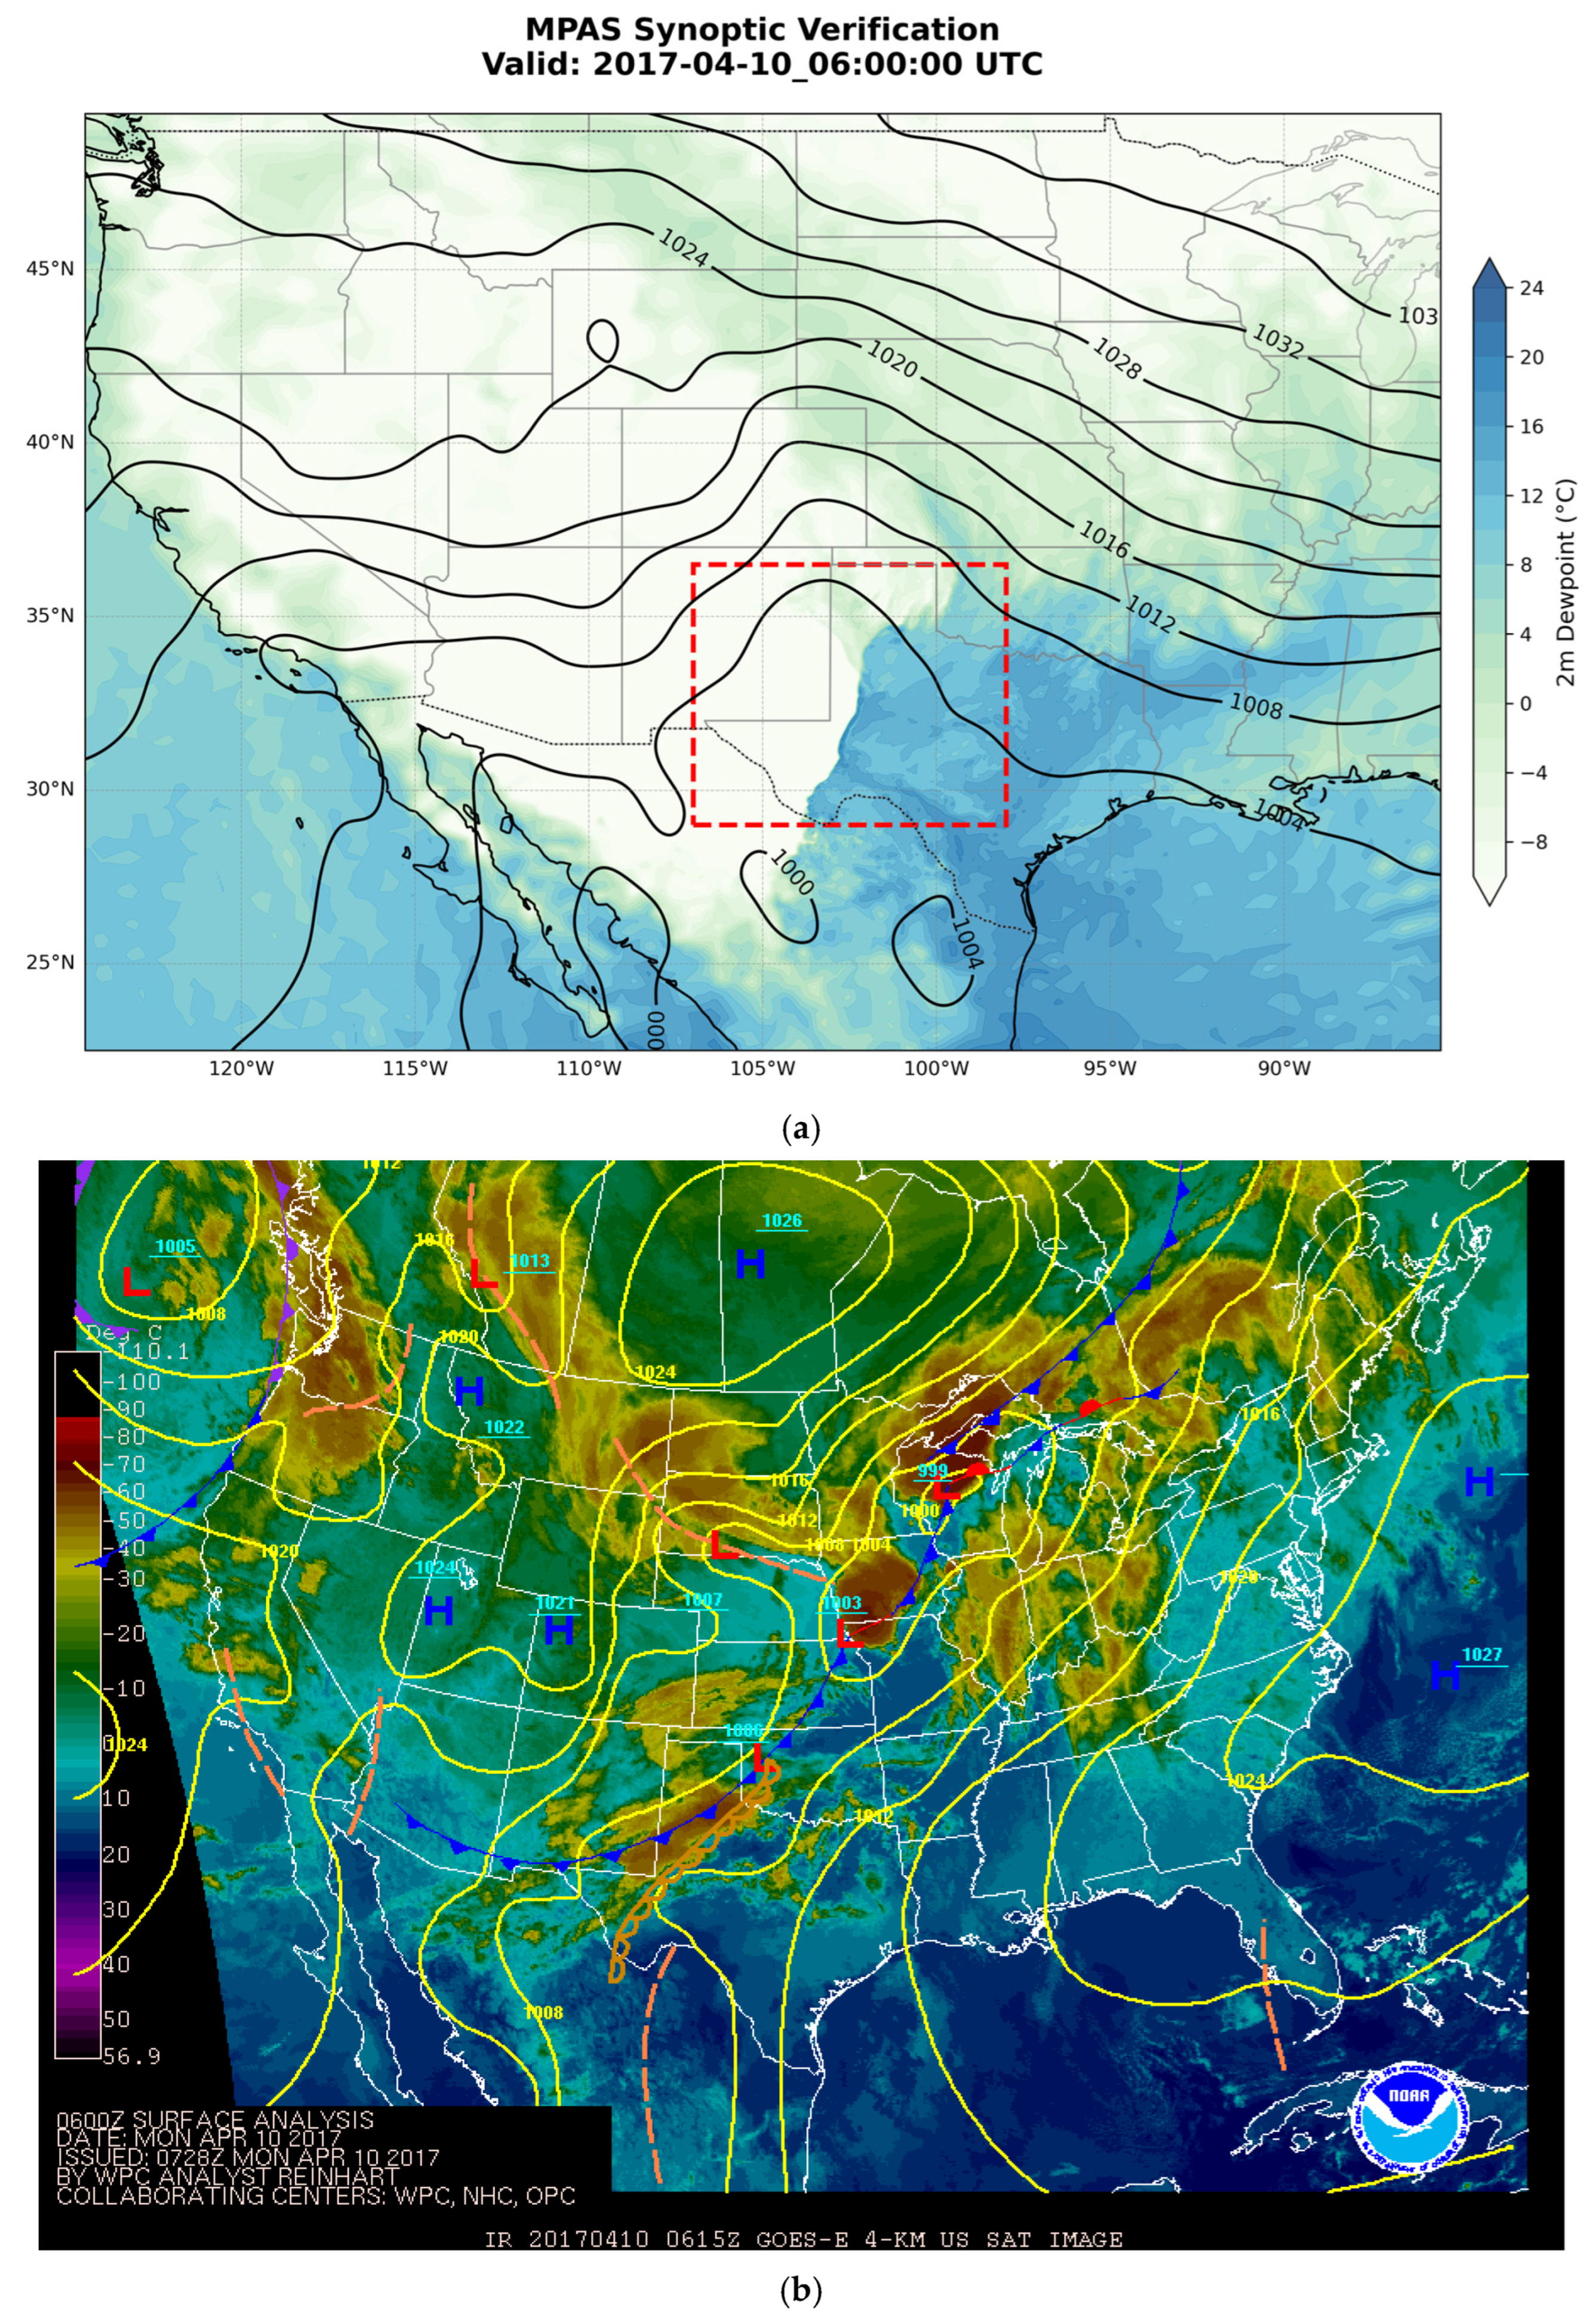
Figure 6.
The 850 hPa wind fields and horizontal divergence (10−5/s) at 0000UTC, 10 April 2017.
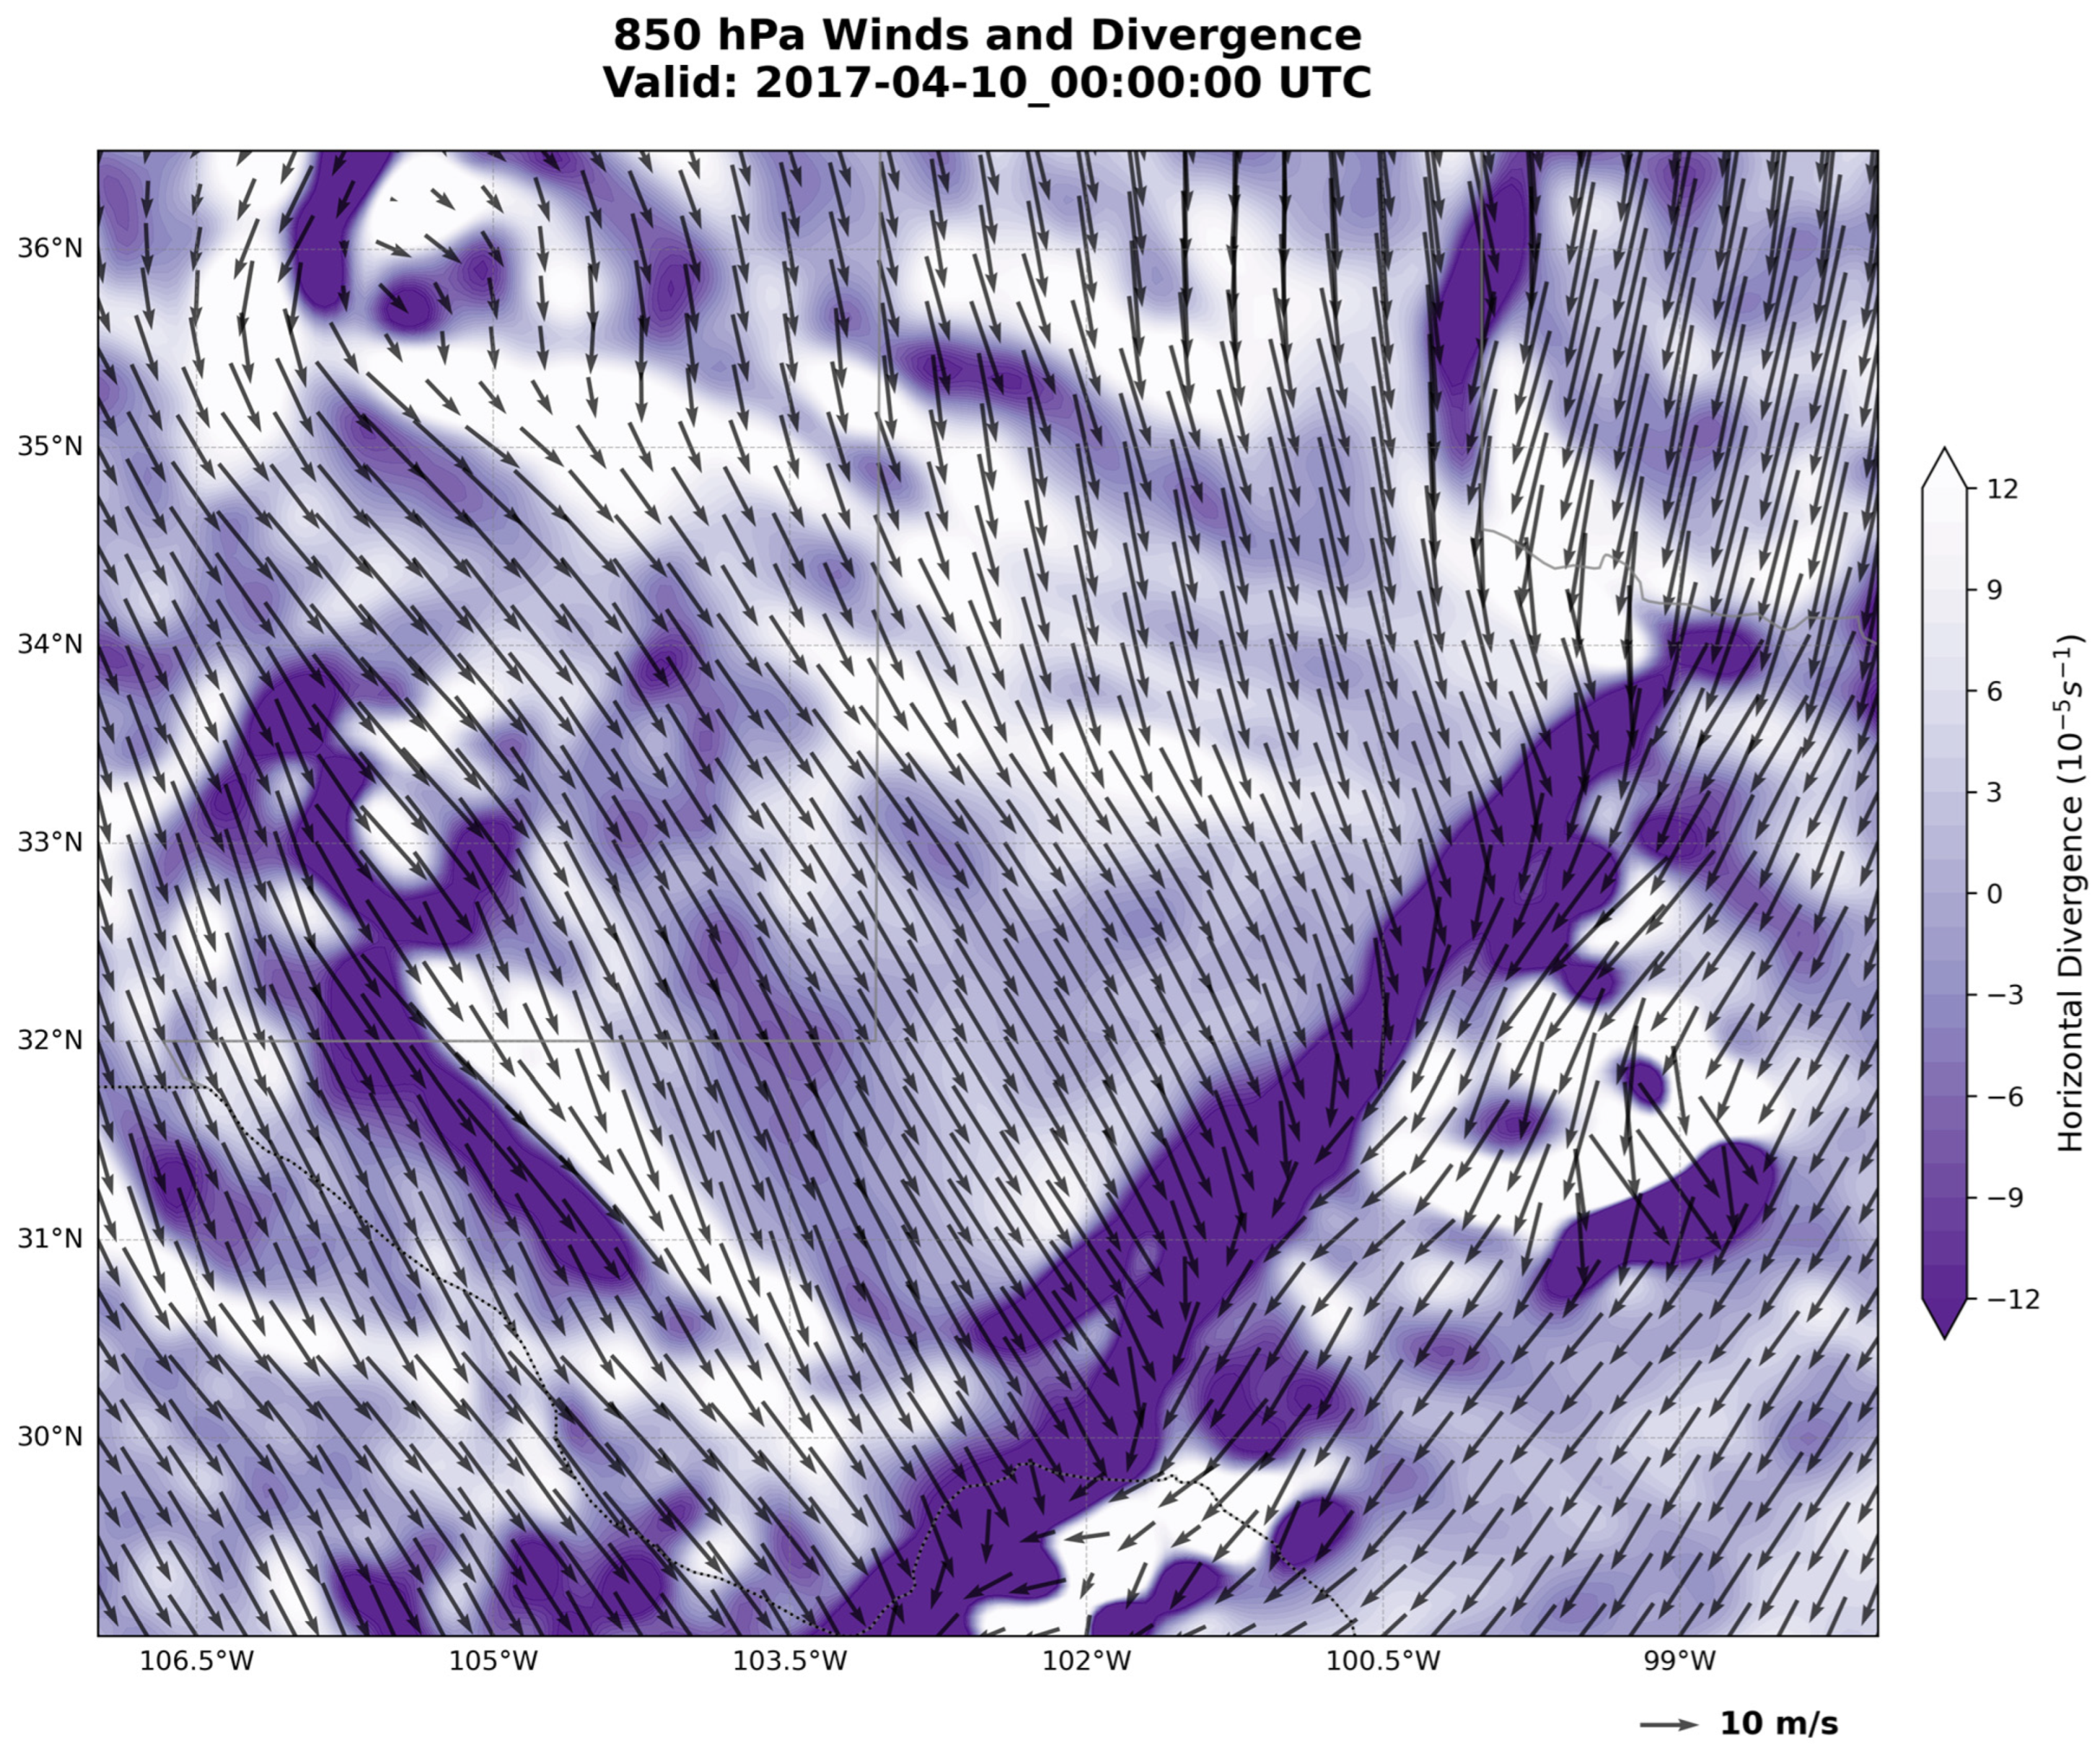
Figure 7.
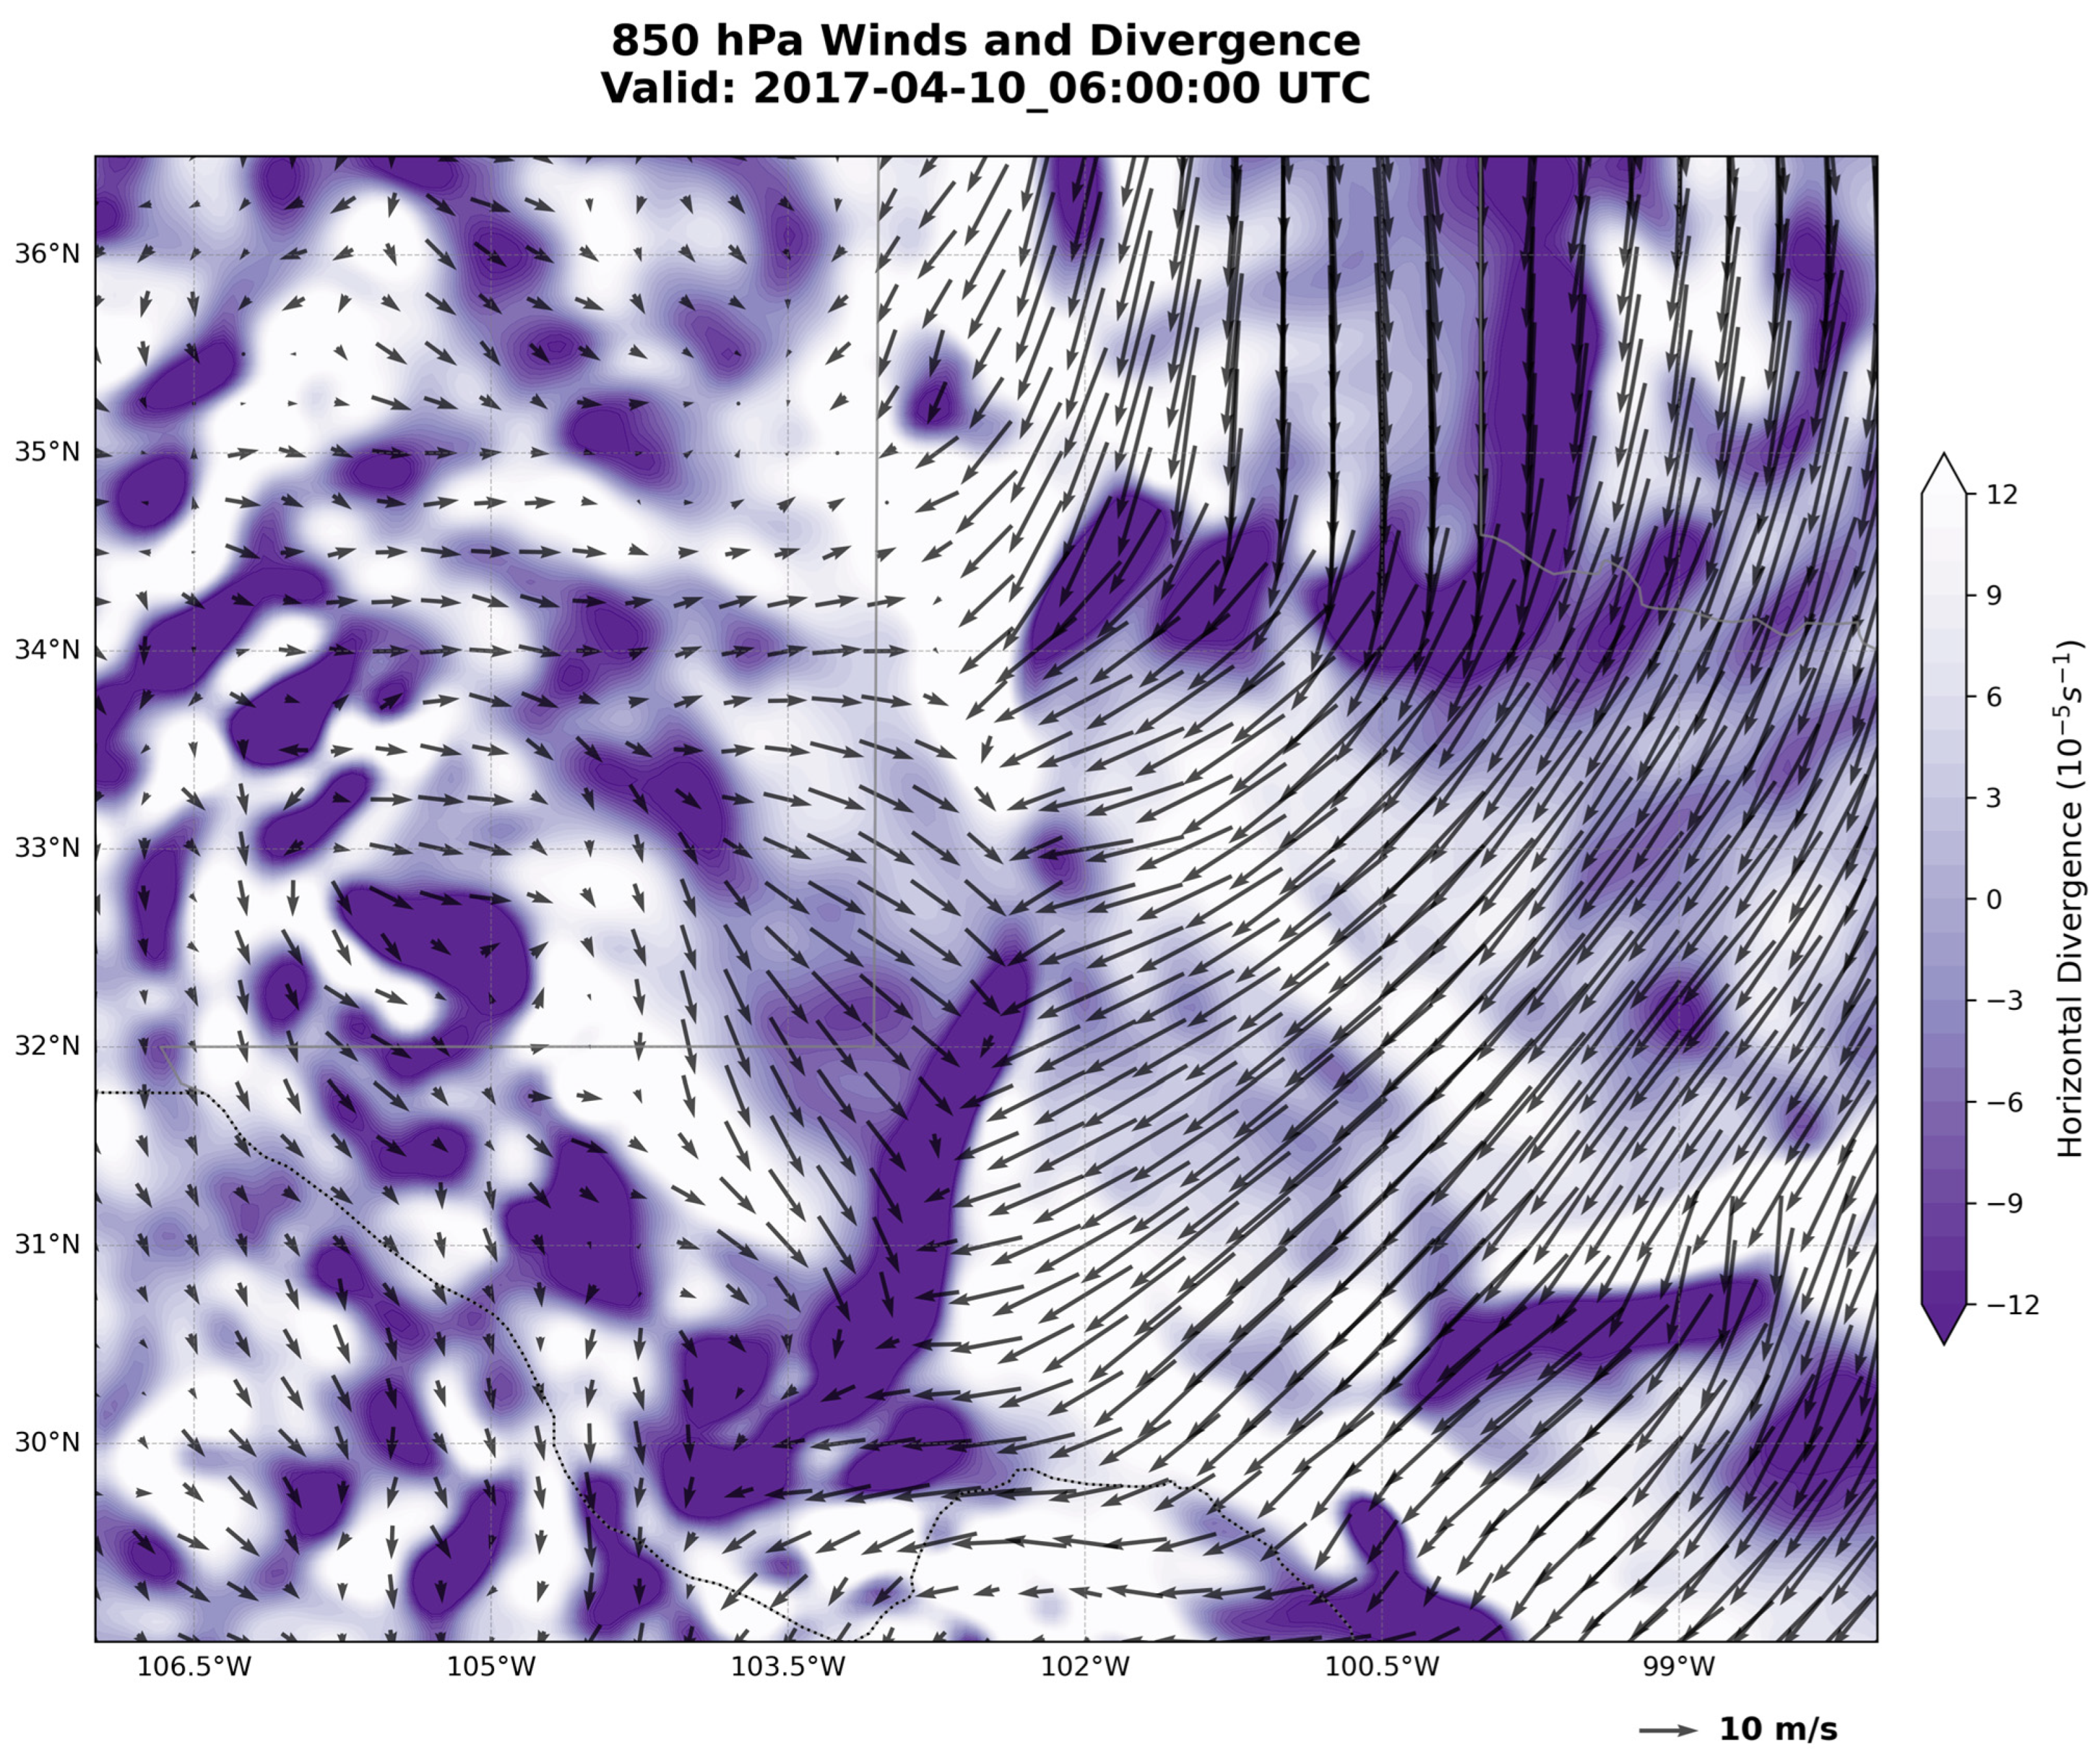
The 850 hPa winds fields and horizontal divergence (10−5/s) at 0600UTC, 10 April 2017.
4.2. Horizontal Evolution and Dryline Lifecycle
The horizontal evolution of the dryline event (10 April 2017) demonstrates a classic diurnal cycle of eastward propagation and subsequent nocturnal retrograde, closely aligning with the observational findings of White and Lu [5]. The model’s ability to replicate the dryline’s motion is a critical validation of its dynamical core and PBL coupling. By applying the algorithm of Horizontal Gradient Maximum Method in Section 3.4 to MPAS model output, the locations of dryline were determined at 100.7° W and 102.5° W for 0000UTC and 0600UTC 10 April respectively. The westward retrograde distance is about 170 km during 6 h period. This shows an averaged retrogression speed of 28 km/h. Retrogression speeds and distances can vary significantly from case to case. For a dryline case that occurred 8–9 April 2017 near Alpine, Texas, White and Lu [5] found that dryline was observed to retrogress westward by about 100 km in the approximately 90 min following sunset. On the other hand, a double dryline observed in Oklahoma on the evening of 22 May 2002 was recorded as moving “very slowly towards the west” [23].
4.2.1. Afternoon Surge and Peak Intensity
The simulated horizontal moisture gradient reached a peak intensity of 3.71 g/kg per km. While this is slightly lower than the point-source observations of 5.5 g/kg per km reported in White and Lu [5], it represents a high-fidelity representation for a 3 km grid. At this resolution, the model is resolving the gradient at its numerical limit, effectively capturing the “sharpness” of the boundary between the moist Gulf air and the continental dry air mass [7]. It was also noticed that, at this resolution, the model operates in the turbulence “grey zone,” where only the largest eddies are partially resolved, while key turbulent transport terms are still represented through the YSU parameterization. Consequently, the simulated moisture gradient (3.71 g/kg per km vs. observed 5.5 g/kg per km) and the diagnosed vertical dilution may partly reflect scheme-dependent mixing and entrainment assumptions rather than fully resolved dynamics.
To assess the dynamical integrity of the MPAS simulation, Figure 6 illustrates the 850 hPa vector winds and convergence fields at 0000 UTC 10 April. The dynamical structure of the dryline at this time is characterized by a robust convergence ribbon along the moisture interface. It clearly captures the broader synoptic setup. As illustrated in Figure 6, the 850 hPa divergence reaches values of −(8 − 10) × 10−5/s (convergence), perfectly collocated with the sharpest moisture gradient discussed above. This mechanical forcing is significant as it provides the necessary lift to maintain the vertical structure of the dryline against the eroding effects of horizontal diffusion [1]. This spatial alignment demonstrates that the model is correctly resolving the mesoscale ascent required to maintain the dryline’s vertical integrity against horizontal diffusion. The vector wind field further highlights the confluence between the easterly winds from the Gulf and the westerly continental air, providing the mechanical forcing for the afternoon surge that coincides precisely with the maximum specific humidity gradient (3.71 g/kg per km).
4.2.2. Nocturnal Retrograde and Recovery
A defining success of this simulation is the capture of the 170 km westward retrogression along 32° N transect between 0000 UTC and 0600 UTC 10 April. As solar heating ceased and the surface began to cool, the establishment of a stable nocturnal inversion allowed the surface air to decouple from the aloft westerlies. The successful retreat of the dryline is attributed to the YSU non-local scheme resolving pressure-gradient shift and nocturnal decoupling. However, the actual entrainment and turbulent transport responsible for the decoupling are still parameterized rather than explicitly resolved at 3 km.
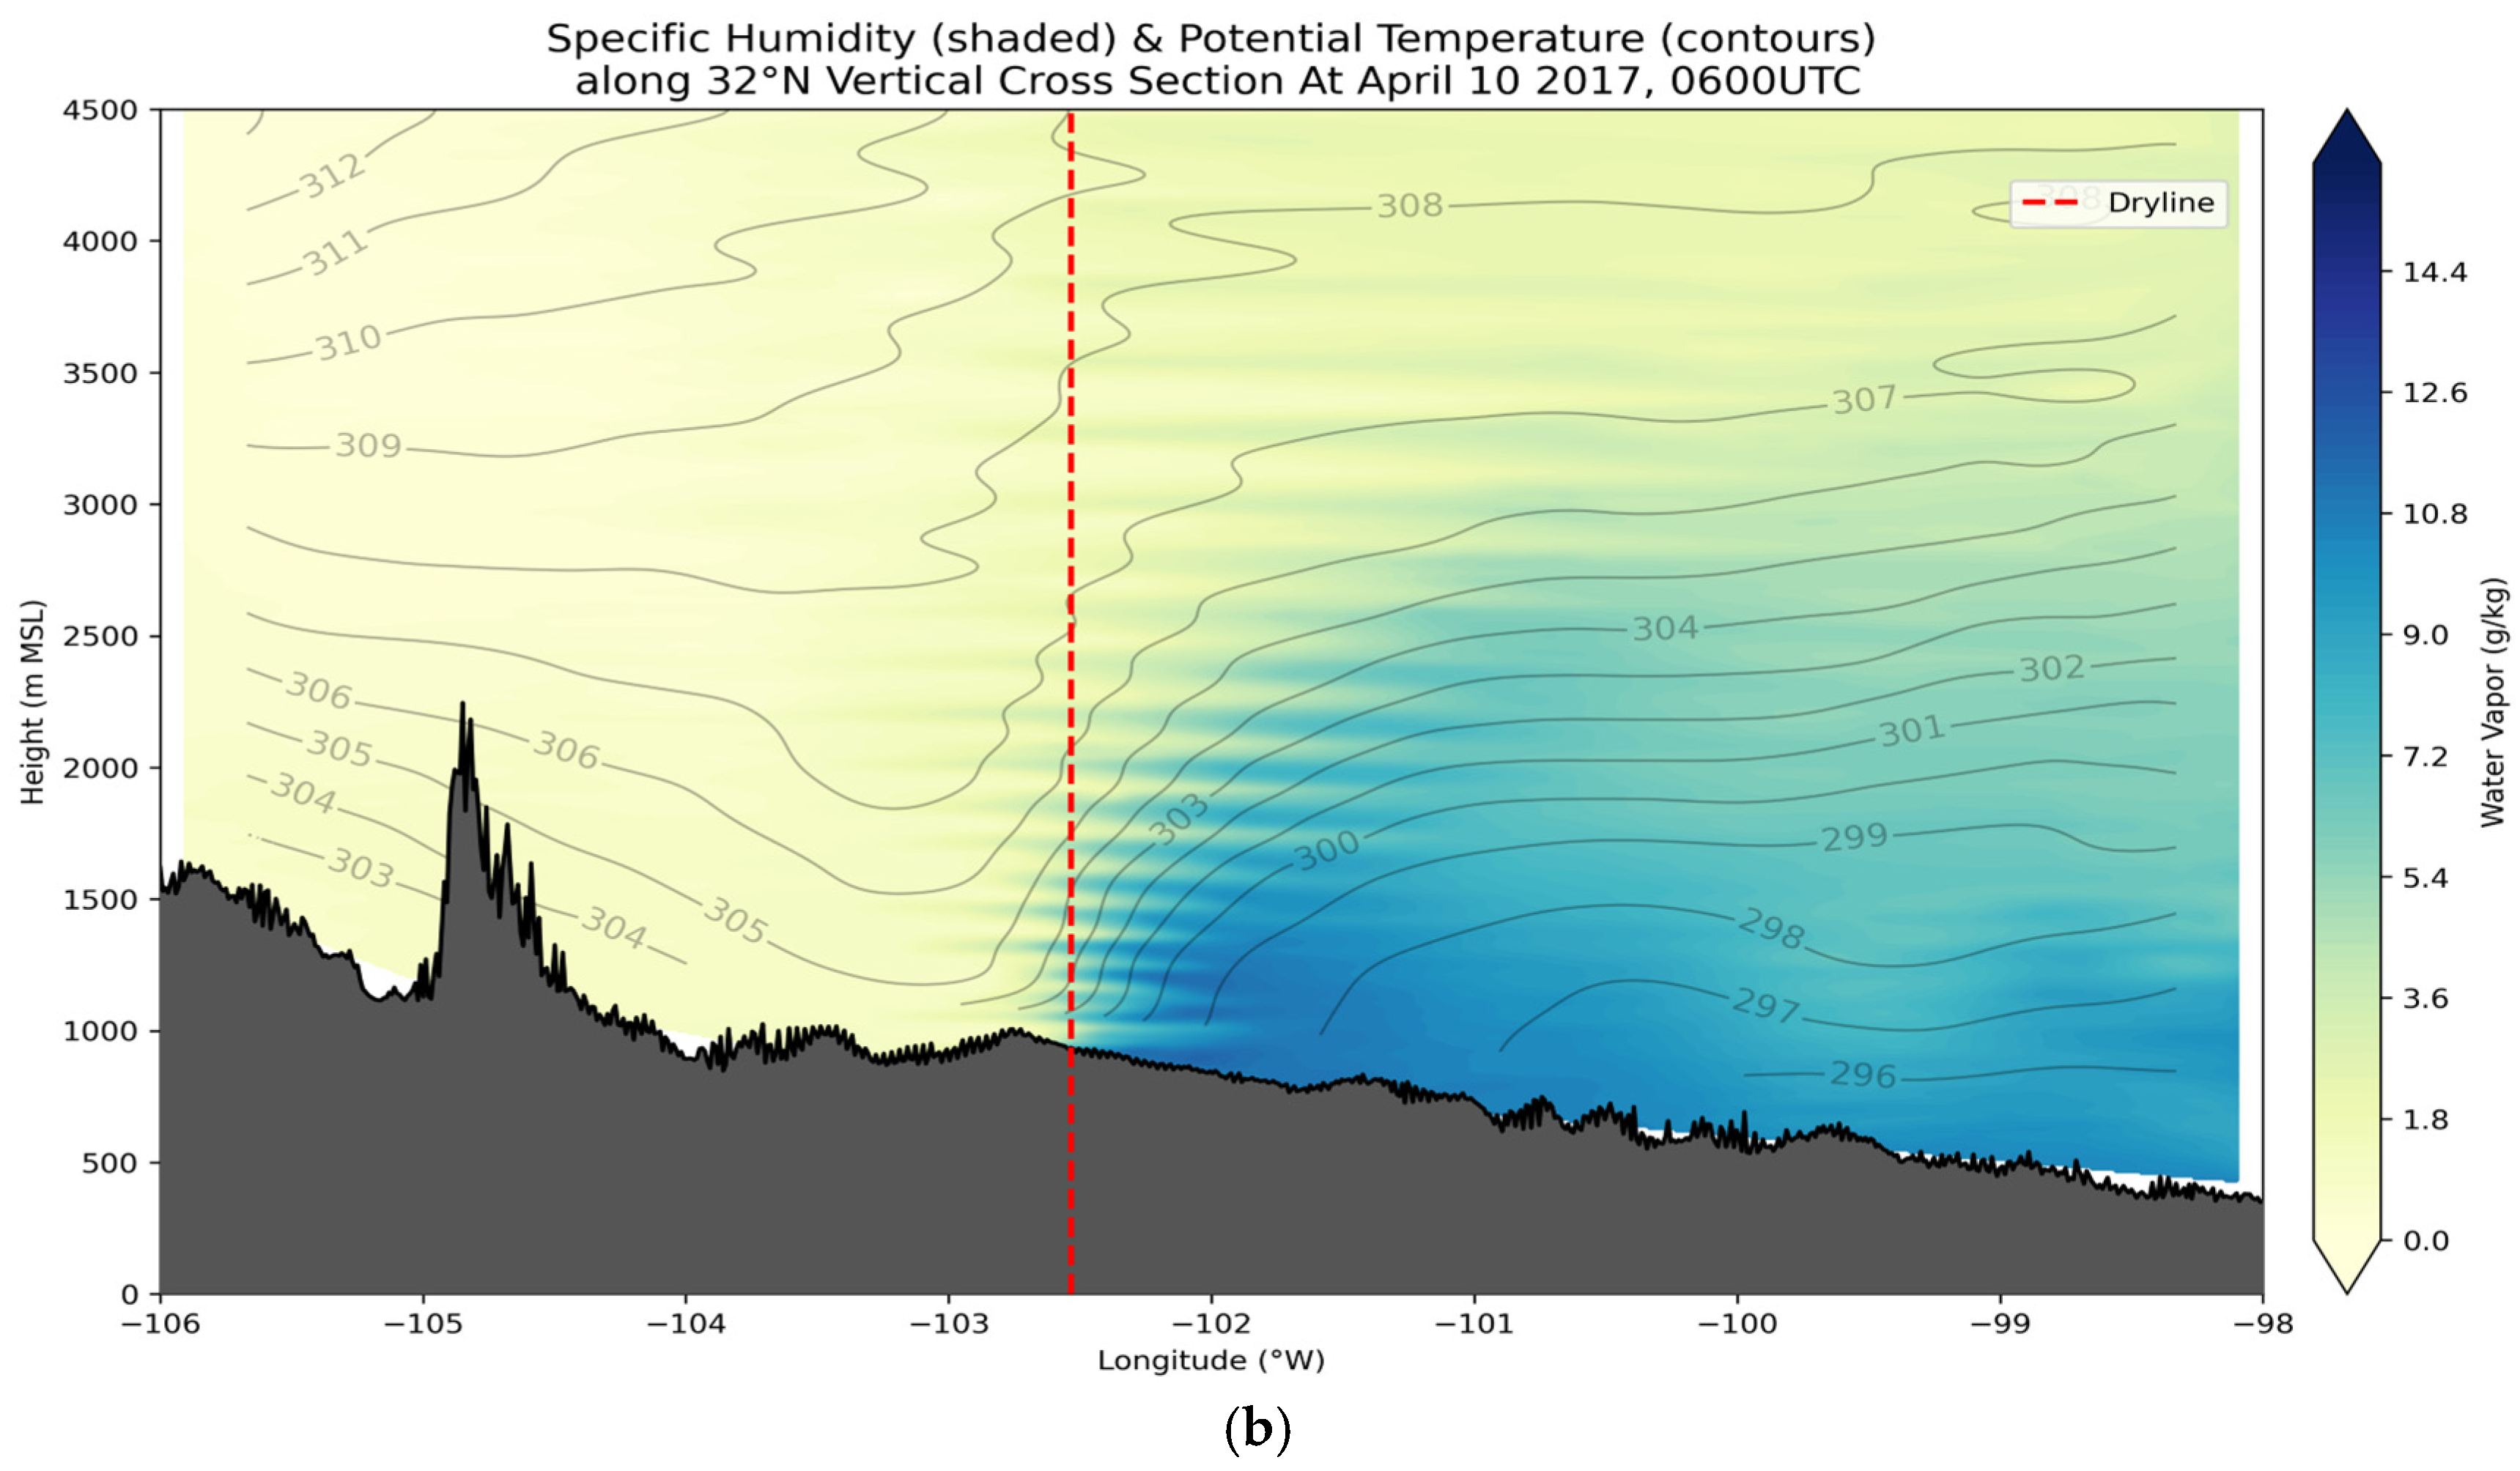
At 0600 UTC (local night time), the dryline had retreated significantly toward the west (i.e., the Trans-Pecos Mountain areas). Horizontal transects of specific humidity (Figure 8) show a rapid moisture recovery at the MROI (102.5° W), with values returning to pre-surge levels (>10 g/kg). This westward motion is attributed to the re-establishment of the low-level pressure gradient force, where the denser, moist air to the east surges back uphill [1]. The successful simulation of this phase is a significant improvement over traditional local-TKE models, which often suffer from an “eastward bias” by failing to retreat the moisture boundary [6].
Figure 8.
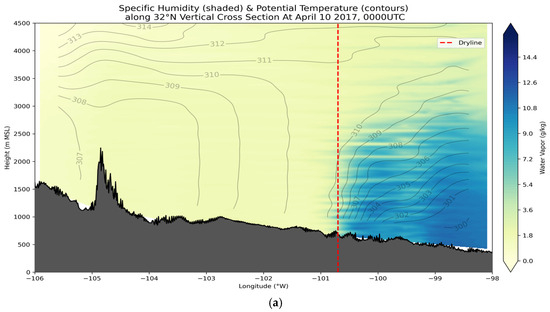
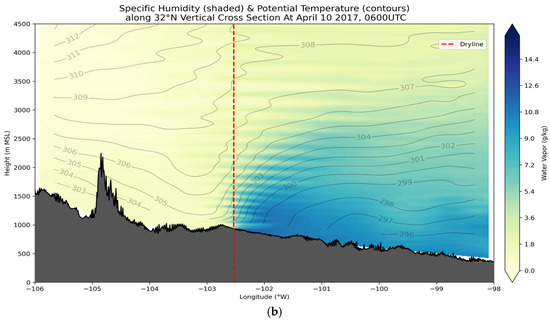
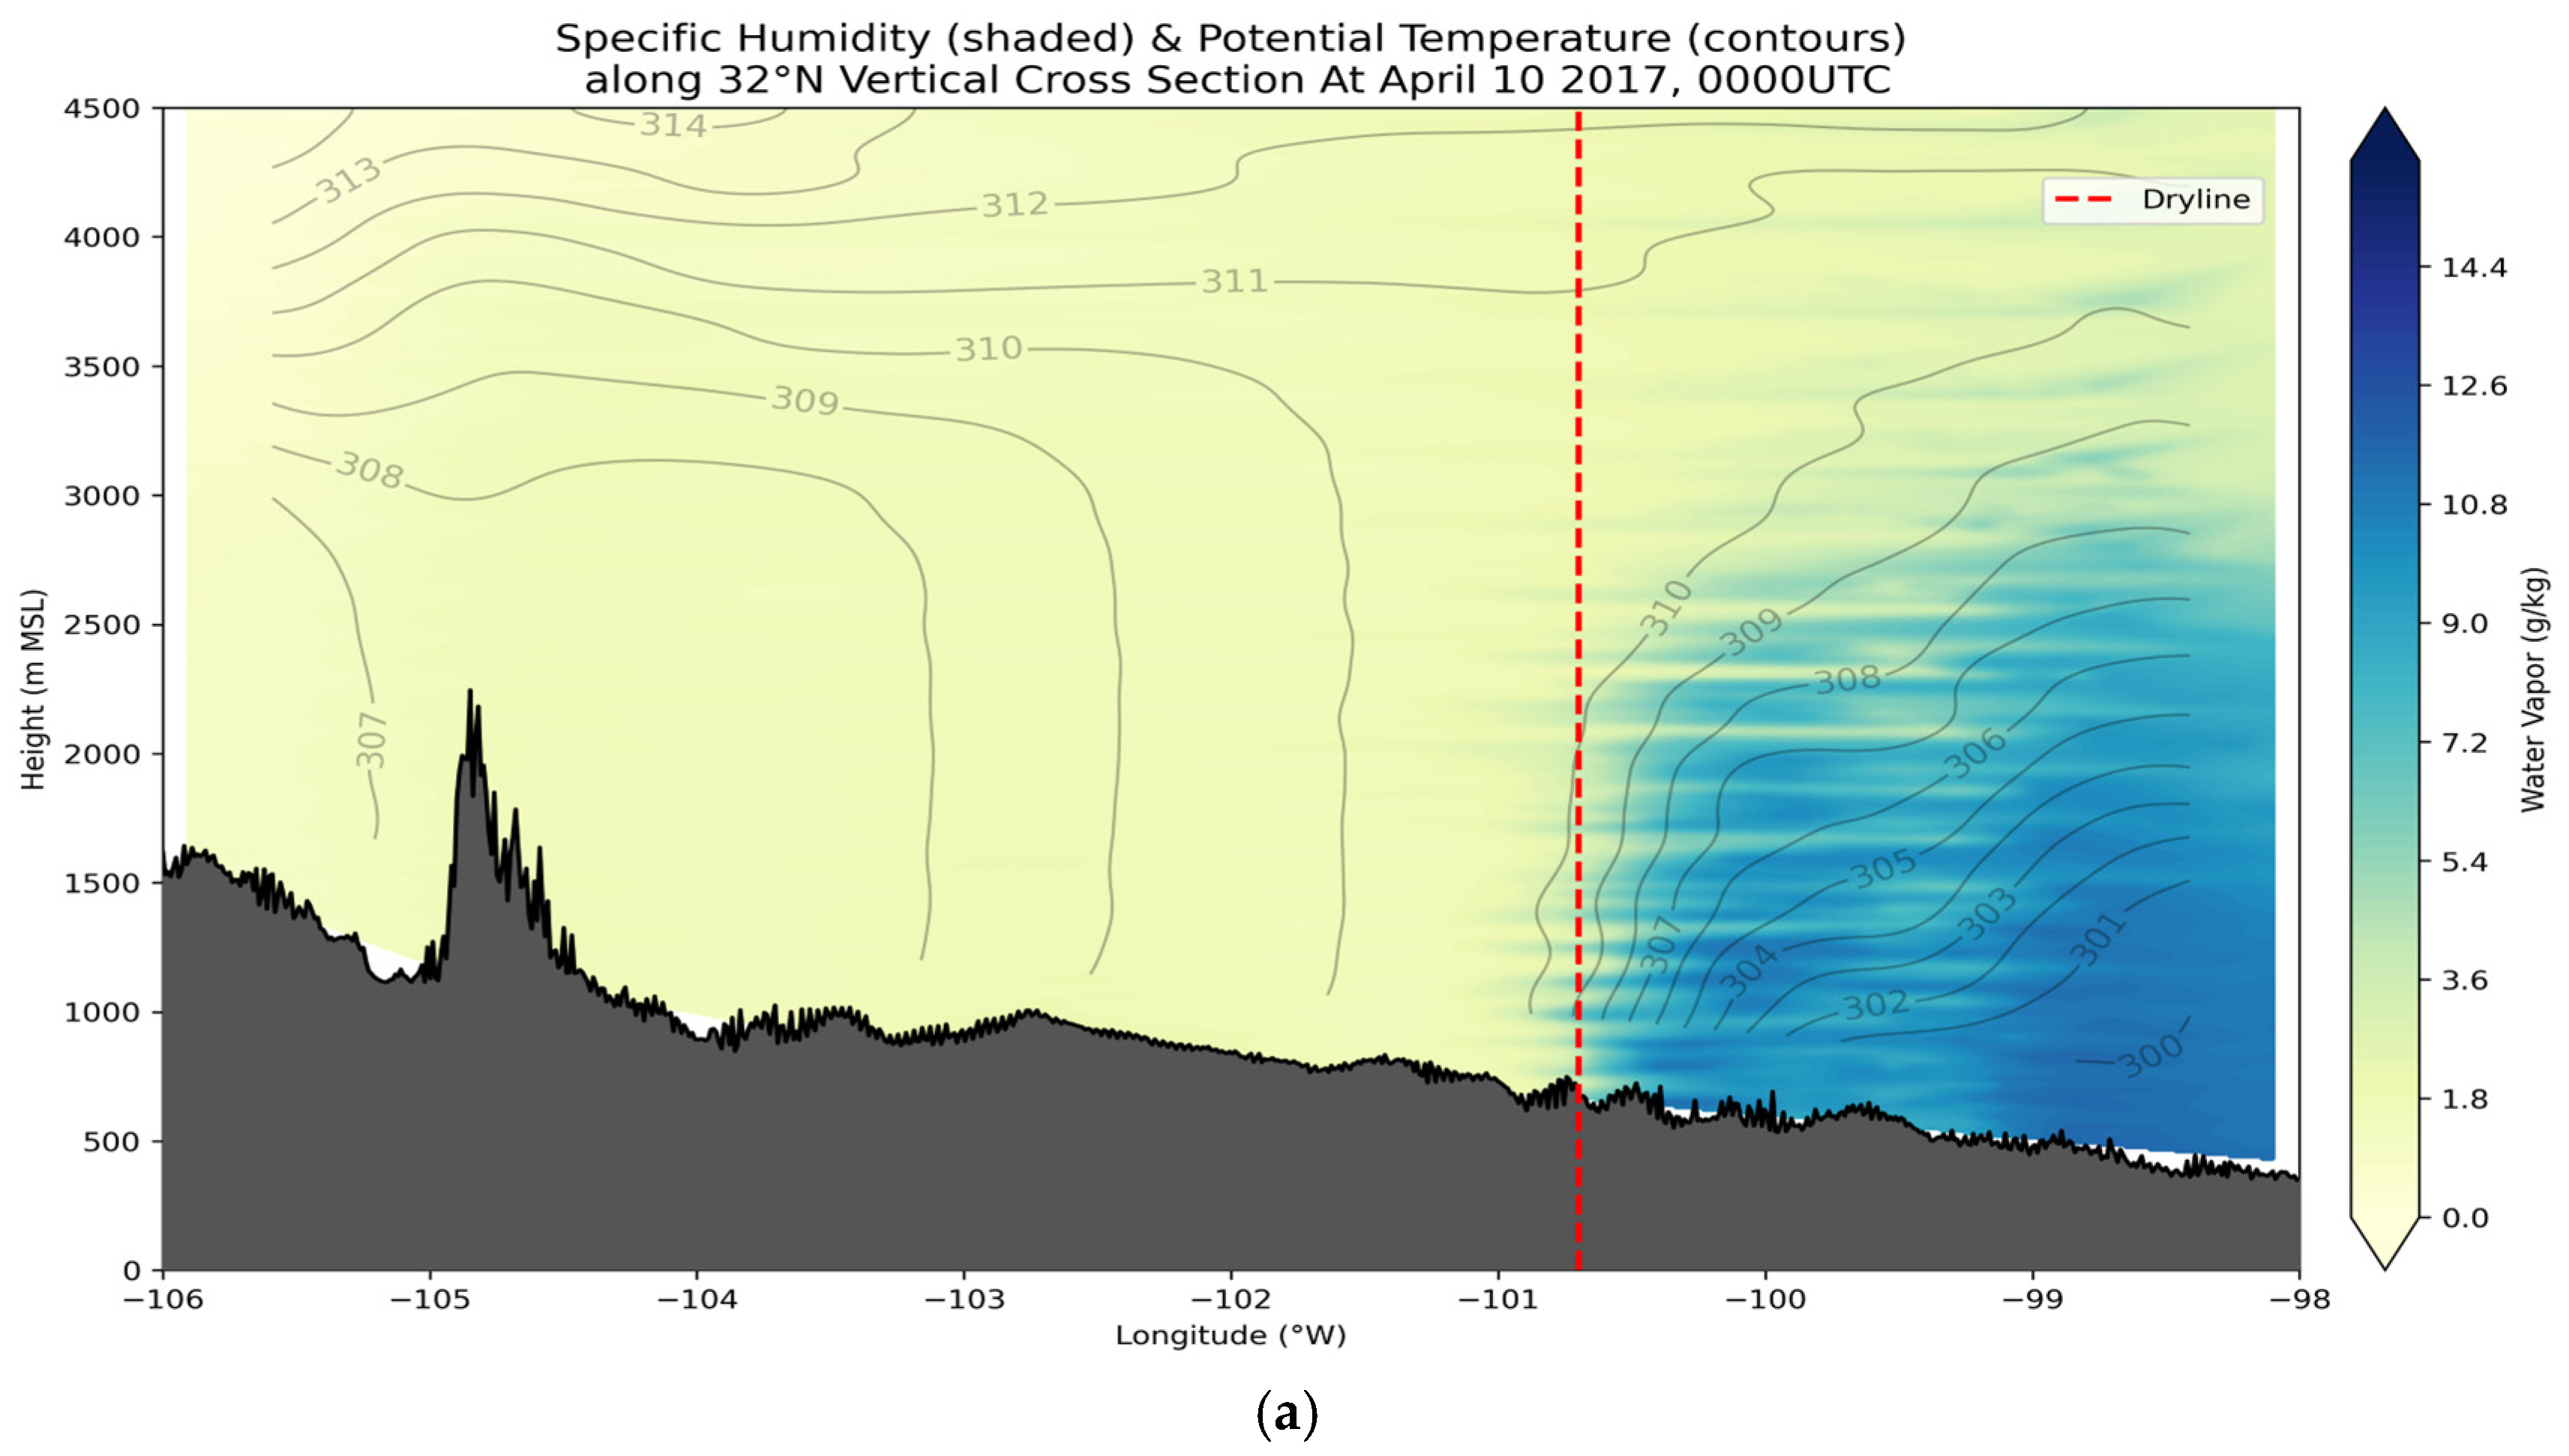
Vertical cross-section of specific humidity (g/kg, shaded) and potential temperature (K, contours) along 32° N from 105° W to 100° W at (a) 0000UTC and (b) 0600UTC, 10 April 2017.
Figure 7 shows that winds field and divergences on 850 hPa at 0600UTC, 10 April 2017 (local midnight time). It clearly shows the retrogression in action, where the sharp convergence ribbon has broken down and the winds have shifted to pull the moisture back west. As solar heating ceases, the horizontal structure undergoes a dramatic re-organization. Comparing the 0000Z and 0600Z dynamics (Figure 6 and Figure 7), the most immediate observation is the dissipation of the sharp, linear convergence ribbon. The peak convergence values, which exceeded 10 × 10−5/s at 32° N during the afternoon surge, have collapsed to scattered cells below 4 × 10⁻⁵/s. This suggests that the dryline is no longer being pushed east by convective mixing but is instead responding to the broader synoptic and terrain-driven pressure gradients. The 850 hPa wind field at 0600Z confirms the re-establishment of the westward retreat. While the 0000Z winds were dominated by westerly momentum originating from the mountains, the 0600Z winds show a dominant easterly component across the Permian Basin. This shift is characteristic of the nocturnal moisture surge, where the Low Level Jet (LLJ) overrides the stabilizing surface layer.
4.3. Vertical Thermodynamic Evolution and Inversion Stability
To justify the model’s capacity to resolve the dryline’s internal dynamics, we examine the vertical cross-sections of specific humidity and potential temperature along the 32° N transect. Figure 8a,b provide a direct comparison between the peak afternoon surge and the significant nocturnal retrograde, highlighting the atmospheric “lid” mechanics.
4.3.1. Peak Afternoon Surge and Mixed Layer Depth (0000 UTC)
At 0000 UTC 10 April, the dryline is at its maximum eastward displacement, located near 100.7° W. The vertical cross-section (Figure 8a) reveals a classic well-mixed convective boundary layer (CBL) characterized by vertical isentropes (θ contours). It shows that a sharp moisture interface is maintained between the PBL and free troposphere above. The specific humidity contours show a concentrated moisture gradient (>3.7 g/kg per km) at the leading edge of the surge. It is also noticed that the capping inversion lid exists above the PBL. In the cross-section, the sharp flattening of moisture contours at this height confirms that the model is successfully resolving the vertical limit of the moisture sector, preventing the moisture from venting into the dry westerly flow above.
4.3.2. The Nocturnal Retrograde (0600 UTC)
By 0600 UTC 10 April, the dryline has retreated westward to approximately 102.5° W, representing a significant 170 km retrograde from its 0000 UTC position. This 170 km displacement at an average velocity of 28.3 km/h demonstrates the model’s high sensitivity to nocturnal surface forcing. The 0600 UTC cross-section (Figure 8b) illustrates a fundamental structural shift. As the surface cools, the deep afternoon mixing layer collapses east of 102° W, and moisture pools within a shallow layer below 500 m Above Ground Level (AGL). Despite the surface decoupling, the layer of inversion remains visible in the potential temperature structure aloft. This elevated lid acts as a protective ceiling, trapping the returning moisture near the surface and preventing its erosion by the residual layer’s westerlies.
The capture of this 170 km retrogression is a major validation of our research implementation. It proves that the YSU non-local scheme correctly resolves the pressure gradient shift and nocturnal decoupling necessary to move the dryline westward—a process that is frequently missed or underestimated in standard numerical weather prediction models [6].
4.3.3. Vertical Thermodynamic Comparison
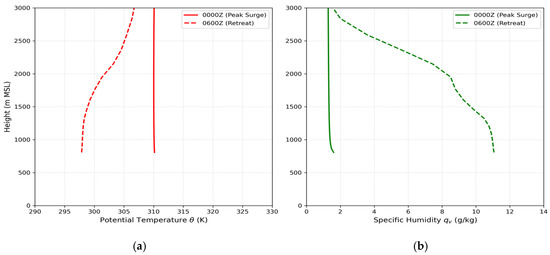
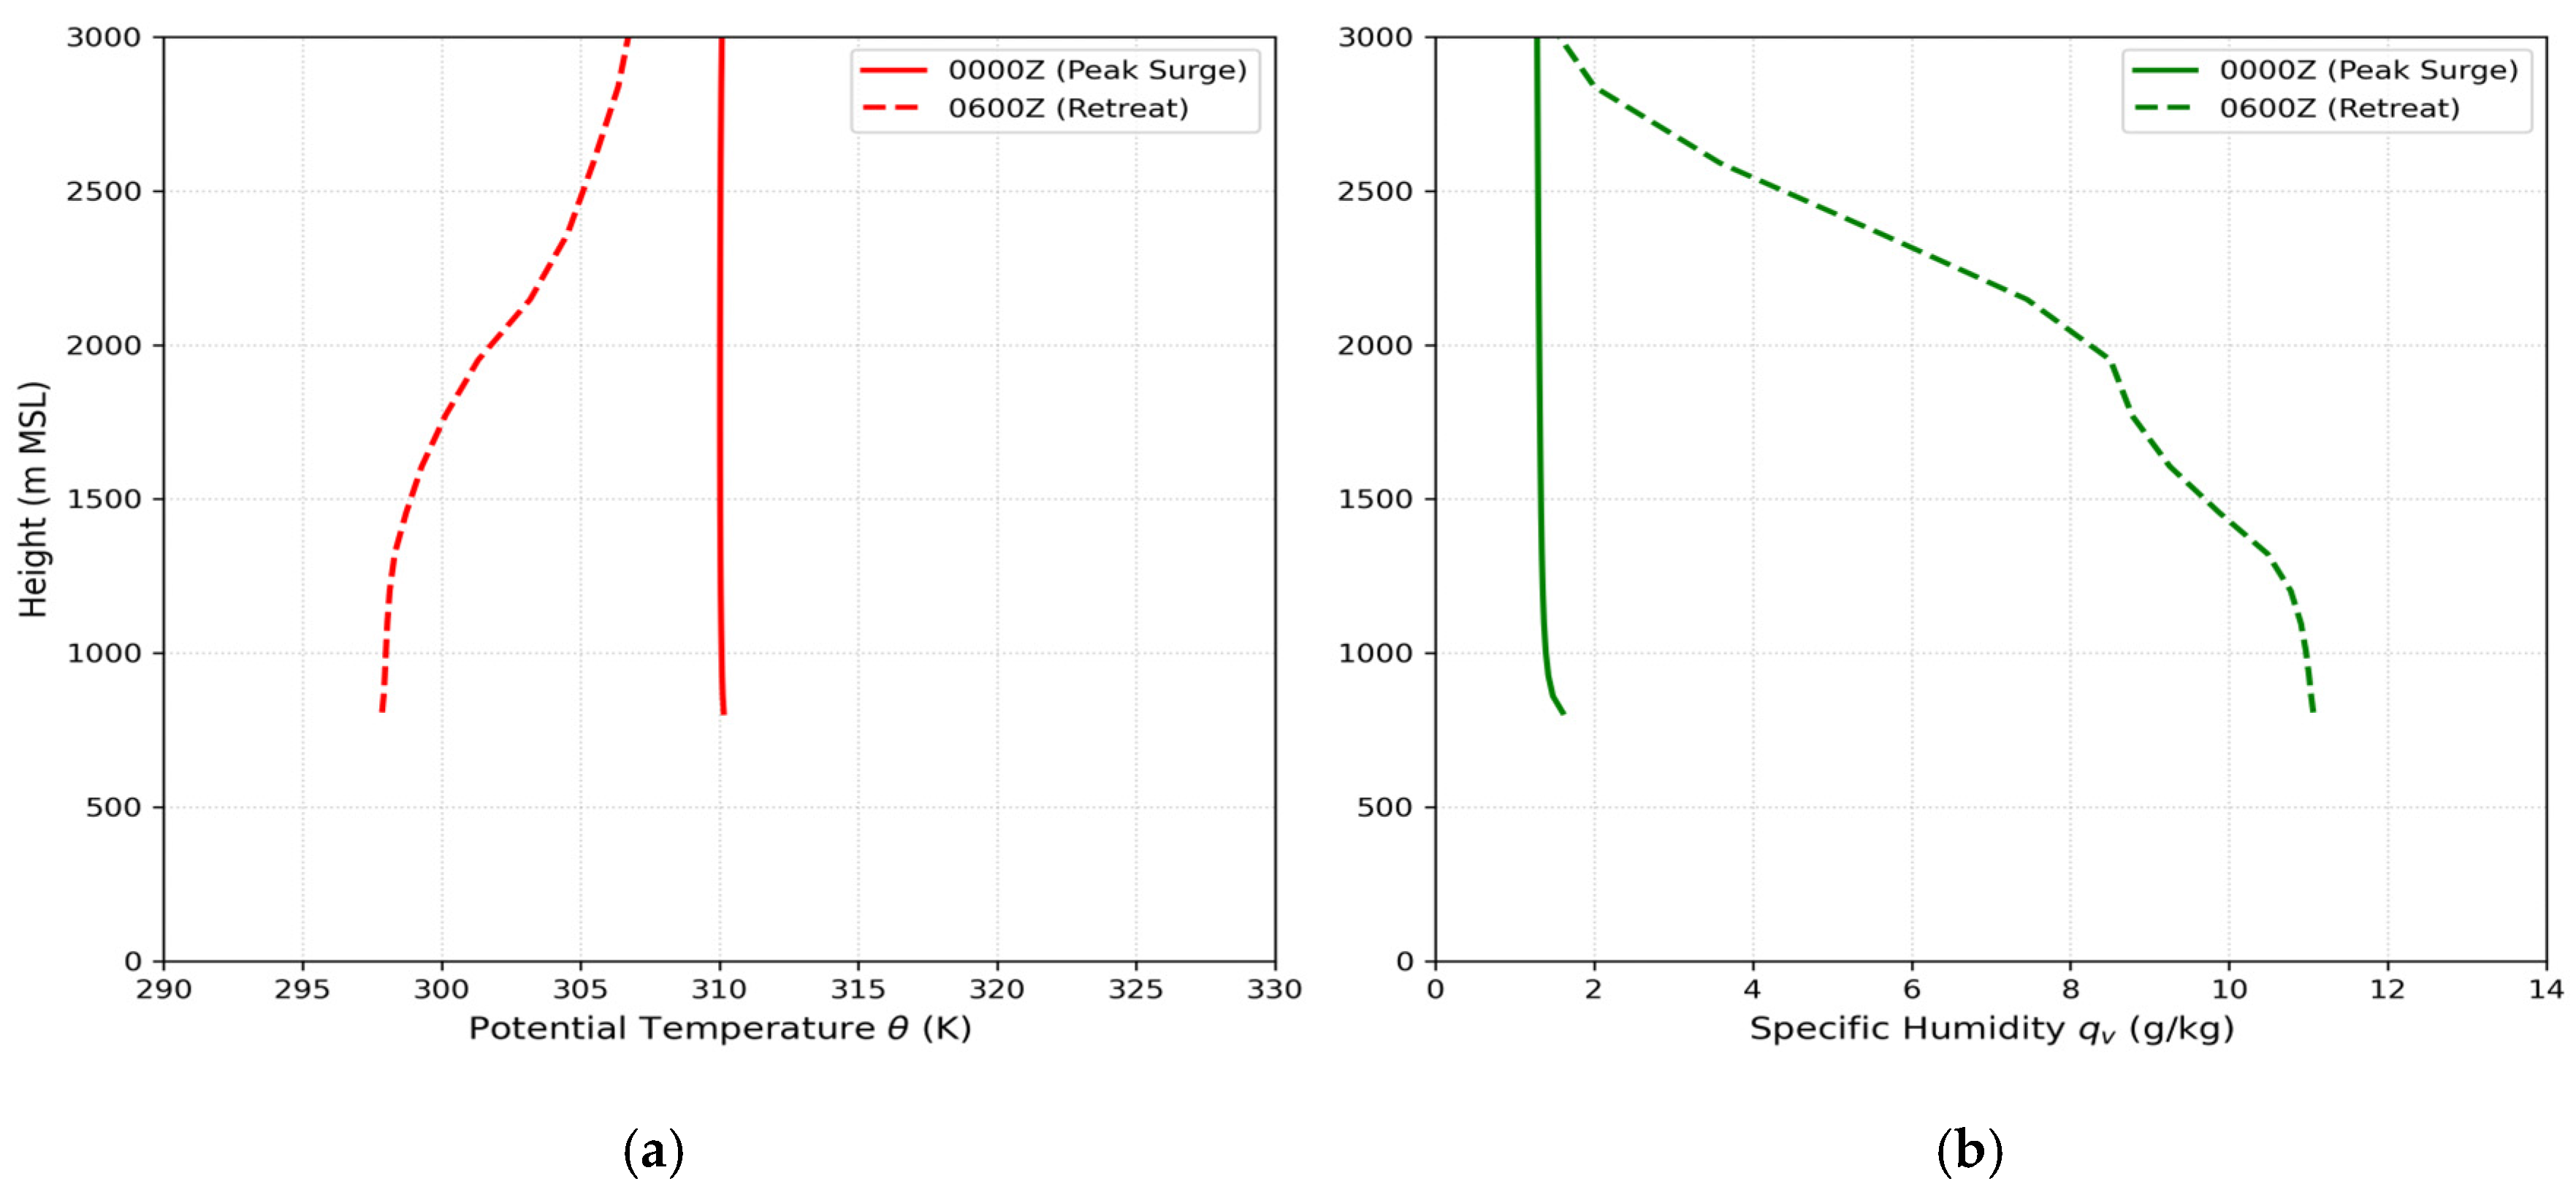
The vertical integrity of the boundary layer is a primary determinant of dryline mobility. Figure 9 illustrates the evolution of potential temperature (Figure 9a) and specific humidity (Figure 9b) at the middle way of two drylines along 32° N transect during the transition from the peak afternoon surge (0000 UTC) to the nocturnal retrograde (0600 UTC). The figure overlays the peak surge and the retreat, which create a visual proof of the atmospheric lid. The most significant feature resolved by the MPAS-YSU configuration is the persistence of the elevated capping inversion. At 0000 UTC (solid lines) (Figure 9a), the potential temperature profile shows a near-ideal convective mixed layer extending from the surface to the base of the lid. This deep mixing allows the westerly momentum to penetrate to the surface, driving the afternoon dryline surge. At 0600 UTC (dashed lines), despite significant surface cooling and the development of a shallow nocturnal inversion, the elevated lid remains remarkably stationary and intact.
Figure 9.
Comparative vertical profiles of (a) potential temperature (K) and (b) specific humidity (g/kg) at the middle way of drylines along 32° N transect (32.0° N, 101.6° W). Profiles are shown for the time of peak eastward surge (0000 UTC 10 April; solid lines) and peak nocturnal retrograde (0600 UTC 10 April; dashed lines).
The specific humidity profiles (Figure 9b) demonstrate how this lid facilitates the nocturnal retreat. At 0600 UTC, the specific humidity in the lower levels has recovered significantly, returning to values of about 11 g/kg. Crucially, this moisture is trapped beneath the lid. By maintaining this stable layer, the model prevents the dry, westerly air of the residual layer from mixing downward and eroding the returning moisture surge. This vertical stratification is the physical requirement for the low-level pressure gradient to dominate, allowing the dryline to snap back westward as observed [5,6].
4.4. Sensitivity Experiments
4.4.1. Impact of Topographic Forcing on Dryline Mobility
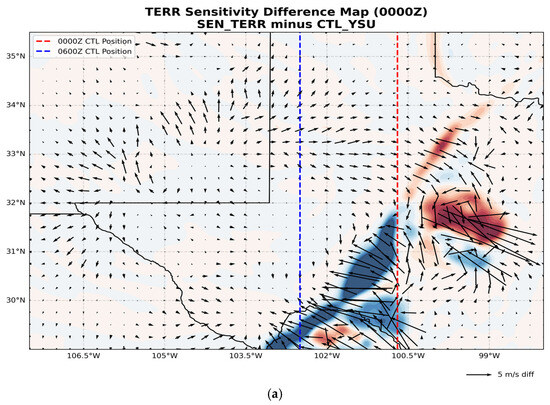
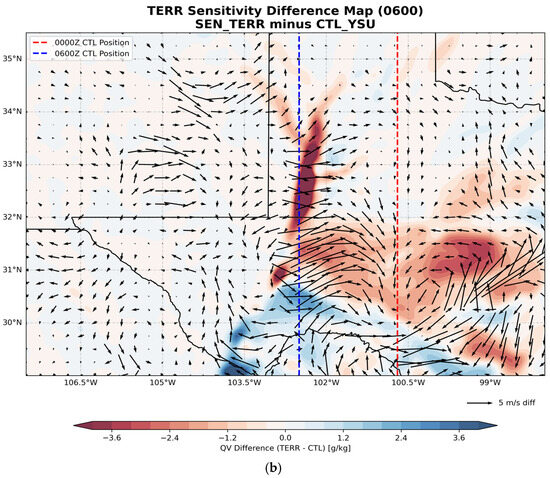
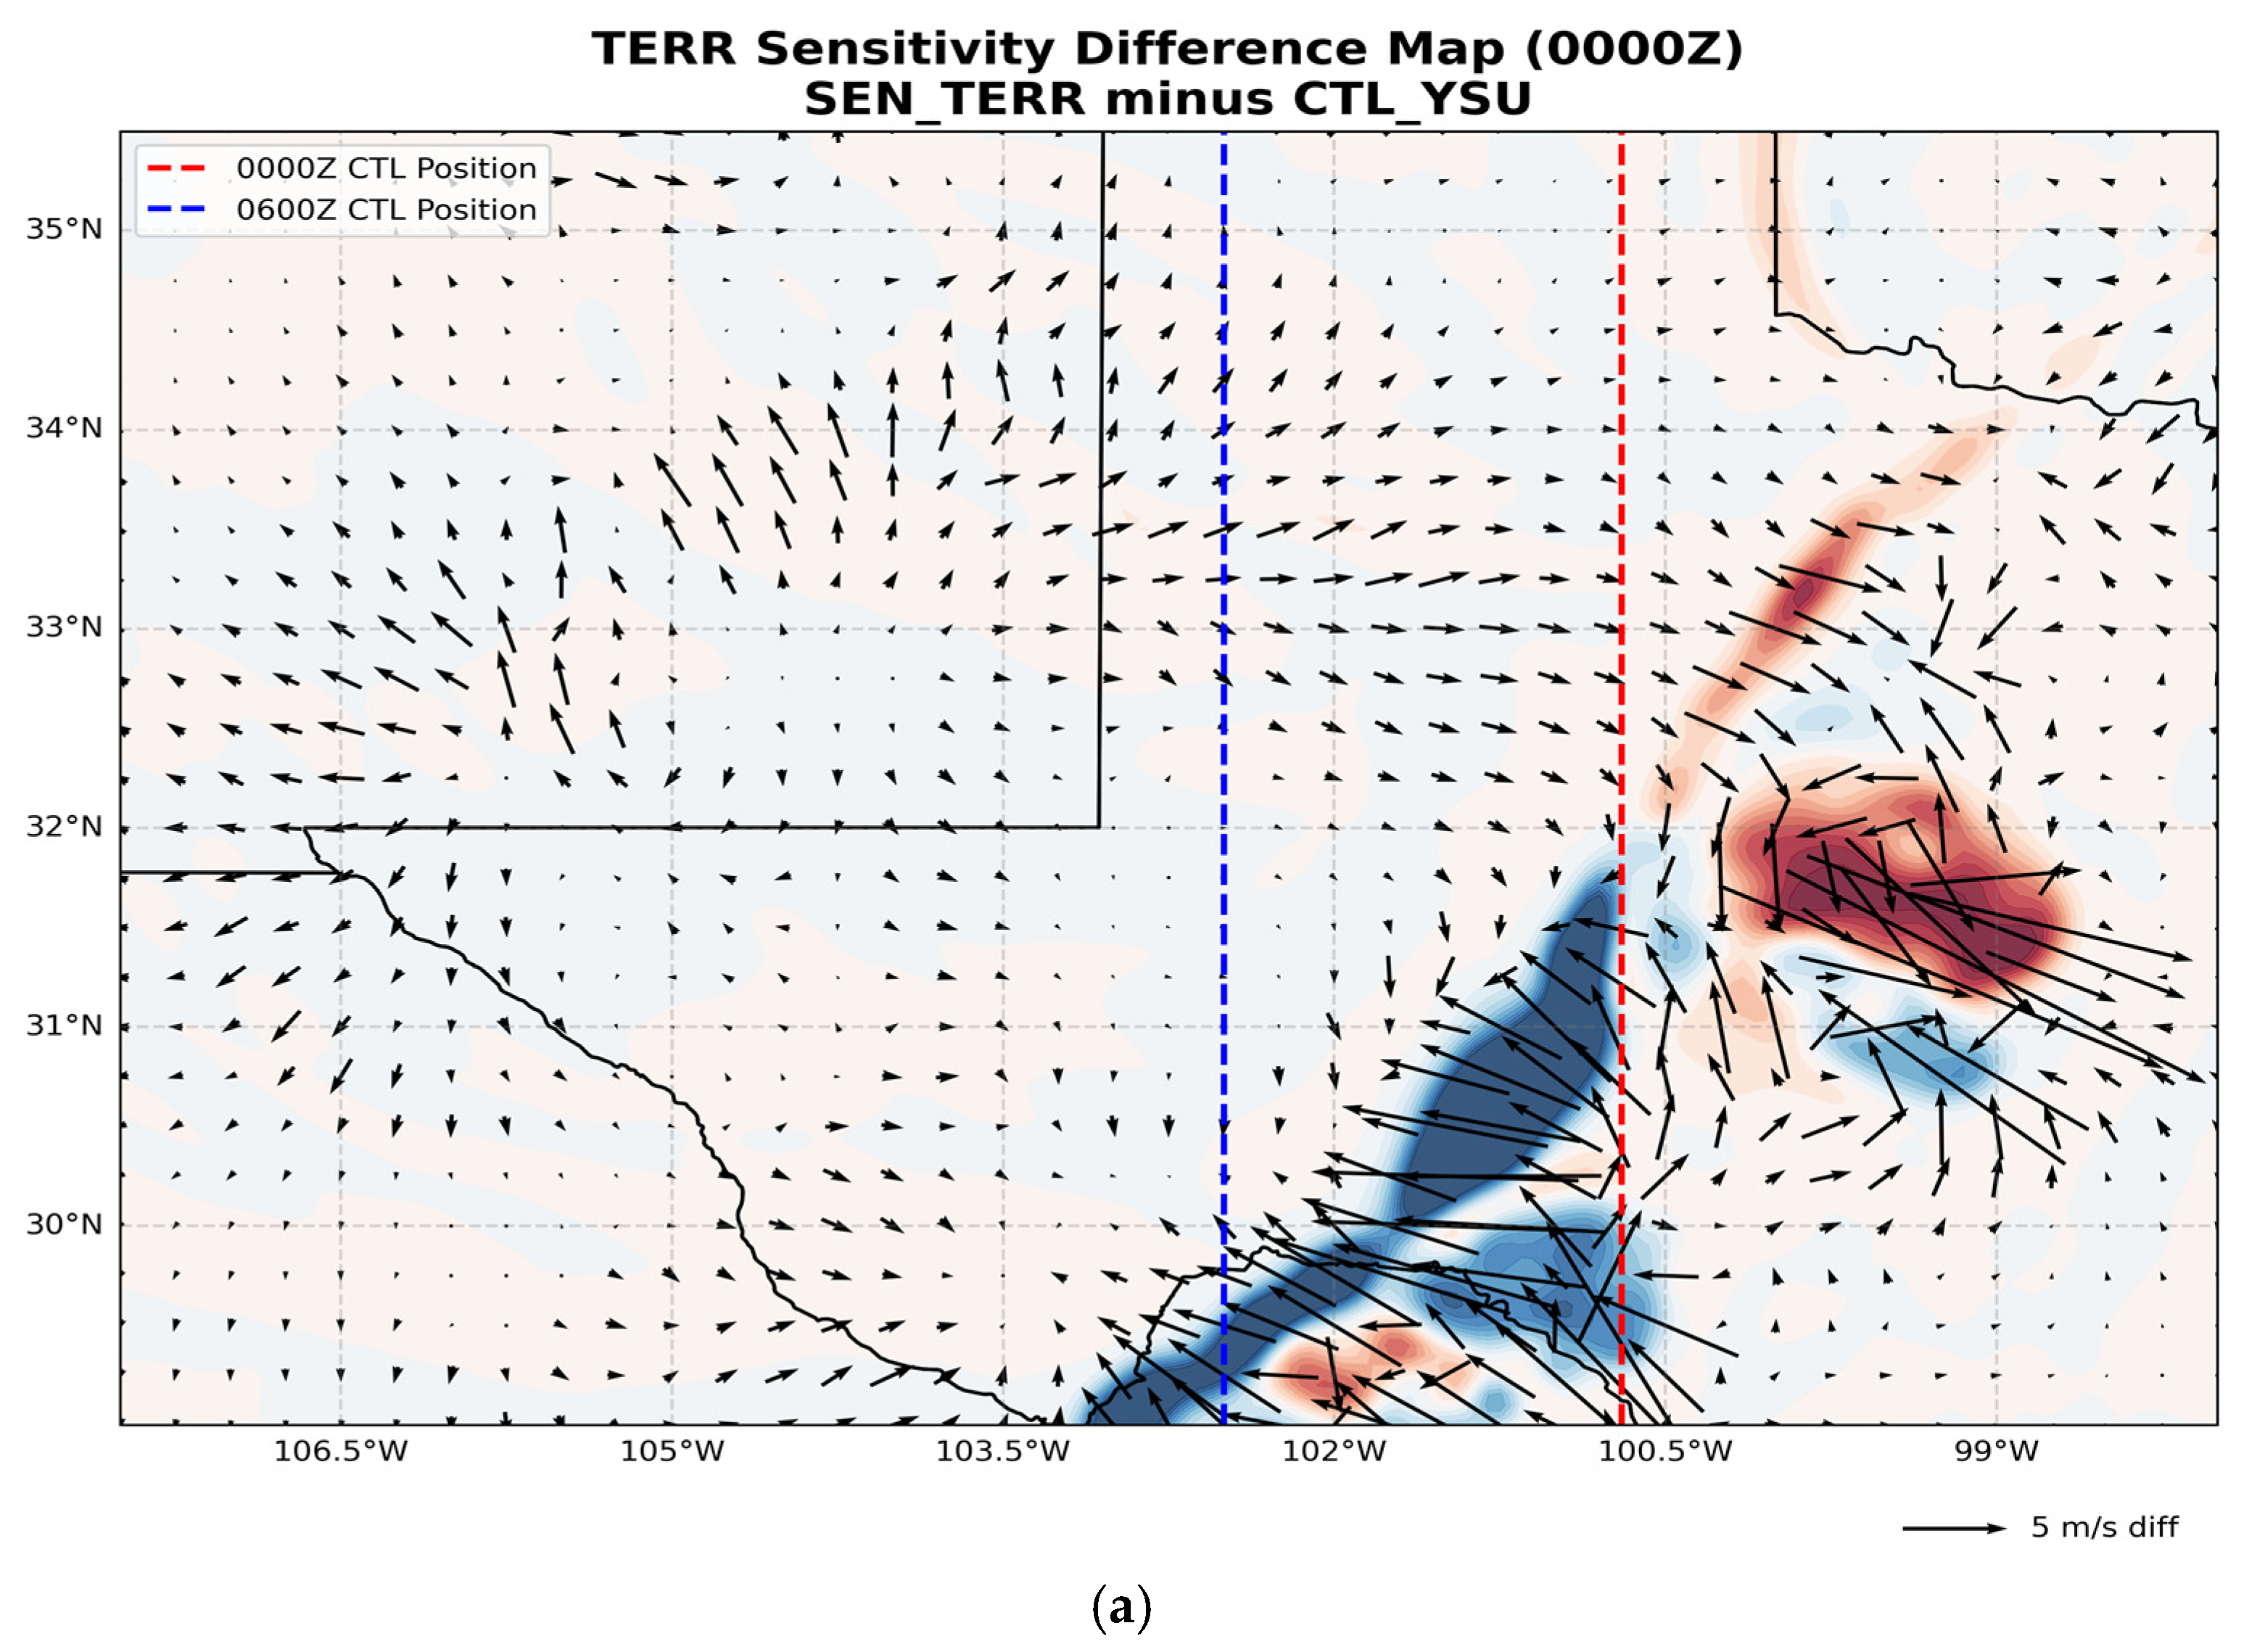
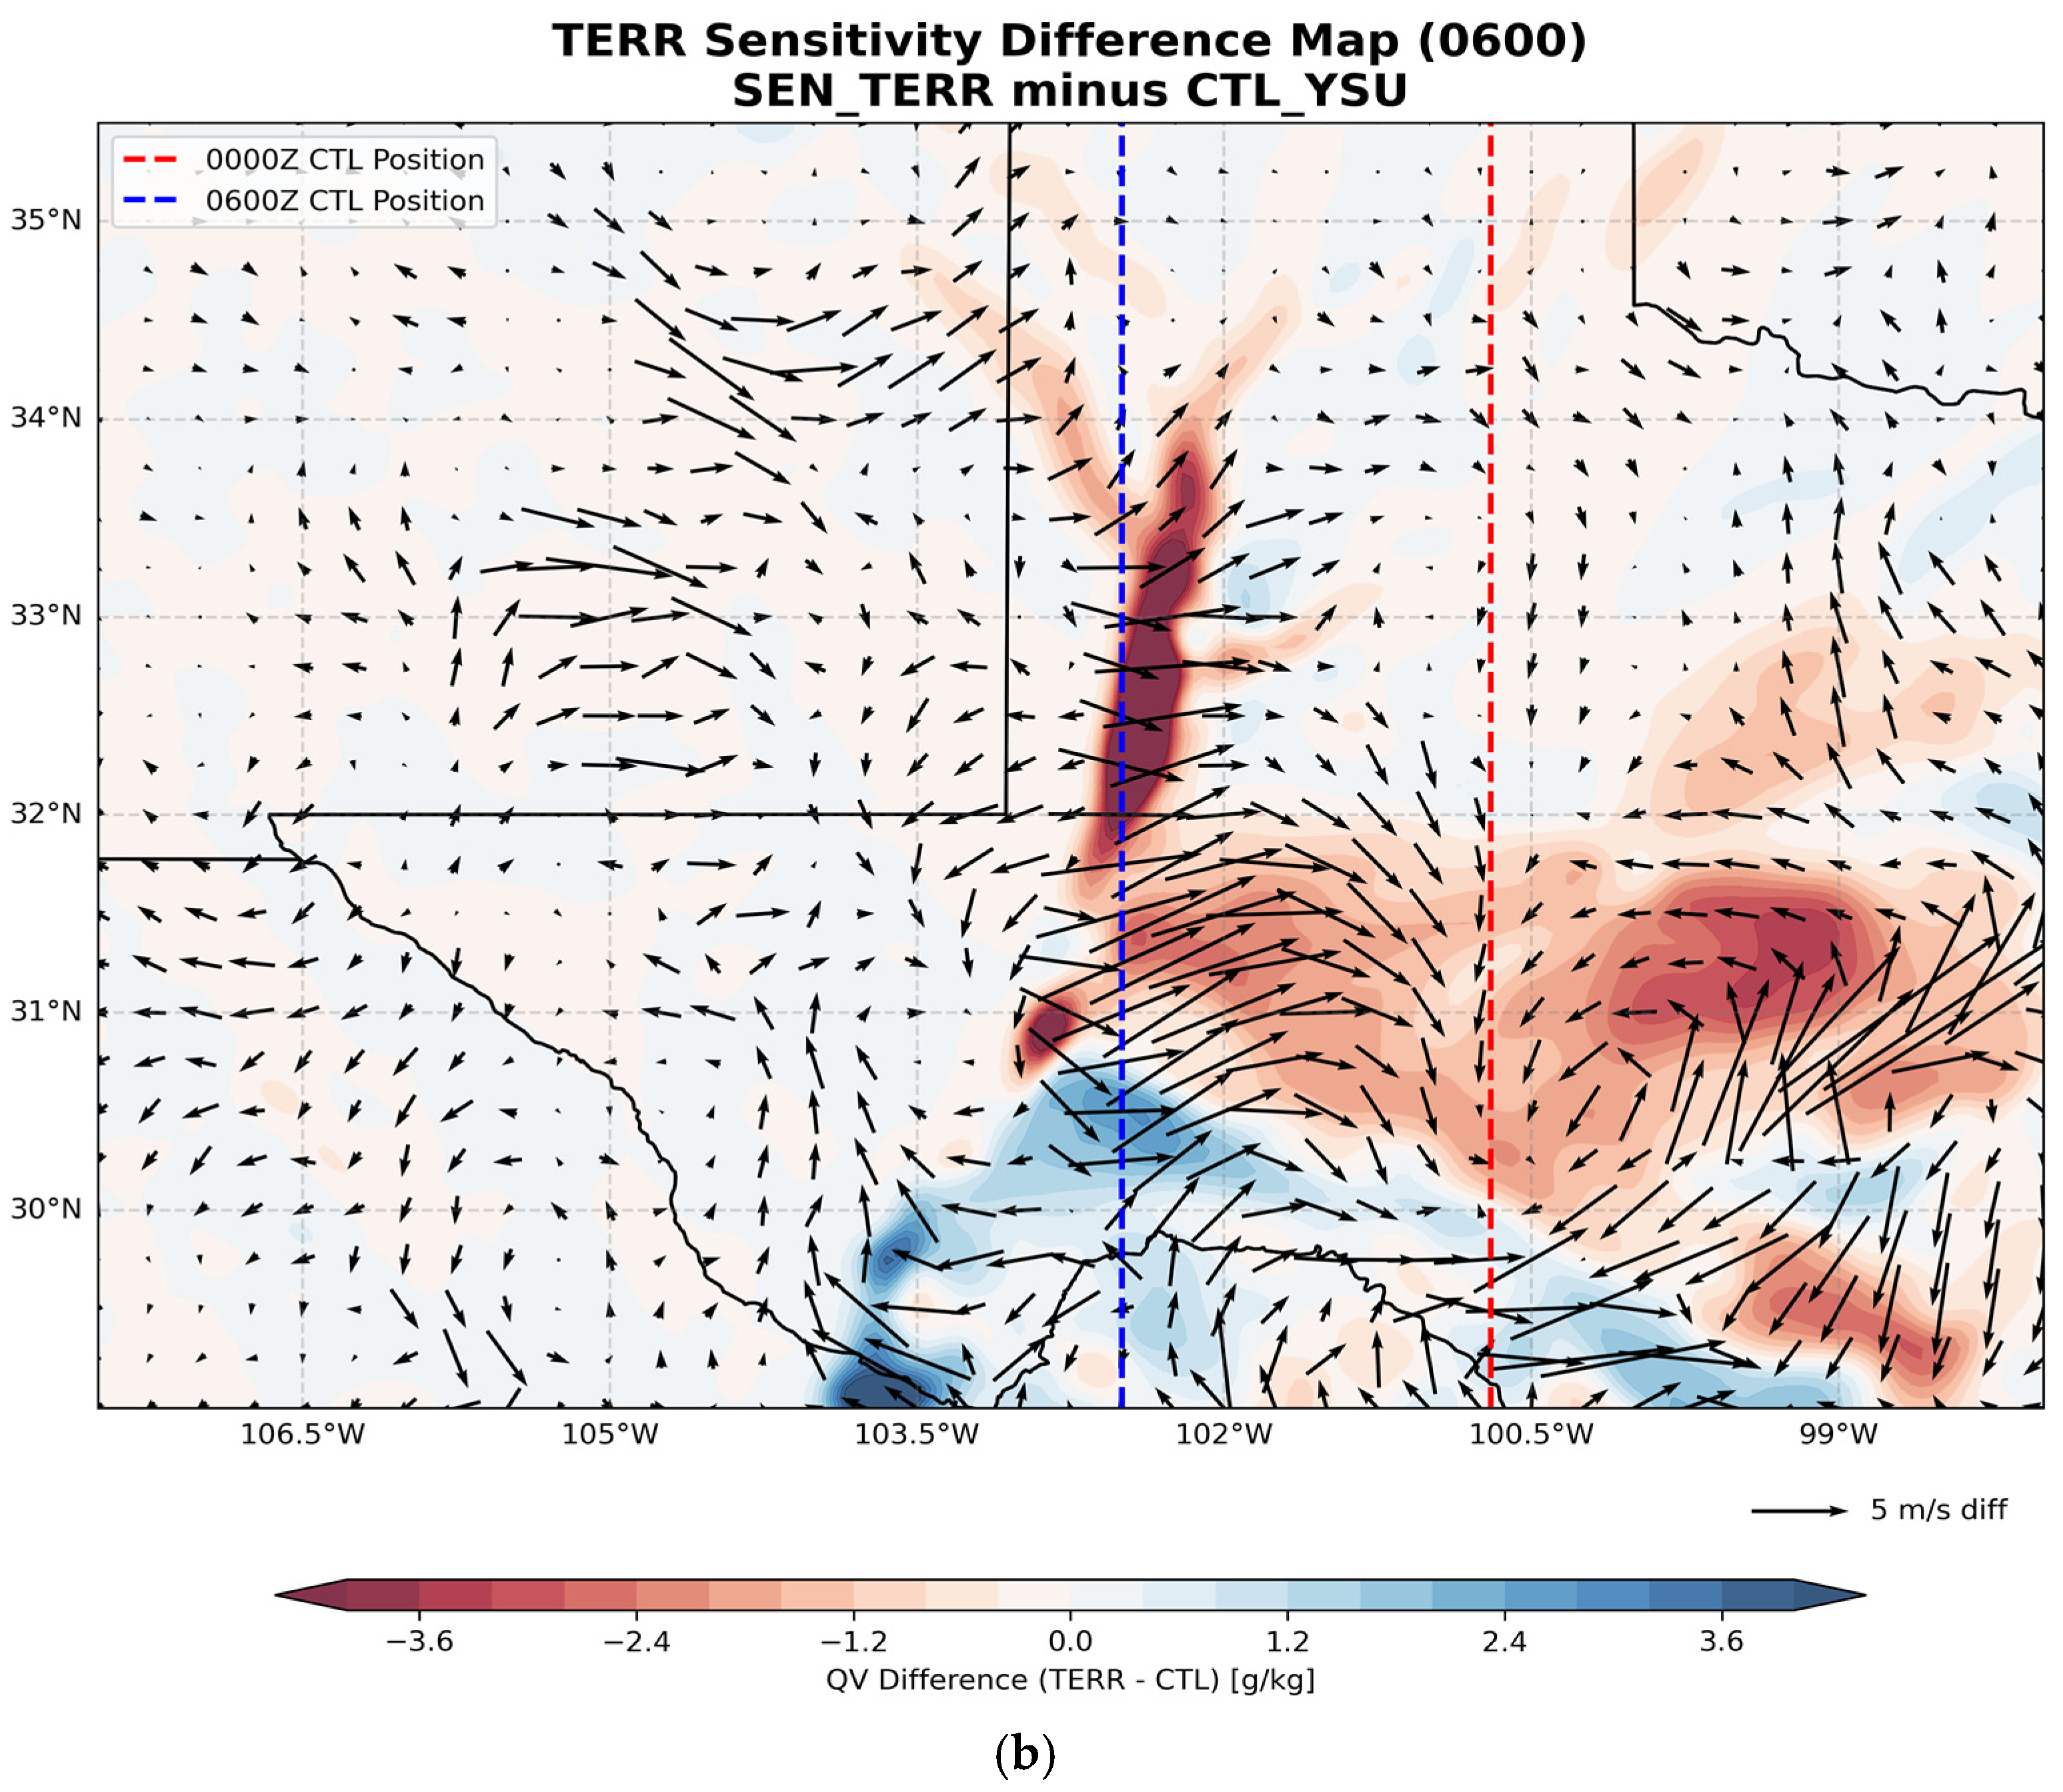
To quantify the role of the West Texas sloping ramp in driving the dryline lifecycle, the difference between the 50% terrain reduction experiment (SEN_TER) and the control run (CTL_YSU) was analyzed (Figure 10). Warm colors (negative values) indicate regions where the sensitivity run is drier than the control.
Figure 10.
Horizontal difference maps of surface specific humidity (g/kg, shading) and 850 hPa wind vectors (m/s, arrows) between the terrain sensitivity experiment (SEN_TER) and the control run (CTL_YSU) at (a) 0000 UTC 10 April and (b) 0600 UTC 10 April. The longitude of dryline position at 32 N is shown by the red dashed line (0000 UTC) and blue dashed line (0600 UTC).
At 0000 UTC (Figure 10a), the difference map reveals a clear negative moisture anomaly (<−2.5 g/kg) centered along the 101° W meridian. This indicates that the dryline in the SEN_TER case remained positioned further west than the 100.7° W surge limit observed in the control run. The wind difference vectors show an anomalous westward flow, suggesting that the reduced elevation diminished the lee-side troughing intensity. Without the steep terrain gradient, the hydrostatic pressure falls to the east were insufficient to pull the dryline as far into the plains as documented in the 2017 case.
The most dramatic impact of the terrain modification occurs during the recovery phase at 0600 UTC (Figure 10b). A broad region of negative specific humidity differences (3–4 g/kg) is evident between 101° W and 103° W, directly covering the path of the control run’s retreat.
4.4.2. Impact of Soil Moisture Feedbacks on Moisture Gradient Intensity
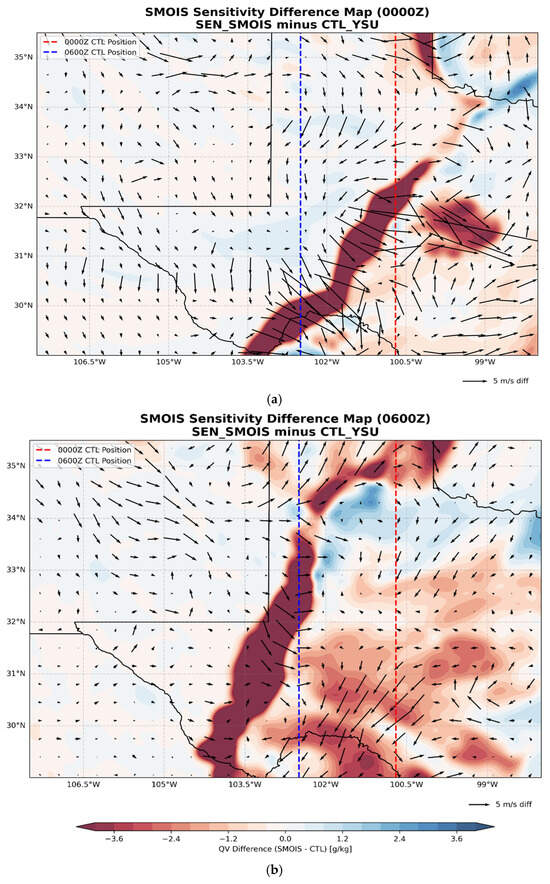
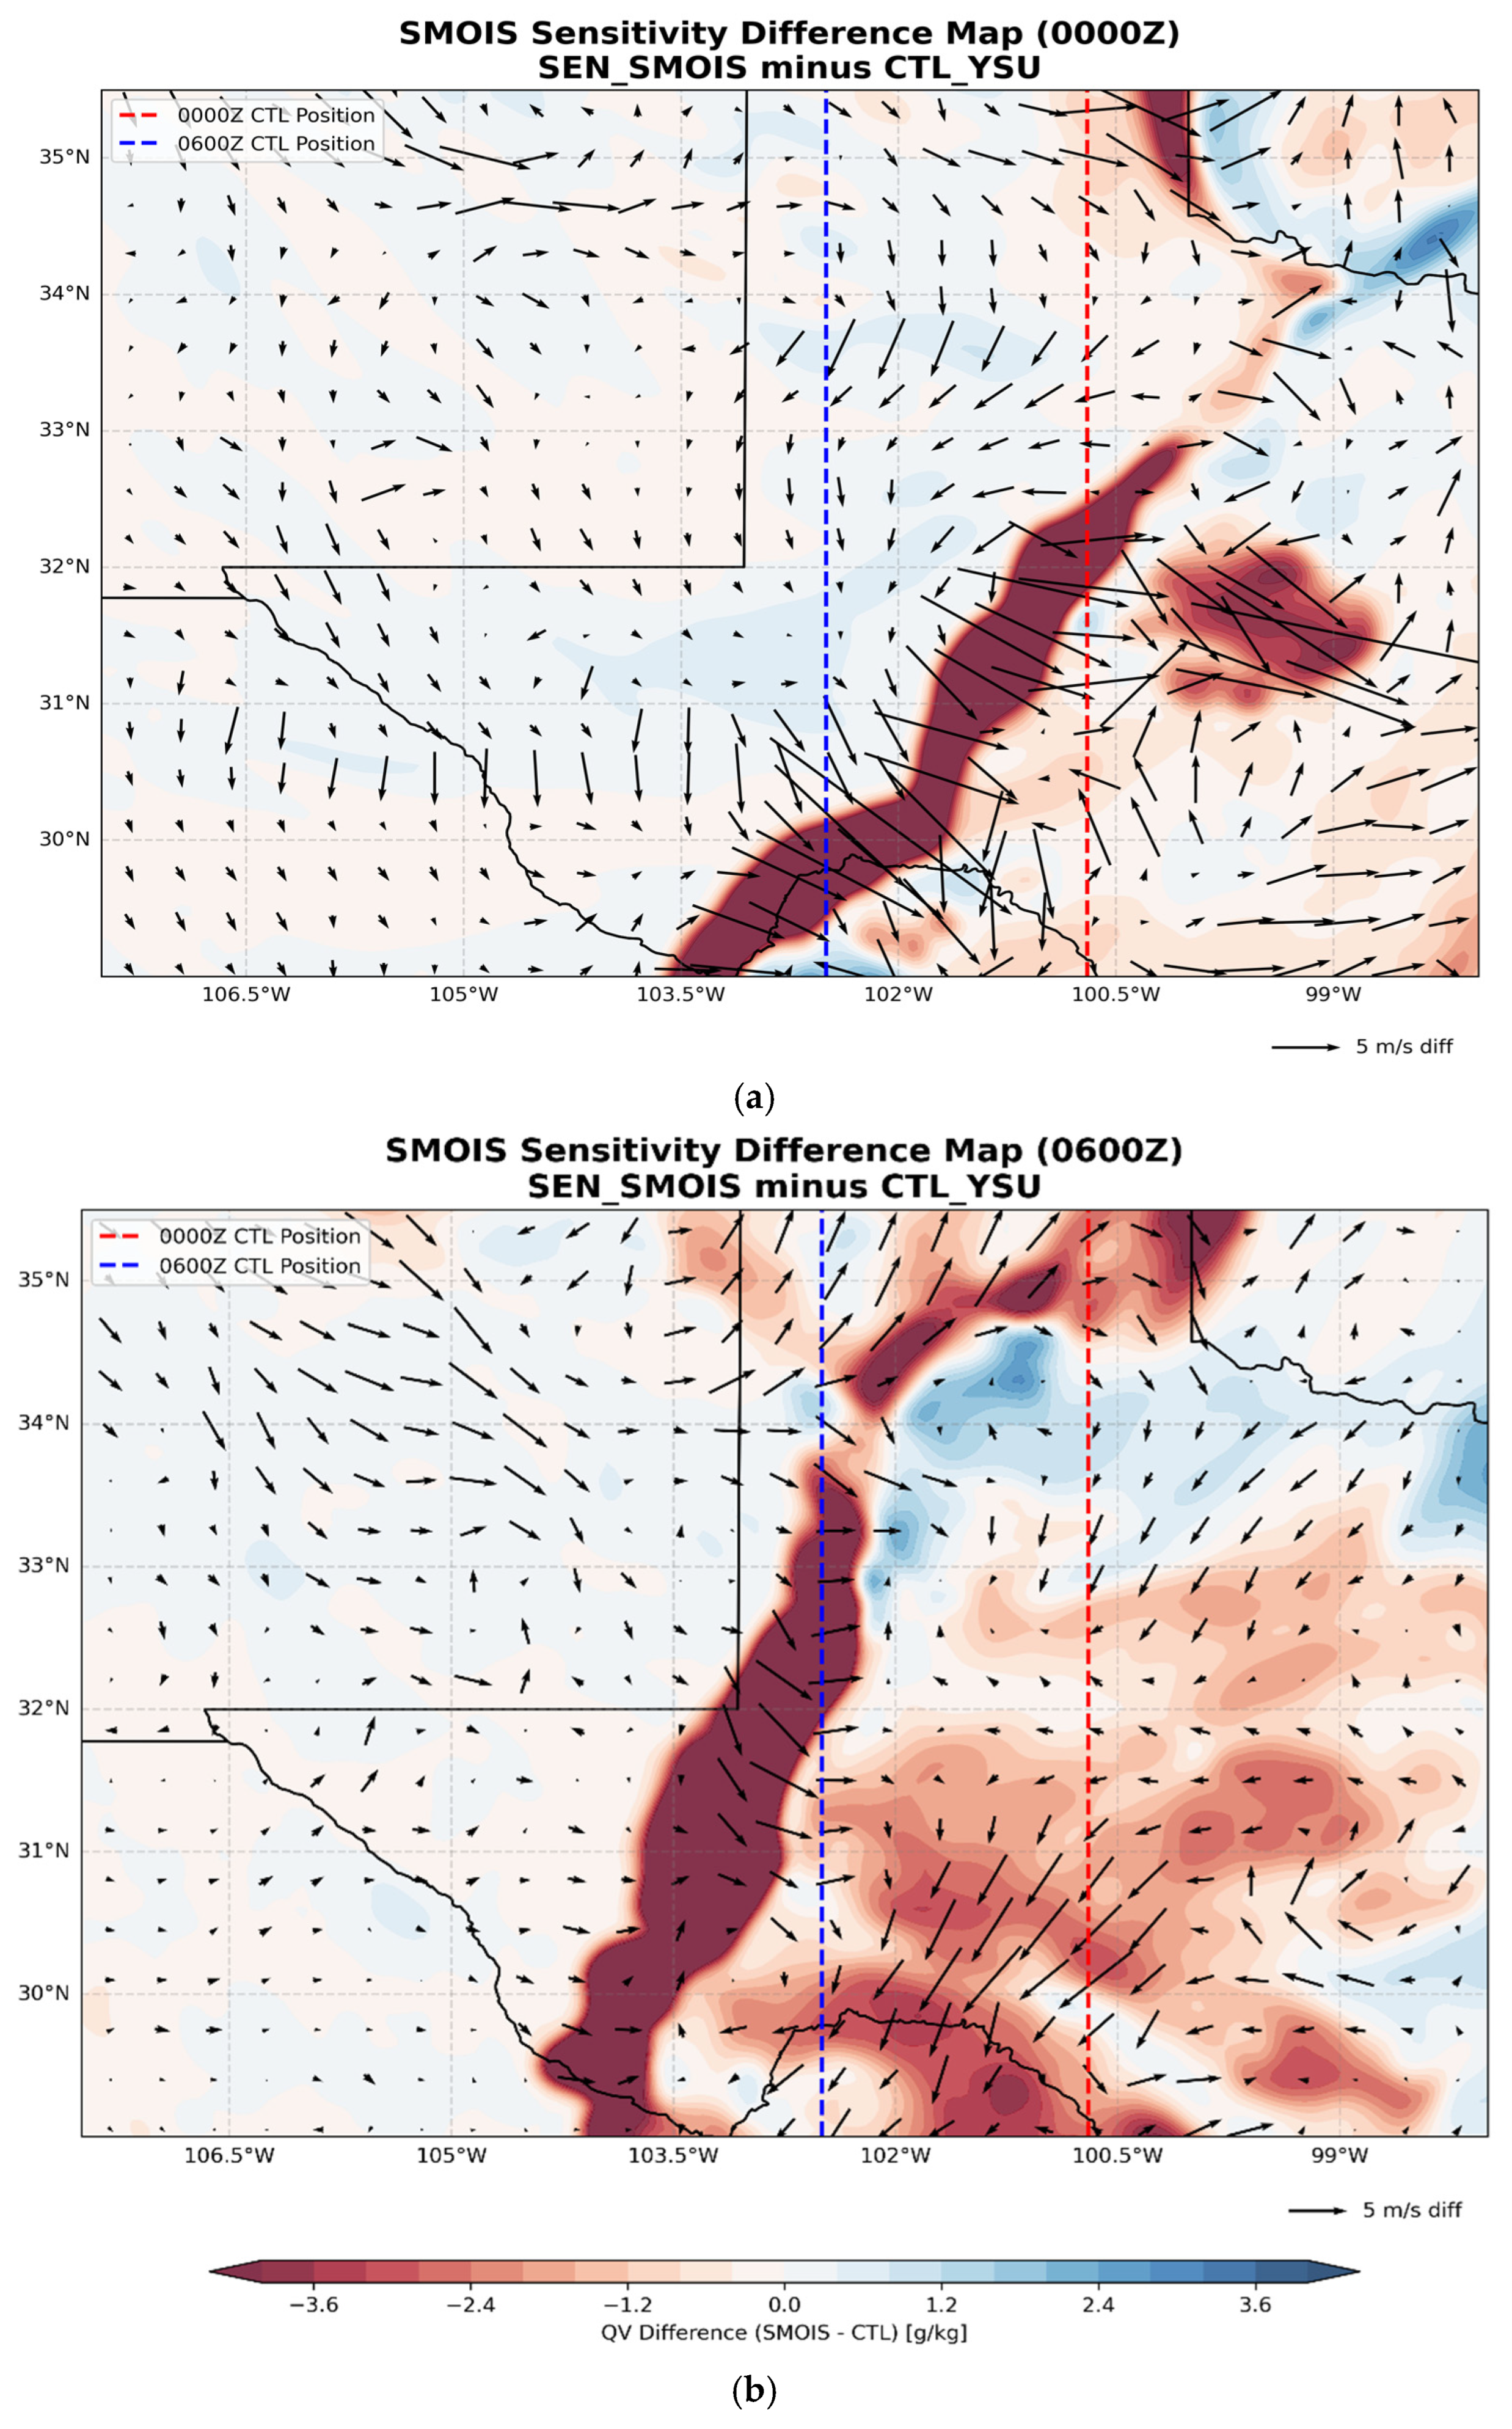
The second sensitivity experiment (SEN_SMOIS) evaluated the role of local surface moisture flux in maintaining the dryline structure. By reducing the initial volumetric soil moisture by 50% across the MROI, we isolate the contribution of evapotranspiration to the boundary’s thermodynamic intensity.
At 0000 UTC, the difference map (Figure 11a) reveals a widespread negative specific humidity anomaly exceeding −3.0 g/kg. This demonstrates that local soil moisture is a significant source of water vapor for the afternoon dryline. In the SEN_SMOIS case, the reduction in latent heat flux leads to a drier and warmer boundary layer.
Figure 11.
Horizontal difference maps of surface specific humidity (g/kg, shading) and 850 hPa wind vectors (m/s, arrows) between the soil moisture sensitivity experiment (SEN_SMOIS) and the control run (CTL_YSU) at (a) 0000 UTC 10 April and (b) 0600 UTC 10 April. Dash lines denote dryline positions at 0000 UTC and 0600 UTC along 32° N transects.
The effect of soil moisture remains evident during the nocturnal recovery phase at 0600 UTC (Figure 11b). While the dryline still demonstrates a westward retrograde motion toward the 102.5° W recovery point, the returning air mass exhibits a persistent moisture deficit of approximately 3.6 g/kg.
In MROI, the wind difference vectors at 0600 UTC are relatively weak compared to the terrain sensitivity experiment. This suggests that while topographic gradients provide the mechanical pump for the retreat, soil moisture primarily governs the thermodynamic depth and intensity of the moisture sector. These results indicate that a drier West Texas landscape—whether through drought or land-use change—would result in a weaker dryline with less convective potential, even if the structural lifecycle of surge and retreat remains intact. This highlights the importance of accurate soil initialization in predicting severe weather initiation along the dryline.
4.4.3. Surface Energy Partitioning and PBL Evolution
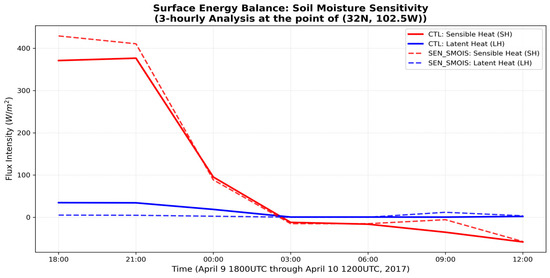
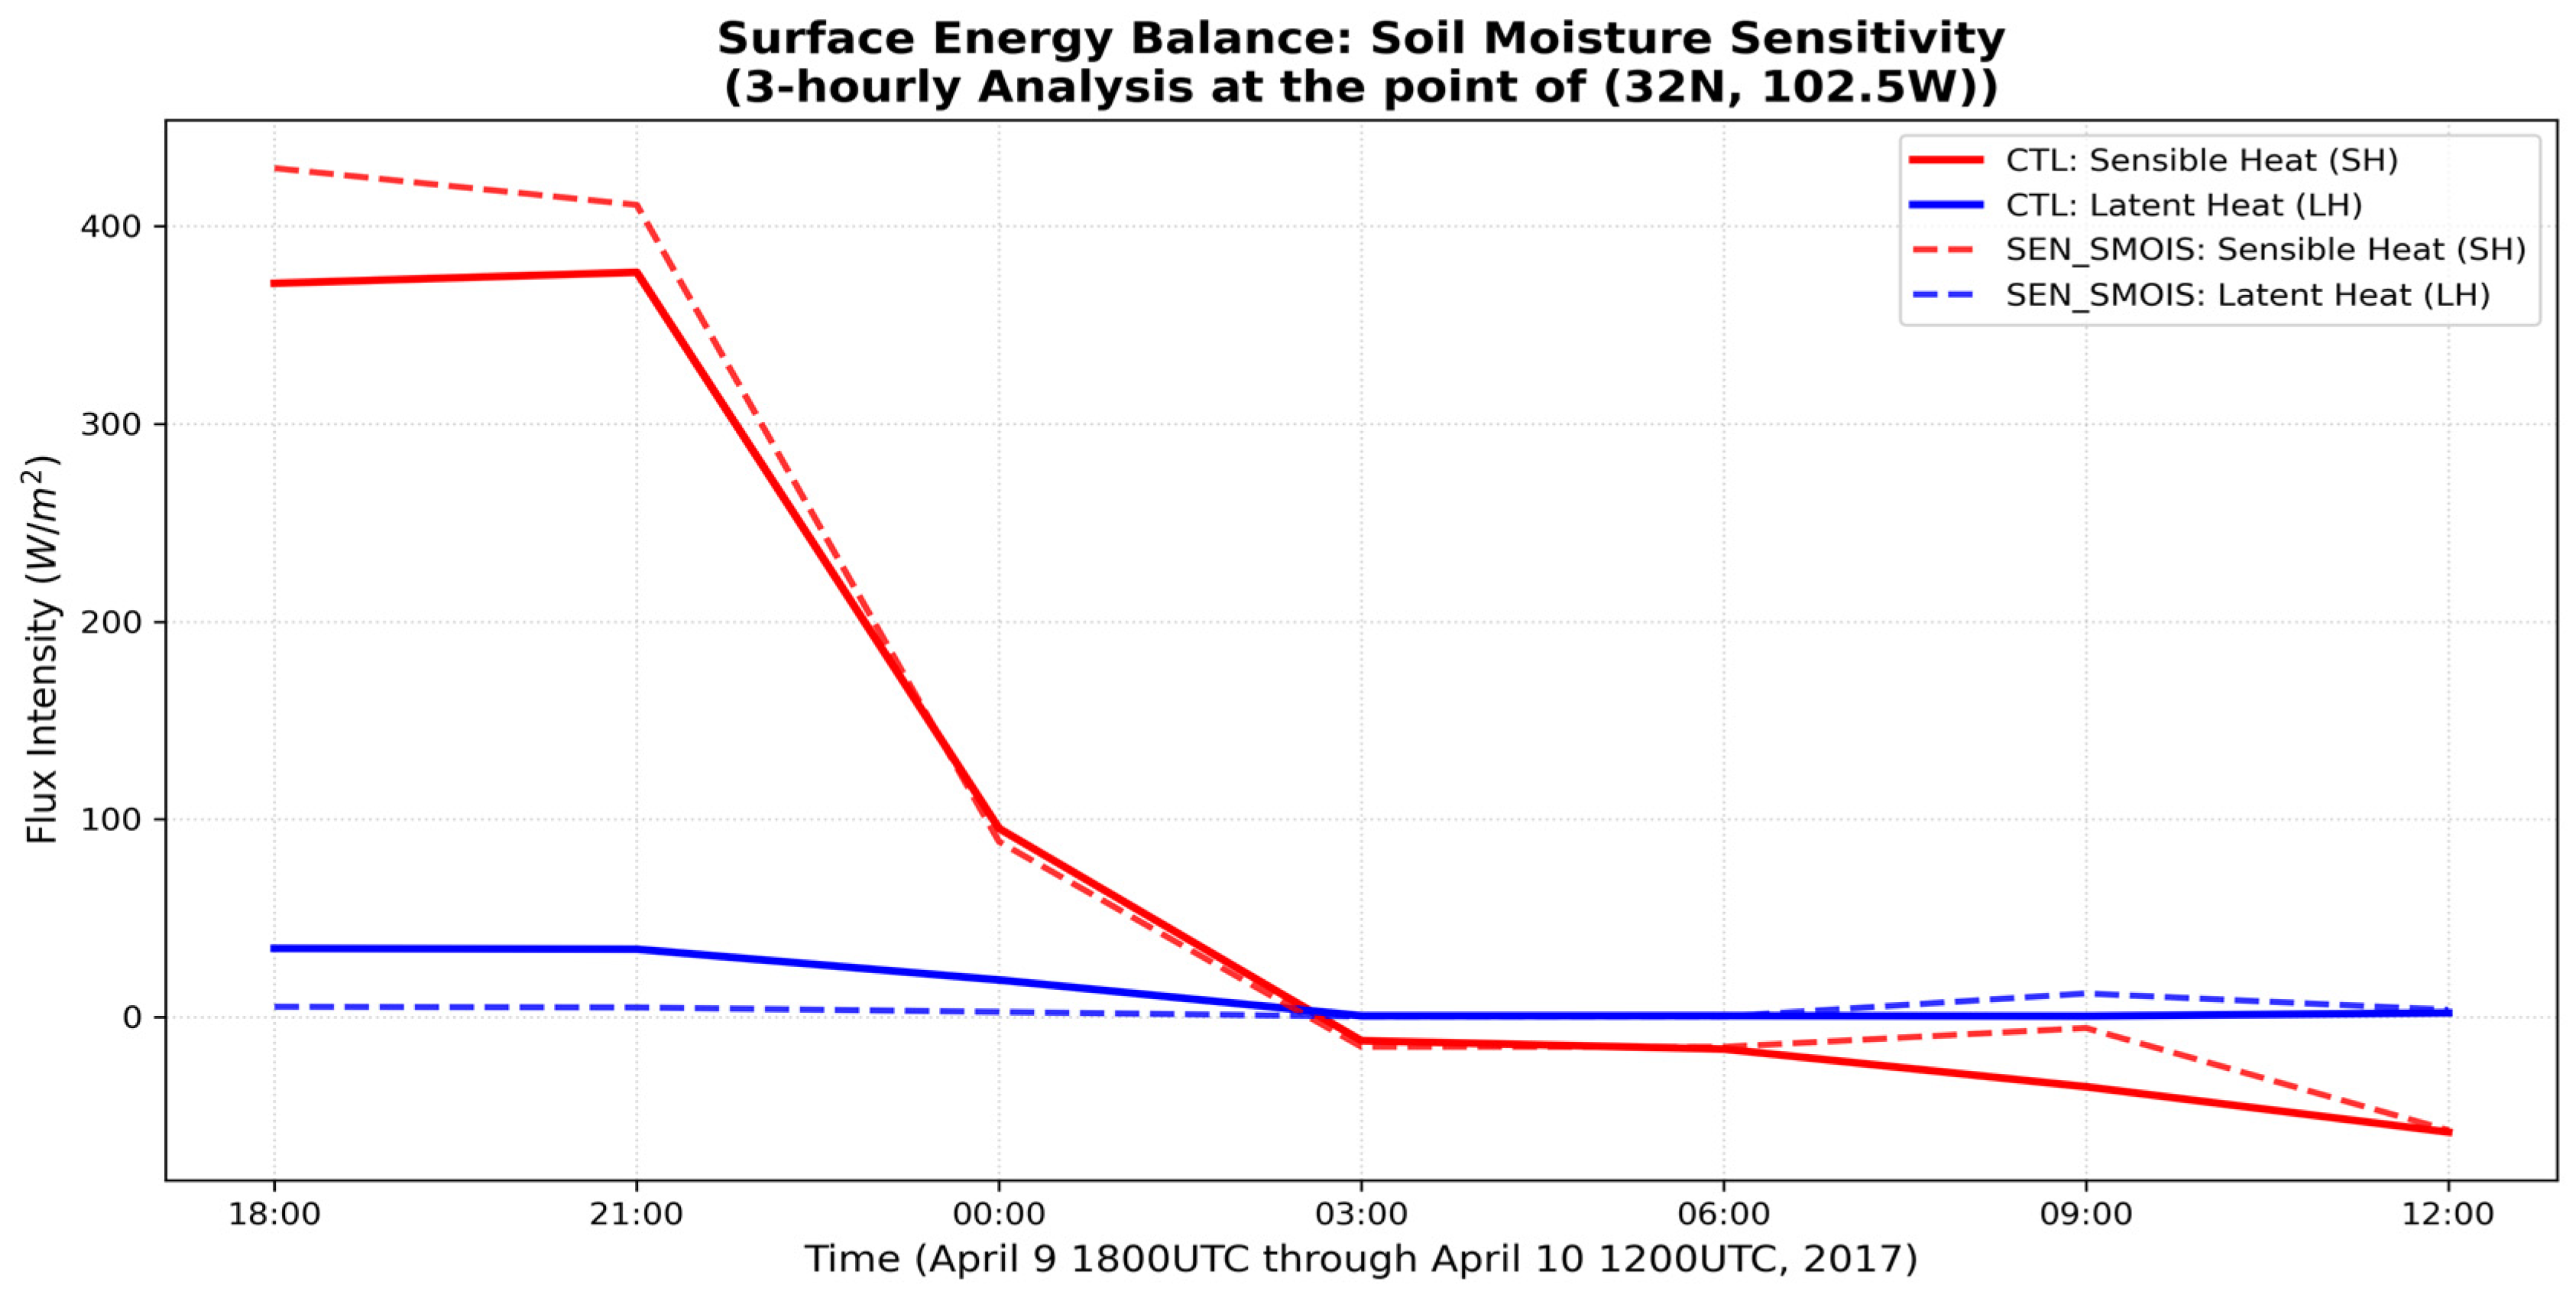
The thermodynamic degradation of the dryline in the SEN_SMOIS experiment is rooted in the fundamental shift in the surface energy balance. Figure 12 illustrates the 3-hourly evolution of sensible (SH) and latent heat (LH) fluxes at the point of (32° N, 102.5° W). It is noticed that LH is very small—peaking at about 25–50 W/s2 while SH towers over it as high as 450 W/s2. The fact that LH is so low in both runs proves that the environment is naturally semi-arid. There simply is not much water in the soil to evaporate. As shown in the surface energy evolution, the West Texas environment is characterized by an extremely high Bowen Ratio (about 18), featuring desert or semi-desert transition zones. This confirms that the sharp moisture gradient of the dryline is not maintained by local surface evaporation, but rather by the horizontal advection of Gulf moisture. However, the small LH values underscore the critical sensitivity of the dryline to soil moisture. In the sensitivity run, the reduction in even this minimal moisture buffer forces nearly all Net Radiation (RN) into SH. This ‘Energy Swap’ leads to a deeper, more turbulent PBL that vertically dilutes the advected moisture, effectively degrading the dryline intensity. Thus, soil moisture acts as a thermal regulator that preserves the dryline by limiting the vertical mixing of the moist sector.
Figure 12.
Surface Energy Flux Evolution. Time-series of 3-hourly sensible heat flux (SH; red, W/m2) and latent heat flux (LH; blue, W/m2) at the point of (32.0° N, 102.5° W). Solid lines represent the control run (CTL_YSU) and dashed lines indicate the 50% soil moisture reduction experiment (SEN_SMOIS).
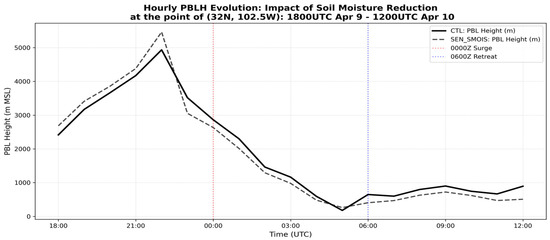
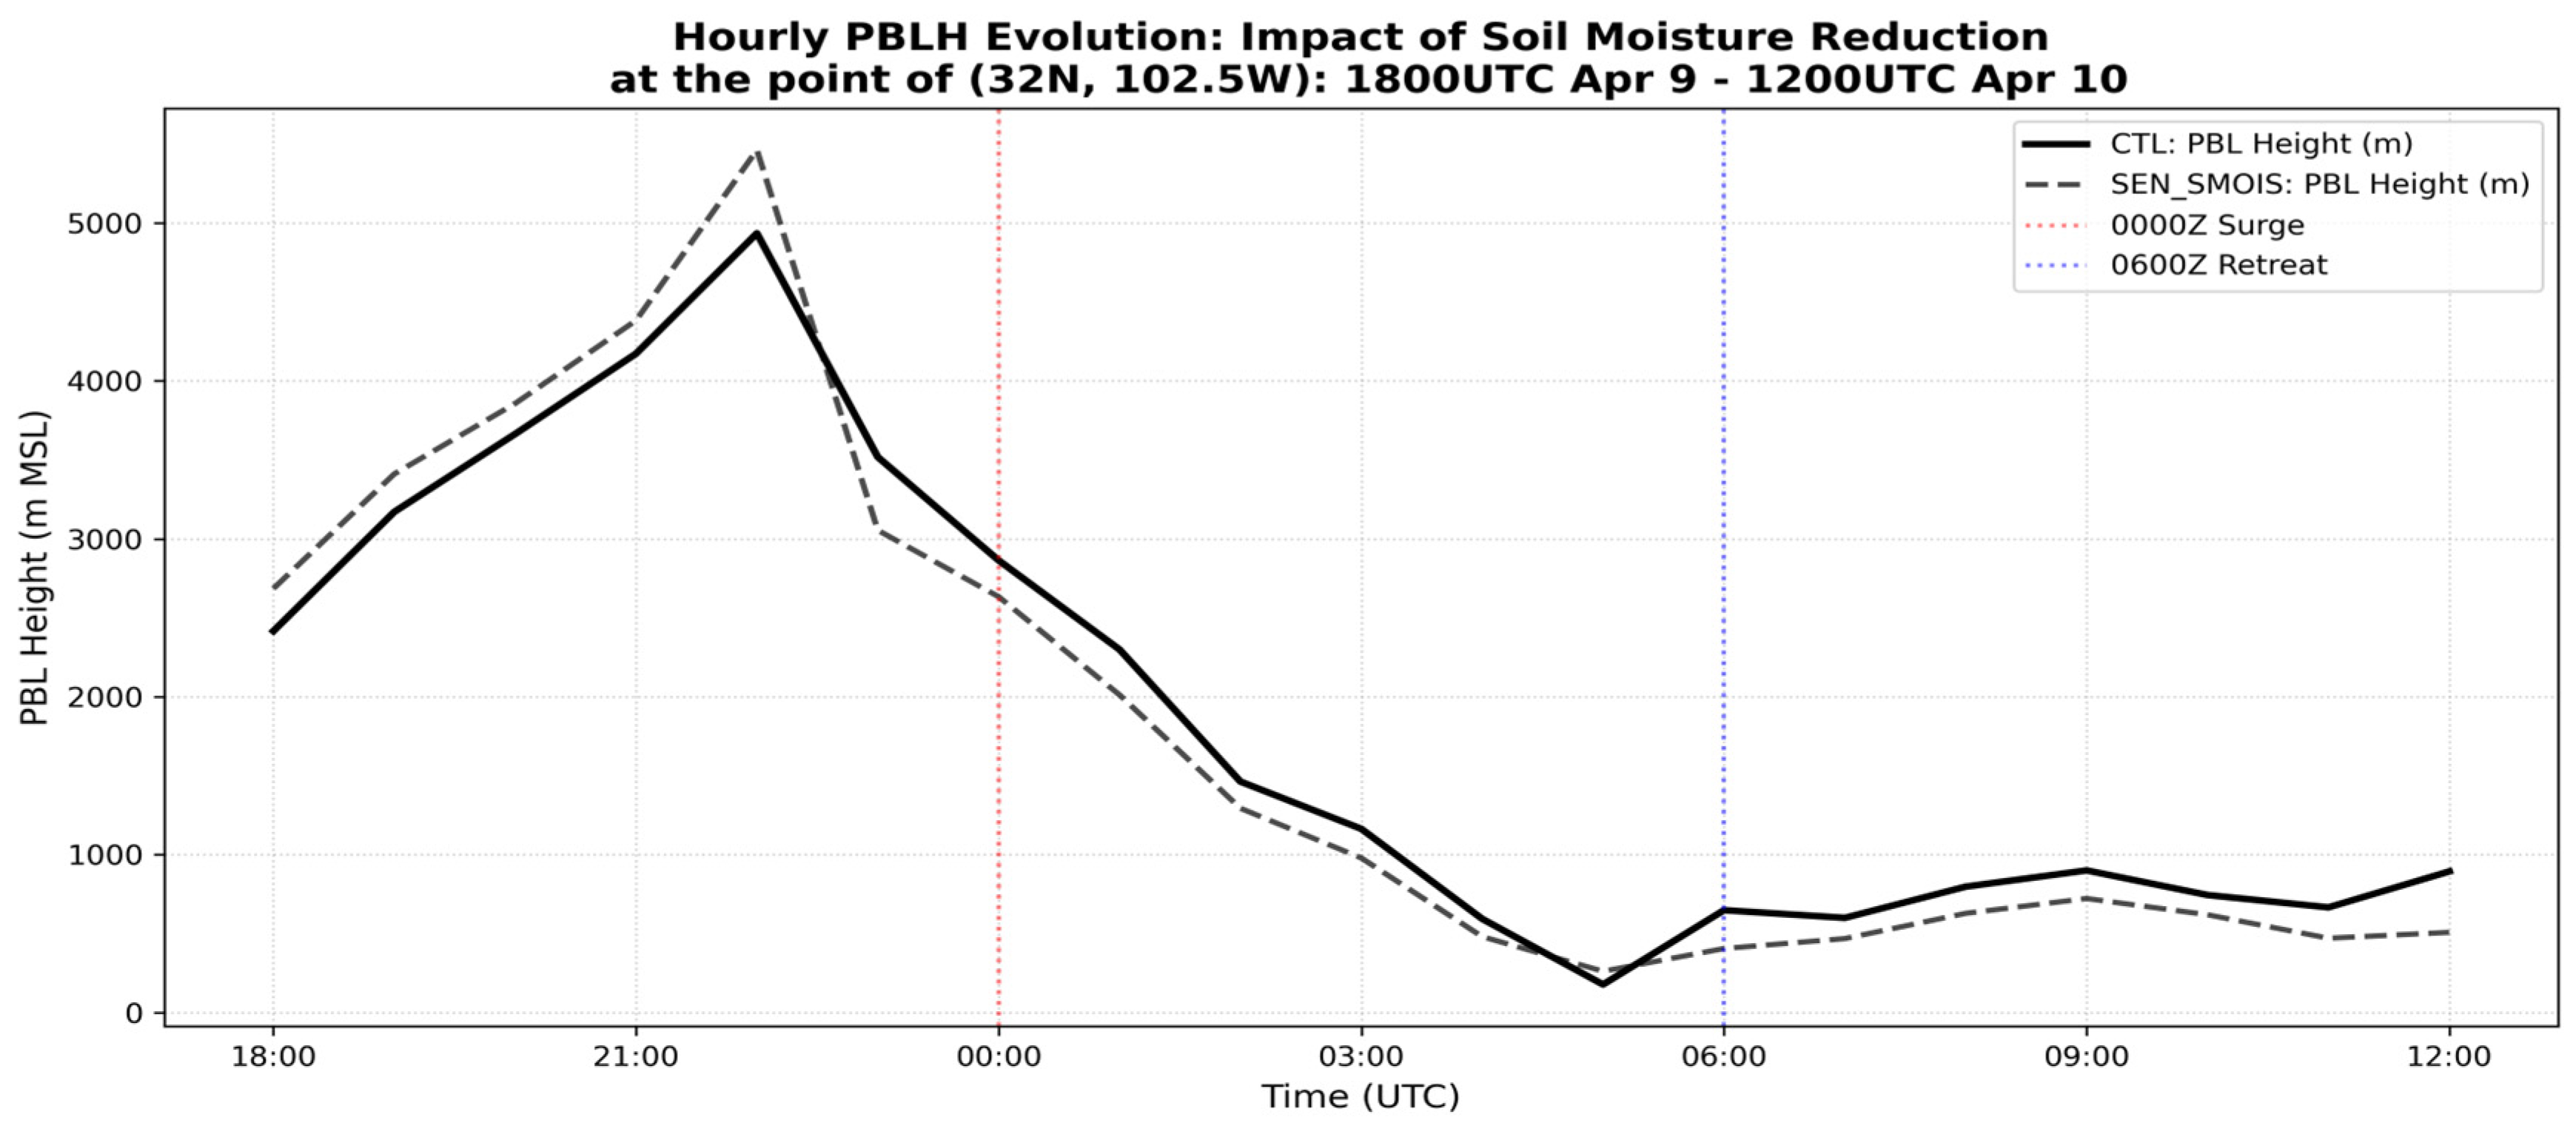
As shown in the hourly PBLH evolution (Figure 13), the increased thermal forcing in the SEN_SMOIS case drives a deeper convective mixing layer. The PBLH evolution confirms the ‘Energy Swap’ hypothesis with high precision. During the peak heating phase (2200 UTC), the SEN_SMOIS simulation produces a boundary layer depth of 5500 m AGL, significantly exceeding the 4900 m AGL observed in the CTL-YSU run. This extreme vertical growth in the drier scenario facilitates an aggressive dilution of the moist sector.
Figure 13.
Hourly evolution of the simulated PBLH (m) at the point of (32.0° N, 102.5° W) from 1800 UTC 9 April to 1200 UTC 10 April. The control run (solid black) is contrasted against the SEN_SMOIS experiment (dashed black). Vertical dotted lines denote the peak afternoon surge (0000 UTC) and the peak nocturnal retreat (0600 UTC).
Furthermore, the more rapid evening collapse of the SEN_SMOIS boundary layer (dropping to 2800 m at 0000 UTC compared to 3000 m in the CTL) is indicative of the low thermal inertia of dry soil. While the PBL height is lower in the SEN_SMOIS run during the 0000 UTC surge, the intense afternoon mixing has already vertically redistributed the moisture, resulting in the degraded near-surface humidity gradients and reduced surge velocity documented in the sensitivity experiment.
5. Conclusions and Summary
This study utilized a high-resolution MPAS configuration to investigate the diurnal lifecycle of the West Texas dryline. A critical prerequisite of this work was the successful validation of the control simulation against NWS Surface Analysis, which confirmed the model’s ability to resolve both the peak afternoon surge and the subsequent 170 km nocturnal retrograde. This study provides a multi-scale numerical investigation into the diurnal lifecycle of the West Texas dryline, specifically focusing on the physical mechanisms governing its significant nocturnal recovery. By employing a high-resolution MPAS configuration with the YSU non-local PBL scheme, we have successfully isolated the mechanical and thermodynamic forces that drive the behavior of this dryline.
Our sensitivity experiments identified the following distinct contributions that govern dryline mobility:
- The Topographic Pump (Mechanical Driver): The 170 km nocturnal retreat (0000 UTC to 0600 UTC) was identified as a primarily terrain-dependent process. By reducing regional elevation by 50%, the dryline’s westward velocity dropped significantly from its control speed of 28.3 km/h. This confirms that the sloping ramp of the Trans-Pecos and Permian Basin acts as a mechanical pump, where the re-establishment of the topographic pressure gradient following sunset is the primary force pulling the moisture boundary back toward the mountains. While the observed agreement between the simulated and analyzed sea-level pressure patterns strongly supports this topographic hypothesis, these interpretations must be contextualized within the limitations of the modeling framework. At a 3 km grid spacing, the simulation operates within the turbulence ‘grey zone’, introducing inherent uncertainties regarding scale-dependent entrainment closures and the precise partitioning of resolved versus parameterized turbulent eddies. These grey-zone representations dictate vertical momentum transport and PBL mixing rates, which can subsequently influence the exact magnitude of the simulated hydrostatic pressure gradients. Despite these parameterization uncertainties, the clear contrasts observed in our terrain reduction experiments successfully isolate the regional sloping topography as the dominant macroscale driver of dryline recovery.
- The Energy Swap (Thermodynamic Driver): Sensitivity experiments revealed that soil moisture acts as a critical thermal regulator for this dryline. A 50% reduction in initial soil moisture forced an ‘Energy Swap,’ where the near-total partitioning of net radiation into sensible heat drove the planetary boundary layer to an extreme peak of 5500 m AGL—a 600 m increase over the control simulation. This demonstrates that even minimal soil moisture is vital for suppressing excessive vertical growth and maintaining a manageable ‘mixing bucket’ for advected moisture.
- PBL Feedback: This study identifies ‘Vertical Dilution’ as the primary mechanism through which soil moisture deficits degrade dryline intensity. The exceptionally deep PBL in the sensitivity run (reaching 5.5 km) facilitated the vertical redistribution of advected Gulf moisture through a significantly larger atmospheric column. This process effectively lowered near-surface specific humidity and blunted the moisture gradient, confirming that dryline intensity is as much a function of vertical mixing depth as it is of horizontal moisture advection.
- Thermal Inertia and the Evening Collapse: The temporal evolution of the boundary layer further underscores the role of soil moisture in dryline maintenance. The rapid evening collapse of the PBL in the sensitivity run—dropping from its 5500 m peak to 2800 m by 0000 UTC—highlights the low thermal inertia of dry, desiccated soils. While the control run’s higher thermal capacity maintained a more resilient boundary layer (~3000 m) during the surge phase, the sensitivity run’s early ‘afternoon legacy’ of intense mixing had already irreversibly diluted the moisture sector, leading to a weaker surge.
While regional topography dictates the geographic extent and surge velocity of the dryline via hydrostatic pressure gradients, soil moisture governs the vertical structure and thermodynamic intensity. Our results suggest that a deep, moisture-depleted PBL acts as a buffer that prevents the formation of sharp moisture boundaries, highlighting the necessity of accurate land-surface initialization for forecasting high-impact dryline events.
It is important to acknowledge that the findings presented herein are based on the intensive analysis of a single representative case study from April 2017. While utilizing a single archetypal event allows for computationally demanding high-resolution (3 km) sensitivity tests and terrain-modification experiments to isolate specific physical drivers, it inherently limits the statistical generality of the specific pressure magnitudes and retreat velocities observed. Consequently, future research must build upon this mechanistic foundation by simulating a multi-season climatology of dryline events, which will allow for the statistical quantification of these topographic and boundary layer interactions across a diverse spectrum of background atmospheric forcings. Future work also should utilize sub-kilometer, multi-scale nesting to transition into true Large-Eddy Simulation (LES) mode. This will allow for the complete, explicit resolution of Horizontal Convective Roll (HCR) spectrums and entrainment behaviors without relying on 1D vertical mixing assumptions. Additionally, because dryline intensity and propagation are intrinsically tied to surface fluxes, the simulated boundary layer is highly sensitive to the initial conditions provided by reanalysis datasets (e.g., ERA5). As demonstrated by our soil moisture sensitivity experiments, uncertainties in initialization resolution and land-surface properties can significantly change PBL height and moisture recovery. Therefore, investigating the coupled sensitivity between PBL schemes (local vs. non-local), high-resolution land-surface models (LSMs), and varied initialization datasets is also a critical next step to evaluate how soil moisture and vegetation gradients modulate low-level convergence zones.
Author Contributions
Conceptualization: D.L. and L.D.W.; data collection and curation: D.L. and L.D.W.; formal analysis: D.L.; funding acquisition: L.D.W. and D.L.; methodology: D.L.; resources: D.L. and L.D.W.; supervision: D.L.; validation: D.L. and L.D.W.; visualization: D.L. and L.D.W.; writing—original draft: D.L.; writing—review and editing: D.L. and L.D.W. All authors have read and agreed to the published version of the manuscript.
Funding
This study was supported by the NOAA Educational Partnership Program, U.S. Dept. of Commerce (NA22SEC4810015, NA17AE1623).
Data Availability Statement
The Model for Prediction Across Scales (MPAS-Atmosphere) is an open-source atmospheric model available at https://github.com/MPAS-Dev/MPAS-Model (accessed on 15 December 2025). The ERA5 reanalysis data used for model initialization and boundary conditions were obtained from the Copernicus Climate Change Service (C3S) Climate Data Store (CDS). The specific MPAS configuration files, namelists, and processed history/diagnostic datasets generated during this study are available from the corresponding author upon reasonable request.
Acknowledgments
We would like to acknowledge high-performance computing support from a supercomputer Derecho (doi:10.5065/7q7p-m730) under project code of UJSU0002 provided by NCAR’s Computational and Information Systems Laboratory, sponsored by the National Science Foundation.
Conflicts of Interest
The authors declare no conflicts of interest. The funder had no role in the design of the study; in the collection, analyses, or interpretation of data; in the writing of the manuscript; or in the decision to publish the results.
References
- Hoch, J.; Markowski, P. A numerical study of the 24 May 2002 dryline. Mon. Weather Rev. 2005, 133, 2277–2296. [Google Scholar]
- Clark, A.J.; Gallus, W.A.; Chen, T.C. Comparison of the diurnal cycle of precipitation over the central United States between 12-km and 4-km WRF simulations. Mon. Weather Rev. 2007, 135, 3456–3473. [Google Scholar] [CrossRef]
- Ziegler, C.L.; Hane, M.E. An Observational Study of the Dryline. Mon. Weather Rev. 1993, 121, 1134–1151. [Google Scholar] [CrossRef]
- Parsons, D.B.; Shapiro, M.A.; Hardesty, R.M.; Zamora, R.J.; Intrieri, J.M. The fine-scale structure of a West Texas dryline. Mon. Weather Rev. 1991, 119, 1242–1258. [Google Scholar] [CrossRef]
- White, L.D.; Lu, D. Multi-Scale Transects of Three North American Drylines. Atmosphere 2020, 11, 854. [Google Scholar] [CrossRef]
- Ziegler, C.L.; Rasmussen, E.N. The Initiation of Moist Convection at the Dryline: Forecasting Issues from a Case Study Perspective. Weather Forecast. 1998, 13, 1106–1131. [Google Scholar] [CrossRef]
- Skamarock, W.C.; Klemp, J.B.; Duda, M.G.; Fowler, L.D.; Park, S.H.; Ringler, T.D. A multiscale nonhydrostatic atmospheric model using centroidal Voronoi tesselations and C-grid staggering. Mon. Weather Rev. 2012, 240, 3090–3105. [Google Scholar] [CrossRef]
- Ringler, T.D.; Petersen, M.; Higdon, R.L.; Jacobsen, D.; Jones, P.W.; Maltrud, M. A multi-resolution approach to global ocean modeling. Ocean Model. 2013, 69, 211–232. [Google Scholar] [CrossRef]
- Park, S.-H.; Klemp, J.B.; Skamarock, W.C. A comparison of mesh refinement in the global MPAS-A and WRF models using an idealized normal-mode baroclinic wave simulation. Mon. Weather Rev. 2014, 142, 3614–3634. [Google Scholar] [CrossRef]
- Cheng, Y.; Hui, P.; Liu, D.; Fang, F.; Wang, S.; Tang, J. MPAS-A variable-resolution simulations for summer monsoon over China: Comparison between global and regional configuration. J. Geophys. Res. Atmos. 2023, 128, e2022JD037541. [Google Scholar] [CrossRef]
- Kramer, M.; Heinzeller, D.; Hartmann, H.; van den Berg, W.; Steeneveld, G.J. Assessment of MPAS variable resolution simulations in the grey-zone of convection against WRF model results and observations: An MPAS feasibility study of three extreme weather events in Europe. Clim. Dyn. 2020, 55, 253–276. [Google Scholar] [CrossRef]
- Skamarock, W.C.; Klemp, J.B.; Dudhia, J. Prototypes for the WRF (Weather Research and Forecasting) model. In Proceedings of the Ninth Conference on Meso-Scale Processes, Fort Lauderdale, FL, USA, 30 July–2 August 2001; pp. J11–J15. [Google Scholar]
- Hong, S.; Noh, Y.Y.; Dudhia, J. A new vertical diffusion package with an explicit treatment of entrainment processes. Mon. Weather Rev. 2006, 134, 2318–2341. [Google Scholar] [CrossRef]
- Chen, F.; Dudhia, J. Coupling an advanced land surface–hydrology model with the Penn State–NCAR MM5 modeling system. Part I: Model implementation and sensitivity simulations. Mon. Weather Rev. 2001, 129, 569–585. [Google Scholar] [CrossRef]
- Hersbach, H.; Bell, B.; Berrisford, P.; Hirahara, S.; Horányi, A.; Muñoz-Sabater, J.; Nicolas, J.; Peubey, C.; Radu, R.; Schepers, D.; et al. The ERA5 global reanalysis. Q. J. R. Meteorol. Soc. 2020, 146, 1999–2049. [Google Scholar] [CrossRef]
- Olson, J.B.; Kenyon, J.S.; Angevine, W.M.; Brown, J.M.; Pagowski, M.; Sušelj, K. A description of the MYNN EDMF scheme and the low-level cloud simulation reliability. NOAA Tech. Memo. OAR GSL 2019, 61. [Google Scholar]
- Jiménez, P.A.; Dudhia, J.; González-Rouco, J.F.; Navarro, J.; Montávez, J.P.; García-Bustamante, E. A revised similarity theory scheme in the WRF model: Formulation and evaluation. Mon. Weather Rev. 2012, 140, 898–918. [Google Scholar] [CrossRef]
- Iacono, M.J.; Delamere, J.S.; Mlawer, E.J.; Shephard, M.W.; Clough, S.A.; Collins, W.D. Radiative forcing by long-lived greenhouse gases: Calculations with the AER optimal continuum model. J. Geophys. Res. Atmos. 2008, 113, D13103. [Google Scholar] [CrossRef]
- Hong, S.Y.; Lim, J.J. The WRF single-moment 6-class microphysics scheme (WSM6). J. Korean Meteorol. Soc. 2006, 42, 129–151. [Google Scholar]
- Shin, H.H.; Hong, S.Y.; Dudhia, J.; Kim, Y.J. Orography-Induced Gravity Wave Drag Parameterization in the Global WRF: Implementation and Sensitivity to Shortwave Radiation Schemes. Adv. Meteorol. 2010, 2010, 959014. [Google Scholar] [CrossRef]
- Squitieri, J.; Gallus, W.A., Jr. WRF forecasts of Great Plains nocturnal low-level jet-driven MCSs. Part I: Correlation between low-level jet forecast accuracy and MCS precipitation forecast skill. Weather Forecast. 2016, 31, 1301–1323. [Google Scholar] [CrossRef]
- Berg, A.; Eltahir, E.A.B.; Findell, K.L.; Malyshev, S. Impact of Soil Moisture–Atmosphere Interactions on Surface Temperature Distribution. J. Clim. 2014, 27, 7976–7993. [Google Scholar] [CrossRef]
- Nocelo López, R.; Santalladel Rio, V.; Sánchez-Rama, B. Refractivity Observations from Radar Phase Measurements: The 22 May 2002 Dryline Case during IHOP Project. Atmosphere 2024, 15, 33. [Google Scholar] [CrossRef]

Disclaimer/Publisher’s Note: The statements, opinions and data contained in all publications are solely those of the individual author(s) and contributor(s) and not of MDPI and/or the editor(s). MDPI and/or the editor(s) disclaim responsibility for any injury to people or property resulting from any ideas, methods, instructions or products referred to in the content. |
© 2026 by the authors. Licensee MDPI, Basel, Switzerland. This article is an open access article distributed under the terms and conditions of the Creative Commons Attribution (CC BY) license.