


Abstract
Transboundary fine particulate matter (PM2.5) in Southeast Asia is commonly assessed using static source–receptor frameworks or descriptive associations that may not resolve how directional dependence changes through time under shifting meteorological conditions. This study examines regional PM2.5 as a time-varying, meteorology-adjusted directional coupling system using monthly data for 2003–2024 from the Copernicus Atmosphere Monitoring Service (CAMS) reanalysis, European Centre for Medium-Range Weather Forecasts Reanalysis v5 (ERA5) meteorological covariates, climate controls, and administrative aggregation. Using a rolling-window directed network framework based on Peter and Clark Momentary Conditional Independence (PCMCI) causal discovery, we inferred lagged conditional-dependence networks from covariate-adjusted PM2.5 anomalies and summarized their structure at national and first-order administrative levels. The inferred network structure varies over time but retains measurable continuity across rolling windows. At the country level, cross-border links consistently account for a large share of the directed structure, indicating that PM2.5 variability within the study domain is strongly shaped by transboundary coupling rather than by country-contained dynamics alone. A recurrent backbone of country-level directional coupling corridors emerges, including persistent links among China, Indonesia, Myanmar, and Thailand. At the first administrative level, stable gateways and receptor basins become more evident, especially the bidirectional coupling corridor between Yunnan Province, China, and Shan State, Myanmar, which appears throughout the full window sequence. These results show that subnational structure can reveal transport-relevant coupling patterns that national summaries may conceal. The framework provides an interpretable basis for corridor-oriented monitoring and regime-aware early warning, while the inferred links should be interpreted as directional statistical dependence rather than direct emissions attribution or resolved physical transport pathways.
1. Introduction
Southeast Asia continues to experience severe air-quality degradation driven by a combination of domestic emissions and recurrent transboundary air pollution. Fine particulate matter (PM2.5) is a major regional health risk, with substantial mortality, morbidity, and economic consequences across the region [1,2,3]. Long-term assessments have shown that PM2.5 concentrations have increased across much of South and Southeast Asia in recent decades, with many areas exceeding health-based guidelines [4,5]. Seasonal biomass burning, including peatland and vegetation fires, is a major contributor to these episodes because emitted aerosols can be transported over long distances under prevailing monsoon circulation [6,7,8]. Regional climate variability, including El Niño-related dryness, can further intensify fire activity and haze severity by favoring conditions that enhance emissions and atmospheric persistence [6,8].
Despite the transboundary nature of the problem, much of the existing evidence remains grounded in static source–receptor frameworks, backward trajectories, source-apportionment exercises, or correlation-based associations [1,9,10]. These approaches are valuable for identifying plausible transport pathways and source contributions, but they may be insufficient for distinguishing directional interdependence from coincident pollution behavior under complex and changing meteorological conditions. In Southeast Asia, this limitation is especially important because pollutant accumulation and dispersion are strongly modulated by evolving boundary-layer structure, wind fields, humidity, rainfall, and seasonal circulation regimes [10,11,12]. As a result, correlation alone may be insufficient in complex meteorological settings, particularly when shared atmospheric forcing or simultaneous regional pollution build-up produces similar PM2.5 variability across distant locations.
Recent advances in air-quality research increasingly use machine learning, graph-based modeling, regional numerical simulations, and causal-discovery approaches to analyze spatial and temporal interactions in atmospheric pollution systems [13,14,15,16]. These methods can help move beyond static or purely descriptive assessments by representing air-pollution variability as an interconnected system. However, many existing applications remain focused on forecasting accuracy, single-city prediction, short-term episodes, or event-based source investigation [13,14,16]. Fewer studies have used a long-term, region-wide, meteorology-adjusted network framework to examine how directional PM2.5 coupling changes across time while preserving interpretable links to national and subnational administrative geography.
A further limitation is that many regional studies remain episodic, single-year, or event-specific, which constrains their ability to characterize interannual variability and long-term structural continuity in transboundary PM2.5 behavior [1,7]. This matters because Southeast Asian air pollution is inherently non-stationary: transport-relevant coupling, source intensity, and receptor roles can shift across monsoon transitions, drought conditions, and major fire years. Static summaries therefore risk obscuring both persistent regional backbones and temporally changing influence patterns. Methods from time-series causal discovery offer a useful alternative because they are designed to identify lagged conditional dependencies while reducing spurious associations arising from observed confounders [17,18]. When combined with rolling-window analysis, such methods can help track how directional coupling changes through time while also revealing whether some cross-border relationships recur consistently.
This study addresses these gaps by examining PM2.5 in Southeast Asia as a dynamic, meteorology-adjusted directional coupling system over 2003–2024. Using monthly gridded PM2.5 and meteorological covariates, we evaluate how cross-border lagged conditional dependencies evolve across rolling windows and whether recurrent coupling corridors remain visible despite temporal variability. Because the analysis uses monthly data over a 22-year period, the results are intended to characterize long-term structural continuity and climatological-scale influence patterns rather than individual short-lived haze episodes. We focus on two spatial interpretation levels: national-scale coupling patterns and first-order administrative pathways that may be masked by country-level aggregation.
The novelty of this study lies in three aspects. First, it treats Southeast Asian PM2.5 as a time-varying directed-dependence network rather than a static source–receptor system. Second, it adjusts PM2.5 anomalies for meteorological and climate covariates before network inference, thereby reducing the influence of shared atmospheric forcing on inferred PM2.5-PM2.5 links. Third, it links node-level causal-discovery outputs to both national and subnational administrative corridors over a 22-year period. The aims are to identify persistent cross-border PM2.5 coupling corridors, assess the extent to which the inferred network structure changes through time, and determine whether subnational gateways and receptor basins provide added insight beyond national summaries. By reframing the problem in terms of dynamic regional coupling, this study seeks to provide an interpretable evidence layer for transboundary monitoring and regime-aware early-warning applications while maintaining clear boundaries between inferred directional dependence, physical transport mechanisms, and formal emissions-based source attribution.
2. Materials and Methods
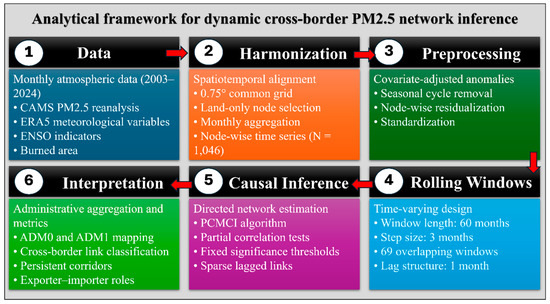
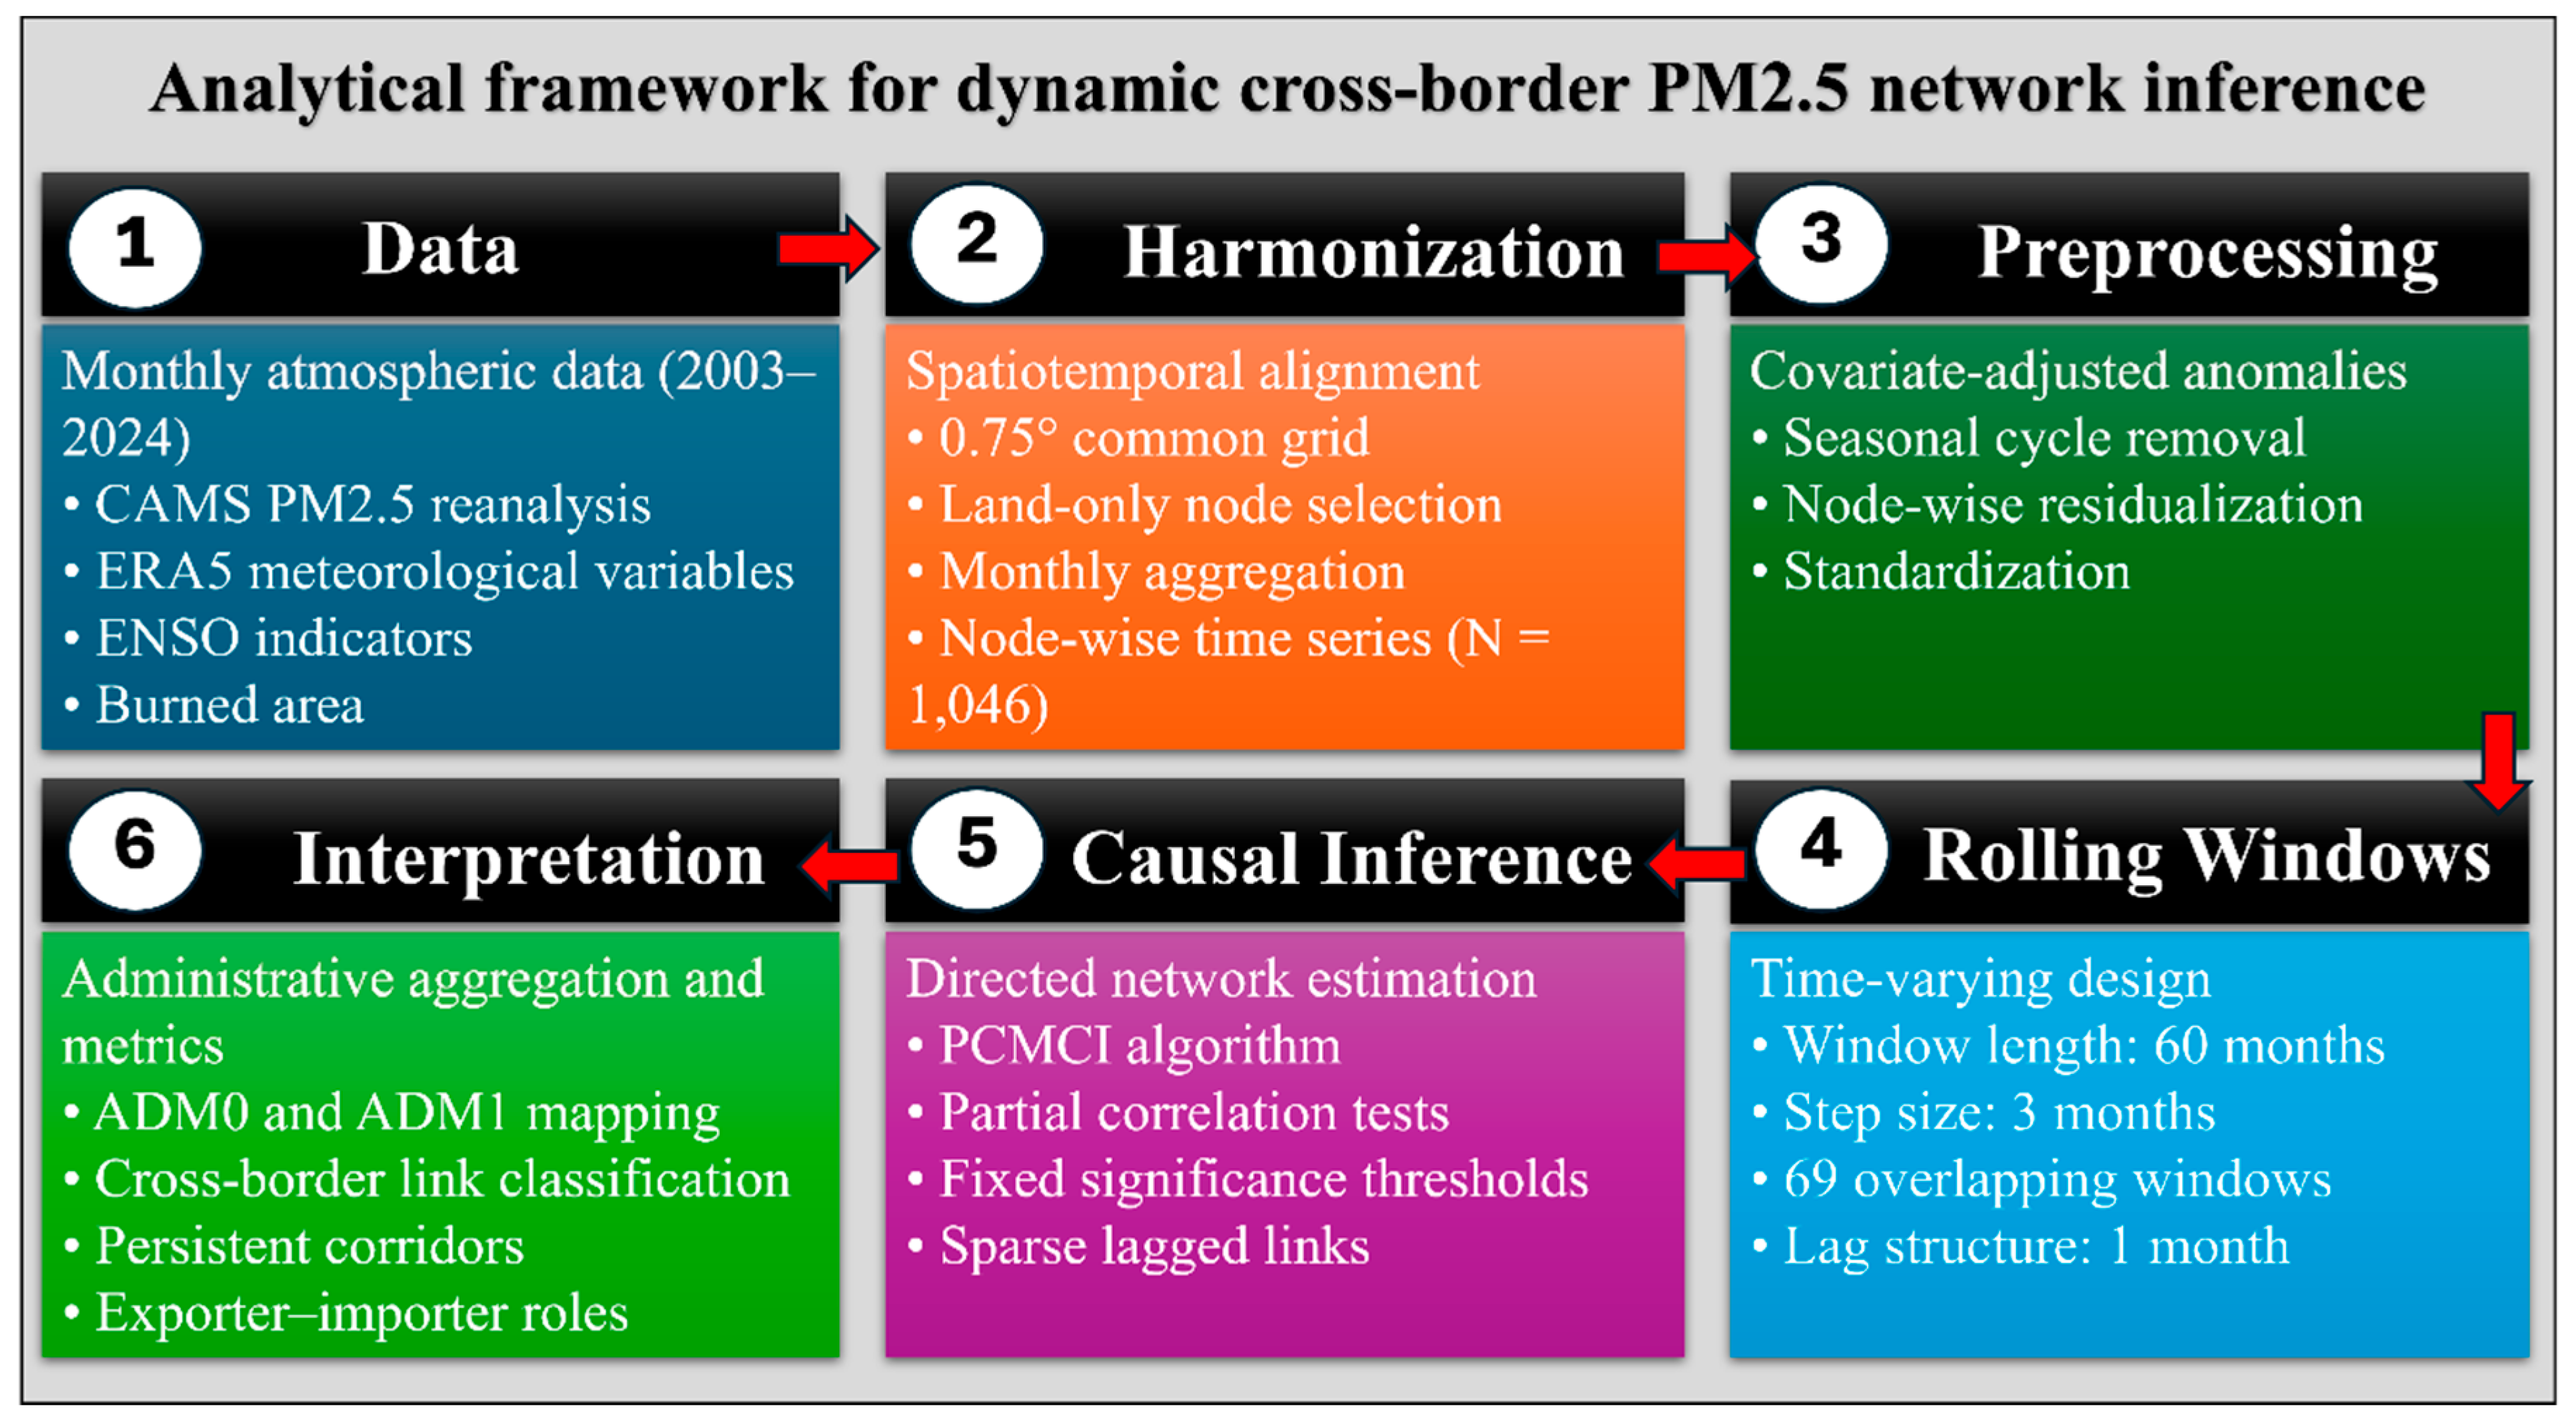
Figure 1 summarizes the overall workflow, from data acquisition and harmonization to covariate adjustment, rolling-window network inference, and administrative aggregation.
Figure 1.
Schematic overview of the analytical workflow used to infer dynamic, meteorology-adjusted cross-border PM2.5 directional coupling networks from 2003 to 2024. Meteorological, climate, and burned-area variables are used as adjustment covariates before PM2.5 network inference. Directed lagged conditional dependencies are estimated within rolling windows and aggregated to administrative levels to identify persistent coupling corridors and scale-dependent exporter–importer roles.
2.1. Study Domain and Datasets
The analysis was conducted in a fixed Southeast Asia domain (90–135° E, 15° S–30° N) for January 2003 to December 2024. All variables were harmonized to a common 0.75° × 0.75° grid and restricted to land cells using an ERA5 land–sea mask, yielding 1046 analysis nodes. Monthly PM2.5 was obtained from the Copernicus Atmosphere Monitoring Service (CAMS) global reanalysis [19]. Meteorological control variables were derived from ERA5 single-level reanalysis and included 10 m u- and v-wind components, 2 m temperature, 2 m dewpoint temperature, surface pressure, boundary-layer height, and total precipitation [20,21]. To account for broad-scale climate variability, monthly Oceanic Niño Index (ONI) and Niño3.4 anomaly series were also included as non-spatial controls [22]. Administrative aggregation was based on geoBoundaries polygons at ADM0 and ADM1 levels [23], and centroids used for corridor schematics were obtained from Goldie [24]. A monthly burned-area control field was also included in the covariate set to reduce the risk that broad biomass-burning variability would be absorbed directly into PM2.5-PM2.5 network links.
2.2. Preprocessing and Node-Wise Time-Series Construction
All datasets were spatially subset to the common study domain, aggregated to monthly resolution, regridded to the common analysis grid, and masked to land cells. For each node, a multivariate monthly time series was assembled comprising PM2.5 and the control variables. To reduce spurious dependence induced by shared annual cycles, each node-wise series was converted to monthly anomalies by removing the node-specific seasonal climatology. The anomaly series were then standardized to improve comparability across variables and locations.
Within each rolling window, PM2.5 at each node was residualized against the contemporaneous control variables. The meteorological, climate, and burned-area variables were therefore not treated as target nodes in the final PM2.5 network. Instead, they were used as adjustment covariates to reduce contemporaneous variability associated with shared atmospheric forcing, broad climate-state variability, and fire-related background conditions. The residual PM2.5 anomaly at each node represents the component of monthly PM2.5 variability not directly explained by the local covariate set within the same rolling window. These covariate-adjusted PM2.5 anomalies were then used as the input for network inference.
This adjustment step was intended to reduce apparent inter-node coupling driven mainly by common meteorological forcing or broad regional background variability. It does not remove all possible confounding, and the resulting links should therefore be interpreted as lagged conditional dependence among adjusted PM2.5 anomalies rather than as direct physical transport pathways or emissions-based source attribution.
2.3. Rolling-Window Directional-Dependence Network Inference
Time-varying directed networks were estimated using overlapping rolling windows to accommodate non-stationarity in regional PM2.5 dynamics. Each window covered 60 consecutive months and advanced by 3 months, yielding 69 windows over 2003–2024. Within each window, directed lagged dependencies among node-level residual PM2.5 anomalies were inferred using the Tigramite implementation of PCMCI with partial-correlation-based conditional-independence tests [17].
The production configuration used a maximum lag of 1 month, a PC-stage significance threshold of 0.02, and a final link significance threshold of 0.01. This configuration was selected through a limited pilot calibration stage that compared candidate settings for window length, maximum lag, and significance thresholds. The final configuration was chosen to balance sparsity, temporal stability, interpretability, and computational feasibility, while avoiding networks that were either trivially dense or overly sparse. The pilot screening was used to define a stable baseline configuration rather than to conduct a full sensitivity experiment.
For each retained link, the analysis stored the source node, target node, lag, partial-correlation strength, p-value, and sign. Networks were saved as sparse edge lists for efficient downstream analysis. In the interpretation of these networks, a directed link from node A to node B indicates that adjusted PM2.5 variability at A statistically precedes and helps explain adjusted PM2.5 variability at B under the PCMCI conditional-independence framework. Such links are referred to here as directional coupling or lagged conditional dependence, not as direct proof of physical pollutant transport.
2.4. Network Summaries and Administrative Aggregation
For each rolling window, we summarized overall network size and approximate density and quantified persistence between adjacent windows using Jaccard overlap of edge sets. Nodes were spatially assigned to ADM0 and ADM1 polygons, allowing each retained link to be classified as within-unit or between-unit at both administrative levels. Between-country links were interpreted as cross-border directional couplings within the study domain.
Window-level edge lists were then aggregated into directed unit-to-unit flow tables. For each origin–destination pair, we summarized link counts, absolute strength, signed strength, and sign-stratified strength. Exporter and importer indices were computed from absolute outgoing and incoming cross-border dependence strength, respectively. In this study, “exporter” refers to an administrative unit with strong outgoing lagged statistical dependence toward other units, while “importer” refers to an administrative unit with strong incoming lagged dependence from other units. These terms are network descriptors and do not imply emissions responsibility or formal source attribution.
Signed net balance was used as a supplementary directional summary. Because the sign of a PCMCI partial-correlation link is estimated in a covariate-adjusted residual space, it was interpreted cautiously as the direction of residual association rather than as a direct physical enhancement or suppression effect. To reduce distortion from unequal spatial representation, normalized metrics were also calculated where appropriate for cross-country and cross-unit comparisons.
2.5. Corridor Persistence and Supporting Diagnostics
Persistent coupling corridors were identified by tracking whether a directed unit-to-unit linkage recurred across rolling windows and by summarizing its median absolute strength over time. This allowed country-level and ADM1 pathways to be ranked by both persistence and magnitude. A persistent corridor therefore indicates repeated lagged conditional dependence between two administrative units across the rolling-window sequence. It should not be interpreted as a continuously active air-mass trajectory throughout the full study period.
This distinction is especially important for geographically distant unit pairs, for which persistent bidirectional coupling may reflect recurrent climatological-scale co-variability, large-scale atmospheric-regime dependence, or indirect regional synchronization. For geographically adjacent unit pairs, persistent coupling may be more transport-relevant, but still requires external evidence such as trajectory analysis, chemical transport modeling, fire activity products, or ground-monitoring records for physical attribution. Additional preprocessing diagnostics, pilot calibration details, coverage summaries, and supplementary quality-control outputs are reported in Appendix A.
3. Results
All results are reported for the fixed land-only study domain (90–135° E, 15° S–30° N; 1046 nodes) over January 2003 to December 2024. The final analysis produced 69 rolling-window networks based on 60-month windows advanced by 3 months. Networks were inferred from covariate-adjusted PM2.5 anomalies and are interpreted as lagged conditional-dependence networks rather than direct physical transport fields. Data completeness, representative distributional diagnostics, and normalization-related coverage summaries are provided in Appendix A, Appendix B and Appendix C.
3.1. Time-Varying but Continuous Network Structure
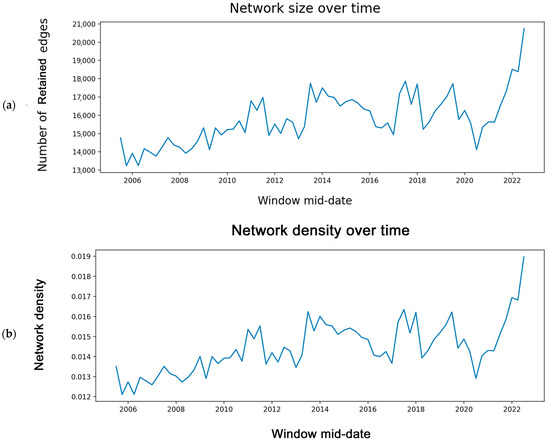
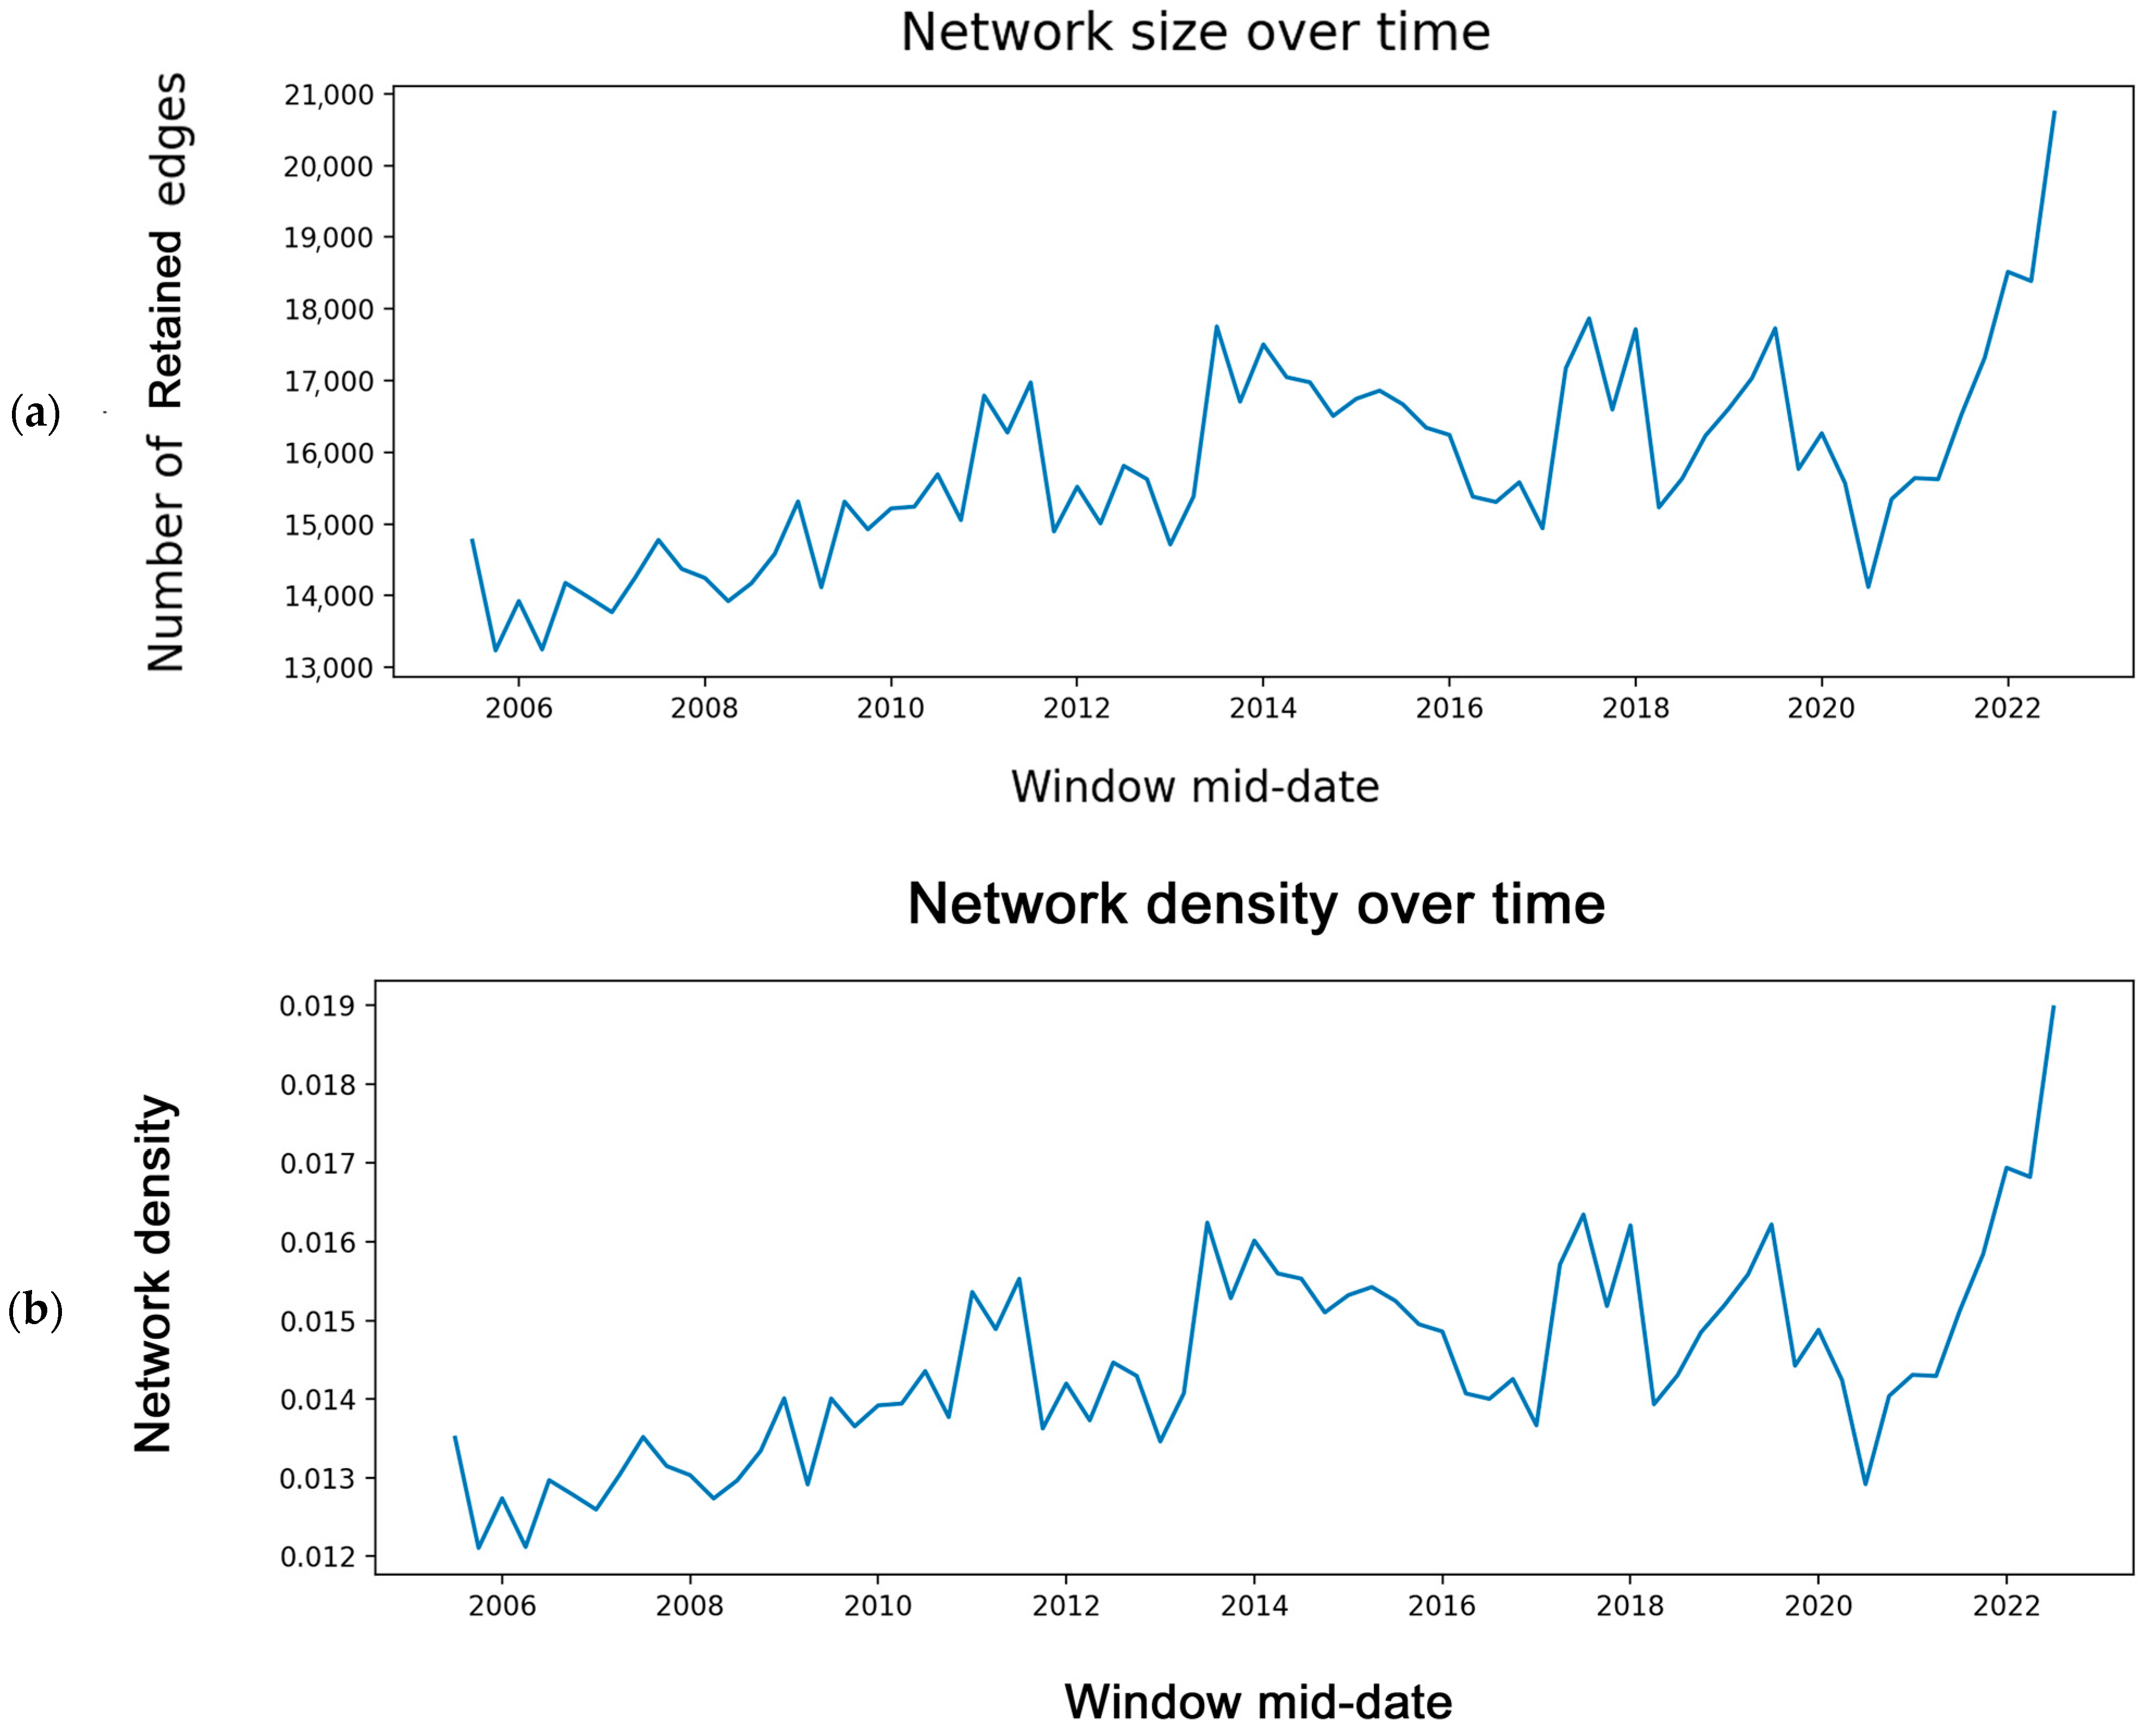
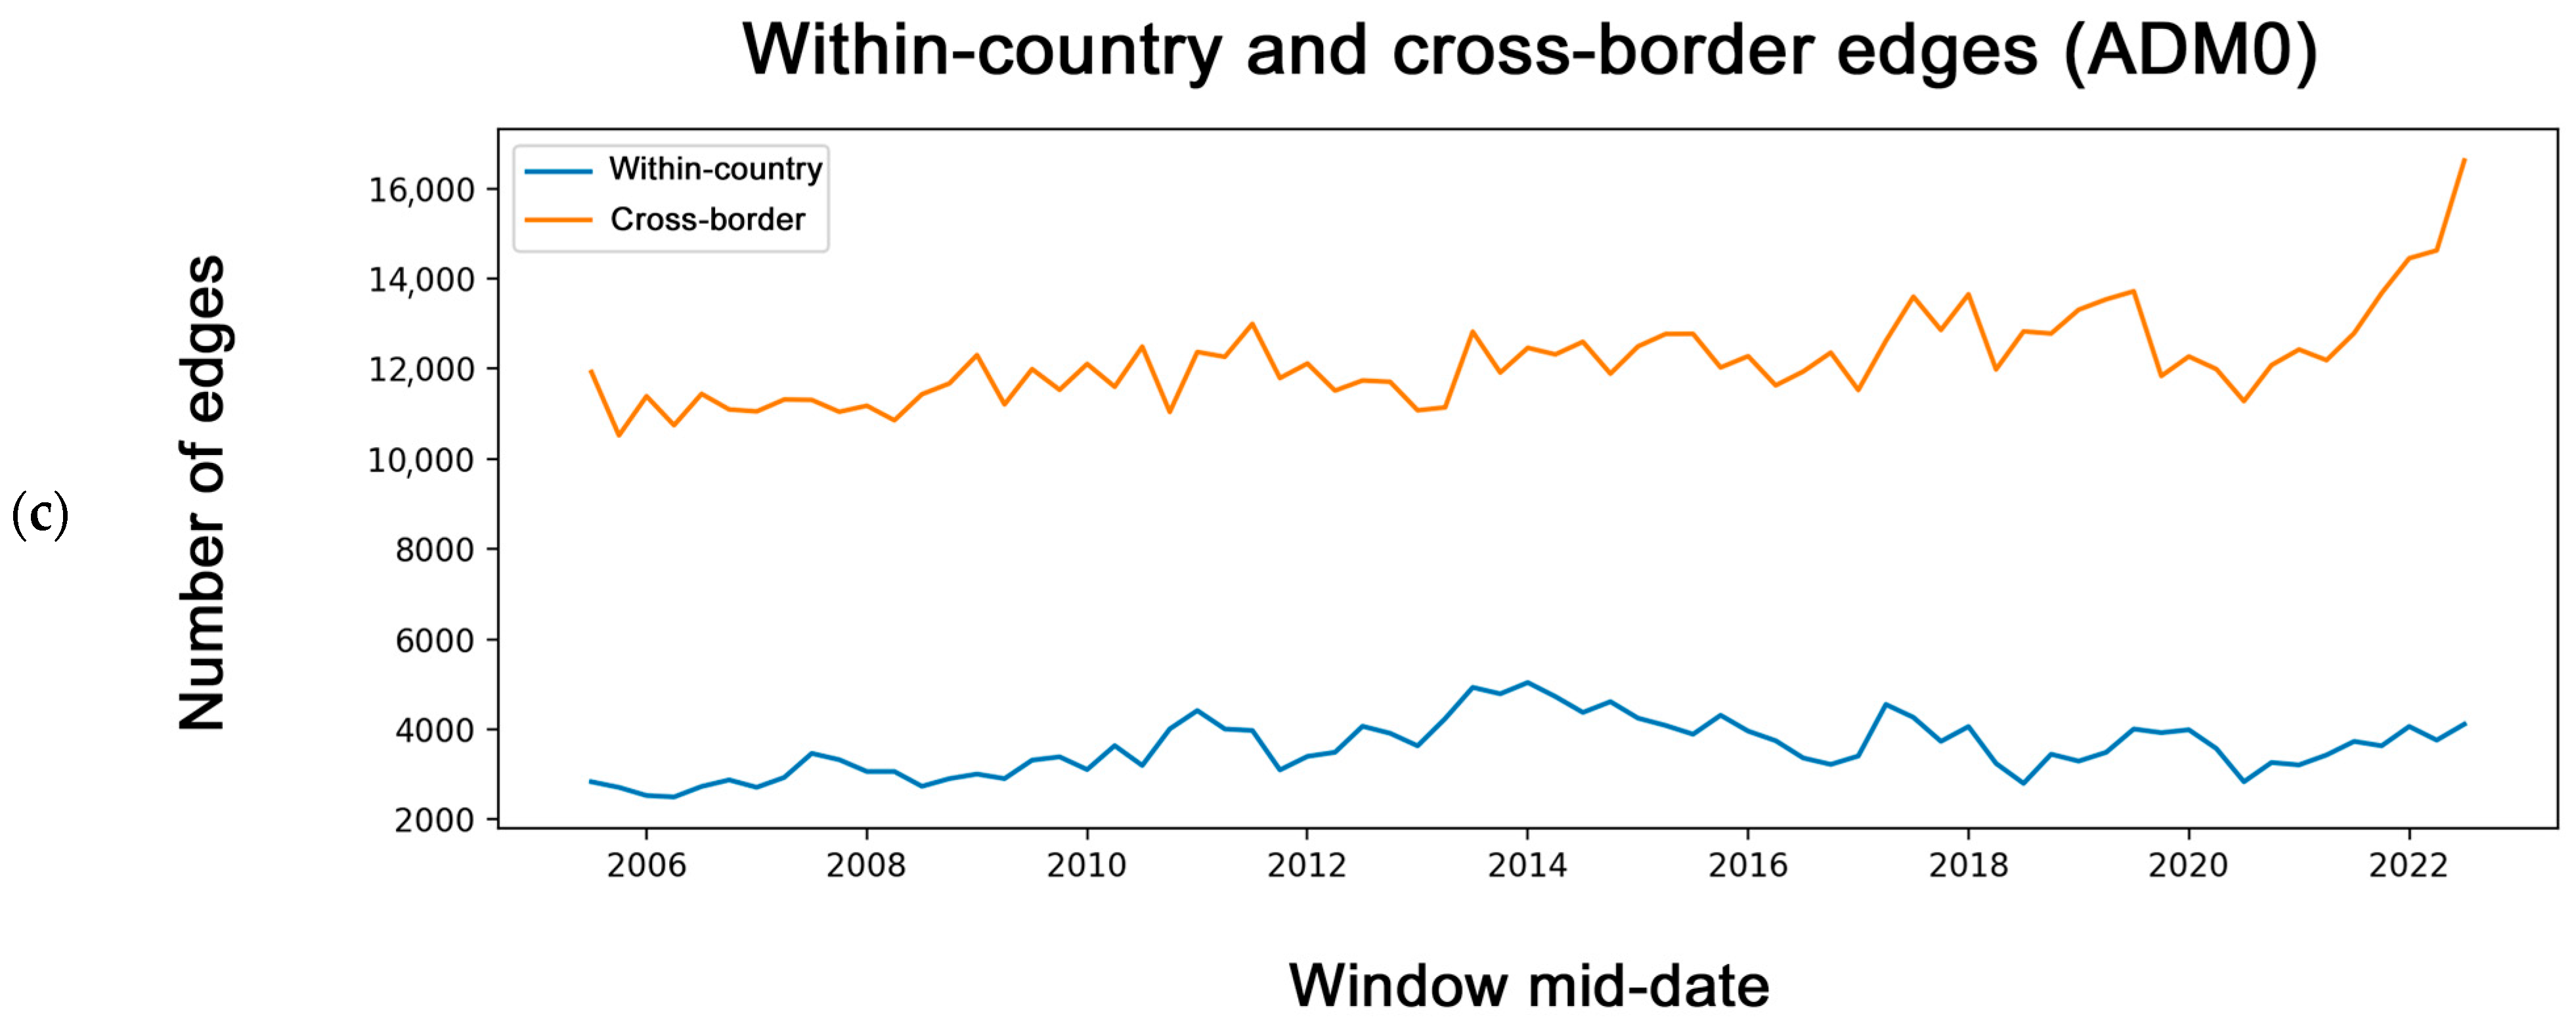
The inferred directed-dependence networks vary over time in both size and density (Figure 2). Across rolling windows, the number of retained directed edges ranges from 13,235 to 20,737, with a median of 15,624 and a mean of 15,789.65. Network density ranges from 0.0121 to 0.0190, with a median of 0.0143 and a mean of 0.0145. These results indicate substantial temporal variation in the inferred dependence structure across the study period.
Figure 2.
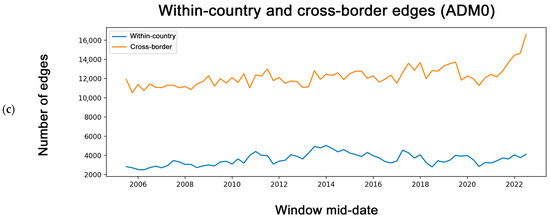
Temporal variation in inferred network size and density across rolling windows. (a) Number of directed edges retained per window. (b) Approximate network density per window. (c) Decomposition of retained edges into within-country and cross-border components at the country level (ADM0). Window timestamps correspond to the mid-date of each rolling window.
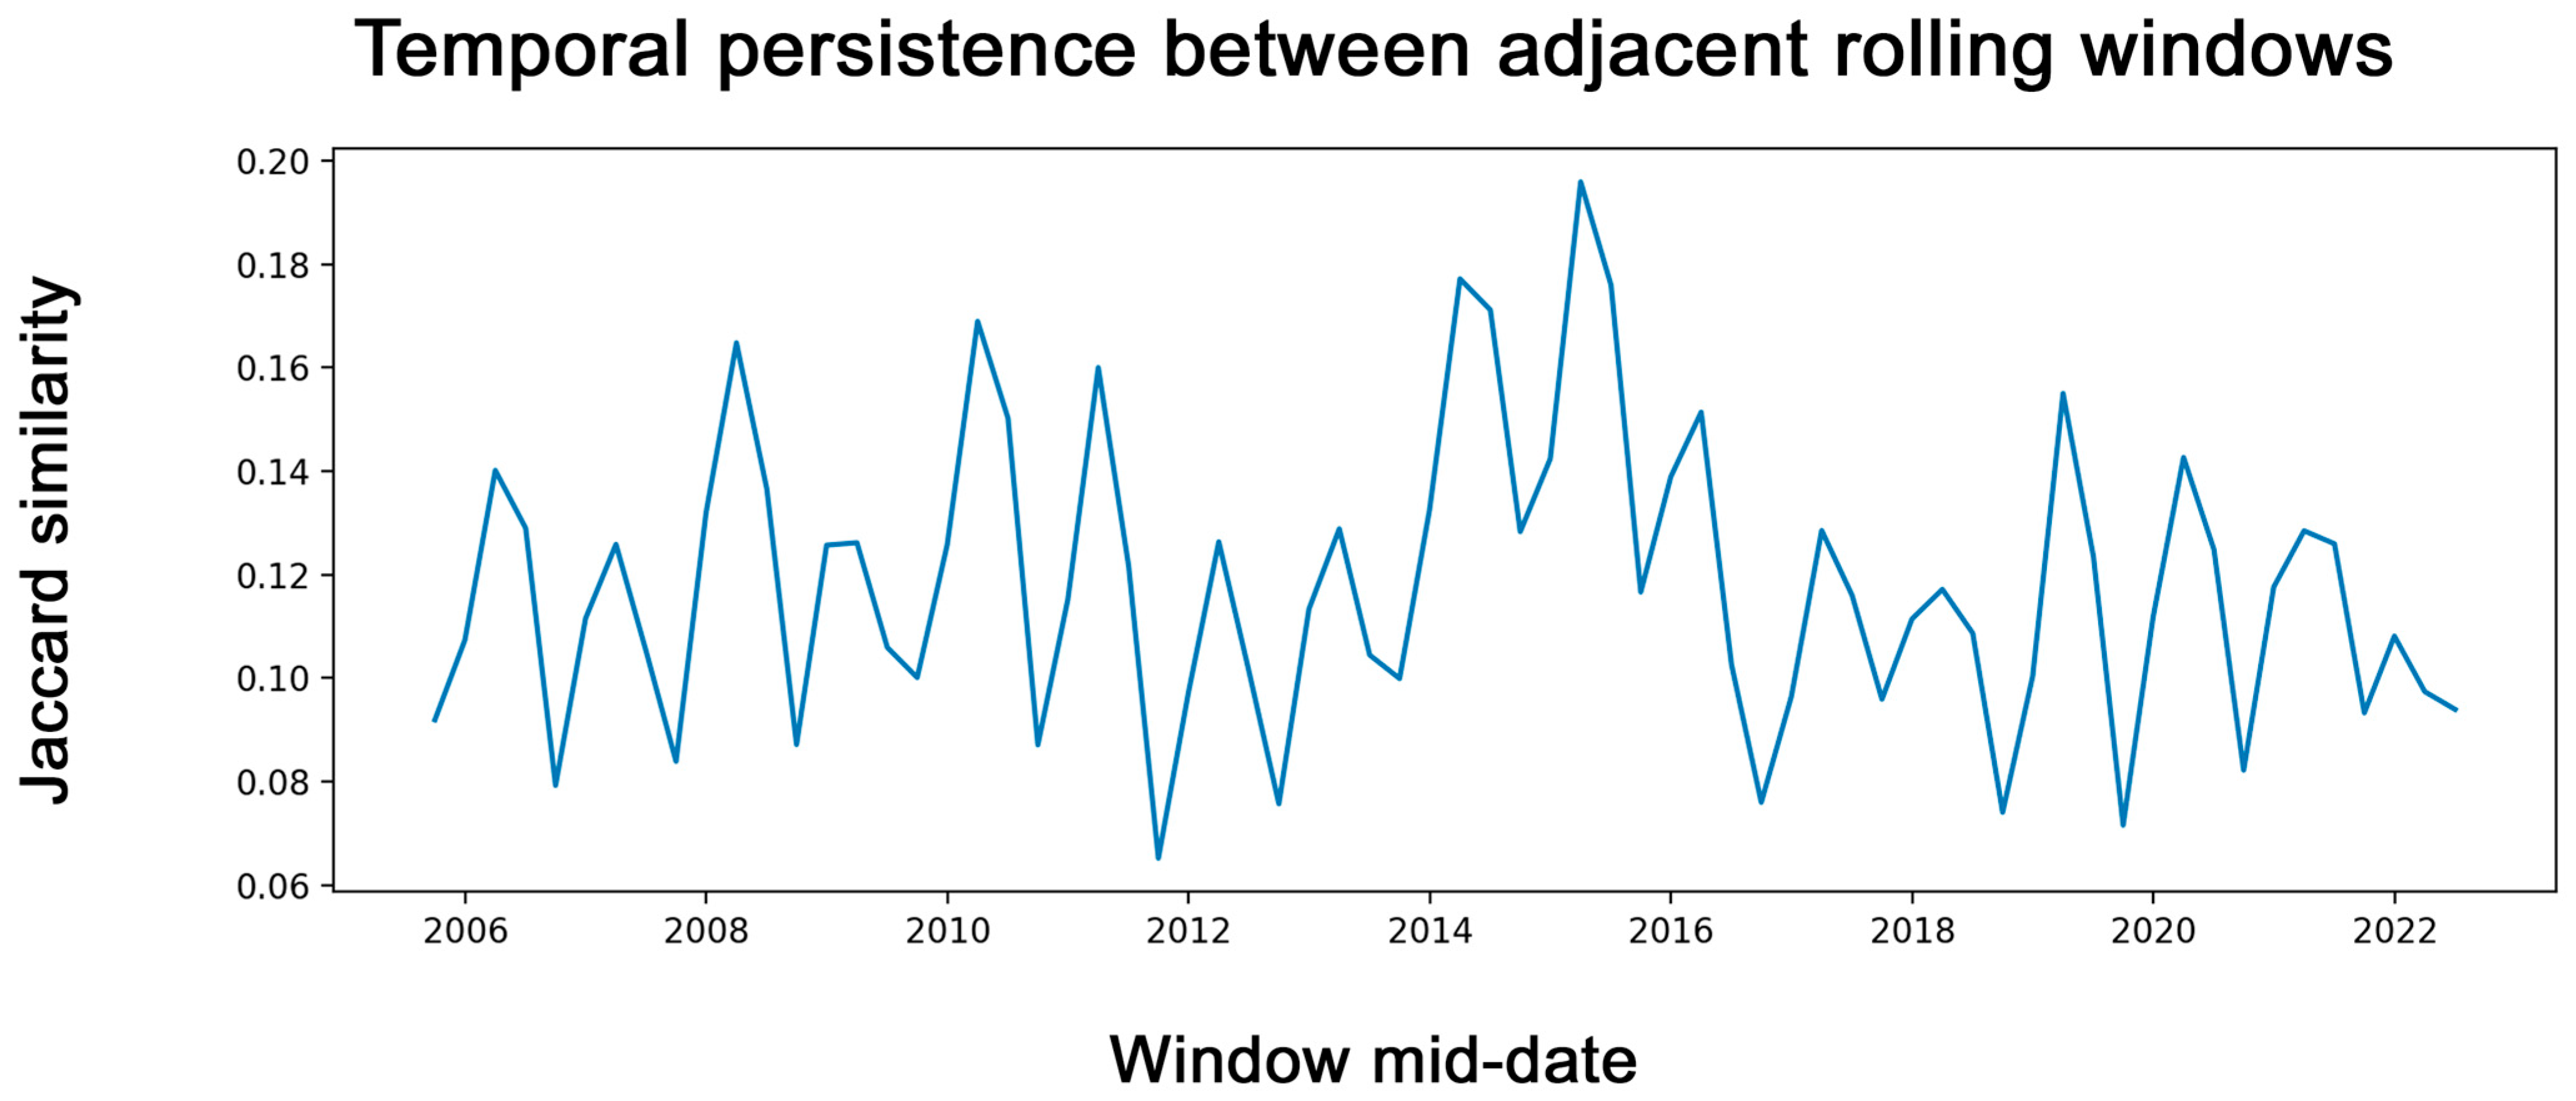
Despite this variability, adjacent windows retain measurable overlap (Figure 3). Jaccard similarity between consecutive edge sets ranges from 0.065 to 0.196, with a median of 0.116 and a mean of 0.118. This indicates that the regional PM2.5 dependence system is non-stationary but not structurally random from one window to the next. Rather, the network reorganizes through time while preserving a measurable degree of continuity.
Figure 3.
Persistence between adjacent rolling windows. Jaccard similarity of directed edge sets between consecutive windows (n = 68 adjacent window pairs) for rolling-window networks. Window timestamps correspond to the mid-date of each rolling window.
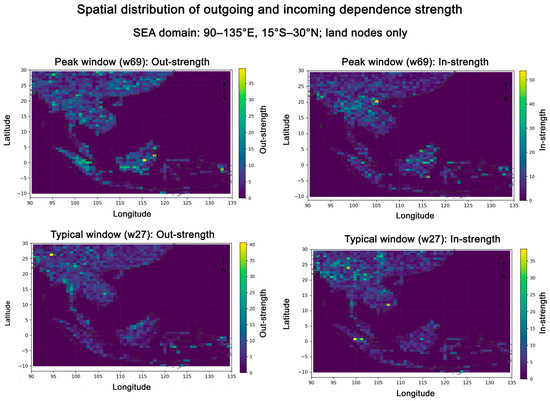
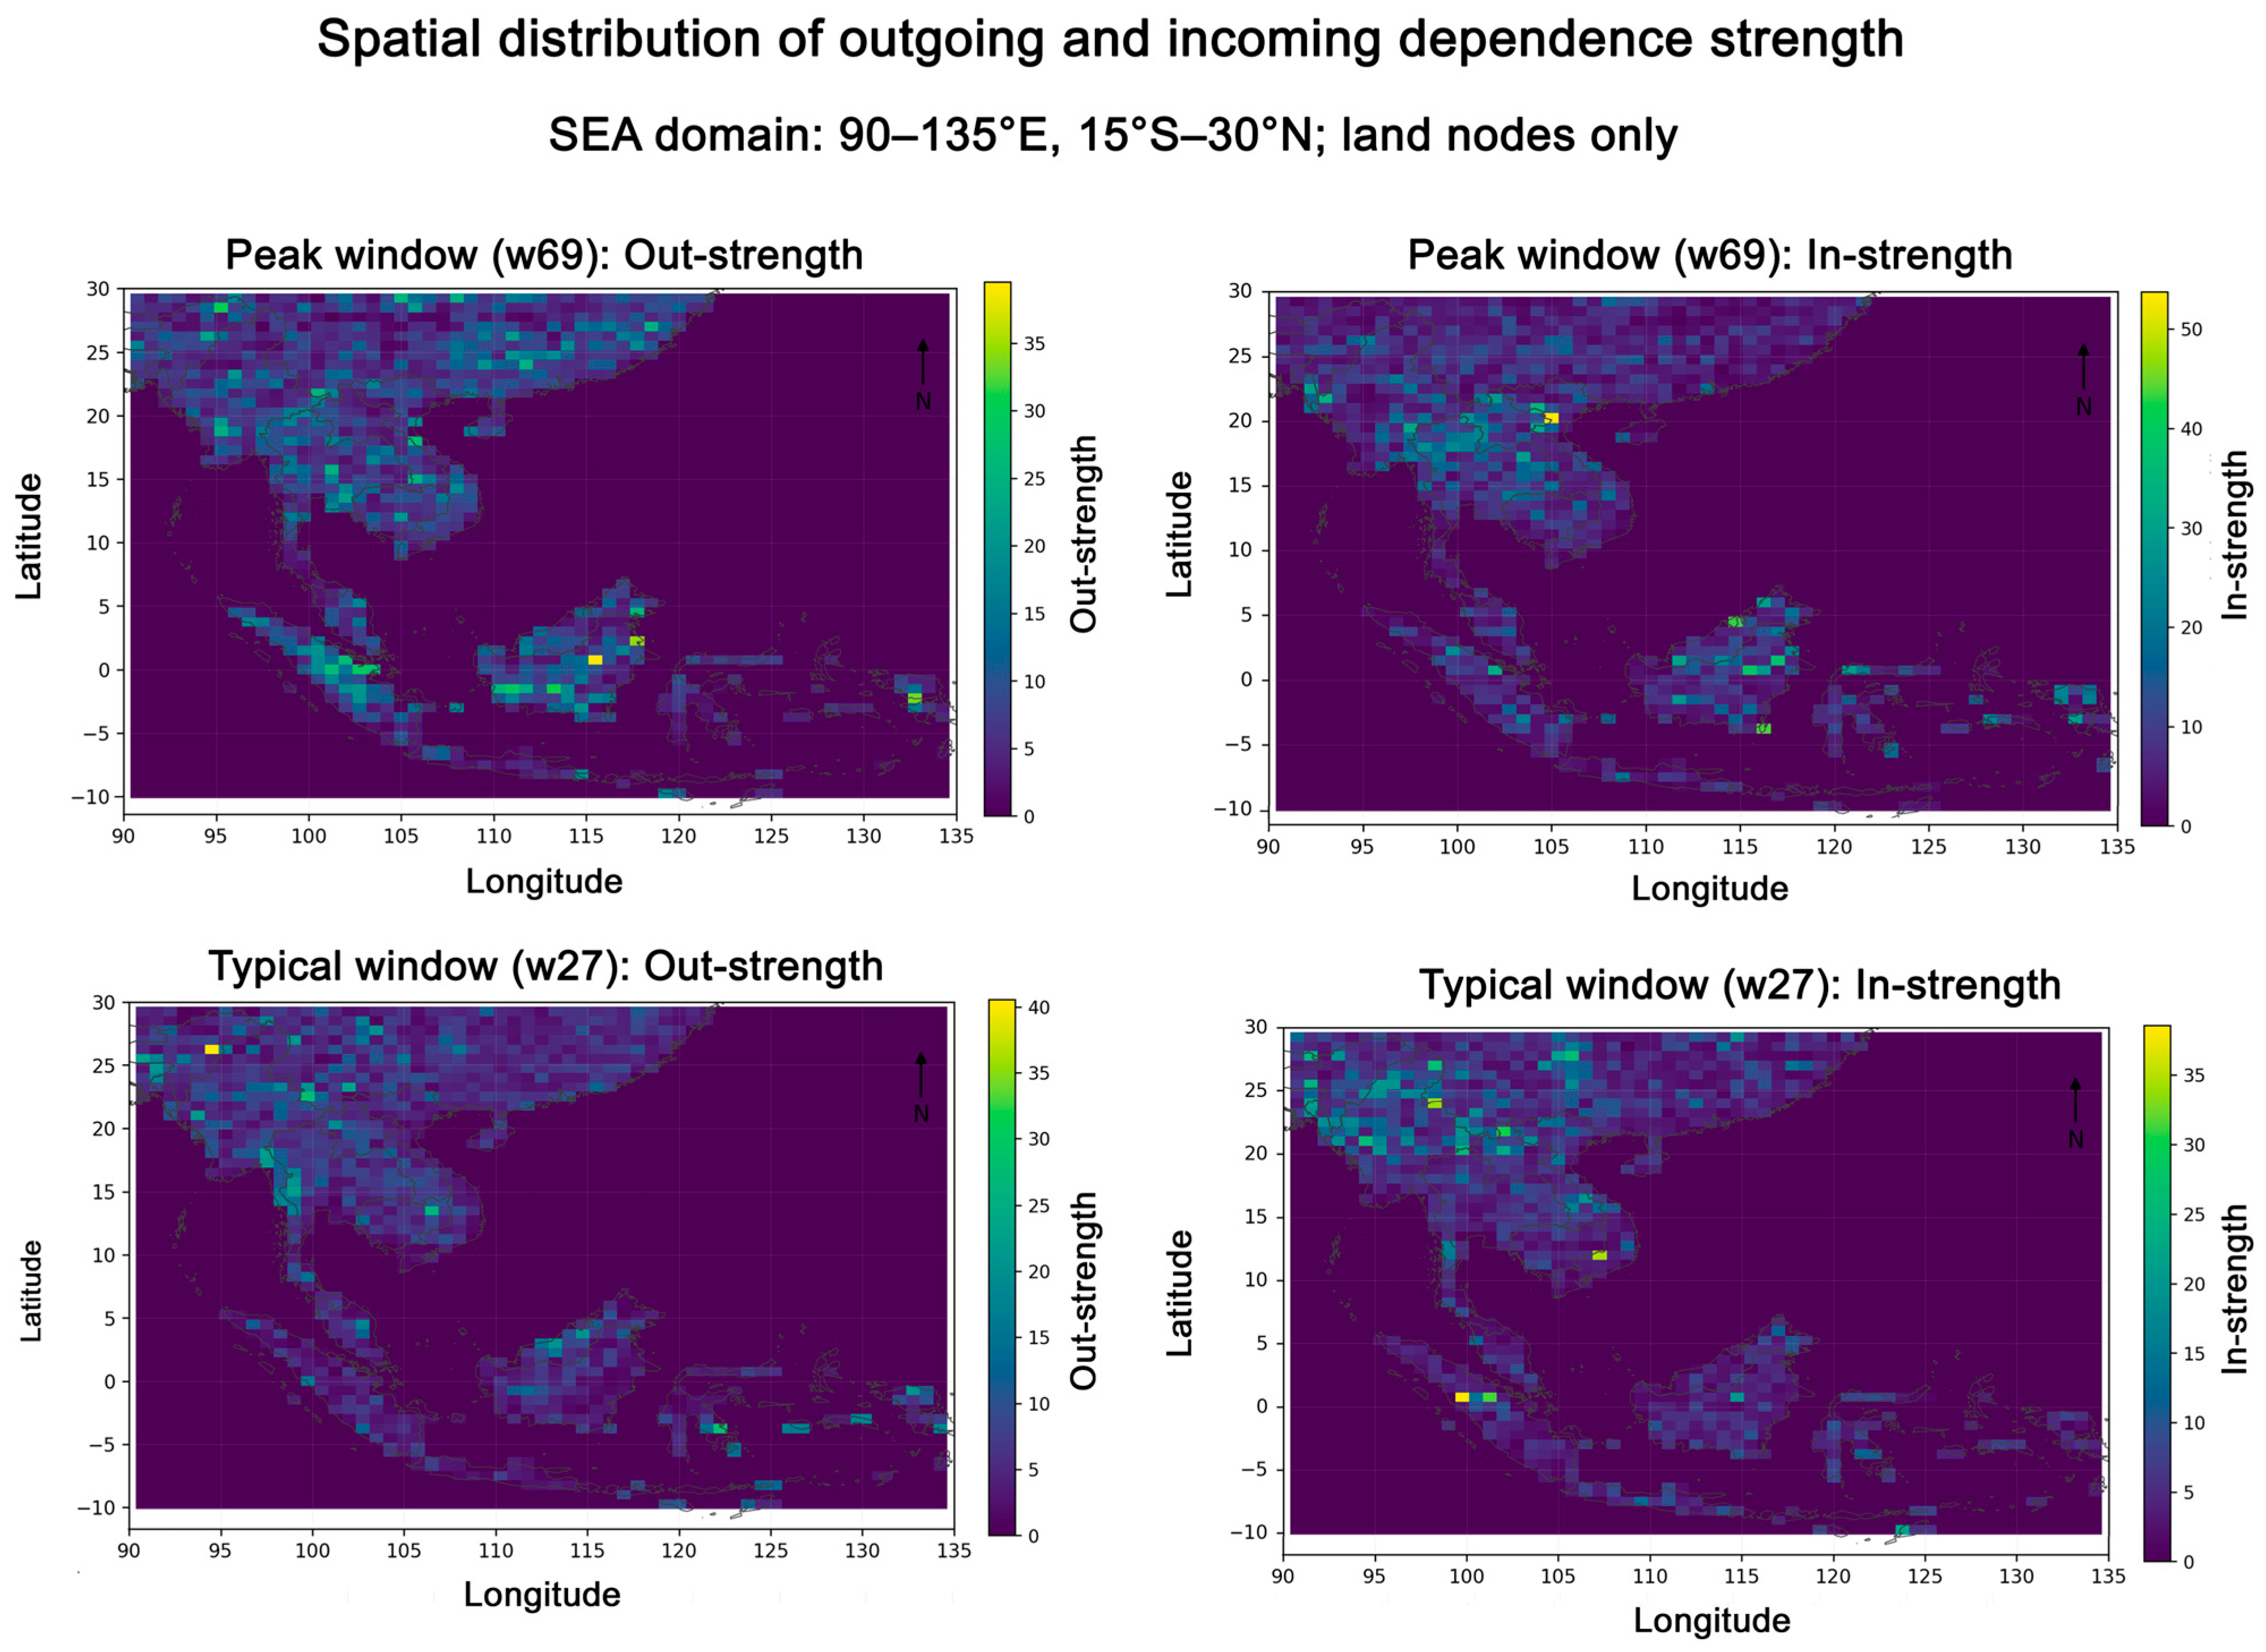
Spatially, node-level outgoing and incoming dependence intensity remains clustered in both typical and peak periods (Figure 4). The peak window (January 2020–December 2024) shows higher aggregate connectivity intensity than the typical window (July 2009–June 2014), but the hotspot structure in both periods confirms that outgoing and incoming roles are spatially concentrated rather than uniformly distributed across the domain.
Figure 4.
Spatial expression of node-level connectivity intensity. Hotspot maps summarize node-level outgoing dependence strength (out-strength) and incoming dependence strength (in-strength) on the 0.75° grid within the fixed Southeast Asia domain (90–135° E, 15° S–30° N; land nodes only). Panels compare a peak 60-month period (January 2020–December 2024; w69; mid-date July 2022) with a typical 60-month period (July 2009–June 2014; w27; mid-date January 2012).
3.2. Cross-Border Connectivity Dominates the Country-Level Network
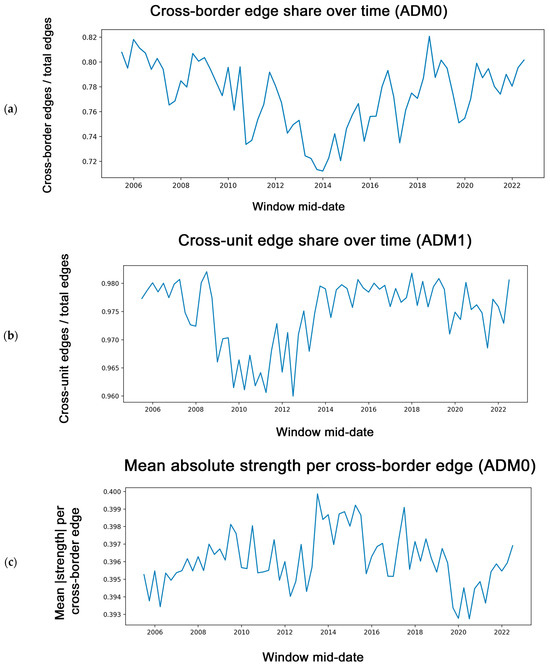
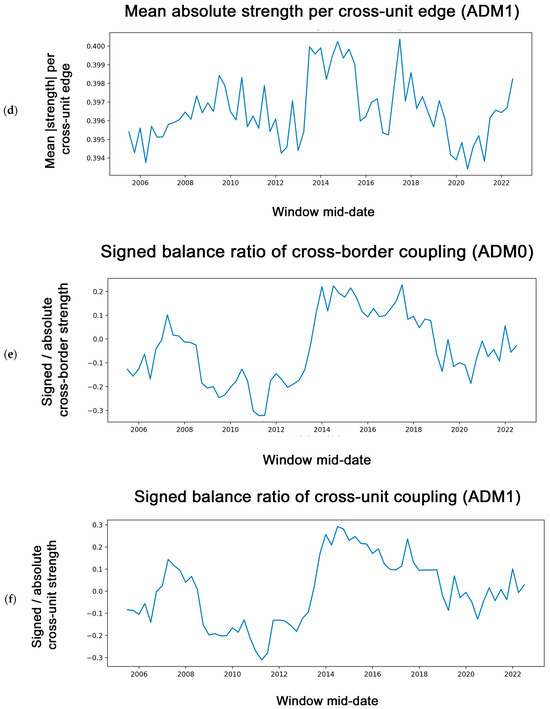
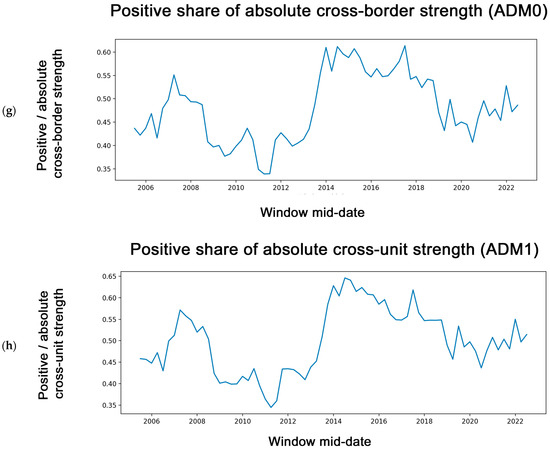
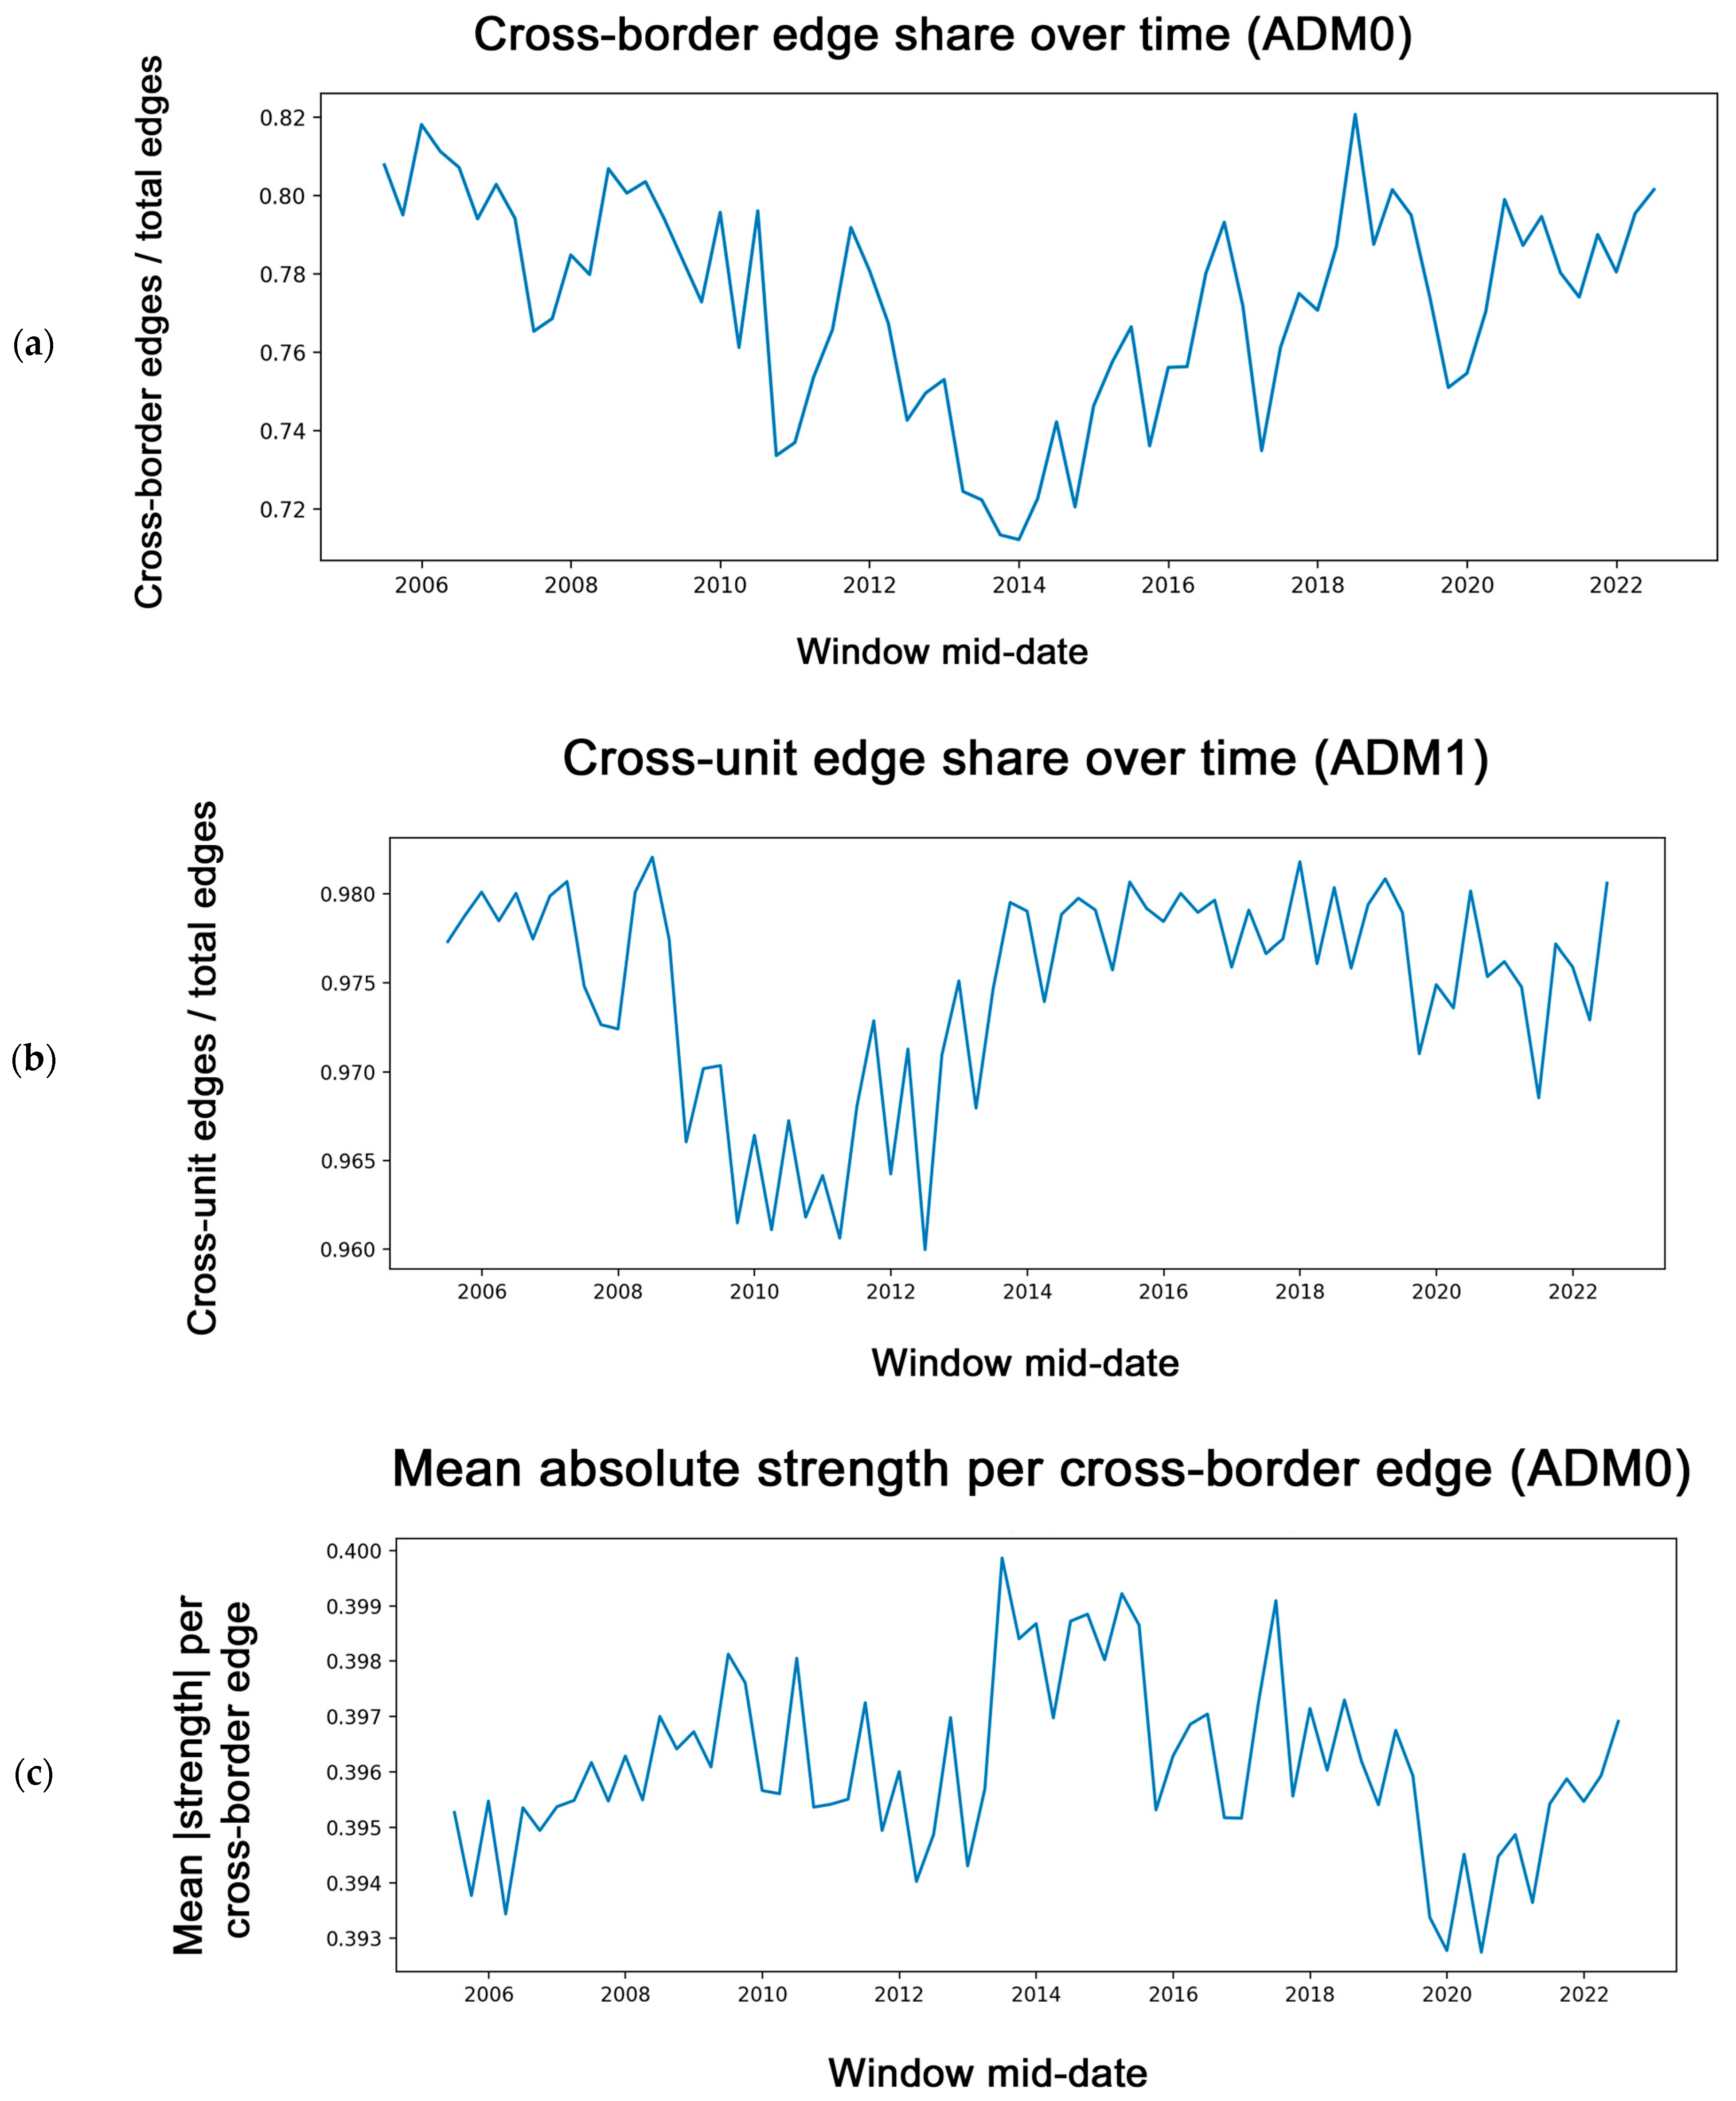
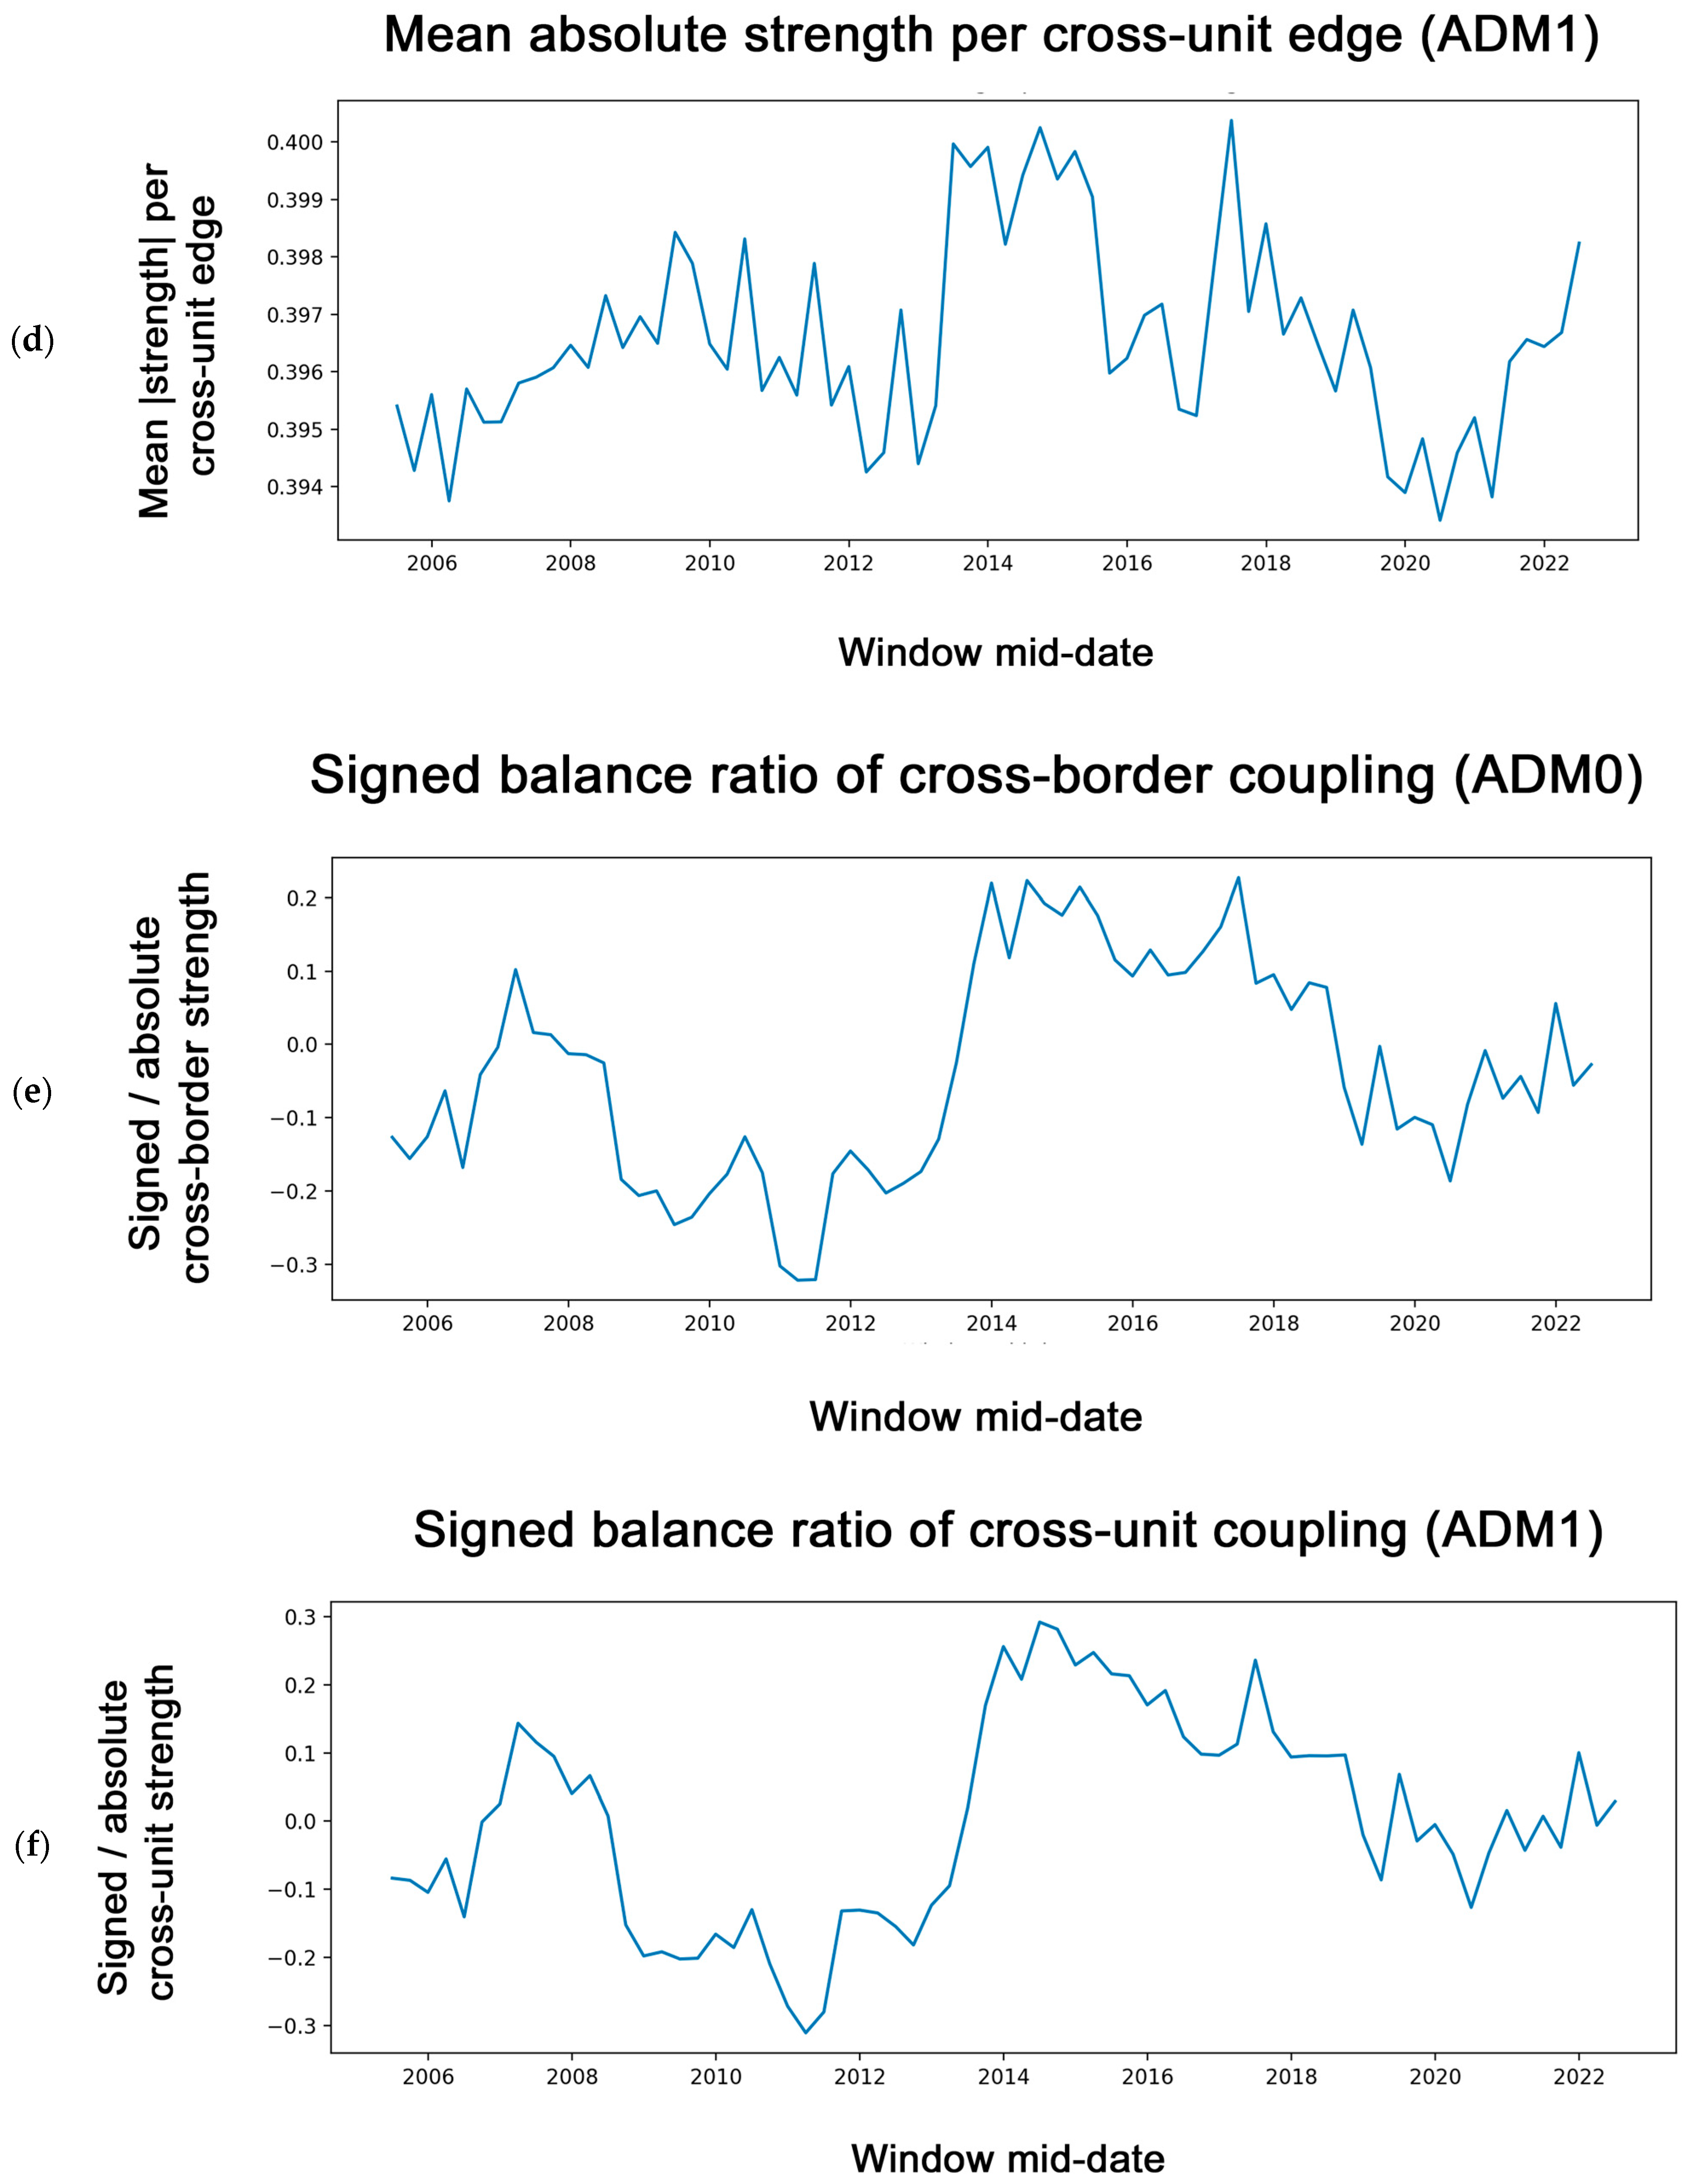
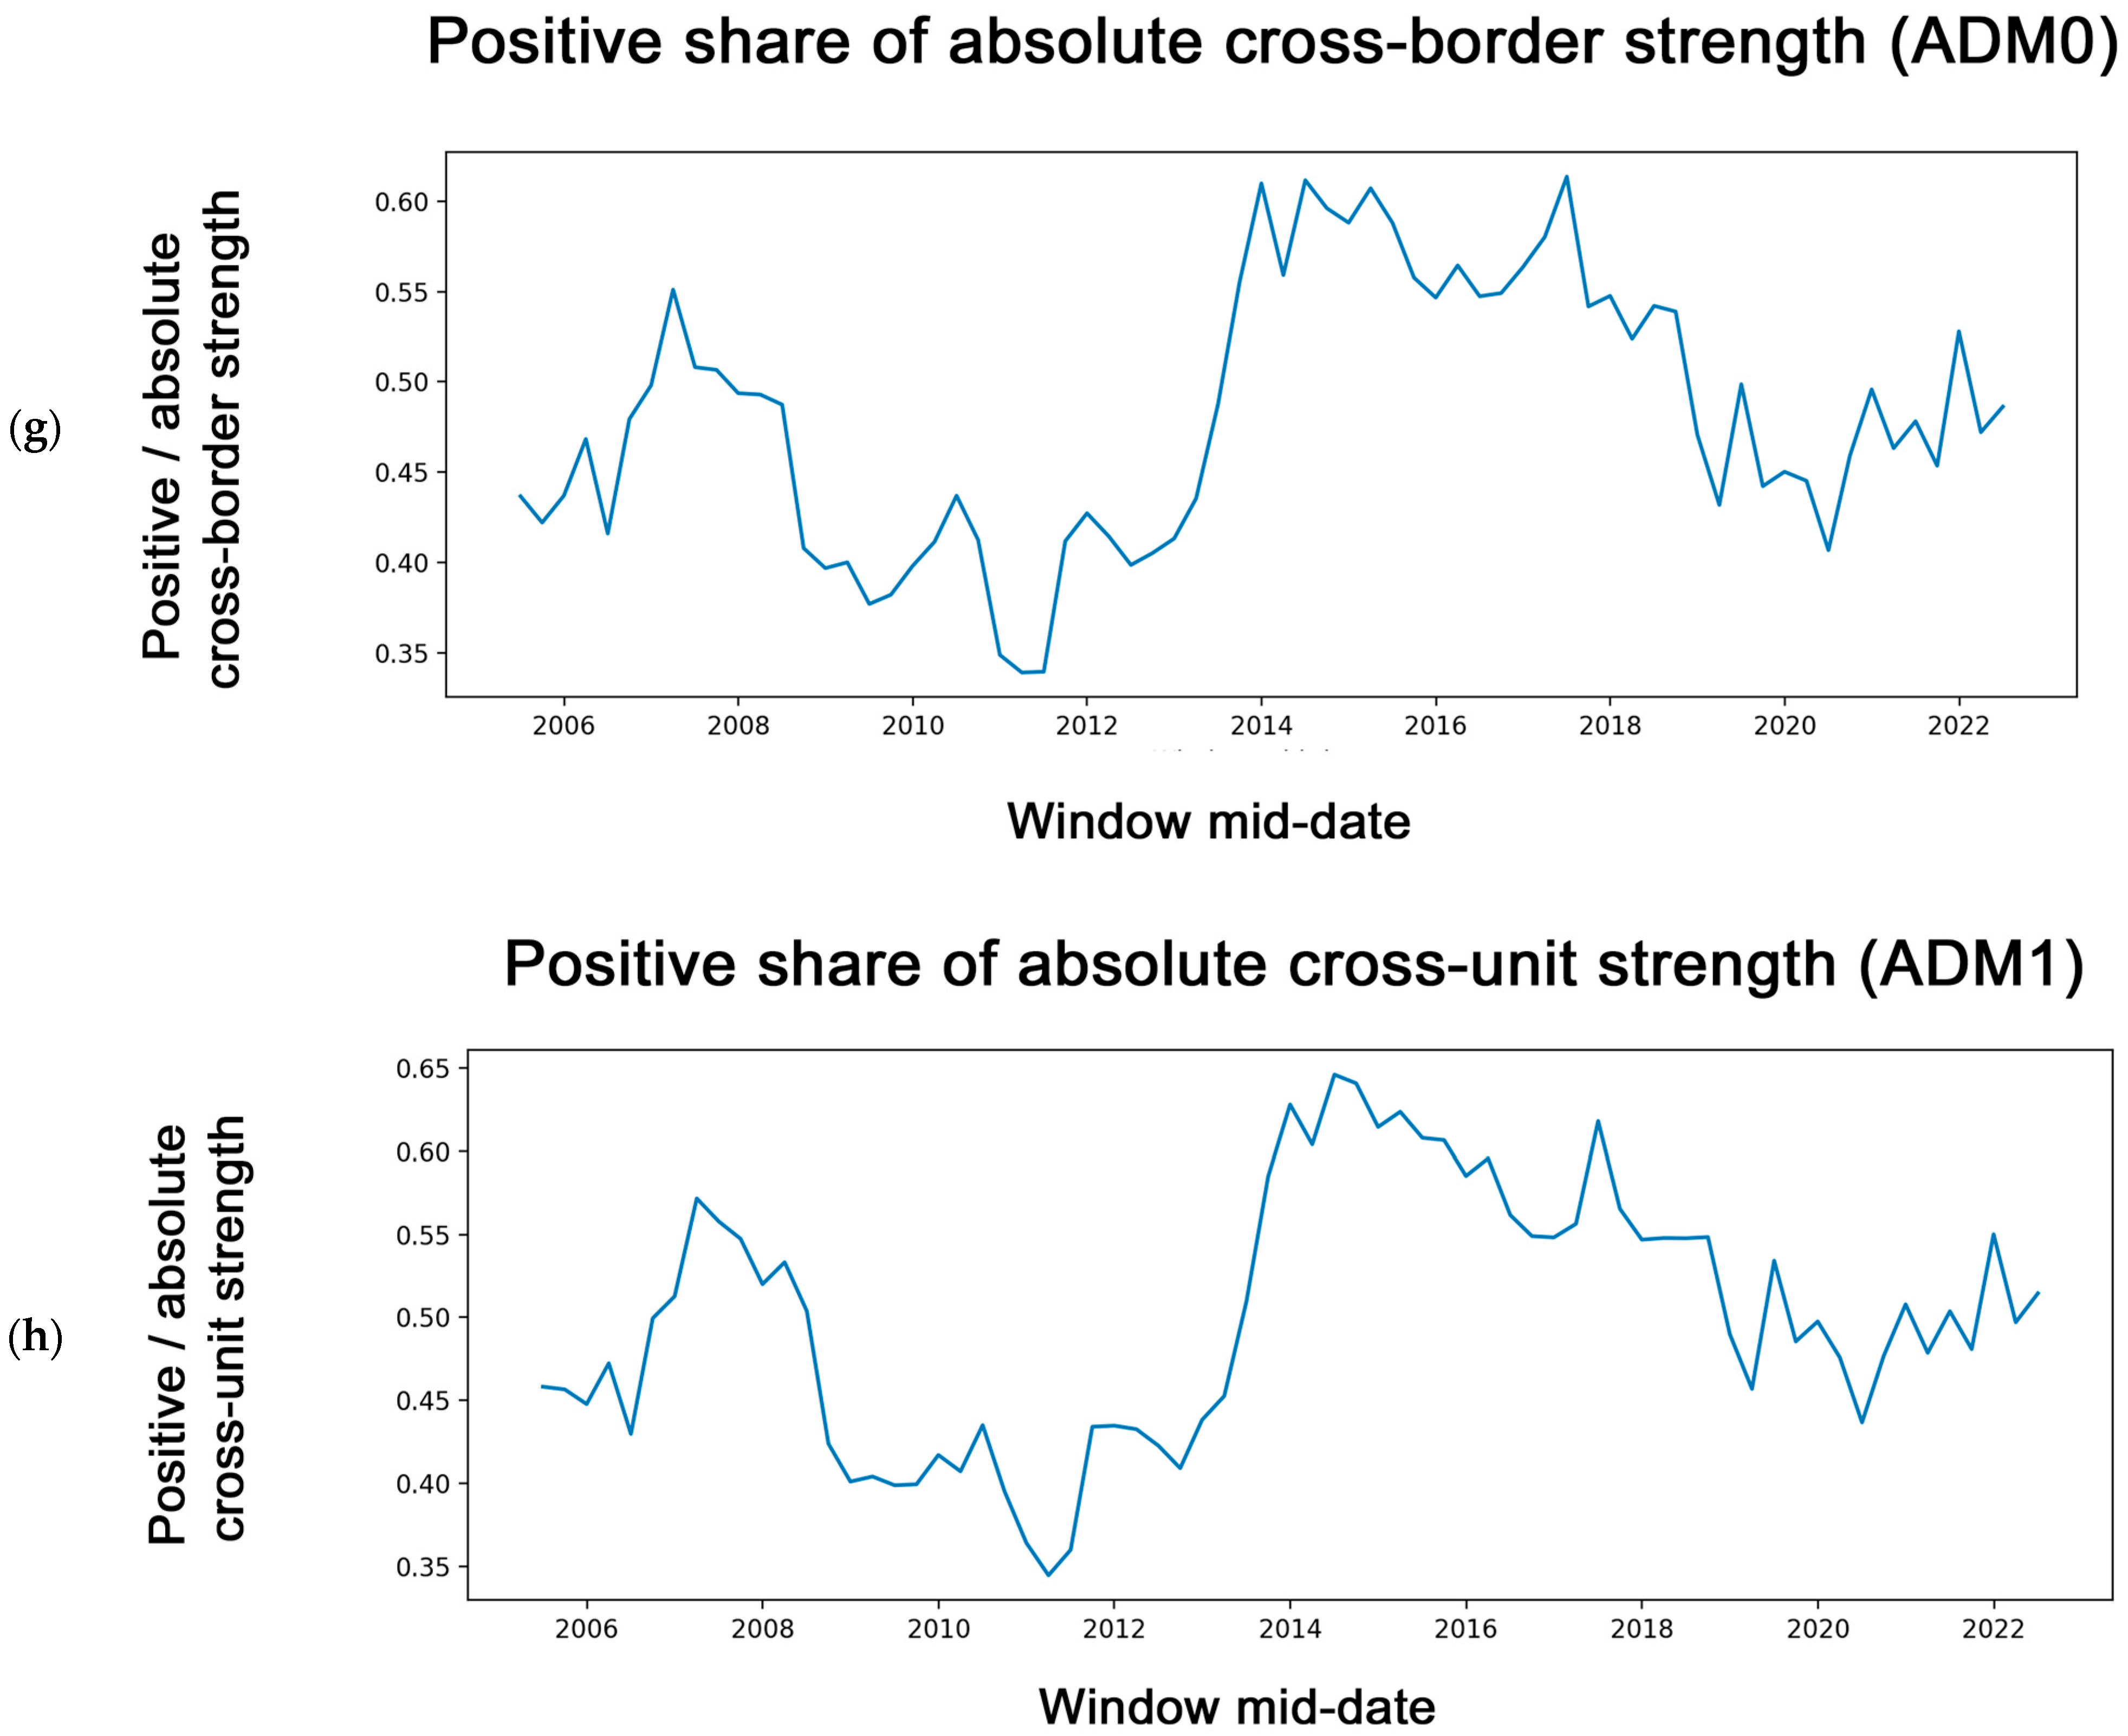
Cross-border links constitute a large and persistent share of the inferred country-level dependence structure. The number of distinct cross-border country pairs per window is narrowly distributed, ranging from 217 to 234, with a median of 221, while the number of cross-border directed edges averages approximately 12,190 per window. At the ADM0 scale, the cross-border edge share ranges from 0.712 to 0.821, with a median of 0.775 and a mean of 0.773. This shows that most country-level connectivity in the inferred network is transboundary rather than country-contained (Figure 5a). The mean absolute strength per cross-border edge is highly stable through time, ranging from 0.393 to 0.400, with a median of 0.396 (Figure 5c). By contrast, sign-balance diagnostics vary more substantially, with the signed balance ratio ranging from −0.322 to 0.227 and the positive share of absolute cross-border strength ranging from 0.339 to 0.614 (Figure 5e,g). This pattern suggests that the magnitude of cross-border coupling remains consistently strong, whereas the directional balance of signed residual associations shifts across windows. A similar but even stronger pattern is observed at the ADM1 scale. Cross-unit edges account for 0.960 to 0.982 of total edges, with a median of 0.976 and a mean of 0.975, again indicating that inter-unit coupling dominates the inferred structure (Figure 5b). Mean absolute strength per cross-unit edge remains narrowly distributed, while signed-balance metrics vary over time (Figure 5d,f,h).
Figure 5.
Cross-border and cross-unit connectivity dynamics over time. Time series are reported across rolling windows, with window timestamps shown as the mid-date of each window. Panels summarize normalized edge composition and sign-balance metrics at the country level (ADM0) and first administrative level (ADM1): (a,b) cross-border/cross-unit edge share; (c,d) mean absolute strength per cross-border/cross-unit edge; (e,f) signed balance ratio (signed/absolute); and (g,h) positive share of absolute strength. All metrics are computed within the fixed Southeast Asia domain and represent dependence-network summaries rather than emissions attribution.
3.3. Country-Level Exporter/Importer Roles and Persistent Transboundary Coupling Corridors
Country-level aggregation shows that several countries repeatedly occupy major outgoing and incoming dependence roles across the rolling-window sequence (Table 1). China and Indonesia exhibit the largest mean outgoing and incoming magnitudes, while Myanmar and Thailand also maintain prominent roles on both sides of the network. In terms of signed balance, Malaysia, Thailand, Myanmar, and India show positive mean net signed values, whereas Vietnam, China, and Indonesia show negative mean net signed values.
Table 1.
ADM0 exporter and importer role summaries across rolling windows. For each ADM0 unit, export and import magnitudes summarize aggregated cross-border dependence intensity across windows, reported as mean values; Top-10 exporter (%) and Top-10 importer (%) report the percentage of windows in which the unit ranks among the top 10 by export or import magnitude.
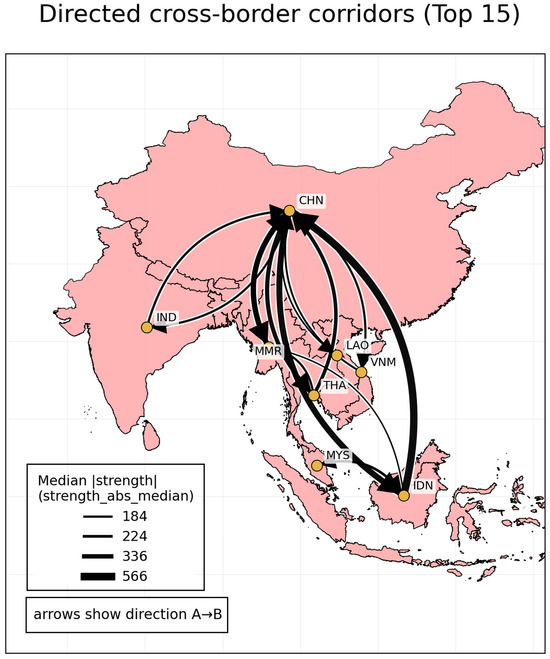
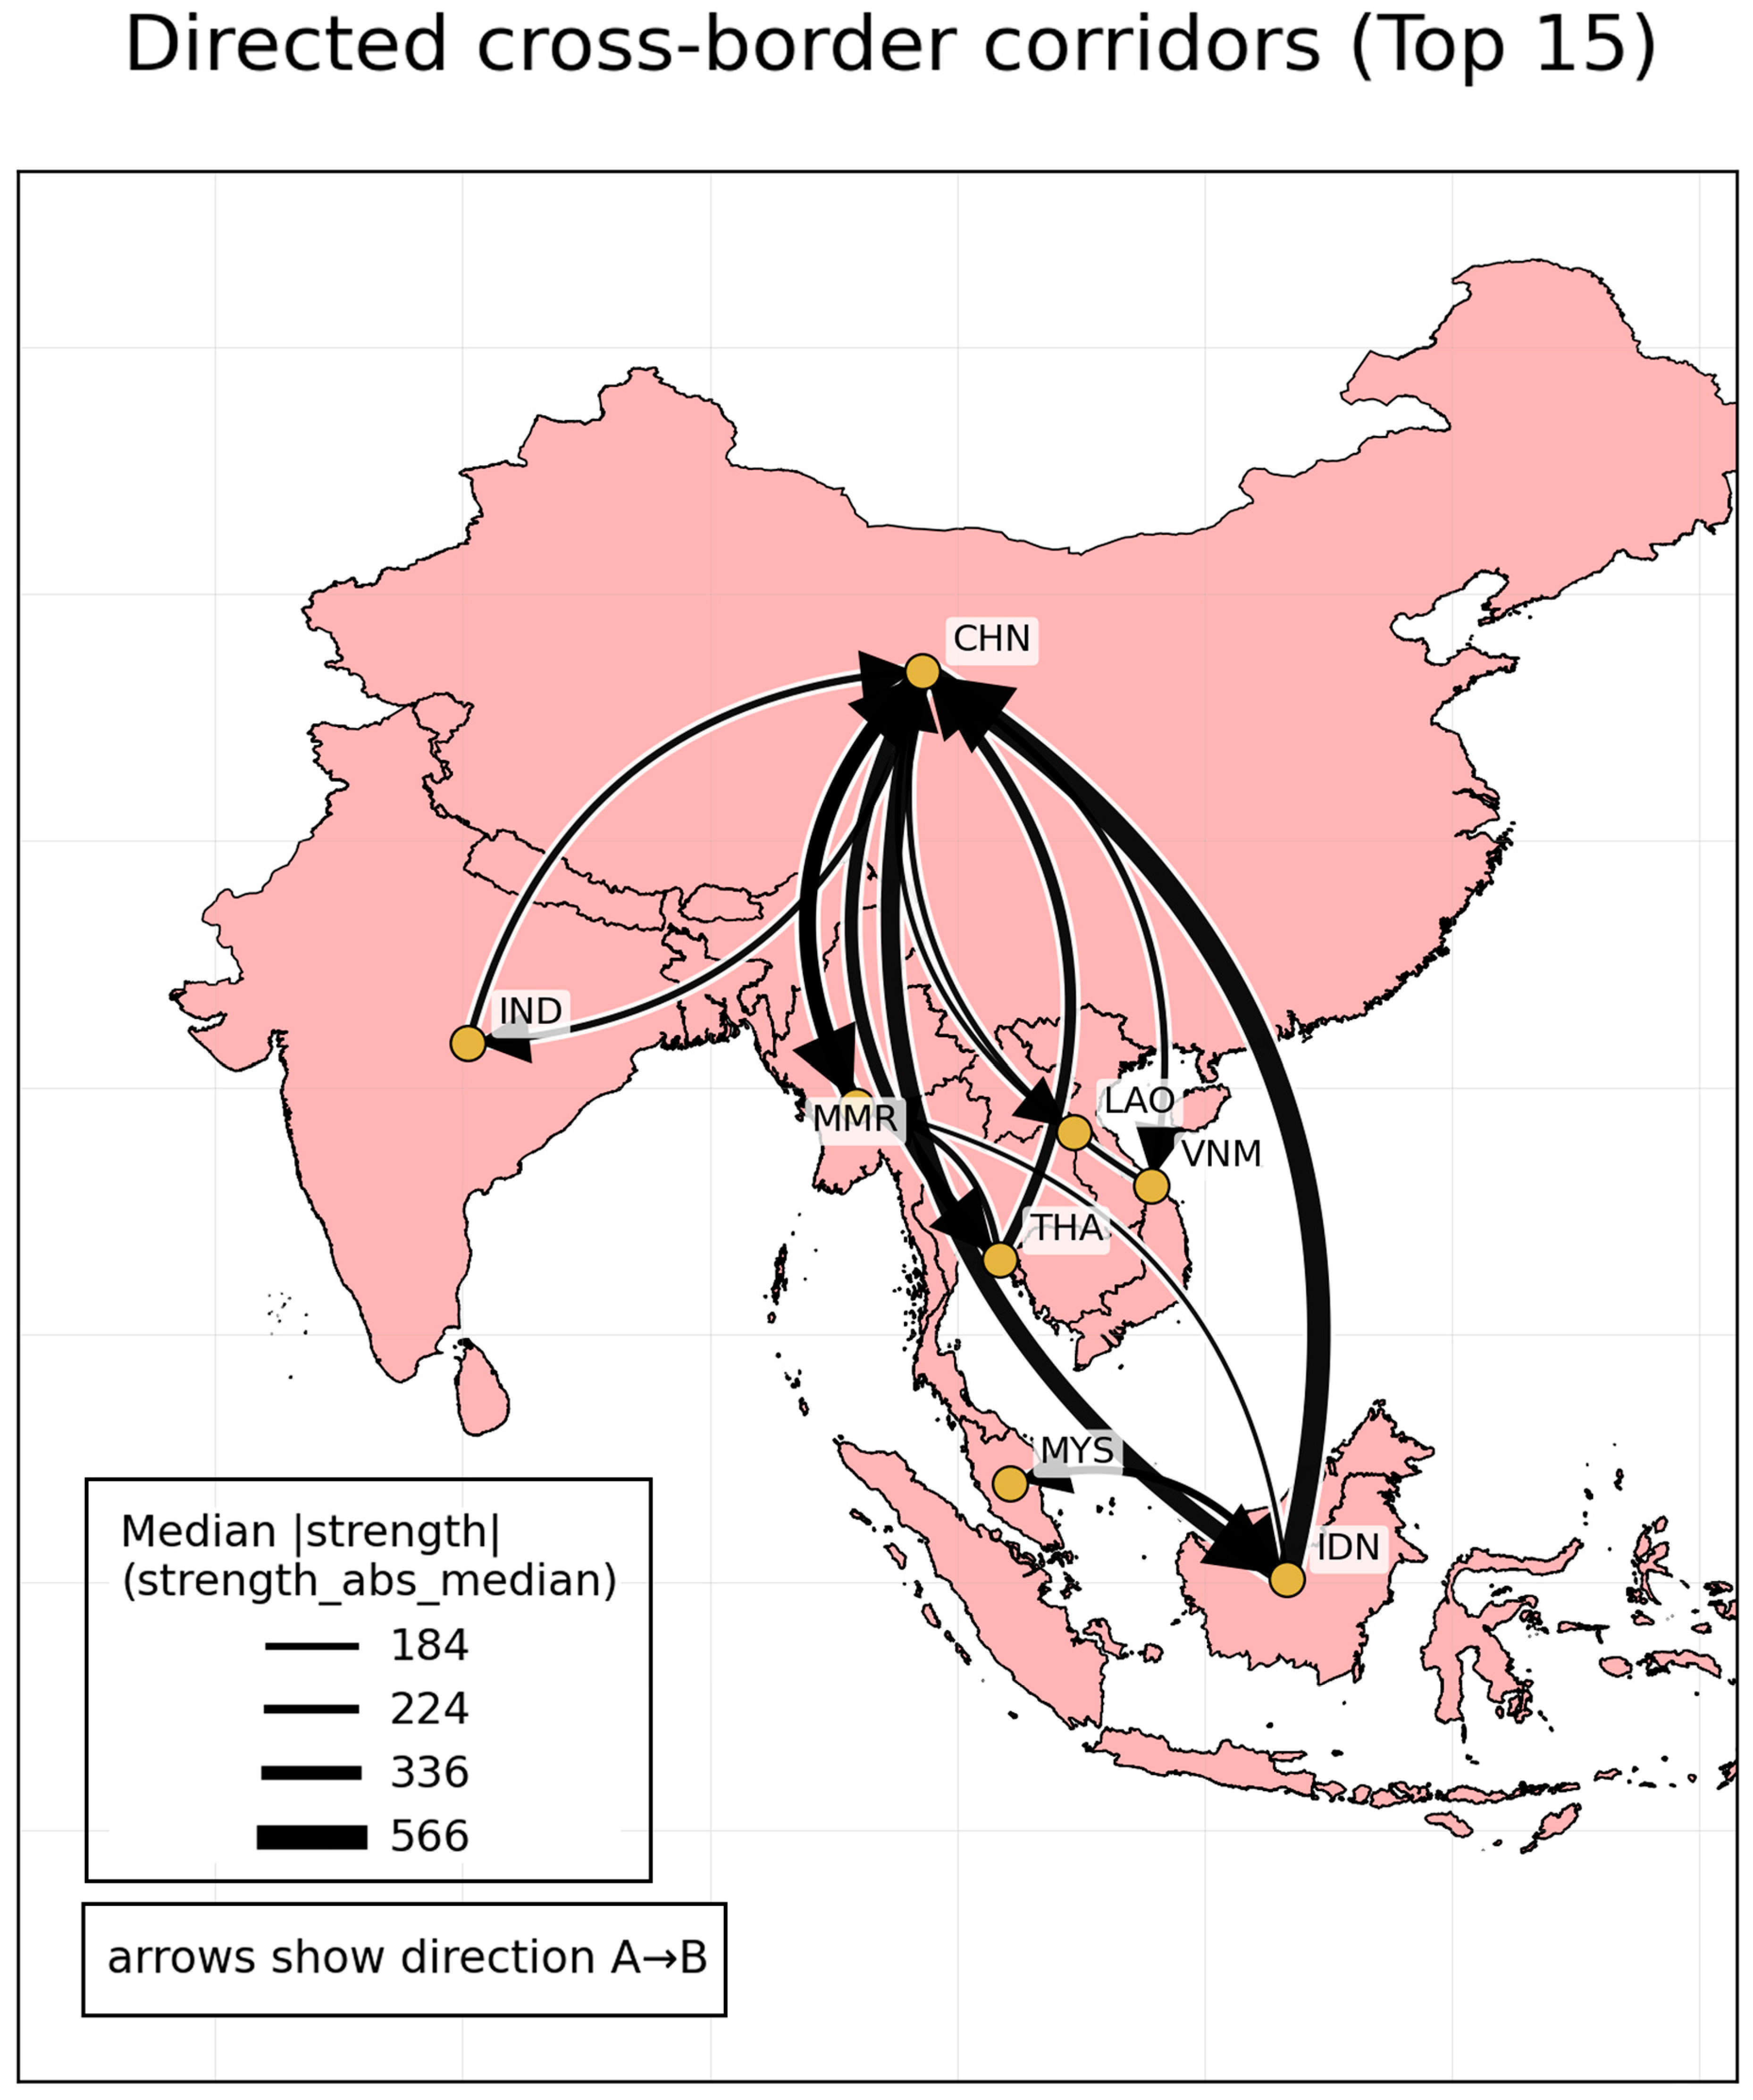
More importantly, the country-level flow structure reveals a recurrent backbone of persistent transboundary coupling corridors. In the cross-border-only ranking, the strongest corridors are Indonesia → China and China → Indonesia, followed by China → Myanmar and Myanmar → China; all are present in 100% of rolling windows (Table 2). China → Thailand and Thailand → China are likewise fully persistent, and Malaysia → Indonesia also recurs throughout the full record. Additional fully persistent corridors include India → China, China → India, and China → Vietnam.
Table 2.
Top ADM0 directed corridors (cross-border only). Cross-border corridors exclude within-country links and are reported for transboundary interpretation and mapping. Frequency indicates the percentage of rolling windows in which the directed unit-to-unit dependence is detected.
These country-level results indicate that cross-border PM2.5 coupling in the study domain is not episodic in a narrow sense but instead organized around a stable set of repeatedly expressed directional dependence links. The persistence of these corridors across all windows supports the interpretation of a recurrent ADM0 backbone despite pronounced temporal variability in the full network structure (Figure 6). A fully persistent bidirectional corridor should not be interpreted as continuous two-way physical transport throughout the entire record. Rather, it indicates that both directions of lagged conditional dependence recur across all rolling windows. For geographically distant pairs, such as China–Indonesia, this pattern is more appropriately interpreted as long-term regional coupling or climatological-scale co-variability under recurrent atmospheric regimes, rather than as a direct resolved transport pathway.
Figure 6.
Directed cross-border coupling corridors at the country level. Directed edges represent the highest-ranked transboundary corridors aggregated by ADM0 units. Arrow direction indicates A → B, and line width is proportional to the median absolute corridor strength computed across rolling windows within the fixed Southeast Asia domain. These corridors represent recurring statistical dependence in covariate-adjusted PM2.5 anomalies and should not be interpreted as direct emissions attribution.
3.4. Subnational Gateways and Receptor Basins at ADM1
ADM1 aggregation reveals subnational roles that are partly obscured by country-level summaries. Several units repeatedly appear among the strongest outgoing and incoming dependence roles across windows (Table 3). For example, Myanmar: Shan appears in the top-10 importer list in all 69 windows, while China: Tibet Autonomous Region appears in the top-10 exporter list in 92.8% of windows and the top-10 importer list in 98.6% of windows. China: Yunnan Province, China: Guangxi Zhuang Autonomous Region, China: Sichuan Province, and Indonesia: West Kalimantan also show repeated prominence.
Table 3.
Persistent exporter and importer roles at ADM1. Export and import summarize unitless outgoing and incoming dependence strength aggregated at ADM1 and summarized across windows. Net signed (median) reports the median signed balance. Top-10 exporter/importer (%) report the percentage of windows in which each ADM1 unit ranks among the top 10 by export or import strength.
The simultaneous exporter and importer role of Tibet Autonomous Region reflects its position as a high-connectivity transitional unit in the inferred network. It does not indicate that Tibet is both an emission source and a receptor. Rather, its large spatial extent, boundary location within the study domain, and connection to adjacent high-elevation and downwind administrative units can generate both outgoing and incoming lagged dependence in monthly residual PM2.5 fields.
Persistent ADM1 corridor analysis further clarifies the subnational structure of the regional network. In the cross-unit ranking, the strongest fully persistent corridor is China: Yunnan Province → Myanmar: Shan, followed by the reverse direction Myanmar: Shan → China: Yunnan Province; both occur in 100% of windows (Table 4). Additional fully persistent corridors connect Yunnan with Tibet, Sichuan, and Guangxi, indicating that Yunnan functions as a central gateway within the broader subnational network. A persistent link from Indonesia: West Kalimantan to Indonesia: Central Kalimantan is also observed in all windows.
Table 4.
Top persistent ADM1 directed corridors (cross-unit only; A ≠ B; K = 69). The table is restricted to cross-unit corridors to summarize inter-unit pathways. Frequency indicates the percentage of rolling windows in which the directed dependence is detected.
These results show that the regional transboundary PM2.5 dependence system contains stable subnational gateways and receptor basins that are not fully captured by ADM0 summaries alone. In particular, the persistent bidirectional coupling between Yunnan Province, China, and Shan State, Myanmar, illustrates how first-order administrative analysis can reveal strategically important transport-relevant coupling pathways that remain partially hidden in country-level aggregation. However, even for geographically adjacent ADM1 corridors, the inferred links should be interpreted as recurrent statistical dependence in covariate-adjusted PM2.5 anomalies, not as direct proof of physical transport or source attribution.
4. Discussion
4.1. Cross-Border PM2.5 as a Dynamic Regional Coupling System
This study supports a regional interpretation of PM2.5 in Southeast Asia as a dynamic directional-coupling system rather than as a set of largely country-contained pollution problems. The country-level network shows that cross-border links account for a substantial share of inferred connectivity through time, while the full graph reorganizes across rolling windows instead of remaining fixed. This pattern is consistent with a non-stationary atmospheric system in which directional dependence changes with meteorological regime, yet some recurrent coupling pathways remain visible across the full record [17,18,25].
A central interpretive point is that the inferred links in this study represent directional statistical dependence in covariate-adjusted PM2.5 anomalies. They should be distinguished from physically resolved air-mass trajectories and from emissions-based source attribution. Atmospheric transport provides one plausible mechanism for some recurrent links, especially geographically adjacent corridors, but the network itself should be interpreted as a structural screening and diagnostic tool rather than as direct proof of source responsibility.
This perspective is useful because it makes directional asymmetry visible. Some countries and subnational units appear more often as units with stronger outgoing dependence, whereas others appear more often as units with stronger incoming dependence. In this framework, however, exporter and importer roles should not be interpreted as substitutes for emissions inventories, chemical source apportionment, or legal attribution. They reflect directional coupling in an adjusted PM2.5 system, shaped by geography, atmospheric connectivity, shared regional regimes, transport efficiency, and removal processes, rather than direct evidence of responsibility or culpability [9,26].
The domain definition also matters. The inferred corridors and roles describe within-domain coupling inside the fixed Southeast Asia bounding box used in this analysis. They therefore provide an evidence layer for regional interpretation, monitoring design, and regime-aware early-warning logic, but not a mechanistic accounting of who caused a given pollution episode. This distinction is important because the same statistical corridor can arise from different physical situations, including direct advection, shared seasonal forcing, broad climate variability, or indirect synchronization through regional atmospheric circulation.
4.2. Seasonal Modulation and Episodic Amplification of Cross-Border Coupling
Strong cross-border coupling is plausible in Southeast Asia because the region is governed by monsoonal circulation, land–sea contrasts, complex terrain, and seasonally varying removal conditions. These factors can strengthen or weaken directional dependence between the same upwind–downwind pairs over time, even without identical changes in emissions. In practical terms, a corridor may become more influential when advection is sustained, boundary-layer ventilation is weaker, or wet scavenging is reduced, and less influential when these conditions reverse [11,12,27].
This interpretation is also consistent with haze-prone episodes documented across the region. Previous work using transport modeling, trajectory analysis, and regional case studies has shown that cross-border smoke influence can intensify under favorable circulation, especially during strong biomass-burning periods [10,28,29]. The present results align with that broader literature, but they should still be read carefully. The network identifies recurrent directional coupling in covariate-adjusted PM2.5 dynamics; it does not directly assimilate emissions inventories, chemical tracers, fire radiative power, or air-mass trajectory ensembles. For that reason, the detected corridors are better interpreted as screening signals for follow-up validation than as event-scale physical attribution.
The monthly temporal resolution also affects interpretation. Because the analysis uses monthly data over 2003–2024, the results are more suited to identifying long-term structural continuity and recurrent climatological-scale coupling than to resolving individual short-lived haze episodes. Episodic biomass-burning events and synoptic-scale transport can contribute to the monthly signal, but the method does not isolate day-to-day plume movement or event-specific source contributions. This scale distinction is essential when interpreting persistent corridors: persistence across rolling windows indicates repeated statistical dependence over long-term monthly dynamics, not continuous physical transport throughout the full study period.
4.3. Persistent Corridors, Scale Dependence, and Role Asymmetry
One of the clearest findings is that temporal variability does not erase structural regularity. At the ADM0 scale, a limited set of cross-border coupling corridors recurs across all rolling windows, especially the China–Indonesia, China–Myanmar, and China–Thailand pairs. This supports the interpretation of a recurrent country-level backbone embedded within a broader non-stationary network. In this study, a corridor should be understood as a repeatedly expressed directional-dependence pathway, not a resolved air-mass trajectory or a deterministic transport line [15,25].
For geographically distant pairs, such as China–Indonesia, the interpretation should be especially cautious. Their persistence should not be read as evidence of continuous direct physical transport between the two countries. Rather, such links are more plausibly interpreted as long-term regional coupling, climatological-scale co-variability, or recurrent dependence under large-scale atmospheric regimes. In contrast, geographically adjacent corridors, such as Yunnan Province, China, and Shan State, Myanmar, are more transport-relevant because of their spatial proximity and regional setting, but even these links remain statistical evidence of lagged conditional dependence rather than direct proof of physical transport.
The ADM1 results add an important layer of interpretation. National summaries capture the broad regional pattern, but they do not fully reveal which internal units repeatedly mediate or receive cross-border coupling. The persistent bidirectional corridor between Yunnan Province, China, and Shan State, Myanmar, is especially informative in this respect. It suggests that some first-order administrative units act as subnational gateways or receptor basins that remain strategically important even when the wider network reorganizes. This kind of internal heterogeneity is consistent with previous work showing that topography, synoptic structure, and regional circulation can channel pollution influence unevenly across space [30].
Role asymmetry should therefore be interpreted across scales. A country may appear influential at the ADM0 level, but that country-level role can be produced by a smaller set of subnational gateways. Likewise, importer-like behavior at national scale may reflect repeated accumulation in specific downwind provinces, border-adjacent basins, or areas where atmospheric conditions favor persistence. This scale dependence matters for interpretation because it helps prevent over-reading national aggregates when the operationally relevant coupling pathways may be concentrated in a few strategically located subnational units.
4.4. Ground-Monitoring Context and Qualitative Consistency
Official ground-monitoring records and regional haze reports provide important contextual evidence that PM2.5 and smoke-haze episodes recur across the study region. Regional haze reports from the ASEAN Specialised Meteorological Centre document recurrent hotspot and smoke-haze conditions in the Mekong sub-region, including severe haze periods and observed smoke-plume movement during dry-season episodes [31,32]. National monitoring systems also provide official PM2.5 observations, including Air4Thai in Thailand, NEA historical PM2.5 data in Singapore, and DOE-linked air-pollution datasets in Malaysia [33,34,35]. These records are essential for understanding local exposure conditions and for documenting air-quality exceedances during haze-prone periods. They also provide a practical basis for interpreting why transboundary PM2.5 remains a policy-relevant concern in Southeast Asia, as reflected in the ASEAN Second Haze-Free Roadmap 2023–2030 [36].
However, national ground-monitoring datasets differ substantially in station density, temporal continuity, measurement methods, public accessibility, and reporting formats. These differences make it difficult to construct a harmonized multi-country ground-monitoring validation dataset covering the full 2003–2024 period. For this reason, the present study uses CAMS reanalysis as the primary PM2.5 field to ensure spatially continuous and methodologically consistent regional coverage across the entire study domain. Ground-monitoring evidence is therefore best used here as qualitative corroboration of regional haze relevance rather than as a direct quantitative validation dataset for every inferred corridor.
This distinction also reflects the purpose of the framework. The objective is not to replace ground observations, transport modeling, or chemical source apportionment, but to provide a long-term structural evidence layer that can guide where more detailed validation should be prioritized. Persistent corridors and recurrent receptor basins identified by the network can help target future comparisons with ground stations, trajectory ensembles, chemical transport model simulations, fire products, and chemical composition data where available.
4.5. Robustness and Interpretive Boundaries
The reliability of the inferred structure is best described in calibrated terms. The network is not time-invariant, but neither is it random. The observed persistence across adjacent windows, together with the recurrence of the strongest country-level and ADM1 corridors, supports the view that the baseline configuration captures a meaningful backbone while still allowing regime-dependent reorganization [37,38]. Coverage-aware normalization also reduces the risk that country-level role patterns are driven mainly by unequal representation of nodes or administrative units, which is important in a domain with uneven spatial support [39,40].
At the same time, several interpretive limits remain. First, observational causal discovery is not causal proof. Even after covariate adjustment, residual confounding cannot be excluded, and inferred links should be read as conditional evidence of directional dependence under the stated assumptions rather than definitive proof of physical causation [17,41]. Second, the baseline design uses monthly aggregation and a restricted lag structure, which is suitable for long-term regional comparison but may underrepresent shorter transport episodes, synoptic-scale plume movement, or delayed processes. Third, the sign of an inferred link is estimated in an adjusted residual space, so it should not be interpreted too literally as direct transport gain or direct suppression. Finally, domain boundaries, node-to-ADM aggregation, and centroid-based corridor mapping all impose representational limits. These choices improve interpretability, but they can also smooth local gradients, introduce aggregation effects, and simplify spatial pathways that are more complex in reality [40,42,43].
The pilot calibration used in this study was designed to define a stable baseline configuration rather than to provide a full sensitivity experiment. Alternative lag structures, dependence tests, significance thresholds, and window designs may alter the density and persistence of inferred links. Therefore, the strongest claims of this paper are intentionally framed around recurrent structure under the baseline configuration, not around universal invariance across all possible model settings. A broader sensitivity assessment remains an important next step.
4.6. Implications for Monitoring, Early Warning, and Future Work
The main practical value of this framework is that it translates complex regional PM2.5 variability into an interpretable picture of persistent coupling corridors, directional asymmetry, and scale-dependent dependence. That makes it useful as a decision-support layer for regional monitoring and early warning, especially when combined with emissions data, fire products, transport modeling, ground-monitoring records, and routine forecasting systems.
A corridor-oriented monitoring strategy is a natural next step. Rather than distributing effort uniformly, recurrent corridors and recurrent receptor basins can be treated as priority zones for denser observations, event-focused validation, and targeted model experiments. This logic is consistent with the broader monitoring-network literature, which emphasizes that network design should be aligned with explicit objectives rather than simple spatial expansion alone [44].
The results also suggest that early warning should be regime-aware. Static site-level PM2.5 thresholds remain necessary, but they can be complemented by information on circulation context, ventilation conditions, biomass-burning activity, and the likelihood that specific cross-border couplings are active. In that sense, the inferred corridors can serve as situational-awareness signals that help identify when receptor areas may face elevated transboundary influence risk [45,46].
For regional governance, exporter–importer asymmetry may help structure dialog, but it should be framed carefully. These role patterns are informative for coordination, joint monitoring, and corridor-focused investigation, not for legal attribution. That distinction is important in Southeast Asia, where transboundary haze governance remains politically sensitive and operationally complex [47,48,49,50].
Future work should proceed in two directions. The first is sensitivity expansion, including alternative lag structures, dependence tests, thresholds, and window designs, to test whether the main backbone claims persist under different modeling assumptions. The second is external validation using independent evidence, such as trajectory ensembles, chemical transport model sensitivity experiments, emissions-constrained analyses, fire activity products, ground-monitoring records, and chemical composition data where available. These steps would strengthen confidence in which corridors are most robust and which should remain provisional.
5. Conclusions
This study shows that PM2.5 in Southeast Asia can be interpreted as a dynamic regional directional-coupling system rather than as a set of largely country-contained pollution problems. Across 2003–2024, cross-border links account for a substantial share of the inferred country-level network, indicating that PM2.5 variability within the study domain is strongly associated with transboundary dependence structure.
Although the network reorganizes over time, it retains a recurrent backbone of country-level coupling corridors. Persistent bidirectional dependence between China and Indonesia, China and Myanmar, and China and Thailand appear throughout the rolling-window sequence, supporting the presence of a stable country-level dependence backbone under the baseline configuration. These long-distance corridors should be interpreted as recurrent regional coupling or climatological-scale co-variability rather than direct evidence of continuous physical transport. At the subnational scale, the results reveal concentrated gateways and receptor basins that are less visible in national summaries, most notably the persistent bidirectional coupling between Yunnan Province, China, and Shan State, Myanmar.
These findings support corridor-oriented monitoring and regime-aware early warning for transboundary PM2.5 management in Southeast Asia. The inferred links should be interpreted as conditional evidence of directional dependence within the defined domain, monthly temporal resolution, and lag structure, not as mechanistic proof of physical transport or emissions-based attribution. Future work should test the stability of the main backbone under alternative lag structures, dependence tests, and window designs, and should validate the principal corridors using independent evidence such as ground-monitoring records, emissions-constrained analyses, fire products, trajectory ensembles, chemical composition data, and chemical transport modeling.
Author Contributions
Conceptualization, S.B.; methodology, S.B., T.S. and W.Z.; software, S.B.; validation, S.B., T.S. and W.Z.; formal analysis, S.B.; investigation, S.B. and O.R.-a.; resources, P.V. and A.K.; data curation, S.B. and O.R.-a.; writing—original draft preparation, S.B.; writing—review and editing, S.B., T.S., W.Z., P.V., A.K. and O.R.-a.; visualization, S.B.; supervision, S.B., T.S. and W.Z.; project administration, S.B., P.V. and A.K.; funding acquisition, S.B., P.V. and A.K. All authors have read and agreed to the published version of the manuscript.
Funding
This research was partially supported by the National Research Council of Thailand (NRCT), Fiscal Year 2025, Contract No. N84A680775, the Faculty Publication Support Research Grant for academic staff, Faculty of Social Sciences, Kasetsart University, Fiscal Year 2026, and by the Faculty of Environment, Kasetsart University, Fiscal Year 2026. The funders had no role in the study design; in the collection, analysis, or interpretation of data; in the writing of the manuscript; or in the decision to submit the article for publication.
Institutional Review Board Statement
Not applicable.
Informed Consent Statement
Not applicable.
Data Availability Statement
The reanalysis datasets used in this study are publicly available from the Copernicus Atmosphere Monitoring Service and the Copernicus Climate Data Store. The processed analysis-ready datasets and code supporting this study will be deposited in a public repository upon acceptance. Until then, they are available from the corresponding author upon reasonable request.
Acknowledgments
The authors gratefully acknowledge the Copernicus Atmosphere Monitoring Service (CAMS) and the European Centre for Medium-Range Weather Forecasts (ECMWF) for providing the reanalysis datasets used in this study.
Conflicts of Interest
The authors declare no conflicts of interest.
Appendix A
Table A1.
Study domain and rolling-window causal analysis configuration.
Appendix B
Table A2.
PCMCI link strength and p-value distributions (node-level links; representative windows).
Appendix C
Table A3.
Node coverage by country within the analysis domain.
Table A4.
Normalized exporter/importer metrics to account for unequal node coverage (ADM0). Per node = mean metric ÷ number of land nodes in the ADM0 unit.
References
- Gu, Y.; Fang, T.; Yim, S.H.L. Source emission contributions to particulate matter and ozone, and their health impacts in Southeast Asia. Environ. Int. 2024, 186, 108578. [Google Scholar] [CrossRef] [PubMed]
- Taghizadeh-Hesary, F.; Taghizadeh-Hesary, F. The impacts of air pollution on health and economy in Southeast Asia. Energies 2020, 13, 1812. [Google Scholar] [CrossRef]
- Yap, C.K.; Setyawan, A.D. Transboundary air pollution in Southeast Asia, 2000–2025: A bibliometric map and strategic roadmap for governance and resilience. Southeast Asia Dev. Res. 2025, 1, 69–88. [Google Scholar] [CrossRef]
- Shi, Y.; Matsunaga, T.; Yamaguchi, Y.; Li, Z.; Gu, X.; Chen, X. Long-term trends and spatial patterns of satellite-retrieved PM2.5 concentrations in South and Southeast Asia from 1999 to 2014. Sci. Total Environ. 2018, 615, 177–186. [Google Scholar] [CrossRef]
- Shi, Y.; Matsunaga, T.; Yamaguchi, Y.; Zhao, A.; Zang, S.; Li, Z.; Yu, T.; Gu, X. Underlying causes of PM2.5-induced premature mortality and potential health benefits of air pollution control in South and Southeast Asia from 1999 to 2014. Environ. Int. 2018, 121, 814–823. [Google Scholar] [CrossRef]
- Cheong, K.H.; Ngiam, N.J.; Morgan, G.G.; Pek, P.P.; Tan, B.Y.Q.; Lai, J.W.; Koh, J.M.; Ong, M.E.H.; Ho, A.F.W. Acute health impacts of the Southeast Asian transboundary haze problem: A review. Int. J. Environ. Res. Public Health 2019, 16, 3286. [Google Scholar] [CrossRef] [PubMed]
- Phung, V.L.H.; Uttajug, A.; Ueda, K.; Yulianti, N.; Latif, M.T.; Naito, D. A scoping review on the health effects of smoke haze from vegetation and peatland fires in Southeast Asia: Issues with study approaches and interpretation. PLoS ONE 2022, 17, e0274433. [Google Scholar] [CrossRef] [PubMed]
- Amnuaylojaroen, T.; Parasin, N. Perspective on particulate matter: From biomass burning to the health crisis in mainland Southeast Asia. Toxics 2023, 11, 553. [Google Scholar] [CrossRef]
- Thunis, P.; Clappier, A.; Tarrason, L.; Cuvelier, C.; Monteiro, A.; Pisoni, E.; Wesseling, J.; Belis, C.A.; Pirovano, G.; Janssen, S.; et al. Source apportionment to support air quality planning: Strengths and weaknesses of existing approaches. Environ. Int. 2019, 130, 104825. [Google Scholar] [CrossRef]
- Nguyen, L.S.P.; Chang, J.H.-W.; Griffith, S.M.; Hien, T.T.; Kong, S.S.-K.; Le, H.N.; Huang, H.-Y.; Sheu, G.-R.; Lin, N.-H. Trans-boundary air pollution in a Southeast Asian megacity: Case studies of the synoptic meteorological mechanisms and impacts on air quality. Atmos. Pollut. Res. 2022, 13, 101366. [Google Scholar] [CrossRef]
- Chang, C.; Wang, Z.; McBride, J.; Liu, C. Annual cycle of Southeast Asia-Maritime Continent rainfall and the asymmetric monsoon transition. J. Clim. 2005, 18, 287–301. [Google Scholar] [CrossRef]
- Hou, P.; Wu, S.; McCarty, J.L.; Gao, Y. Sensitivity of atmospheric aerosol scavenging to precipitation intensity and frequency in the context of global climate change. Atmos. Chem. Phys. 2018, 18, 8173–8182. [Google Scholar] [CrossRef]
- Houdou, A.; El Badisy, I.; Khomsi, K.; Abdala, S.A.; Abdulla, F.; Najmi, H.; Obtel, M.; Belyamani, L.; Ibrahimi, A.; Khalis, M. Interpretable machine learning approaches for forecasting and predicting air pollution: A systematic review. Aerosol Air Qual. Res. 2024, 24, 230151. [Google Scholar] [CrossRef]
- Li, J.; Fan, W.; Wu, J.; Han, Z.; Li, J.; Zhang, C.; Liang, L. Impacts of open biomass burning in Southeast Asia on atmospheric PM2.5 concentrations over South China from 2009 to 2018. Atmos. Environ. 2024, 327, 120491. [Google Scholar] [CrossRef]
- Liu, J.; Ho, H.C. A framework for characterizing the multilateral and directional interaction relationships between PM pollution at city scale: A case study of 29 cities in East China, South Korea and Japan. Front. Public Health 2022, 10, 875924. [Google Scholar] [CrossRef] [PubMed]
- Chen, X.; Hu, Y.; Dong, F.; Chen, K.; Xia, H. A multi-graph spatial-temporal attention network for air-quality prediction. Process Saf. Environ. Prot. 2024, 181, 442–451. [Google Scholar] [CrossRef]
- Runge, J.; Nowack, P.; Kretschmer, M.; Flaxman, S.; Sejdinovic, D. Detecting and quantifying causal associations in large nonlinear time series datasets. Sci. Adv. 2019, 5, eaau4996. [Google Scholar] [CrossRef]
- Runge, J.; Bathiany, S.; Bollt, E.; Camps-Valls, G.; Coumou, D.; Deyle, E.; Glymour, C.; Kretschmer, M.; Mahecha, M.D.; Muñoz-Marí, J.; et al. Inferring causation from time series in Earth system sciences. Nat. Commun. 2019, 10, 2553. [Google Scholar] [CrossRef]
- Inness, A.; Ades, M.; Agustí-Panareda, A.; Barré, J.; Benedictow, A.; Blechschmidt, A.-M.; Dominguez, J.J.; Engelen, R.; Eskes, H.; Flemming, J.; et al. The CAMS reanalysis of atmospheric composition. Atmos. Chem. Phys. 2019, 19, 3515–3556. [Google Scholar] [CrossRef]
- Hersbach, H.; Bell, B.; Berrisford, P.; Hirahara, S.; Horányi, A.; Muñoz-Sabater, J.; Nicolas, J.; Peubey, C.; Radu, R.; Schepers, D.; et al. The ERA5 global reanalysis. Q. J. R. Meteorol. Soc. 2020, 146, 1999–2049. [Google Scholar] [CrossRef]
- Copernicus Climate Change Service (C3S). Climate Data Store (CDS) [Dataset]. 2018. Available online: https://cds.climate.copernicus.eu/datasets/reanalysis-era5-single-levels?tab=overview (accessed on 10 February 2026).
- L’Heureux, M.L.; Tippett, M.K.; Wheeler, M.C.; Nguyen, H.; Narsey, S.; Johnson, N.; Hu, Z.-Z.; Watkins, A.B.; Lucas, C.; Ganter, C.; et al. A relative sea surface temperature index for classifying ENSO events in a changing climate. J. Clim. 2024, 37, 1197–1211. [Google Scholar] [CrossRef]
- Runfola, D.; Anderson, A.; Baier, H.; Crittenden, M.; Dowker, E.; Fuhrig, S.; Goodman, S.; Grimsley, G.; Layko, R.; Melville, G.; et al. geoBoundaries: A global database of political administrative boundaries. PLoS ONE 2020, 15, e0231866. [Google Scholar] [CrossRef]
- Goldie, J. Country Centroids: V2024-05-02 [Dataset]. Zenodo. 2024. Available online: https://zenodo.org/records/11100230 (accessed on 10 February 2026).
- Kobayashi, T.; Takaguchi, T.; Barrat, A. The structured backbone of temporal social ties. Nat. Commun. 2019, 10, 220. [Google Scholar] [CrossRef] [PubMed]
- Kim, P.S.; Jacob, D.J.; Mickley, L.J.; Koplitz, S.N.; Marlier, M.E.; DeFries, R.S.; Myers, S.S.; Chew, B.N.; Mao, Y.H. Sensitivity of population smoke exposure to fire locations in Equatorial Asia. Atmos. Environ. 2015, 102, 11–17. [Google Scholar] [CrossRef]
- Reid, J.S.; Hyer, E.J.; Johnson, R.S.; Holben, B.N.; Yokelson, R.J.; Zhang, J.; Campbell, J.R.; Christopher, S.A.; Di Girolamo, L.; Giglio, L.; et al. Observing and understanding the Southeast Asian aerosol system by remote sensing: An initial review and analysis for the Seven Southeast Asian Studies (7SEAS) program. Atmos. Res. 2013, 122, 403–468. [Google Scholar] [CrossRef]
- Amnuaylojaroen, T.; Inkom, J.; Janta, R.; Surapipith, V. Long range transport of Southeast Asian PM2.5 pollution to Northern Thailand during high biomass burning episodes. Sustainability 2020, 12, 10049. [Google Scholar] [CrossRef]
- Inlaung, K.; Chotamonsak, C.; Macatangay, R.; Surapipith, V. Assessment of transboundary PM2.5 from biomass burning in Northern Thailand using the WRF-Chem model. Toxics 2024, 12, 462. [Google Scholar] [CrossRef]
- Zhu, S.; Wang, Z.; Qu, K.; Xu, J.; Zhang, J.; Yang, H.; Wang, W.; Sui, X.; Wei, M.; Liu, H. Spatial characteristics and influence of topography and synoptic systems on PM2.5 in the Eastern Monsoon Region of China. Aerosol Air Qual. Res. 2023, 23, 220393. [Google Scholar] [CrossRef]
- ASEAN Specialised Meteorological Centre. Review of Regional Haze Situation for March 2024. Available online: https://asmc.asean.org/haze-review-of-regional-haze-situation-for-march-2024 (accessed on 10 May 2026).
- ASEAN Specialised Meteorological Centre. Review of Regional Haze Situation for April 2024. Available online: https://asmc.asean.org/haze-review-of-regional-haze-situation-for-april-2024/ (accessed on 10 May 2026).
- Pollution Control Department, Thailand. Air Quality from Hourly Average PM2.5 Concentrations from Air4Thai Automatic Air-Quality Monitoring Stations. Available online: https://envilink.go.th/dataset/air-quality-pm2point5 (accessed on 10 May 2026).
- National Environment Agency. Historical PM2.5 (2024) [Dataset]. data.gov.sg. 2025. Available online: https://data.gov.sg/collections/2216/view (accessed on 10 May 2026).
- Department of Statistics Malaysia; Department of Environment Malaysia. Monthly Air Pollution [Dataset]. OpenDOSM. 2023. Available online: https://open.dosm.gov.my/data-catalogue/air_pollution (accessed on 10 May 2026).
- ASEAN Secretariat. The Second Roadmap for ASEAN Cooperation on Transboundary Haze Pollution Control with Means of Implementation; ASEAN Secretariat: Jakarta, Indonesia, 2024; Available online: https://asean.org/wp-content/uploads/2024/09/The-Second-Haze-Free-Roadmap-2023-2030.pdf (accessed on 10 May 2026).
- Miersch, P.; Günther, W.; Runge, J.; Zscheischler, J. Evaluating the robustness of PCMCI+ for causal discovery of flood drivers. Artif. Intell. Earth Syst. 2025, 4, 240114. [Google Scholar] [CrossRef]
- Qing, T.; Wang, F.; Li, Q.; Dong, G.; Tian, L.; Havlin, S. Time persistence of climate and carbon flux networks. Commun. Phys. 2024, 7, 372. [Google Scholar] [CrossRef]
- Hsieh, C.-S.; Hsu, Y.-C.; Ko, S.I.M.; Kovářík, J.; Logan, T.D. Non-representative sampled networks: Estimation of network structural properties by weighting. J. Econom. 2024, 240, 105689. [Google Scholar] [CrossRef]
- Lee, D.; Robertson, C.; Ramsay, C.; Pyper, K. Quantifying the impact of the modifiable areal unit problem when estimating the health effects of air pollution. Environmetrics 2020, 31, e2643. [Google Scholar] [CrossRef]
- Gong, C.; Zhang, C.; Yao, D.; Bi, J.; Li, W.; Xu, Y. Causal discovery from temporal data: An overview and new perspectives. ACM Comput. Surv. 2024, 57, 100. [Google Scholar] [CrossRef]
- Borge, R.; López, J.; Lumbreras, J.; Narros, A.; Rodríguez, E. Influence of boundary conditions on CMAQ simulations over the Iberian Peninsula. Atmos. Environ. 2010, 44, 2681–2695. [Google Scholar] [CrossRef]
- Wood, J.; Dykes, J.; Slingsby, A. Visualisation of origins, destinations and flows with OD maps. Cartogr. J. 2010, 47, 117–129. [Google Scholar] [CrossRef]
- Verghese, S.; Nema, A.K. Optimal design of air quality monitoring networks: A systematic review. Stoch. Environ. Res. Risk Assess. 2022, 36, 2963–2978. [Google Scholar] [CrossRef]
- Vongruang, P.; Suppoung, K.; Kirtsaeng, S.; Prueksakorn, K.; Thao, P.T.B.; Pimonsree, S. Development of meteorological criteria for classifying PM2.5 risk in a coastal industrial province in Thailand. Aerosol Air Qual. Res. 2024, 24, 230321. [Google Scholar] [CrossRef]
- Lai, H.-C.; Dai, Y.-T.; Mkasimongwa, S.W.; Hsiao, M.-C.; Lai, L.-W. The impact of atmospheric synoptic weather condition and long-range transportation of air mass on extreme PM10 concentration events. Atmosphere 2023, 14, 406. [Google Scholar] [CrossRef]
- Heilmann, D. After Indonesia’s ratification: The ASEAN Agreement on Transboundary Haze Pollution and its effectiveness as a regional environmental governance tool. J. Curr. Southeast Asian Aff. 2015, 34, 95–121. [Google Scholar] [CrossRef]
- Muhammad, F. Environmental agreement under the non-interference principle: The case of ASEAN agreement on transboundary haze pollution. Int. Environ. Agreem. 2022, 22, 139–155. [Google Scholar] [CrossRef]
- Forsyth, T. Public concerns about transboundary haze: A comparison of Indonesia, Singapore, and Malaysia. Glob. Environ. Change 2014, 25, 76–86. [Google Scholar] [CrossRef]
- Putra, B.A. The politics of environmental policy: Haze pollution, ASEAN, and the way forward. Front. Sustain. Cities 2025, 6, 1417746. [Google Scholar] [CrossRef]

Disclaimer/Publisher’s Note: The statements, opinions and data contained in all publications are solely those of the individual author(s) and contributor(s) and not of MDPI and/or the editor(s). MDPI and/or the editor(s) disclaim responsibility for any injury to people or property resulting from any ideas, methods, instructions or products referred to in the content. |
© 2026 by the authors. Licensee MDPI, Basel, Switzerland. This article is an open access article distributed under the terms and conditions of the Creative Commons Attribution (CC BY) license.