


Abstract
PM2.5 and near-surface O3 compound pollution is a major challenge for further air quality improvement in the Yangtze River Delta (YRD). Despite research on the chemical coupling mechanisms and concentration co-variation between PM2.5 and O3, the directional linkages of compound pollution events among cities and the network mechanisms underlying their formation remain unclear. Here, we identified PM2.5–O3 compound pollution events for 41 YRD cities from 2015 to 2024 using city-year-specific P80 dual-threshold criteria. We then constructed annual directed synchronization networks based on event-leading relationships and used temporal exponential random graph models to identify the formation mechanisms of significant leading ties. PM2.5–O3 compound pollution events in the YRD generally decreased during 2015–2024, with characteristics shifting from high frequency, persistence, and strong intercity linkage in the early stage to lower frequency, weaker intensity, and continued episodic fluctuations. Directed event networks exhibited a clear stage-dependent evolution: network density, total edge weight, reciprocity, and local closure were relatively high during 2015–2018, networks became markedly sparse during 2020–2022, and a partial rebound occurred after 2023. Spatial backbone analysis indicated reorganization of the dominant linkage structure, shifting from the Shanghai–southern Jiangsu–northern Zhejiang coastal core toward the northern Jiangsu, Anhui, and interprovincial corridors. Key node analysis further revealed a clear functional differentiation among cities, with some cities acting as potential leading sources, some as receiving nodes, and several non-traditional core cities serving as cross-regional bridges. Significant leading ties were jointly shaped by reciprocity, local closures, temporal memory, economic development, industrial structure, and digital governance. Therefore, as well as a problem of co-occurrence, PM2.5–O3 compound pollution in the YRD is a cross-city event-network process characterized by directionality, stage-dependent evolution, and differentiated urban roles. This study provides empirical evidence for dynamic joint prevention and control based on event linkages, urban roles, and cross-city coordination.
1. Introduction
Compound pollution involving fine particulate matter (PM2.5) and near-surface ozone (O3) has become a major bottleneck to air quality improvement in the Yangtze River Delta (YRD) since the 14th Five-Year Plan period [1,2]. Since the implementation of China’s Air Pollution Prevention and Control Action Plan in 2013, annual mean PM2.5 concentrations in the YRD have declined, indicating substantial progress in regional particulate pollution control. However, O3 pollution has become increasingly prominent, with O3 concentrations rising in some cities and high-O3 episodes increasingly overlapping with high-PM2.5 episodes during transitional seasons, such as late spring and early summer, resulting in “double-high” compound pollution [3,4]. Compared to single-pollutant pollution, PM2.5–O3 compound pollution may pose heightened risks to human health and ecosystems [5]. This type of pollution often involves same-day co-exposure, cross-city linkages, and phased propagation, meaning that governance boundaries frequently extend beyond individual administrative jurisdictions [6,7].
From the perspective of chemical mechanisms, existing studies on O3 photochemical formation, aerosol–radiation interactions, and O3 precursor sensitivity in China have shown that PM2.5 and O3 are not independent pollutants. Instead, they are interconnected through common precursors, photochemical reactions, and meteorological feedback [8,9,10]. Driven by solar radiation and photochemical reactions, VOC oxidation contributes to O3 production and, through reaction pathways involving hydroxyl radicals, promotes the formation of secondary organic aerosols, thereby affecting PM2.5 [8]. High PM2.5-loading may alter the near-surface photochemical environment through aerosol scattering and absorption, changes in the radiation budget, and boundary-layer feedbacks, producing complex and even non-linear effects on O3 formation [9]. In the YRD, O3 formation is often characterized by VOC-limited or transitional regimes. Therefore, reducing NOx alone may lead to an O3 rebound risk in some core urban areas [4,10]. PM2.5 and O3 attainment targets set separately by administrative units may fail to adequately address the coupling between precursors and secondary products, as well as their non-linear responses. Accordingly, research should identify the key pathways and priority control areas of PM2.5–O3 compound pollution—as well as the different responsibilities of each city—from the perspectives of regional synchronization and cross-city pollution processes.
However, existing network-based studies and related methods on PM2.5–O3 compound pollution linkages have mostly focused on characterizing whether pollution variations across different cities are synchronized based on concentration correlations or event-synchronization indicators. Common approaches include constructing correlation networks, undirected association networks, or event-synchronization networks [11,12]. Studies based on concentration correlations or undirected synchronization metrics can reveal whether pollution variations among cities are synchronized and can also reflect the strength of intercity associations. However, because they usually do not explicitly characterize the temporal ordering of event occurrence, it remains difficult to further determine which cities are statistically more likely to act as event-leading cities and which cities are more likely to act as event-lagging cities.
In terms of identifying directionality, Event Coincidence Analysis (ECA) and related event-synchronization methods have been applied to climate and hydrological extreme-event studies to detect lead-lag responses and teleconnection structures among event sequences at different locations [13,14,15]. Meanwhile, Temporal Exponential Random Graph Models (TERGMs) have been widely used in dynamic network research, as they can simultaneously account for endogenous network structures, temporal dependence, and the effects of exogenous covariates on edge formation within a unified framework [16,17,18]. Overall, however, few studies have integrated compound pollution event identification, event-scale directed network construction, and the TERGM dynamic network explanatory framework to analyze why compound pollution event network relationships form, how they persist, and how meteorological conditions, emission characteristics, and spatial proximity jointly affect intercity linkages.
Therefore, although existing studies have extensively discussed the coupling between PM2.5 and O3 from the perspective of chemical mechanisms, a comprehensive analytical framework that can simultaneously characterize event directionality, dynamic network evolution, and edge-formation mechanisms is still lacking. This also means that joint prevention and control (JPC) still lacks sufficiently clear and operational evidence for determining priority control cities, identifying cross-city linkage pathways, and formulating dynamic response strategies.
To address these gaps, we identified the event-scale directional linkages of PM2.5–O3 compound pollution for the YRD urban agglomeration from 2015 to 2024. We then analyzed the network structure and formation mechanisms of these linkages. Specifically, we first transformed the continuous PM2.5 and O3 concentration series into a compound pollution event series. Compound pollution events were identified using within-city P80 dual-threshold criteria (80th percentiles of PM2.5 and O3 series), and event declustering was applied to reduce the influence of continuous pollution episodes on event independence. Accordingly, a leading-matching method with a fixed time window τ was used to identify lead–lag relationships among compound pollution events across cities, and statistically significant directional ties were retained through significance testing. We then constructed annual directed synchronization networks of PM2.5–O3 pollution events in the YRD for 2015–2024. Finally, a TERGM framework was applied to explain the formation, persistence, and dissolution mechanisms of significant leading ties.
The research design included three levels of analysis. First, we characterized the stage-dependent evolution of annual directed synchronization networks of PM2.5–O3 pollution events in the YRD, identifying changes in the overall connectivity, spatial backbones, and major linkage pathways across different pollution-control stages. Second, from the perspective of node roles, we examined functional differences among cities in the compound pollution linkage network and identified potential pollution output, input, and cross-regional bridging nodes. Third, after controlling for network structure and historical persistence, we analyzed how spatial proximity, economic development, industrial structure, urban attributes, and digital governance were associated with the formation of significant leading ties. As a result, this study advances PM2.5–O3 pollution research from concentration co-occurrence and correlation descriptions for event-linkage identification, urban role classification, and mechanism interpretation for coordinated governance.
Compared to previous studies, the marginal contributions of this study are threefold. First, in the context of PM2.5–O3 pollution in the YRD, we constructed an event-scale directed network that was comparable across years and capable of distinguishing directionality. Compared with studies based on concentration correlations or undirected association structures, this framework not only characterizes whether compound pollution events are synchronized among cities but also further identifies potential output, input, and bridging cities, providing more targeted evidence for responsibility allocation and priority setting in regional joint prevention and control. Second, event declustering, fixed-lag event coincidence analysis, and circular-shift surrogate significance testing were combined to minimize the pseudo-synchronization caused by synoptic-scale common forcing and continuous pollution episodes. Annual networks also provide an empirical basis for comparing regional pollution linkages across different policy stages, including the Air Pollution Prevention and Control Action Plan, Blue Sky Protection Campaign, and 14th Five-Year Plan period of coordinated governance. Third, the TERGM framework incorporates endogenous network structures, temporal memory, and spatial- and city-level covariates, including digital governance. This extends the descriptive analysis of event-synchronization networks to a statistical explanation of tie formation mechanisms. Through this design, we not only identify which cities are connected by significant leading relationships but also examine why these relationships form, how they persist, and under what conditions they change, thereby providing empirical evidence for differentiated emission reduction, cross-city warning systems, and information coordination.
The remainder of this paper is organized as follows: Section 2 introduces the study area and data sources, identification of PM2.5–O3 compound pollution events, and construction of directed synchronization networks, network indicators, and TERGM specifications. Section 3 reports changes in the scale of compound pollution events, overall network evolution, spatial backbones in representative years, key urban nodes, TERGM estimates, and goodness-of-fit diagnostics. Section 4 discusses the chemical–physical interpretation, urban role differentiation, and mechanisms of significant leading tie formation revealed by the TERGM. Section 5 presents the conclusions and policy recommendations for the coordinated governance of PM2.5–O3 pollution in the YRD.
2. Materials and Methods
2.1. Study Area and Data
This study focuses on the YRD urban agglomeration and includes 41 prefecture-level cities in Shanghai, Jiangsu, Zhejiang, and Anhui provinces. Air pollutant concentrations were obtained from urban air quality monitoring data released by the China National Environmental Monitoring Centre, covering the period from 1 January 2015, to 31 December 2024. As PM2.5 and near-surface O3 are the core pollutants targeted by recent compound pollution control measures in the YRD, we selected PM2.5 and O3 as the main pollutants of interest and constructed a city-level daily panel dataset based on hourly observations from urban monitoring stations. Specifically, PM2.5 concentrations were represented by daily mean values calculated from hourly concentrations, whereas O3 concentrations were represented by the maximum daily 8-h average. These processing procedures are consistent with the evaluation requirements for PM2.5 and O3 concentrations specified in China’s Ambient Air Quality Standards (GB 3095-2012) and Technical Regulation on Ambient Air Quality Index (on trial) (HJ 633-2012) [19,20]. The concentrations of both pollutants are expressed in μg/m3.
In subsequent analyses, daily PM2.5 and O3 concentrations were not simply aggregated into annual mean values. Instead, the daily pollution series from 2015 to 2024 was divided by calendar year, and PM2.5–O3 compound pollution events were independently identified within each year. Year-specific directed event networks were then constructed. Therefore, the annual networks are event networks derived from daily event sequences within each year rather than correlation networks based on annual mean concentrations.
In addition to air pollutant data, we collected variables related to urban socioeconomic conditions, industrial structure, population agglomeration, and digital governance for the subsequent TERGM analysis. Socioeconomic variables included the per capita gross regional product (PGDP), permanent resident population size, and registered urban unemployment rate. Industrial structure variables included the shares of secondary and tertiary industry value-added, from which an industrial structure upgrading index was constructed. A population agglomeration variable was used to characterize the spatial concentration of the urban population, whereas a digital governance variable (Dig) was used to capture the level of urban digital governance. City-level attribute data were obtained from the China City Statistical Yearbook, provincial and municipal statistical yearbooks, city statistical bulletins, relevant policy documents, and publicly available databases. All city-level attribute variables were matched to the network data by city and year to explain the formation mechanisms of significant leading relationships among cities.
2.2. Identification of PM2.5–O3 Compound Pollution Events
To identify the directional linkages of PM2.5–O3 pollution events among cities in the YRD, we first transformed a continuous pollutant concentration series into an event series. Because cities differ substantially in terms of baseline pollution levels, emission structures, and meteorological backgrounds, we identified compound pollution events using city-year-specific relative thresholds rather than a uniform absolute concentration threshold. This approach helps to reduce the influence of intercity differences in baseline pollution levels on event identification and improves the comparability of compound pollution events across cities.
Specifically, we let and denote the daily mean PM2.5 and O3 maximum daily 8-h average values, respectively, for city on day . For each city and calendar year, the 80th percentiles of PM2.5 and O3 series were calculated separately and denoted as and , respectively. A given day was identified as a candidate PM2.5–O3 compound pollution event if both PM2.5 and O3 exceeded their corresponding city-year-specific P80 thresholds:
where is an indicator function that equals 1 if the condition inside the parentheses is satisfied and 0 otherwise. The P80 dual-threshold criterion is valuable for identifying compound pollution episodes in which PM2.5 and O3 are simultaneously elevated relative to the city’s annual pollution distribution, rather than for determining whether a given day meets a statutory pollution grade.
To further characterize the relative intensity of compound pollution events, we standardized the PM2.5 and O3 series for each city-year, and calculated the combined intensity for each candidate event day. We let and denote standardized PM2.5 and O3 concentrations, respectively, then defined the compound pollution event intensity as follows:
This indicator reflects the degree to which the two pollutants were jointly elevated on the same day and was used for subsequent event declustering and selection of representative event days.
Because a single compound pollution episode may last for several consecutive days, treating all consecutive exceedance days as independent events could lead to repeated counting of the same pollution episode and artificially amplify the intercity event synchronization. Therefore, event declustering was applied to candidate events. Consecutive candidate events within the same city with an interval of no more than one day were assigned to the same compound pollution event cluster. Within each event cluster, the day with the highest combined intensity was retained as the representative day of the compound pollution event. If multiple days had the same intensity, the first day was retained. After event declustering, each city in each year had a relatively independent sequence of PM2.5–O3 pollution event dates, which provided the basis for subsequent event-leading matching and directed network construction.
2.3. Construction of Event-Scale Directed Synchronization Networks
After obtaining the declustered PM2.5–O3 compound pollution event sequences for each city, we adopted the concept of event coincidence analysis [7] to identify directional leading relationships among compound pollution events across cities and construct annual directed synchronization networks. If a compound pollution event in city i was followed by a compound pollution event in city within a short time window, and this lead–lag response was significantly more frequent than expected under random conditions, we regarded the event as a directional event linkage from city to city .
We let and denote the declustered compound pollution event date sequences of cities and in year , respectively. In this study, the maximum lag window was set to days. For an event day in city , if an event day in city satisfies , then the compound pollution event in city is considered to lead-match a compound pollution event in city . To avoid repeated matching of the same event, we applied a nearest-neighbor matching rule; thus, each event can participate in only one match in a given direction. This procedure yields the number of leading matches from city to city , denoted as . Here, represents the event-matching intensity with which city leads city in year . Because we separately calculated the matching counts for the two directions, and , and were not necessarily equal. In other words, the edges in the network are directional and can capture the lead–lag responses of compound pollution events among cities.
In addition, compound pollution events across cities may be influenced by regional meteorological conditions, seasonal variations, and common emission activities. Therefore, temporal proximity between events alone cannot be considered as evidence of a stable directional linkage. To address this issue, we further applied a circular-shift surrogate method to test the significance of edge weights. Specifically, within each year, the event sequence of one city was fixed, whereas that of the other city shifted circularly. This procedure was repeated times, and the leading match count for each city pair was recalculated after each random shift to generate a null distribution of edge weights. The observed edge weight was then compared with the surrogate distribution to calculate the empirical -value as follows:
where denotes the edge weight obtained from the -th surrogate random shift, is the number of random repetitions, and is an indicator function. This empirical -value represents the probability of obtaining an edge weight that is no smaller than the observed edge weight under random conditions. A smaller indicates that the event-matching relationship in which city leads city is less likely to be caused by random synchronization.
Because directional relationships among multiple city pairs were tested simultaneously, we applied the Benjamini–Hochberg false discovery rate procedure to reduce the risk of false positives caused by multiple testing. A directional edge from city to city was retained in the annual network only if its empirical -value passed the specified significance threshold after false discovery rate correction. Finally, the annual directed network was represented as a binary adjacency matrix.
Here, indicates that city has a significant leading relationship with city in terms of compound pollution events in year , and indicates that no significant directional edge exists. Accordingly, directed synchronization networks of PM2.5–O3 pollution events were constructed for 2015–2024. The network nodes represent the 41 cities in the YRD, the directed edges represent significant intercity-leading relationships of compound pollution events, and the edge weight describes the intensity of each leading relationship.
It should be noted that the directed links constructed in this study represent statistically inferred associations based on the temporal ordering of compound pollution events and significance testing, rather than physical atmospheric transport pathways or direct causal relationships. In other words, a significant directed edge from city i to city j indicates that PM2.5–O3 compound pollution events in city i statistically tend to precede those in city j within the specified lag window, and that this leading relationship is unlikely to arise from random synchronization. However, the underlying mechanisms may involve shared meteorological forcing, similar emission rhythms, photochemical processes, actual atmospheric transport, or their combined effects. Therefore, the directed event network is used here to identify statistical event-linkage patterns and potential targets for coordinated control, rather than to infer deterministic source–receptor relationships or physical transport pathways.
2.4. Network Indicators and TERGM Specification
After constructing the annual directed synchronization networks of PM2.5–O3 compound pollution events for 2015–2024, we first characterized the network structure from two perspectives: overall network properties and node roles. At the overall network level, we calculated indicators such as network density, number of non-zero edges, average edge weight, proportion of reciprocal ties, and network connectivity to describe the overall strength and complexity of the directional linkages among compound pollution events in the YRD. Network density represents the proportion of significant leading ties among all possible directed ties in an annual network. The number of non-zero edges and the average edge weight reflect the quantity and intensity of significant event linkages within a region, whereas the proportion of reciprocal ties measures whether city pairs exhibit bidirectional leading relationships or mutual responses.
At the node level, we calculated the in-degree, out-degree, in-strength, out-strength, and betweenness centralities. Out-degree and out-strength were used to characterize the extent to which a city acts as a potential output node, that is, the degree to which its compound pollution events lead to events in other cities. In-degree and in-strength were used to characterize the extent to which a city acts as a potential input node, that is, the degree to which its compound pollution events lag behind those of other cities. Betweenness centrality was used to identify bridging nodes connecting different cities or pollution linkage pathways. These indicators were used to further distinguish between output-, input-, and bridging-type cities in the compound pollution event network, providing a basis for subsequent coordinated governance zoning and identification of priority control cities.
Network indicators can reveal the structural characteristics of intercity compound pollution event linkages, but cannot explain why significant leading ties form, or whether such ties are jointly shaped by network structure, temporal memory, and city attributes. Therefore, we used the TERGM to analyze the formation mechanisms of annual directed networks; this model treats dynamic networks as a sequence of networks that evolve over time and can incorporate endogenous network structures, temporal dependence terms, and exogenous covariates within a unified framework. Therefore, the TERGM is suitable for explaining the tie formation process in our year-specific directed event networks.
We let denote the directed synchronization network of PM2.5–O3 compound pollution events in year . indicates that city has a significant leading relationship with city in year , whereas indicates that no significant leading relationship exists. Conditional on the previous network state, the TERGM can be expressed as follows:
where is the vector of parameters to be estimated, and is the vector of network statistics, including endogenous network structural terms, temporal dependence terms, and exogenous covariates. denotes city attributes and dyadic covariates in year , and is the normalizing constant that ensures that the probabilities of all possible networks (), conditional on the previous network () and covariates (), sum to one. In other words, this constant makes the TERGM a valid probability distribution, although its closed form is usually not directly computed in model estimation. Given the annual network setting of this study, we adopted a first-order Markov dependence structure, assuming that formation of the current-year network was predominantly influenced by the network state of the previous year.
Regarding the specifications of the model statistics, we first included the edge term to capture the baseline tendency of the network to form significant leading ties. As the intercity linkages of air pollution events may involve mutual responses and regional co-fluctuations, the mutual term was further included to test whether the two cities were more likely to form bidirectional leading relationships. Additionally, geometrically weighted shared partner terms were incorporated, including geometrically weighted edgewise shared partners (gwesp) and geometrically weighted dyadwise shared partners (gwdsp), to capture transitive closure, clustering structures, and higher-order network dependence. Compared to directly including multiple higher-order structural terms, geometrically weighted terms can characterize network closure while reducing the risk of model degeneracy.
To capture the temporal persistence of network relationships, a memory term was introduced. This term tests whether significant leading ties that already existed in the previous year are more likely to reappear in the current year. A significantly positive coefficient of the memory term indicates that the directional linkages of compound pollution events among cities exhibit path dependence or stability. If the coefficient is insignificant or negative, significant leading relationships are more likely to show stage-dependent changes or annual reorganization.
In addition to the endogenous network structures and temporal dependence terms, we included spatial- and city-level covariates to explain the external drivers of significant leading ties. The spatial covariates included the spatial adjacency matrix and intercity distance matrix, which were used to characterize the effects of geographic proximity and distance decay on the directional linkages of compound pollution events. City-level attribute variables included the PGDP, permanent resident population size, registered urban unemployment rate, industrial structure variables, the industrial structure upgrading index, population agglomeration, and the Dig index. These variables represent urban economic development, population activity intensity, socioeconomic operating conditions, industrial emission bases, industrial transformation, population concentration, and digital governance capacity.
The digital governance variable (Dig) was used to characterize urban digital governance capacity. It was constructed based on publicly available policy documents and pilot-city lists, including smart-city, digital-government, information-service, and e-government pilot programs or policy initiatives at the national and local levels. If a city had been included in a relevant digital governance or smart-city pilot program, or had issued explicit digital-government construction policies in a given year, the city-year observation was coded as 1; otherwise, it was coded as 0. This variable is intended to capture the digital governance foundation related to environmental monitoring, information sharing, pollution early warning, and cross-departmental coordination.
As we examined directed networks, city-level attribute variables entered the TERGM in three forms: sender effects, receiver effects, and dyadic difference effects. Sender effects are used to test whether a given attribute affects the likelihood of a city becoming an output node in compound pollution event linkages. Receiver effects were used to test whether a given attribute affected the likelihood of a city becoming an input node. Dyadic difference effects were used to examine whether similarities or differences between two cities in a given attribute influenced the formation of significant leading ties. The general forms of these effects are expressed as follows:
where and denote a specific attribute variable for city and in year , respectively. A positive coefficient of the sender effect indicates that cities with higher values of this attribute are more likely to form significant leadership ties with other cities. A positive coefficient of the receiver effect indicates that cities with higher values for this attribute are more likely to become the receivers of significant leading relationships. A negative coefficient of the dyadic difference effect suggests that cities with similar attribute values are more likely to form significant leading ties, reflecting their homophilous linkages. Conversely, a positive coefficient indicates that cities with larger attribute differences are more likely to form significant leading relationships, reflecting functional complementarity or cross-level linkages among cities.
Accordingly, the TERGM can be summarized as follows:
where indicates whether cities and are spatially adjacent; denotes the geographical distance between the two cities; and represent the -th attribute variable of the sender city and receiver city, respectively; and denotes the absolute difference between the two cities in that attribute. Note that Equation (9) merely describes the explanatory terms included in the model, whereas actual estimations were conducted within the TERGM framework, which simultaneously accounted for network dependence structures and the normalizing constant.
The model was estimated using the Markov Chain Monte Carlo maximum likelihood estimation method implemented in the btergm package version 1.11.1 in R software version 4.5.2, with maximum pseudolikelihood estimation estimates used as initial values. Bootstrapping was used to evaluate parameter uncertainty to assess model robustness. Model performance was further evaluated based on parameter significance, information criteria, and goodness-of-fit diagnostics. Goodness-of-fit tests compared the simulated and observed networks in terms of degree distribution, edgewise shared partner distribution, geodesic distance, and reciprocity structure to assess whether the model adequately reproduced key structural features of the PM2.5–O3 compound pollution event network in the YRD.
3. Results
3.1. Scale and Annual Fluctuations in Compound Pollution Events
Figure 1 shows annual changes in PM2.5–O3 pollution events in the YRD from 2015 to 2024. Overall, the number of compound events markedly declined during the study period. This decrease was not linear but characterized by a high frequency of events in the early stage, a rapid decline in the middle stage, and low-level fluctuations in the later stage. The event scale was highest in 2015, with more than 1000 raw events and approximately 550 declustered events, indicating that compound pollution episodes involving simultaneously elevated PM2.5 and O3 were relatively frequent at the beginning of the study period. The number of events decreased substantially in 2016, then temporarily rebounded in 2017, suggesting that compound pollution may still be influenced by unfavorable meteorological conditions, increased O3 levels, and regional transport. From 2018 to 2020, both raw and declustered event counts declined, indicating a clear reduction in the frequency of compound pollution episodes.
Figure 1.
Annual number of raw and declustered PM2.5–O3 compound pollution events in the Yangtze River Delta (YRD) during 2015–2024.
A comparison before and after declustering showed that the number of raw events was consistently higher than the number of declustered events. This suggests that some compound pollution days were concentrated within continuous pollution episodes, rather than occurring as fully independent events. The gap between the two series was relatively large during 2015–2019, indicating that compound pollution episodes during this period were frequent and persistent. After 2020, the gap narrowed, suggesting that compound pollution events became more short-lived and scattered. Event counts remained low during 2021–2022, increased somewhat in 2023, then declined again in 2024. This pattern indicates the weakening of the overall risk of compound pollution, although episodic rebound remains possible.
3.2. Evolution of the Overall Network Structure
Table 1 reports the annual summary statistics of the directed leading networks of PM2.5–O3 compound pollution events in the Yangtze River Delta from 2015 to 2024. To avoid repeating the exact numerical values already provided in the table, the following discussion focuses on the stage-wise changes in network structure. Overall, the network did not decline in a simple linear manner, but showed clear stage-specific fluctuations. During 2015–2018, the number of edges, network density, and total weight remained at relatively high levels, indicating that statistically significant leading relationships among compound pollution events were widespread and that the regional linkage structure was relatively dense. After 2019, both network connectivity and edge strength declined markedly. In particular, during 2020–2022, the network entered a low-density and low-weight stage, suggesting that significant cross-city leading relationships became much less frequent and that compound pollution events were more localized and weakly linked. In 2023, the network showed a partial rebound, but the average edge weight remained much lower than in the early study period, indicating that the later recovery mainly reflected an expansion in linkage coverage rather than a substantial strengthening of individual ties. In 2024, the network contracted again, suggesting that compound pollution event linkages still exhibited fluctuation and stage-wise reorganization.
Table 1.
Indicators of the overall PM2.5–O3 compound pollution event leading network in the YRD during 2015–2024.
Figure 2 further converts the network connectivity and edge-strength indicators in Table 1 into temporal trajectories, thereby highlighting the synchronization and divergence among different indicators. Network density and the number of nonzero edges mainly reflect changes in linkage coverage, whereas total weight and average nonzero edge weight reflect the repeated strength of leading relationships. In the early study period, the network showed not only high connectivity but also relatively strong repeated leading matches among some city pairs. After 2020, the decline in total weight and average edge weight became more pronounced, indicating that regional compound pollution events no longer exhibited frequent and strongly repeated cross-city linkages. Notably, although network density and the number of nonzero edges rebounded in 2023, the recovery in total weight and average edge weight was limited, suggesting that many newly formed ties were relatively weak and that the regional synchronization intensity of compound pollution events had not returned to the level observed in the early period.
Figure 2.
Evolution of overall network intensity in the YRD during 2015–2024: (a) density; (b) number of non-zero edges; (c) total edge weight; (d) average non-zero edge weight.
Figure 3 complements Table 1 by providing a dynamic interpretation of the structural indicators, with a focus on the temporal evolution of reciprocity, transitivity, and the weighted clustering coefficient. Compared with edge number and density, these indicators reflect changes in the internal organization of the network. In the early study period, reciprocity and transitivity remained relatively high, suggesting that compound pollution event linkages were more likely to form bidirectional responses and locally closed structures. During 2020–2022, the closure and clustering characteristics weakened, indicating that the network shifted from regional group-based linkages toward more dispersed connections. After 2023, some structural indicators recovered, implying a certain degree of network reorganization in the later period. However, strongly connected city groups and high-intensity local clustering had not fully returned to the levels observed in the early stage.
Figure 3.
Evolution of network structural characteristics in the YRD during 2015–2024: (a) reciprocity; (b) transitivity; (c) weighted clustering coefficient.
Transitivity peaked in 2018, declined markedly from 2019 to 2022, then increased from 2023 to 2024. This pattern indicates that local closure structures were more likely to form during the early stages of the study period. In other words, cities that were indirectly connected through intermediate linkages were more likely to develop direct connections. In contrast, the weakening of closure structures during 2020–2022 suggests that compound pollution linkages shifted from regionally clustered relationships to a more dispersed pattern of connections.
The weighted clustering coefficient was generally lower than the reciprocity and transitivity, and reached a minimum in 2020, corresponding to a marked weakening of high-intensity local clustering in the network. After 2021, the clustering level recovered to some extent but remained relatively stable at a low-to-medium level. This suggests that, although some local clustering still existed in later stages, the level of strongly connected urban clusters did not return to that of the early stage. Overall, Figure 3 indicates that the compound pollution event network in the YRD exhibited strong structural dynamics. In the early stage, the network was more likely to form reciprocal and closed regional linkage structures; during 2020–2022, structural connections became notably weaker; and after 2023, partial recovery occurred, although the overall network remained weaker than that during the high-linkage stage.
3.3. Spatial Patterns and Backbone of the Compound Pollution Event Network
Figure 4 shows the top 60 spatial backbones of directed leading networks of PM2.5–O3 pollution events in the YRD for representative years (2015, 2018, 2020, and 2024). Overall, the network spatial structure was not fixed but underwent dynamic reorganization: from concentrated linkages in eastern coastal areas and the Zhejiang–Shanghai–Jiangsu junction toward central–western areas and interprovincial corridors. This suggests that the spatial linkages of compound pollution events in the YRD were influenced not only by the scale of pollution events but also by regional transport, urban agglomeration structure, and year-specific pollution backgrounds.
Figure 4.
Spatial backbones (linkage structure) of directed PM2.5–O3 compound pollution event networks in the YRD for representative years: (a) 2015; (b) 2018; (c) 2020; (d) 2024.
In 2015, the network backbone was concentrated in eastern and southeastern cities, including Shanghai, Suzhou, Wuxi, Changzhou, Jiaxing, Huzhou, Shaoxing, Ningbo, Taizhou, and Wenzhou, with clear linkage patterns among coastal Zhejiang–Shanghai–Jiangsu and Hangzhou Bay. Many high-weight edges were distributed between the core YRD cities and coastal cities in Zhejiang, indicating that the directionally leading relationships of compound pollution events were strongly regionally clustered at the beginning of the study period. The core linkage area was predominantly in the eastern urban belt, where economic activity, population concentration, and transport connections were relatively intensive.
In 2018, the network backbone extended toward central and northern Jiangsu. The connections between cities such as Yancheng, Huai’an, Yangzhou, Taizhou, and Nantong, and core cities such as Shanghai, Suzhou, Wuxi, and Changzhou were notably strengthened. Compared with 2015, the 2018 network was no longer confined to the Zhejiang–Shanghai–southern Jiangsu region, but formed multiple linkage pathways from northern and central Jiangsu to Shanghai and coastal cities in Zhejiang. This is consistent with our earlier finding that both the number of edges and network density reached relatively high levels in 2018, suggesting that compound pollution events were not only more frequent but also involved broader cross-regional linkages.
By 2020, the network backbone had contracted significantly. Spatial connections were mainly retained between Shanghai, Suzhou, Wuxi, Jiaxing, Shaoxing, Ningbo, Zhoushan, Taizhou, Wenzhou, and some coastal cities in central Jiangsu. Most cities in Anhui and the western part of the YRD participated substantially less in the top 60 backbones. This indicates that the significant leading relationships of compound pollution events in 2020 were more concentrated around the eastern coastal area and core urban zones, whereas the overall regional network became sparser. This pattern is consistent with the sharp decline in compound event counts and network intensity in 2020, reflecting a clear weakening of compound pollution linkages during this stage.
The spatial backbone of 2024 showed a new pattern of reorganization. Compared to 2020, network linkages expanded notably toward northern and central Anhui and Anhui–Zhejiang border areas. More cross-regional connections appeared among cities, such as Huaibei, Suzhou, Bengbu, Huainan, Hefei, Lu’an, Wuhu, Xuancheng, Lishui, and Taizhou. Linkages involving Shanghai, southern Jiangsu, and parts of northern Zhejiang weakened. This suggests that, in the later stage, the key linkage areas of compound pollution events no longer depended entirely on the traditional Shanghai–southern Jiangsu–northern Zhejiang core but tended to extend inland and toward interprovincial corridors.
Overall, the spatial backbone of the directed PM2.5–O3 pollution event network in the YRD showed clear stage-dependent characteristics. In 2015, dense linkages were common between core areas and coastal cities. In 2018, the network expanded toward central and northern Jiangsu, with the regional linkage range becoming relatively high. In 2020, the network contracted markedly, and linkages became concentrated in the eastern coastal area and core urban belt. In 2024, spatial reorganization shifted toward Anhui and the Anhui–Zhejiang corridor. These findings indicate that the coordinated governance of compound pollution events should not rely solely on fixed administrative boundaries or a single core city. Instead, key pathways and bridging cities should be identified from the annual network backbone, so that the priorities of regional joint prevention and control can be dynamically adjusted.
3.4. Identification of Key Nodes and Differentiation of Urban Roles
Table 2 and Figure 5 show the key nodes and their functional differences in the directed PM2.5–O3 pollution event network of the YRD from different perspectives. Based on the average results for 2015–2024, we identified the top-ranked cities according to multiple indicators, including out-strength, in-strength, betweenness centrality, and PageRank (Table 2). Shaoxing, Yancheng, Nantong, Taizhou, Quzhou, Lishui, Suzhou, Shanghai, Lianyungang, and Changzhou performed well across all indicators, indicating that these cities are not simply high-pollution cities but also have strong structural importance in the cross-city linkage network of compound pollution events.
Table 2.
Comprehensive performance of key nodes in the directed PM2.5–O3 compound pollution event network of the YRD.
Figure 5.
Top 10 cities in the YRD according to (a) average out-strength and (b) betweenness centrality in the compound pollution event network.
In terms of out-strength and in-strength, Shanghai, Nantong, Suzhou, Yancheng, Taizhou, and Shaoxing exhibited relatively strong outward and bidirectional linkage capacities. Shanghai had the highest output strength, indicating that compound pollution events in this city more frequently preceded those in other cities, and that Shanghai represents a typical potential output node in the network. Nantong, Suzhou, Yancheng, and Lianyungang also showed strong outward linkages, suggesting that coastal and southern Jiangsu cities play an important role in regional event linkages. Shaoxing, Taizhou, Lishui, and Nantong had relatively high in-strength, indicating that these cities were more likely influenced by leading compound pollution events from other cities and thus exhibited certain convergence characteristics. In summary, some cities simultaneously exhibit output and input attributes, indicating that compound pollution events do not simply diffuse in one direction but instead involve more complex bidirectional responses.
Figure 5 further distinguishes two key roles: output nodes and bridging nodes. Lianyungang, Yancheng, Huai’an, Suqian, and Ningbo ranked among the top cities for average out-strength, indicating that northern Jiangsu and coastal cities had relatively strong outward influence in event-leading relationships. In contrast, Huai’an, Quzhou, Anqing, Hefei, and Hangzhou ranked highly for average betweenness centrality, suggesting that these cities played bridging roles in connecting different regional linkage pathways. Notably, cities with high out-strength did not fully overlap with those with high betweenness centrality. This indicates clear differentiation of urban roles in the compound pollution event network: some cities primarily acted as output nodes in event-leading relationships, whereas others primarily served as cross-regional connectors and pathway-switching nodes.
Key nodes in the PM2.5–O3 compound pollution event network of the YRD were not limited to traditional core cities such as Shanghai and Suzhou (Table 2 and Figure 5). Cities in northern Jiangsu, southwestern Zhejiang, and parts of Anhui also played important roles in the network. This suggests that regionally coordinated governance should not focus solely on cities with high pollution concentrations or large economic scales, and that output and bridging nodes in the network should be identified to optimize cross-city early warning, joint emission reduction, and information coordination mechanisms.
3.5. Identification of TERGM Formation Mechanisms
To further explain the formation mechanisms of directed leading ties in the PM2.5–O3 pollution event network of the YRD, we constructed TERGMs based on the annual network sequence. Table 3 reports the baseline model results, including endogenous network structures, temporal dependence terms, and spatial covariates. Table 4 further incorporates the node-level attribute variables related to socioeconomic conditions, industrial structure, urban form, and digital governance. Overall, the signs and significance levels of the core network structural terms remained relatively stable across different model specifications, indicating that the leading network of compound pollution events in the YRD was not formed randomly but jointly shaped by reciprocity, local closure, temporal memory, and city attributes.
Table 3.
Baseline TERGM results for the directed PM2.5–O3 compound pollution event network in the YRD.
Table 4.
Extended TERGM estimation results for the directed PM2.5–O3 compound pollution event network in the YRD.
The coefficients of the edges term were significantly negative in all models (Table 3), indicating that the formation of significant leading ties was highly selective. This is, although many potential linkages exist among cities in the YRD, only some city pairs formed statistically significant leading relationships for PM2.5–O3 compound pollution events. This result is consistent with our earlier finding that network density was not high throughout the study period, suggesting that compound pollution event linkages were not characterized by simple region-wide synchronization but constrained by specific spatial pathways and network structures.
The mutual term was significantly positive in all models, indicating a clear tendency toward bidirectional responses between city pairs. This suggests that intercity linkages of compound pollution events in the YRD were not entirely characterized by one-way diffusion but more likely influenced by shared regional meteorological backgrounds, mutual transport, and frequent interactions within the urban agglomeration.
Regarding higher-order structural terms, gwesp coefficients were significantly positive in all models, whereas gwdsp coefficients were significantly negative. This indicates strong local closure and clustering structures in the network; cities sharing common connections were more likely to form stable compound pollution event linkages. However, non-closed two-path structures were suppressed, suggesting that significant leading relationships did not diffuse indefinitely through loose network paths but were more likely to concentrate within several local urban clusters or major linkage corridors. This result is consistent with the core pathways and regional cluster patterns observed in the directed network backbone maps.
In terms of temporal dependence, the coefficients of Autoregression and Stability were significantly positive, whereas those of Loss and Innovation were significantly negative. These results indicate that significant leading relationships that existed in a previous period were more likely to persist in subsequent years, suggesting that the network exhibited path dependence and structural stability. The negative Loss and Innovation terms suggest that the network was not entirely driven by the random entry of many new edges or the rapid disappearance of existing edges. Instead, annual adjustments occurred based on a relatively stable backbone. This is consistent with the stage-dependent fluctuations observed in the network from 2015 to 2024, indicating that the network structure has both persistence and a tendency to reorganize with changes in pollution-control stages and external conditions.
For the spatial covariates, the adjacency matrix (Adj_mat) was significantly positive and the distance matrix (Dist_mat) significantly negative in most models (Table 3 and Table 4). After controlling for higher-order network structures, the positive adjacency effect indicates that spatially adjacent cities are more likely to form significant leading ties, while the negative distance effect reflects a clear distance decay in event linkage. Because adjacency and distance are collinear by construction (adjacent pairs are the short-distance pairs), the two terms are best read jointly as a single proximity gradient; the long-range associations that remain after accounting for triadic closure are more plausibly attributed to shared regional synoptic forcing than to distance-driven transport.
After including the city-level attribute variables in Table 4, the AIC and log-likelihood values of the model generally improved, indicating that socioeconomic conditions, industrial structure, urban form, and digital governance provide additional explanatory power for tie formation mechanisms. Among the socioeconomic variables, the sender effect of the PGDP was significantly positive in several models, suggesting that cities with higher levels of economic development are more likely to act as output nodes in compound pollution event-leading relationships. This may be attributed to intensive production, transport, and energy consumption. Generally, the absolute difference term of PGDP was significantly negative, indicating that cities with similar levels of economic development are more likely to form significant leading relationships, reflecting a certain degree of homophilous linkage.
The results for population size varied across the model specifications, indicating that the influence of population size on compound pollution event-leading relationships was not entirely stable. In some models, the sender and receiver effects of population size were positive, suggesting that cities with larger populations may have stronger pollution activity intensities and event-response linkages. However, after including additional variables, some coefficients become negative or insignificant, indicating that the effect of population size may be shaped jointly by economic development, industrial structure, urban form, and other factors. Therefore, population size is more appropriately interpreted as a control variable representing urban activity intensity rather than as a stable mechanism determining output or input roles.
The registered urban unemployment rate showed significantly negative sender, receiver, and difference effects in most models, suggesting that cities with higher socioeconomic activity and more similar labor-market conditions were more likely to form compound pollution event linkages. Among the industrial structure variables, the receiver effects of the secondary industry share and tertiary industry share were significantly positive, indicating that cities with stronger industrial activity and urban functional intensity were more likely to become receiving ends of significant leading relationships. The difference term of tertiary industry share was significantly negative in later models, suggesting that cities with similar tertiary industry structures were more likely to form event-synchronization linkages, which may be related to similar rhythms of service sector activities, transport demand, and urban functional connections.
The urban form and industrial upgrade variables also showed explanatory power. The receiver effect of the industrial structure upgrading index was significantly positive, and its sender effect was significantly positive in some models, indicating that cities with higher levels of industrial structure upgrading may still occupy important positions in the compound pollution event network. This result suggests that industrial upgrading does not necessarily remove compound pollution linkage risks. Instead, improvements in urban functions, increased transport activities, and deeper regional connections may lead to cities becoming embedded in cross-city event networks. In contrast, the coefficients of population agglomeration were generally insignificant, indicating that, after controlling for other economic and industrial variables, population agglomeration has a limited independent influence on the formation of significant leading ties.
The Dig index results have important policy implications. The sender effect of Dig was significantly negative (Table 4), indicating that cities with higher digital governance levels or those included in the pilot policy were less likely to form significant outward-leading ties. This suggests that improvements in digital governance capacity help strengthen environmental monitoring, pollution early warnings, information disclosure, and refined regulations, thereby reducing the risk of local compound pollution events spreading outward through intercity linkages. Additionally, the difference effect of Dig was significantly positive, indicating that city pairs with differences in digital governance levels were more likely to form significant relationships. This may reflect disparities in pollution warning capacity, response speed, and governance coordination among cities under uneven digital governance development, which in turn affects the formation of compound pollution event linkages.
Overall, the TERGM results indicate that formation of the PM2.5–O3 pollution event-leading network in the YRD was jointly influenced by three types of mechanisms (Table 3 and Table 4). The first is structural dependence within the network itself, including reciprocity and local closure. The second is temporal memory, which implies that existing leading relationships exhibit a certain degree of persistence over time. The third involves city attributes and dyadic differences, particularly economic development, industry-structure similarities, and differences in digital governance capacity, all of which significantly affect tie formation. These findings further suggest that the coordinated governance of regional compound pollution should not rely solely on pollution concentrations in individual cities or administrative boundaries. Instead, structural positions in the event network, historical linkage relationships, and differences in governance capacity should be considered to identify priority cities and more targeted joint prevention and control pathways.
3.6. Goodness-of-Fit and Robustness Checks
Figure 6 presents the goodness-of-fit diagnostics of the TERGM for the directed PM2.5–O3 pollution event network in the YRD. The diagnostics mainly included edgewise shared partners, dyadwise shared partners, degree distribution, in-degree distribution, geodesic distance, and receiver operating characteristic (ROC) and precision–recall curves. Overall, most structural statistics of the observed network fell within the distribution ranges of the simulated networks, indicating that the model reasonably reproduced the main structural features of the observed network.
Figure 6.
Goodness-of-fit diagnostics of the TERGM for YRD network structural characteristics during 2015–2024: (a) edgewise shared partners; (b) dyadwise shared partners; (c) degree distribution; (d) in-degree distribution; (e) geodesic distance; (f) receiver operating characteristic (TPR/FPR) and precision–recall (TPR/PPV) curves. Solid lines denote the median, and dashed lines the mean, of the observed networks across the 9 yearly snapshots; grey boxplots show the distribution of the corresponding statistic across nsim simulated networks from the fitted TERGM. In panel (f), the red curve is the ROC and the blue curve is the precision–recall (PR) curve of edge prediction; boxplots around each curve indicate variability across simulations.
Specifically, the model showed a reasonable fit for edgewise and dyadwise shared partners, suggesting that the gwesp and gwdsp terms specified in the model effectively captured local closures, shared partner structures, and higher-order dependence in the network. The goodness-of-fit results for degree and in-degree distributions showed that the observed curves were generally consistent with the simulated distributions, indicating that the model captured heterogeneity in the number of connections across city nodes. However, some deviations remained for a small number of highly connected nodes. This suggests that the model can explain the formation of most intercity-leading relationships, although room for improvement remains in terms of capturing extreme key nodes.
Geodesic distance diagnostics indicated that the model can generally reproduce short-path connection patterns and overall reachability in the network, suggesting that TERGM has a good descriptive capacity for network connectivity structures. ROC and precision–recall curves further showed a certain ability to distinguish significant leading ties. The ROC performance was relatively stable, whereas the precision–recall curve indicated that predicting positive ties remained challenging under sparse network conditions. Overall, the goodness-of-fit results support the reasonableness of the TERGM specification, indicating that the endogenous network structures, temporal memory, and city-level covariates can reasonably explain the formation mechanisms of the directed PM2.5–O3 compound pollution event network in the YRD. Simultaneously, the deviations associated with a few highly central nodes and sparse positive-edge predictions suggest that future studies should incorporate meteorological transport, precursor emissions, and trajectory simulation information to improve the explanatory power of the model.
To further evaluate the robustness of the event definition and network construction, we conducted a threshold-sensitivity analysis using five alternative city-year-specific percentile thresholds: P75, P80, P85, P90, and P95 (Table 5). The results show that the main network indicators change monotonically and smoothly as the threshold increases, suggesting that the overall network patterns are not determined by a single arbitrary cutoff. As expected, higher thresholds identify fewer compound pollution events and produce sparser directed networks.
Table 5.
Robustness Checks under Different Thresholds.
However, overly strict thresholds substantially reduce event density and undermine the stability of annual network construction and TERGM estimation. Under P95, only 177 raw compound events and 141 declustered events were identified during the entire study period, with an annual average of 38.9 directed edges and a network density of 0.024. The TERGM estimation under this threshold was unstable because the bootstrap procedure returned NaN values. Under P90, the network also became sparse, and the adjacency effect was no longer significant. In contrast, P75 produced a much denser network, with 7393 raw events, 4409 declustered events, an annual average of 767.7 directed edges, and a density of 0.468, suggesting that this threshold may include many relatively weak or non-extreme co-occurrence episodes.
Compared with these alternatives, P80 provides a more appropriate balance between retaining the upper-tail nature of compound pollution events and maintaining sufficient event density for reliable ECA-based network construction and TERGM inference. Therefore, P80 was selected as the main threshold in this study, while the sensitivity analysis confirms that the main conclusions are not driven by an arbitrary threshold choice.
4. Discussion
4.1. Stage-Dependent Implications of the Decline in Compound Pollution Events and Weakening of Network Linkages
PM2.5–O3 compound pollution events in the YRD generally decreased from 2015 to 2024, and the event-leading network shifted from high-density and high-intensity linkages in the early stage to lower-density and weaker-intensity linkages in the later stage. This change first reflects the stage-dependent effectiveness of air quality management in the YRD—particularly the important background role of PM2.5—in reducing the scale of compound pollution events. Previous clean air policies in China substantially reduced PM2.5; however, marginal improvements in particulate pollution slowed during later phases of air pollution control and coordinated multi-pollutant control became a new priority [21]. Therefore, the observed decline in compound events does not imply that compound pollution has been resolved. Rather, it suggests that regional pollution processes have shifted from a stage characterized by high frequency, persistence, and strong linkages to a new stage marked by lower frequency, fluctuations, and the coexistence of local and cross-city interactions.
This stage-dependent change is also consistent with the asynchronous improvement of PM2.5 and O3 in the YRD. PM2.5 concentrations in the YRD decreased significantly after the implementation of clean air policies, whereas O3 pollution did not show a synchronous improvement, even increasing or rebounding during certain periods [22,23]. Thus, the decline in the number of compound pollution events may reflect a reduction in high-PM2.5 episodes rather than a simultaneous decline in O3 risk. The rebound in compound events and network linkages observed in 2023 also indicates that PM2.5–O3 pollution can intensify over short periods when meteorological conditions, precursor ratios, and regional transport conditions recombine in unfavorable ways.
From a network perspective, a decrease in event frequency does not necessarily imply reduced pressure for coordinated governance. As compound pollution shifts from widespread high-frequency occurrences to low-frequency fluctuations, governance priorities may need to move beyond overall pollution reduction toward identifying key years, pathways, and nodes. Previous studies on regional PM2.5 transport in the YRD have emphasized that joint prevention and control requires recognition of intercity transport contributions and cross-city influence pathways, rather than relying solely on single-city concentration assessments [24]. Our event-network results further suggest that, even after compound pollution enters a low-level fluctuation stage, event-scale methods are necessary to identify recurrent leading relationships and abnormal linkage pathways.
4.2. Chemical and Physical Interpretation of Directional Event Linkages
From the perspective of atmospheric chemistry, the relationship between PM2.5 and O3 is inherently non-linear and bidirectionally coupled. NOx and VOCs not only participate in the photochemical production of O3 but also influence the formation of secondary aerosols. Moreover, PM2.5 changes can alter photolysis rates, the boundary-layer structure, and the O3 production environment through aerosol–radiation interactions [25]. This implies that the relatively high reciprocity and local closure observed in this study may not have resulted from transport of a single pollution plume but may reflect the combined effects of regional photochemical reactions, secondary formation processes, and shared meteorological conditions. Atmospheric oxidizing capacity plays a key role in the relationship between PM2.5 and O3, with these pollutants more likely to exhibit correlated changes under moderate to high oxidizing conditions [26].
Therefore, all directed links identified in this study should be understood as statistical leading relationships between compound pollution events, and should not be interpreted as physical atmospheric transport pathways or direct causal relationships. Higher reciprocity, local closure, and significant cross-city edges indicate that compound pollution events in different cities exhibit statistically significant temporal lead-lag responses and networked linkage characteristics. However, these statistical relationships themselves cannot distinguish among the combined effects of actual air-mass transport, shared regional meteorological forcing, similar emission rhythms, or photochemical formation conditions. To further determine whether real transport processes exist between specific city pairs, additional physical validation using wind fields, boundary layer height, backward trajectory analysis, chemical transport models, or source apportionment results is still needed. Accordingly, the network results of this study are more suitable as statistical evidence for identifying potential linkage channels, key nodes, and priority targets for coordinated governance, rather than as direct evidence for pollutant transport directions or emission responsibility attribution.
For the YRD, O3 formation sensitivity and precursor structures further complicate the interpretation of directionality. O3 pollution in the YRD is often influenced by VOC-limited or VOC–NOx transitional regimes; thus, reducing NOx alone may lead to O3 rebound risks in some urban core areas [22]. Additionally, VOC emissions from chemical industrial parks can affect regional O3–PM2.5 compound pollution by enhancing the atmospheric oxidizing capacity, indicating that local industrial emissions and regional photochemical production may jointly shape compound pollution events [27]. Therefore, the directed edges identified in this study should be interpreted as indicators of event linkage. Their physical significance should be further evaluated in combination with wind fields, boundary-layer heights, radiation conditions, precursor emissions, and trajectory simulations.
It should be further emphasized that the lead-lag relationships identified within the L = 5-day lag window in this study essentially reflect statistical synchronization or statistical leading relationships in the timing of compound pollution events, rather than explicit physical mass transport trajectories. A 1–2 day or multi-day statistical lead between two cities does not necessarily mean that pollutants were directly transported from the former city to the latter city. Regional-scale synoptic conditions, such as slow-moving weather fronts, stagnant high-pressure systems, changes in boundary layer height, or widespread unfavorable dispersion conditions, may also cause compound pollution events to occur successively across different cities at similar but not identical times. Therefore, the directed network in this study is mainly used to characterize statistical linkage patterns of compound pollution events and potential clues for coordinated governance, and cannot replace backward trajectory simulations, wind-field diagnostics, chemical transport models, or source apportionment methods for verifying physical transport pathways.
Similarly, the directional edges in this study cannot be directly interpreted as pollution-output responsibilities. For PM2.5–O3 compound pollution, statistically significant relationships may arise from air mass transport, but may also result from multiple cities entering environments that are favorable for secondary formation at different times under similar weather patterns. Recent research on long-term O3 changes in the YRD has indicated that regional O3 pollution is jointly influenced by local emissions, non-local transport, and meteorological factors, and that multi-scale transport processes remain important for explaining O3 fluctuations at the urban-agglomeration scale [23]. Therefore, our event-network approach is more suitable as a screening tool for identifying regional compound pollution pathways and priority cities than as a substitute for chemical transport or source-apportionment models.
4.3. Spatial Backbone Reorganization and Differentiation of Urban Roles
According to the spatial backbone results, the long-term linkage structure of compound pollution events in the YRD did not remain stably centered on a few core cities but instead underwent clear reorganization across different years. This is consistent with the pollution formation context of YRD urban agglomerations. The YRD is characterized by high population density, intensive industrial activity, and a well-developed transport network, and is one of the regions in China where O3 pollution is relatively prominent. Pollution processes are often affected jointly by local emissions, regional transport, and the spatial structure of urban agglomeration [23]. Therefore, changes in the network backbones in 2015, 2018, 2020, and 2024 do not merely indicate differences in network visualization but reveal the reorganization of compound pollution linkage pathways under different governance stages and meteorological–emission conditions.
Notably, the key nodes identified in this study were not exclusively traditional core economic cities. Cities in northern Jiangsu showed a prominent average out-strength, whereas Huai’an, Quzhou, Anqing, and Hefei exhibited relatively strong bridging roles in terms of betweenness centrality. This indicates that urban roles in the compound pollution event network cannot be simply determined by GDP, administrative rank, or annual mean concentration. As PM2.5 pollution in the YRD involves significant cross-city transport, joint prevention and control requires knowledge of the actual transport contributions among cities [24]. From an event-scale perspective, our results revealed that some non-traditional core cities serve as pathways or bridges in cross-regional linkages and should not be marginalized in coordinated governance.
This difference in urban roles is also related to industrial and spatial linkages. Industrial agglomeration, secondary sector activity, and service sector agglomeration affect PM2.5 in the Yangtze River Economic Belt and YRD through energy consumption, transport activity, technological spillovers, and population size, with non-linear and spatial spillover effects [28]. When cities share similar industrial structures, commuting connections, or functional divisions, compound pollution events may exhibit stronger synchronization or lead–lag responses. Therefore, differentiating between output-, input-, and bridging-type cities provides a complementary perspective to traditional governance zoning based on administrative boundaries or concentration levels.
From the perspective of coordinated governance, dynamic reorganization of the spatial backbone indicates that the YRD should not rely solely on fixed joint prevention and control zones. Previous studies on synergistic PM2.5–O3 control have suggested that different regions should adopt differentiated pathways according to precursor sensitivity and pollutant-control benefits. For example, VOC control should receive greater attention in the central and eastern YRD, whereas primary PM2.5 control remains important in the northern YRD [22]. Our network results suggest that governance zoning should also incorporate event-linkage roles: output-type cities need to strengthen precursor reduction and local-process suppression; bridging cities should play a stronger role in cross-regional early warning and joint consultation; and input-type cities need to enhance their responses to external pollution and health risk protection.
4.4. Formation Mechanisms of Significant Leading Ties
According to the TERGM, formation of the compound pollution event-leading network was not a random process but exhibited clear structural dependence and temporal memory. The significantly negative edge term indicates that tie formation was selective; the significantly positive mutual term suggests bidirectional responses between city pairs; and the opposite signs of gwesp and gwdsp indicate that the network was more likely to form locally closed clusters rather than diffuse through loose paths. Dynamic network studies have shown that the advantage of TERGM lies in its ability to jointly account for endogenous network structures, temporal dependence, and exogenous covariates, avoiding the inappropriate treatment of network relationships as independent ordinary observations [16,17]. Therefore, our findings suggest that the compound pollution event network in the YRD is characterized by a structured formation.
The term temporal memory has important environmental implications, indicating that some significant leading relationships among cities persisted across the years, possibly corresponding to relatively stable regional transport pathways, urban functional connections, or similar emission–meteorological combinations. Previous applications of the TERGM have also emphasized that stability terms in dynamic networks capture the path-dependent influence of existing relationships on subsequent network formation, rather than merely reflecting random annual fluctuations [29]. In this study, leading ties that repeatedly appeared over time were considered key targets in regional compound pollution governance because they were more likely to represent persistent cross-city linkage risks.
The significantly positive adjacency and negative distance coefficients indicate that geographic proximity promotes the formation of significant leading ties, consistent with distance decay; they do not imply that longer distances promote transport. Because the model already controls for reciprocity, closure structures, and temporal memory, the spatial variables reflect marginal associations after accounting for these endogenous structures: part of the proximity signal is absorbed by local closure and clustering, while the long-range associations that remain significant most plausibly reflect shared regional synoptic forcing (e.g., slow-moving weather systems and stagnant high-pressure conditions over the YRD) rather than distance-driven mass transport. Local and non-local contributions jointly affect O3 pollution in the YRD, and regional-scale transport plays an important role in O3 fluctuations across urban agglomerations [23].
The city attribute results should also be interpreted in the context of broader environmental and socioeconomic mechanisms. The positive sender effect of PGDP indicates that cities with stronger economic activities are more likely to appear at the leading end of event linkages. This is consistent with the complex relationship among economic development, industrial activity, and pollution emissions in the YRD. The relationship between urban economic development and industrial pollution in the YRD is not linear but jointly moderated by industrial structure, technological progress, and the stage of urban development [30]. Therefore, our PGDP results should be interpreted as a statistical association between economic activity intensity and compound pollution linkage risk rather than a simple conclusion that more developed cities cause more pollution.
The industrial structure variables further indicated that the compound pollution event network was embedded in the urban functional division. The share of secondary industries is related to traditional industrial energy consumption, NOx emissions, and primary particulate matter, whereas tertiary industries may affect O3 precursor emissions and diurnal urban activity rhythms through transport, population mobility, and consumption. Industrial agglomeration has non-linear and spatial spillover effects on PM2.5, and different types of industrial activities may affect pollution in different directions [28]. Therefore, the association between industrial structure similarity and tie formation observed in this study suggests that compound pollution linkages arise not only from physical transport, but also from similar industrial rhythms and urban activity patterns.
Similarly, the digital governance variable results should be interpreted within the context of literature on environmental governance capacity. The sender effect of Dig was negative, indicating that cities with higher digital governance levels—or those included in the pilot policy—were less likely to form outward-leading ties. This is consistent with recent research suggesting that digital infrastructure can improve air quality and enhance environmental governance efficiency [31]. However, the positive difference effect of Dig also suggests that uneven digital governance capacity may lead to differences in monitoring, early warning, and response capabilities among cities, thereby affecting the linkage relationships between compound pollution events. Thus, this result does not provide strict causal evidence of digital governance effects but rather indicates a relationship between governance capacity and the structure of compound pollution networks, which warrants further investigation.
The TERGM results provided explanations for the stable pathways, bidirectional responses, and local clustering of the compound pollution event network. Previous studies on synergistic PM2.5–O3 control have focused on precursor reduction ratios, response surface modeling, or concentration changes. By embedding event networks into a dynamic network statistical framework, we added an explanatory dimension concerning how ties form, why they persist, and which city attributes strengthen or weaken the linkages [16,22]. This novel aspect will help advance compound pollution governance from focusing on concentration-attainment issues to identifying cross-city processes and dynamic coordinated responses.
5. Conclusions and Policy Implications
In this study, we identified the directed synchronization networks of PM2.5–O3 compound pollution events in 41 cities of the YRD from 2015 to 2024. Daily mean PM2.5 concentrations and O3 maximum daily 8-h average concentrations were transformed into compound pollution event sequences, annual directed synchronization networks were constructed based on event-leading relationships, and the TERGM was applied to identify the formation mechanisms of significant leading ties. PM2.5–O3 compound pollution events in the YRD generally declined during the study period. Compound pollution episodes shifted from a state of high frequency, persistence, and strong linkage in the early stage to one of lower frequency, weaker intensity, and stage-dependent fluctuations in the later stage. The intercity event-leading network did not weaken linearly but showed clear stage-dependent evolution and spatial reorganization. From 2015–2018, the network density, total edge weight, and local closure were relatively high, indicating strong regional linkage between compound pollution events. From 2020 to 2022, the network became markedly sparse, suggesting weakened cross-city linkages. After 2023, a partial rebound occurred, indicating that compound pollution risks can intensify under specific meteorological and emission conditions. According to spatial backbone and key node analysis, compound pollution linkages were not limited to traditional core cities such as Shanghai, Suzhou, and Hangzhou. Cities in northern Jiangsu, southwestern Zhejiang, and parts of Anhui also played important roles as event outputs, inputs, and cross-regional bridges. The TERGM results indicated that significant leading ties were jointly shaped by reciprocity, local closures, temporal memory, economic development, industrial structure, and digital governance. These findings suggest that the PM2.5–O3 compound pollution event network in the YRD reflects not only atmospheric processes but also differences in urban socioeconomic characteristics and governance capacity.
Based on our findings, we recommend that PM2.5–O3 pollution control in the YRD should move beyond single-city concentration management toward event-linkage identification and cross-city coordinated responses. First, output-, input-, and bridging-type cities in a compound pollution event network should be incorporated into a differentiated governance framework. For cities with strong outward-leading relationships, coordinated reductions in NOx, VOCs, primary particulate matter, and secondary aerosol precursors should be strengthened to reduce the likelihood of local pollution episodes triggering outward linkages. For cities with clear input or convergence characteristics, early warnings of external pollution processes, health risk communication, and emergency responses should be enhanced. For bridging cities with high betweenness centrality, greater roles should be assigned to regional consultation, cross-city early warning systems, and coordinated dispatch. Second, joint prevention and control in YRD should not rely entirely on fixed administrative boundaries. Instead, key pathways and cooperation units should be dynamically adjusted according to annual changes in the compound pollution event network and its spatial backbone. Third, the digital governance results revealed the practical importance of environmental monitoring data sharing, rapid identification of pollution episodes, cross-city early warning platforms, and unified response standards for reducing the risk of cross-city linkages in compound pollution events. Therefore, future synergistic PM2.5–O3 governance in the YRD should continue to promote precursor emission reduction while strengthening intercity information coordination, joint assessment, and dynamic zoning-based governance.
This study has some limitations. First, the directed edges identified in this study represent statistically inferred event-leading relationships and should not be directly interpreted as physical transport pathways or strict causal relationships. In particular, within the L = 5-day lag window used in this study, a 1–2 day or multi-day statistical lead between cities may be related to actual air-mass transport, but it may also be driven by slow-moving weather fronts, stagnant high-pressure systems, changes in boundary layer height, shared regional meteorological forcing, or widespread unfavorable dispersion conditions. Therefore, such lead-lag relationships do not necessarily indicate that pollutants were directly transported from one city to another. The directed event network developed in this study is more appropriately understood as a tool for identifying statistical linkage patterns of compound pollution events, potential coordinated-control channels, and key city roles, rather than as direct evidence for pollutant transport directions, source–receptor relationships, or emission responsibility attribution. Future studies could further combine wind-field diagnosis, boundary-layer structure analysis, HYSPLIT backward trajectories, WRF-Chem/CMAQ chemical transport simulations, or source apportionment models to physically validate key city pairs and major linkage channels. Second, we identified PM2.5–O3 compound pollution events using city-year-specific P80 dual-threshold criteria. Although this approach improves comparability among cities, the threshold selection may still affect event counts and network structures. Future research should compare the robustness of model results under P75, P85, absolute air quality standard thresholds, and seasonal thresholds. Third, the event networks were constructed on an annual basis, which helps characterize long-term stage-dependent changes but may obscure differences between warm and cold seasons, pollution episode types, and meteorological backgrounds. Future studies could construct seasonal networks or typical weather pattern networks to identify the formation conditions of PM2.5–O3 pollution in greater detail. Fourth, we incorporated city-level attributes, such as socioeconomic conditions, industrial structure, population agglomeration, and digital governance but did not fully characterize daily meteorological conditions, boundary-layer height, solar radiation, wind fields, or NOx/VOC emission structures. Future efforts to integrate event networks, dynamic network models, and atmospheric chemical process models would help explain the cross-city linkage mechanisms of compound pollution events more accurately and provide stronger scientific support for multi-pollutant coordinated governance in the YRD.
Author Contributions
Conceptualization, H.Z. and Y.C.; methodology, H.Z.; software, H.Z.; validation, H.Z. and Y.C.; formal analysis, Y.C.; investigation, Y.C.; resources, Y.C.; data curation, Y.C.; writing—original draft preparation, H.Z.; writing—review and editing, H.Z.; visualization, Y.C.; supervision, Y.C.; project administration, Y.C.; funding acquisition, Y.C. All authors have read and agreed to the published version of the manuscript.
Funding
This research received no external funding.
Institutional Review Board Statement
Not applicable.
Informed Consent Statement
Not applicable.
Data Availability Statement
The data presented in this study are available on request from the corresponding author.
Acknowledgments
During the preparation of this manuscript, the author used [ChatGPT-5] for the purposes of language polishing. The authors have reviewed and edited the output and take full responsibility for the content of this publication.
Conflicts of Interest
The authors declare no conflicts of interest.
Abbreviations
The following abbreviations are used in this manuscript:
| TERGM | Temporal exponential random graph model |
| YRD | Yangtze River Delta |
| VOC | Volatile organic compound |
| PGDP | Per capita gross regional product |
| Dig | Digital governance variable |
| gwesp | Geometrically weighted edgewise shared partners |
| gwdsp | Geometrically weighted dyadwise shared partners |
| ROC | Receiver operating characteristic |
References
- Li, K.; Jacob, D.J.; Liao, H.; Shen, L.; Zhang, Q.; Bates, K.H. Anthropogenic drivers of 2013–2017 trends in summer surface ozone in China. Proc. Natl. Acad. Sci. USA 2019, 116, 422–427. [Google Scholar] [CrossRef] [PubMed]
- Zhao, H.; Chen, K.; Liu, Z.; Zhang, Y.; Shao, T.; Zhang, H. Coordinated control of PM2.5 and O3 is urgently needed in China after implementation of the “Air pollution prevention and control action plan”. Chemosphere 2021, 270, 129441. [Google Scholar] [CrossRef]
- Lu, X.; Hong, J.; Zhang, L.; Cooper, O.R.; Schultz, M.G.; Xu, X.; Wang, T.; Gao, M.; Zhao, Y.; Zhang, Y. Severe surface ozone pollution in China: A global perspective. Environ. Sci. Technol. Lett. 2018, 5, 487–494. [Google Scholar] [CrossRef]
- Li, K.; Jacob, D.J.; Shen, L.; Lu, X.; De Smedt, I.; Liao, H. Increases in surface ozone pollution in China from 2013 to 2019: Anthropogenic and meteorological influences. Atmos. Chem. Phys. 2020, 20, 11423–11433. [Google Scholar] [CrossRef]
- Zscheischler, J.; Westra, S.; van den Hurk, B.J.J.M.; Seneviratne, S.I.; Ward, P.J.; Pitman, A.; AghaKouchak, A.; Bresch, D.N.; Leonard, M.; Wahl, T.; et al. Future climate risk from compound events. Nat. Clim. Change 2018, 8, 469–477. [Google Scholar] [CrossRef]
- Schnell, J.L.; Prather, M.J. Co-occurrence of extremes in surface ozone, particulate matter, and temperature over eastern North America. Proc. Natl. Acad. Sci. USA 2017, 114, 2854–2859. [Google Scholar] [CrossRef]
- Donges, J.F.; Schleussner, C.-F.; Siegmund, J.F.; Donner, R.V. Event coincidence analysis for quantifying statistical interrelationships between event time series. Eur. Phys. J. Spec. Top. 2016, 225, 471–487. [Google Scholar] [CrossRef]
- Pusede, S.E.; Steiner, A.L.; Cohen, R.C. Temperature and recent trends in the chemistry of continental surface ozone. Chem. Rev. 2015, 115, 3898–3918. [Google Scholar] [CrossRef]
- Xing, J.; Wang, J.; Mathur, R.; Wang, S.; Sarwar, G.; Pleim, J.; Hogrefe, C.; Zhang, Y.; Jiang, J.; Wong, D.C.; et al. Impacts of aerosol direct effects on tropospheric ozone through changes in atmospheric dynamics and photolysis rates. Atmos. Chem. Phys. 2017, 17, 9869–9883. [Google Scholar] [CrossRef] [PubMed]
- Wang, T.; Xue, L.; Brimblecombe, P.; Lam, Y.F.; Li, L.; Zhang, L. Ozone pollution in China: A review of concentrations, meteorological influences, chemical precursors, and effects. Sci. Total Environ. 2017, 575, 1582–1596. [Google Scholar] [CrossRef]
- Quian Quiroga, R.; Kreuz, T.; Grassberger, P. Event synchronization: A simple and fast method to measure synchronicity and time delay patterns. Phys. Rev. E 2002, 66, 041904. [Google Scholar] [CrossRef] [PubMed]
- Donges Jonathan, F.; Zou, Y.; Marwan, N.; Kurths, J. Complex networks in climate dynamics: Comparing linear and nonlinear network construction methods. Eur. Phys. J. Spec. Top. 2009, 174, 157–179. [Google Scholar] [CrossRef]
- Wolf, F.; Bauer, J.; Boers, N.; Donner, R.V. Event synchrony measures for functional climate network analysis: A case study on South American rainfall dynamics. Chaos 2020, 30, 033102. [Google Scholar] [CrossRef]
- Agarwal, A.; Marwan, N.; Rathinasamy, M.; Merz, B.; Kurths, J. Multi-scale event synchronization analysis for unravelling climate processes: A wavelet-based approach. Nonlinear Process. Geophys. 2017, 24, 599–611. [Google Scholar] [CrossRef]
- Li, K.; Huang, Y.; Liu, K.; Wang, M.; Cai, F.; Zhang, J.; Boers, N. Key propagation pathways of extreme precipitation events revealed by climate networks. npj Clim. Atmos. Sci. 2024, 7, 165. [Google Scholar] [CrossRef]
- Hanneke, S.; Fu, W.; Xing, E.P. Discrete temporal models of social networks. Electron. J. Stat. 2010, 4, 585–605. [Google Scholar] [CrossRef]
- Krivitsky, P.N.; Handcock, M.S. A separable model for dynamic networks. J. R. Stat. Soc. Ser. B Stat. Methodol. 2014, 76, 29–46. [Google Scholar] [CrossRef]
- Leifeld, P.; Cranmer, S.J.; Desmarais, B.A. Temporal exponential random graph models with btergm: Estimation and bootstrap confidence intervals. J. Stat. Softw. 2018, 83, 1–36. [Google Scholar] [CrossRef]
- GB 3095-2012; Ambient Air Quality Standards. Ministry of Ecology and Environment of the People’s Republic of China: Beijing, China; State Administration for Market Regulation: Beijing, China, 2012. Available online: https://www.mee.gov.cn/ywgz/fgbz/bz/bzwb/dqhjbh/dqhjzlbz/201203/W020120410330232398521.pdf (accessed on 8 January 2026).
- HJ 633-2012; Technical Regulation on Ambient Air Quality Index (AQI) (Trial). Ministry of Ecology and Environment of the People’s Republic of China: Beijing, China, 2012. Available online: https://www.mee.gov.cn/ywgz/fgbz/bz/bzwb/jcffbz/201203/W020120410332725219541.pdf (accessed on 10 January 2026).
- Geng, G.; Liu, Y.; Liu, Y.; Liu, S.; Cheng, J.; Yan, L.; Wu, N.; Hu, H.; Tong, D.; Zheng, B.; et al. Efficacy of China’s clean air actions to tackle PM2.5 pollution between 2013 and 2020. Nat. Geosci. 2024, 17, 987–994. [Google Scholar] [CrossRef]
- Dong, Z.; Xing, J.; Zhang, F.; Wang, S.; Ding, D.; Wang, H.; Huang, C.; Zheng, H.; Jiang, Y.; Hao, J. Synergetic PM2.5 and O3 control strategy for the Yangtze River Delta, China. J. Environ. Sci. 2023, 123, 281–291. [Google Scholar] [CrossRef]
- Hu, F.; Xie, P.; Xu, J.; Lv, Y.; Zhang, Z.; Zheng, J.; Tian, X. Long-term trends of ozone in the Yangtze River Delta, China: Spatiotemporal impacts of meteorological factors, local, and non-local emissions. J. Environ. Sci. 2025, 156, 408–420. [Google Scholar] [CrossRef]
- Gong, K.; Xie, X.; Ying, Q.; Hu, J. Seasonal quantification of the inter-city transport of PM2.5 in the Yangtze River Delta region of China based on a source-oriented chemical transport model and the Michaelis-Menten equation. Sci. Total Environ. 2024, 945, 173856. [Google Scholar] [CrossRef]
- Yang, H.; Chen, L.; Liao, H.; Zhu, J.; Wang, W.; Li, X. Weakened aerosol–radiation interaction exacerbating ozone pollution in eastern China since China’s clean air actions. Atmos. Chem. Phys. 2024, 24, 4001–4015. [Google Scholar] [CrossRef]
- Qin, M.; Hu, A.; Mao, J.; Li, X.; Sheng, L.; Sun, J.; Li, J.; Wang, X.; Zhang, Y.; Hu, J. PM2.5 and O3 relationships affected by the atmospheric oxidizing capacity in the Yangtze River Delta, China. Sci. Total Environ. 2022, 810, 152268. [Google Scholar] [CrossRef] [PubMed]
- He, L.; Duan, Y.; Zhang, Y.; Yu, Q.; Huo, J.; Chen, J.; Cui, H.; Li, Y.; Ma, W. Effects of VOC emissions from chemical industrial parks on regional O3-PM2. 5 compound pollution in the Yangtze River Delta. Sci. Total Environ. 2024, 906, 167503. [Google Scholar] [CrossRef]
- Li, L.; Xia, Z.; Yi, J.; Qi, R.; Cheng, J. Industrial agglomeration and PM2.5 pollution in Yangtze River Economic Belt in China: Non-linear estimation and mechanism analysis. Front. Environ. Sci. 2024, 11, 1346323. [Google Scholar] [CrossRef]
- Carnegie, N.B.; Krivitsky, P.N.; Hunter, D.R.; Goodreau, S.M. An approximation method for improving dynamic network model fitting. J. Comput. Graph. Stat. 2015, 24, 502–519. [Google Scholar] [CrossRef]
- Sun, D.; Wei, J.; Shi, M.; Sun, H.; Liu, Y. Developing while polluting? Evidence from the Yangtze River delta in China. Environ. Dev. Sustain. 2026, 28, 651–670. [Google Scholar] [CrossRef]
- Chen, W.; Hu, S.; Liu, Y. Synergistic policy effects of digitization in reducing air pollution and addressing climate change in China. J. Environ. Manag. 2025, 380, 124730. [Google Scholar] [CrossRef]
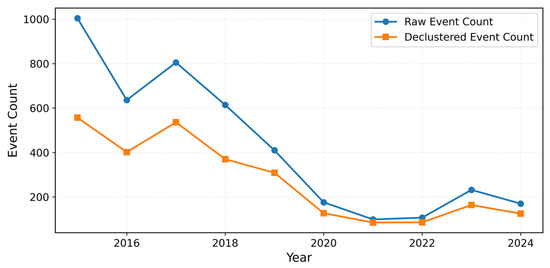
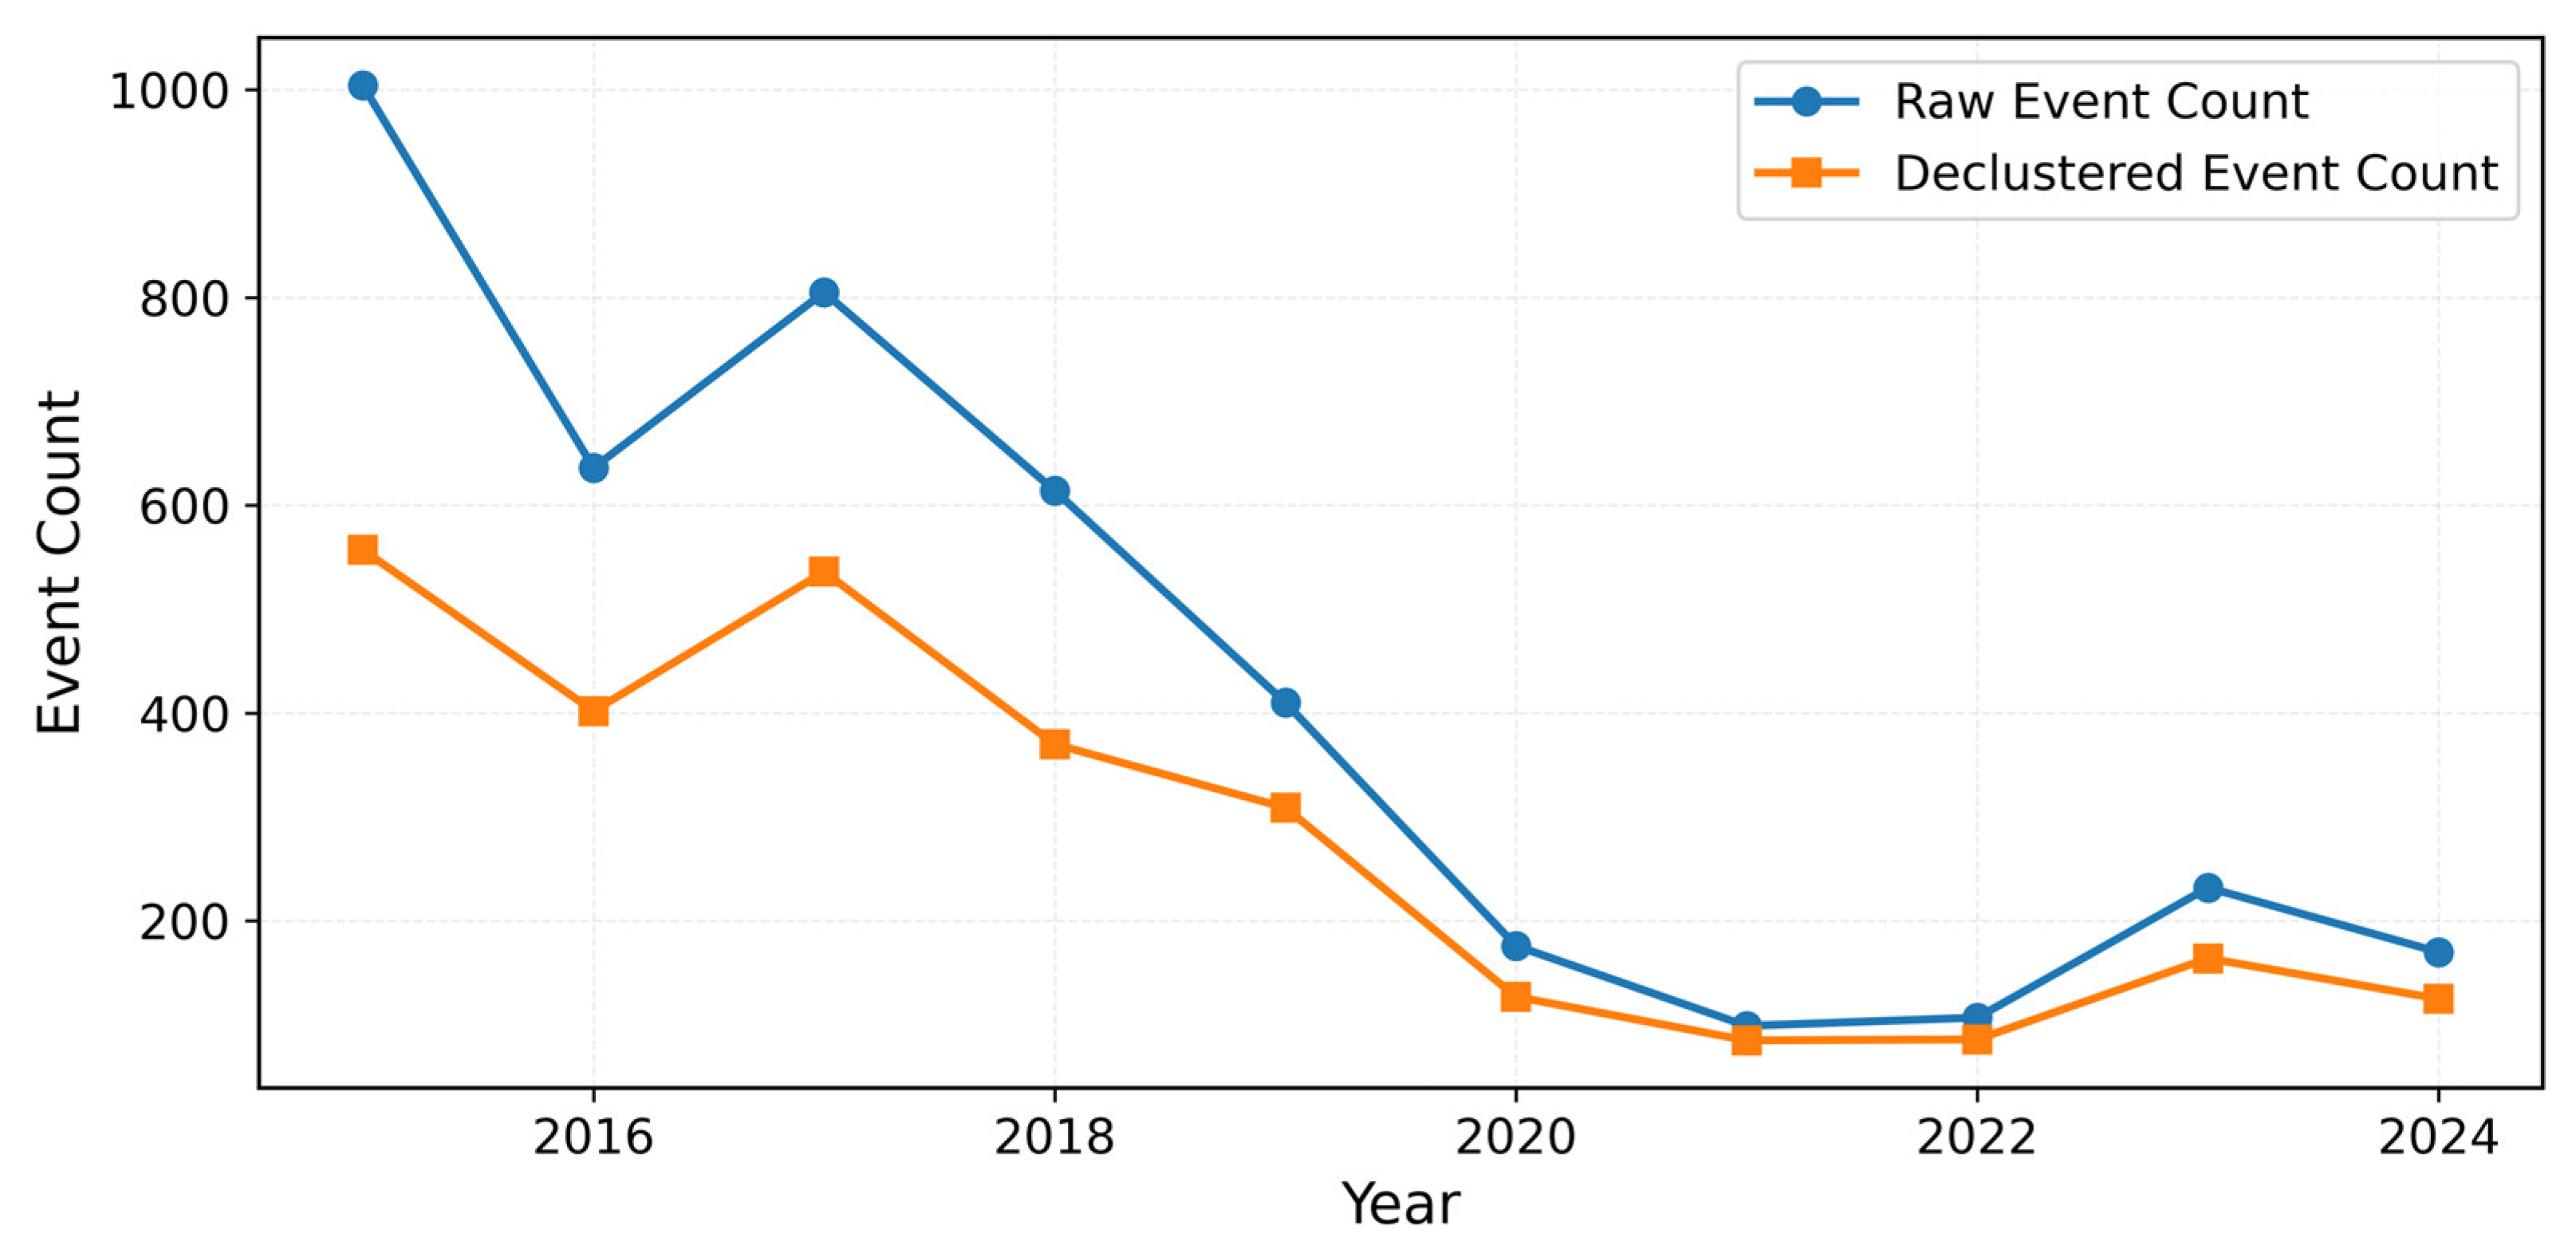
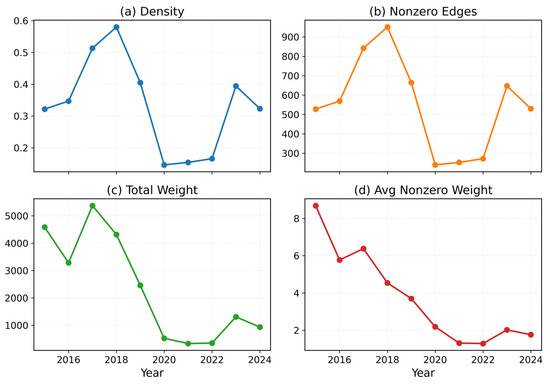
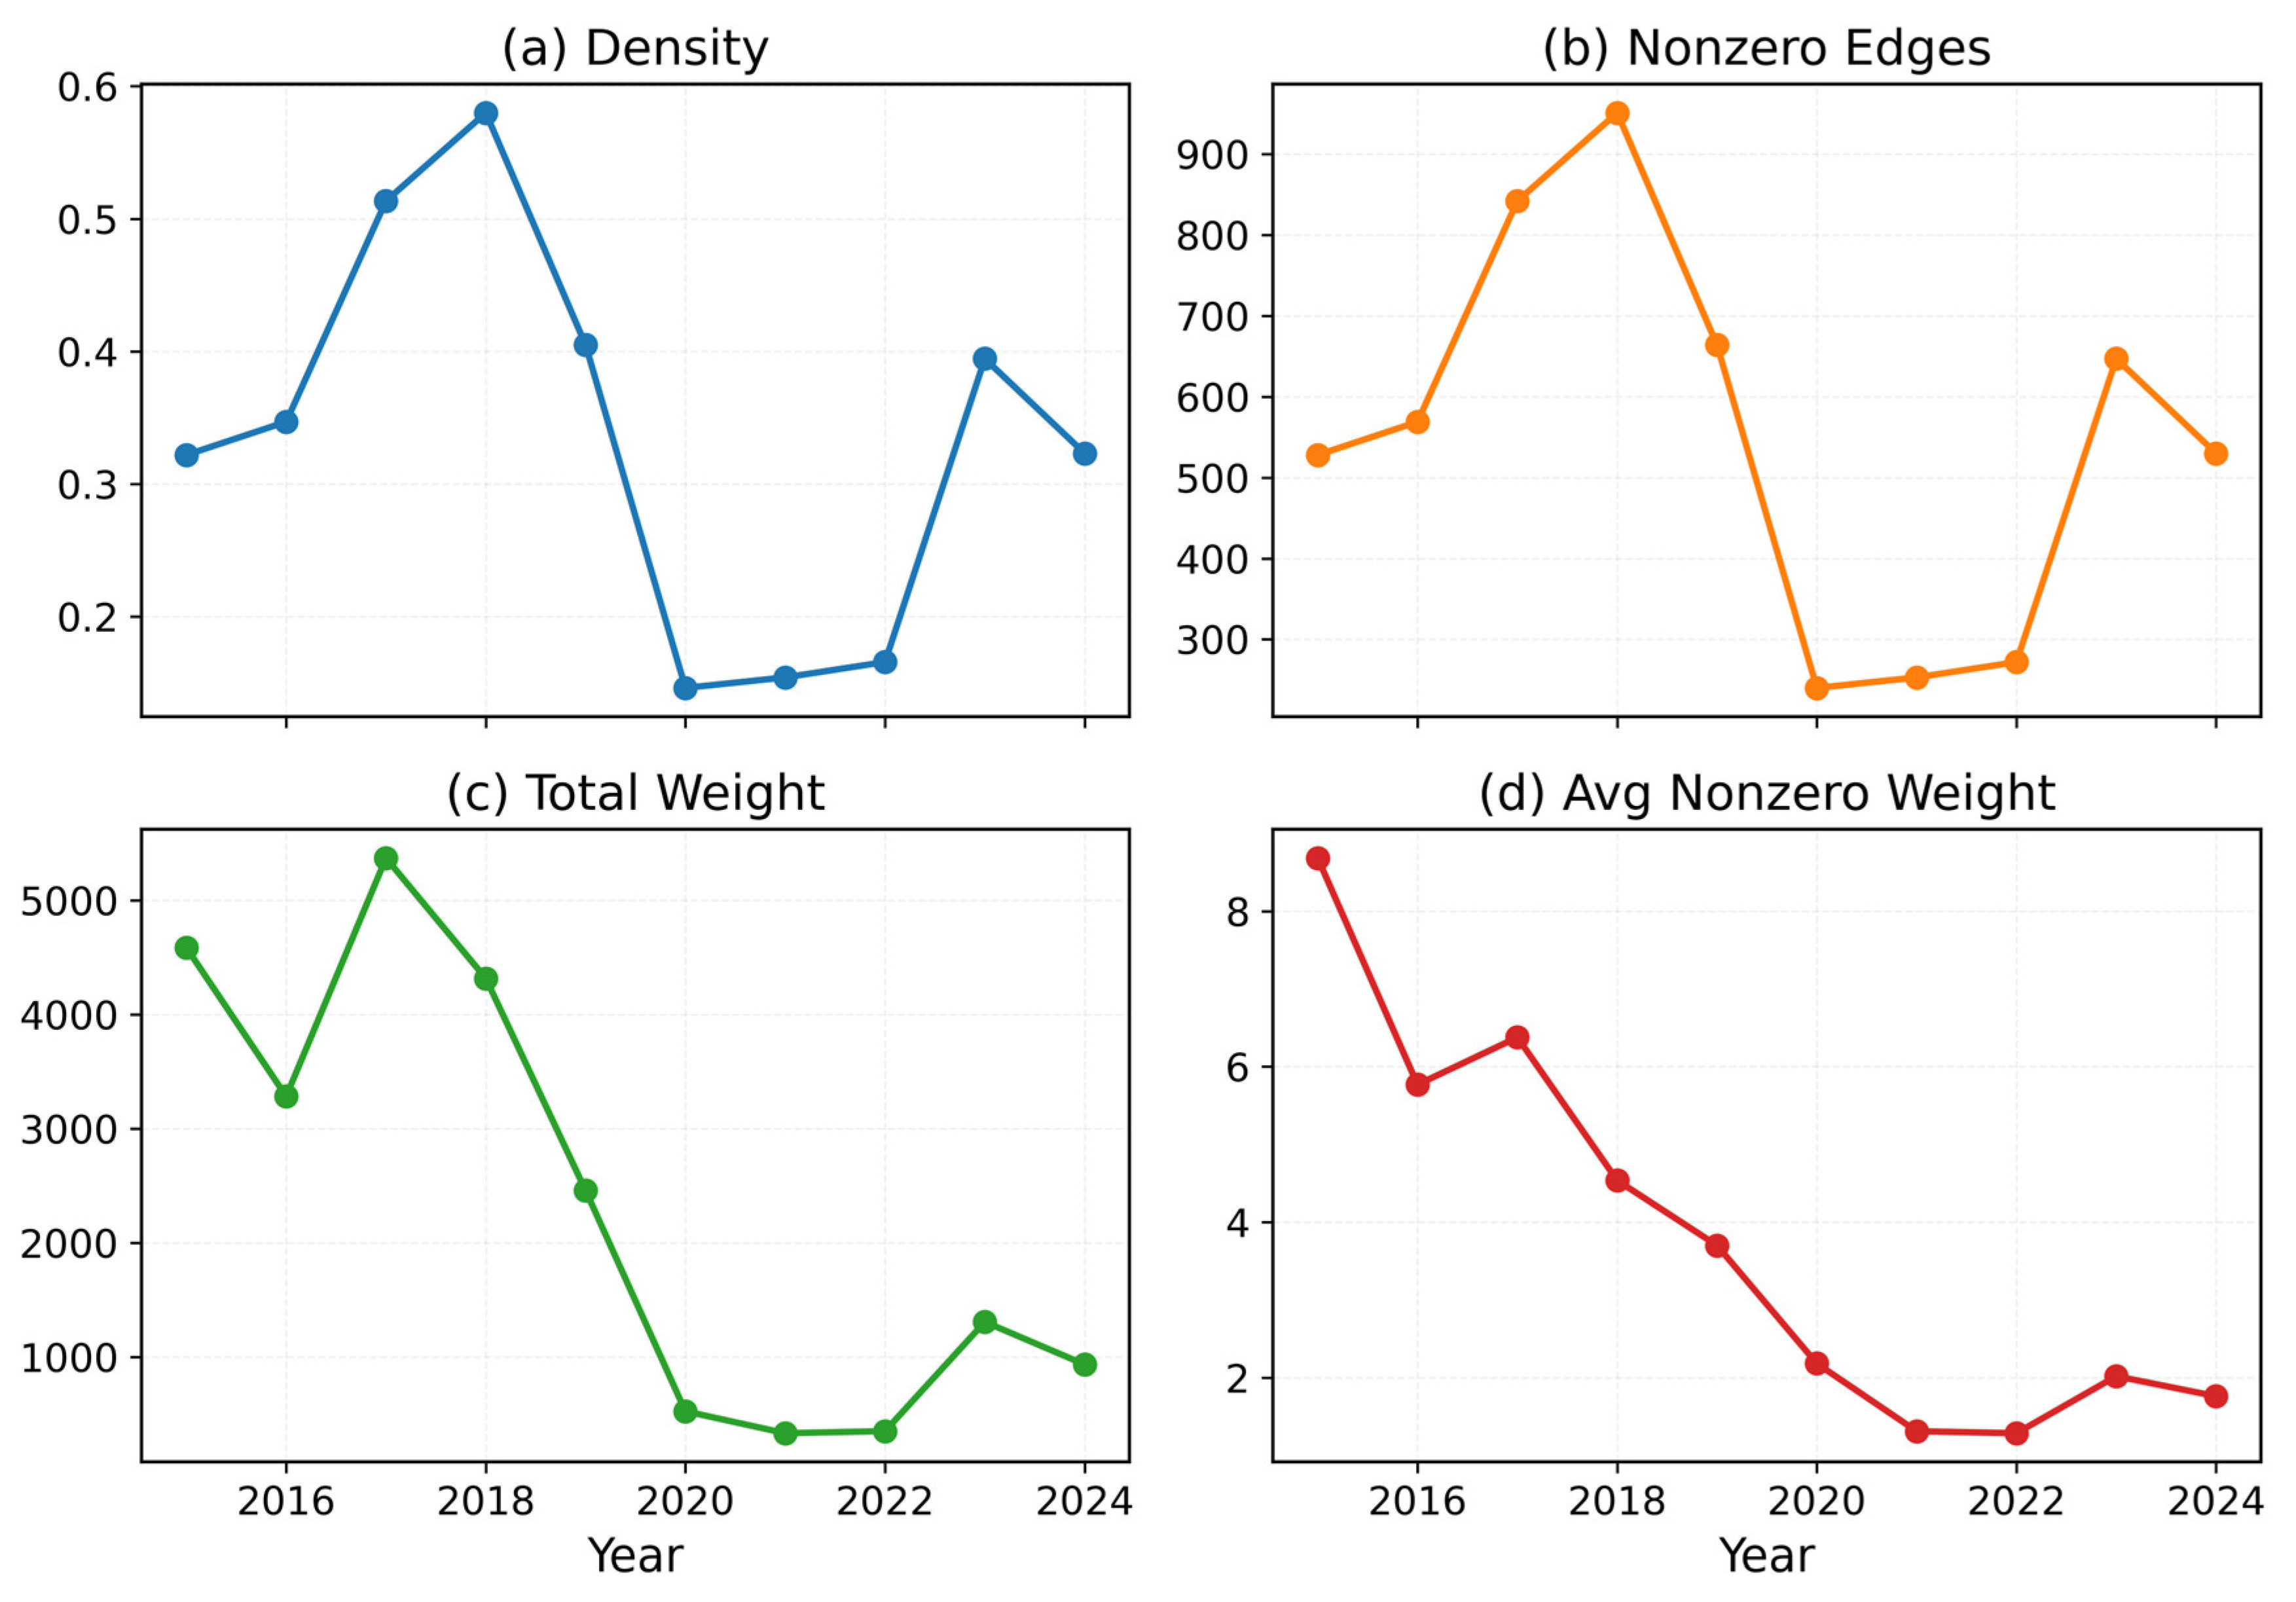
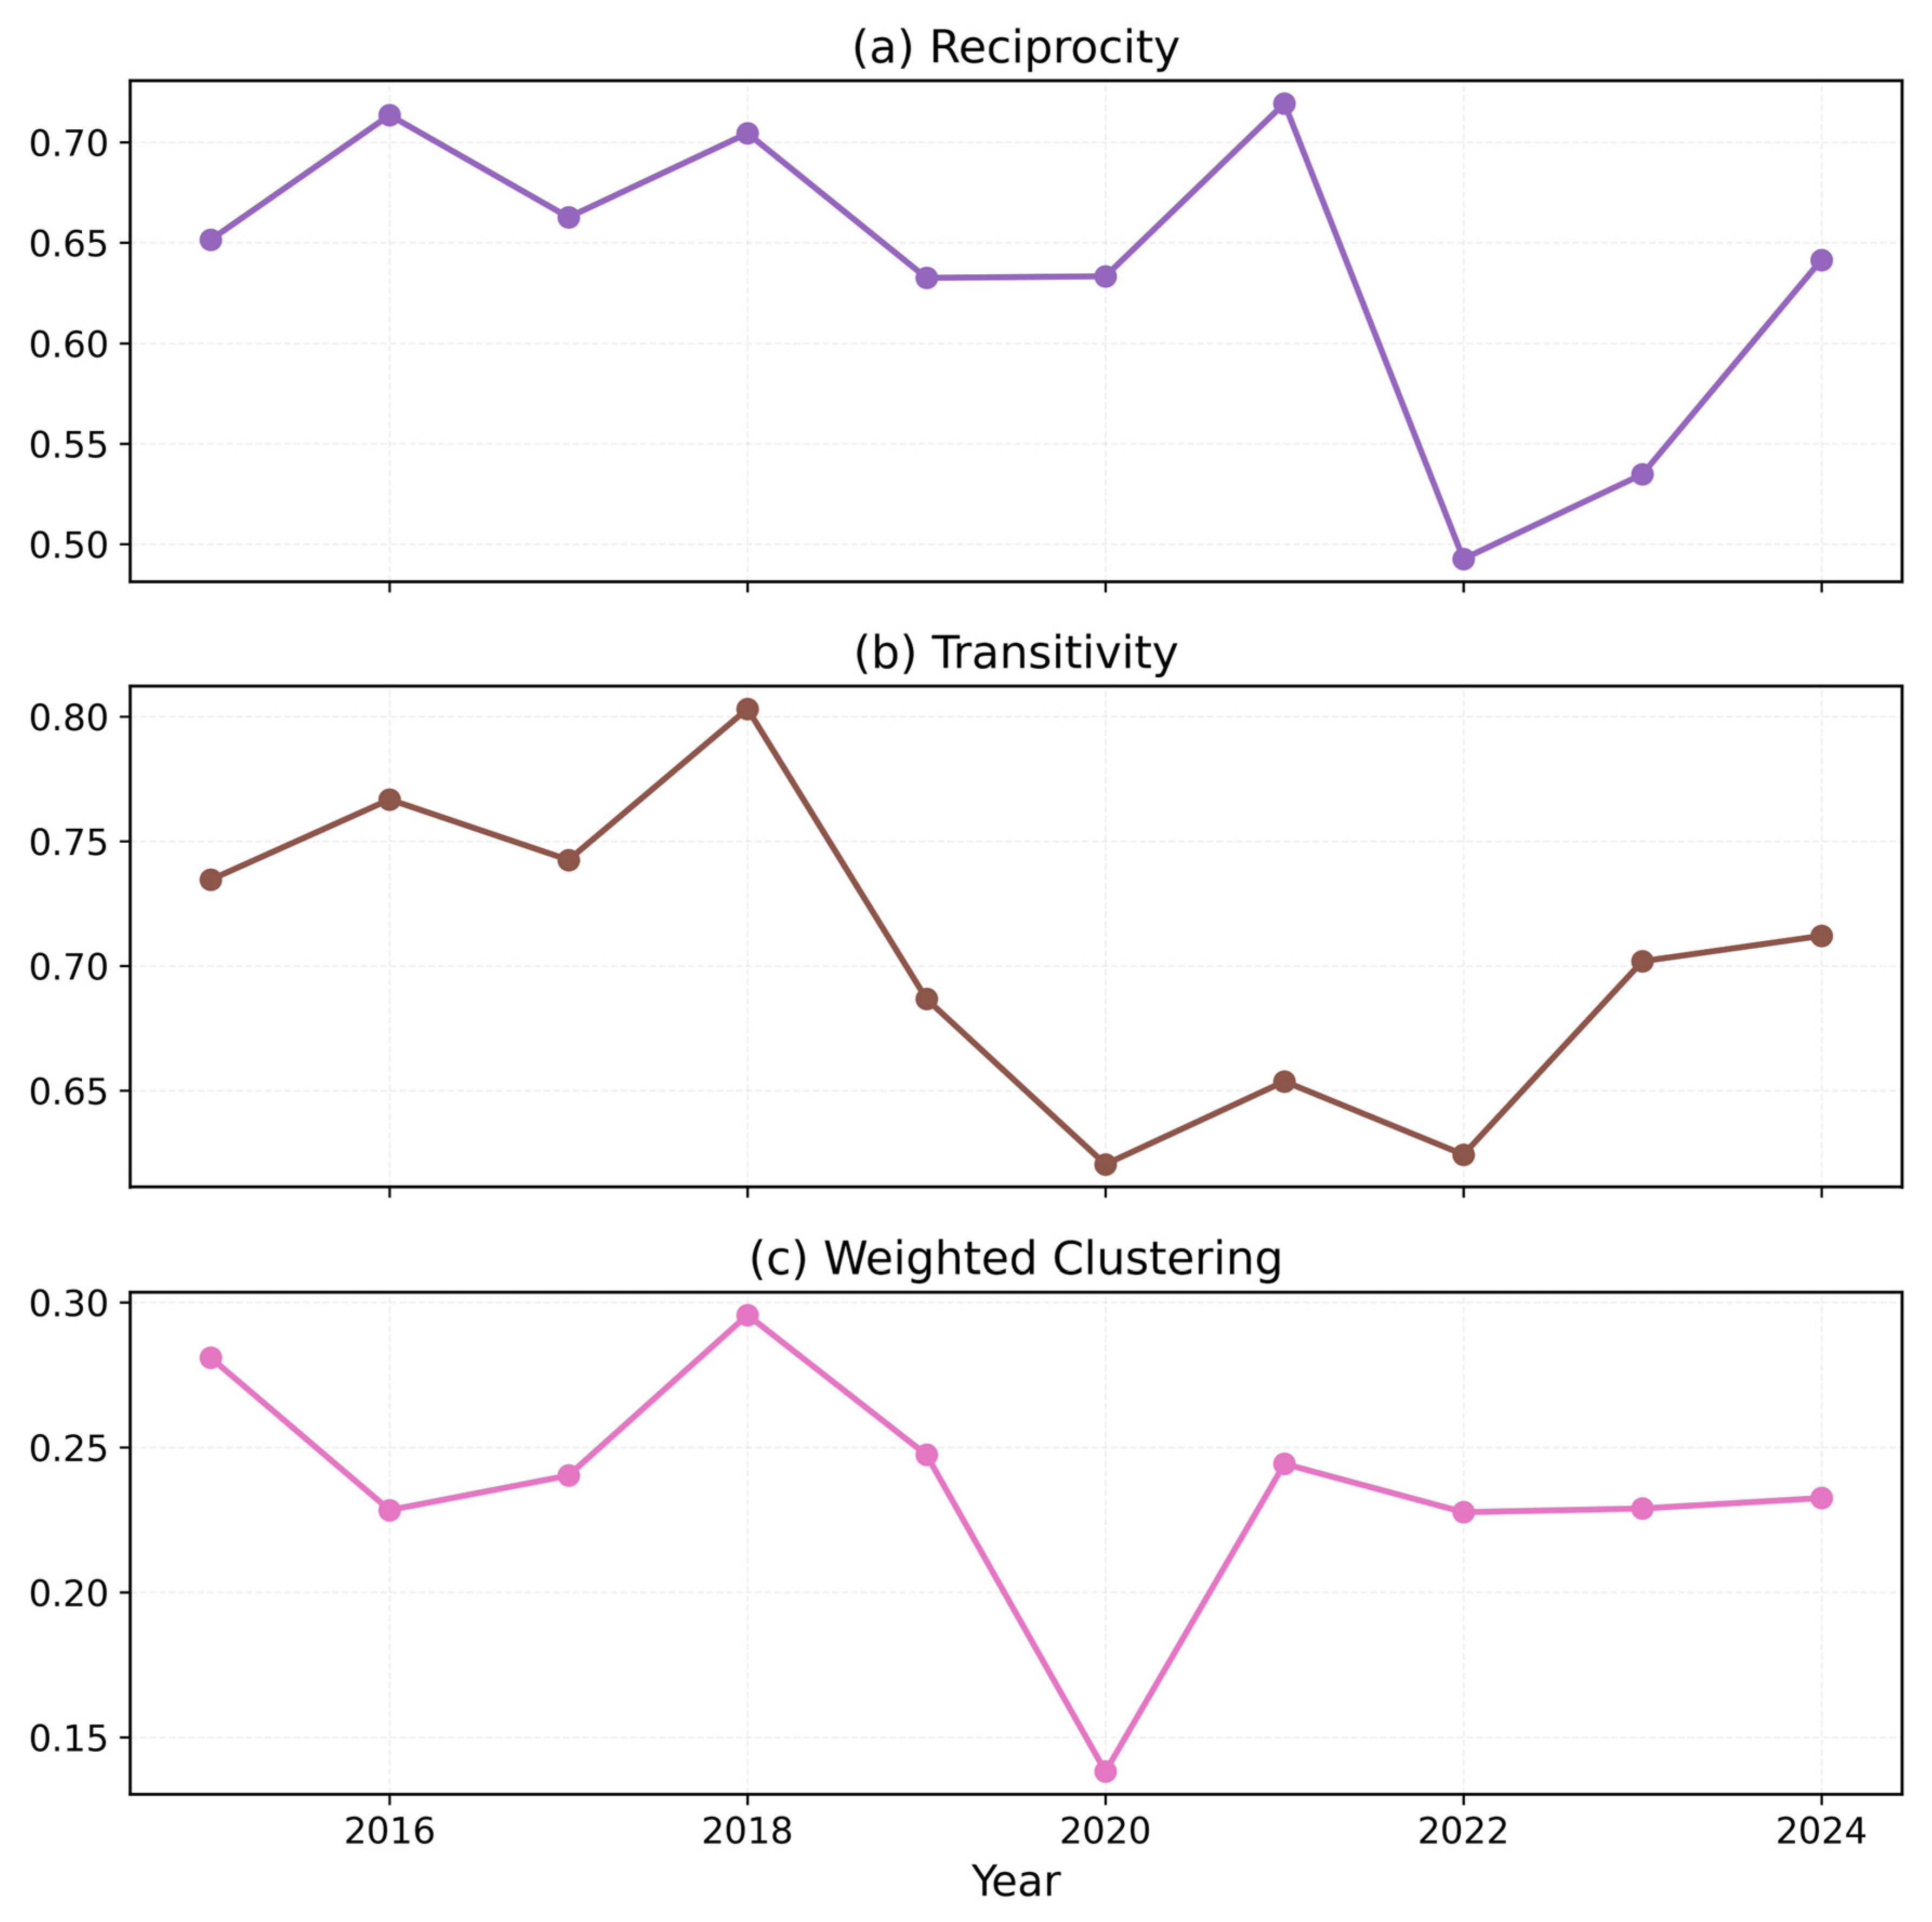
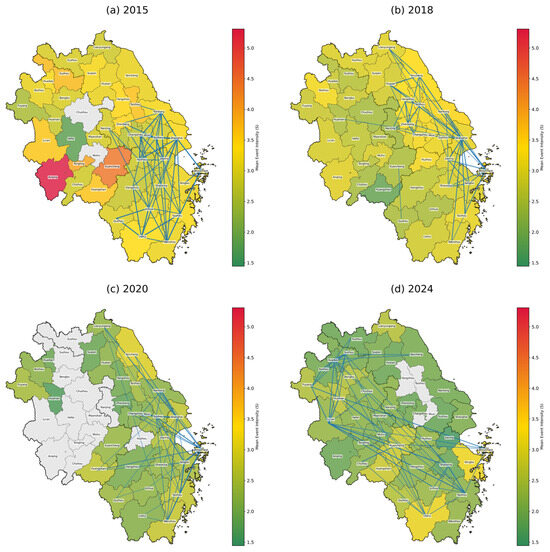
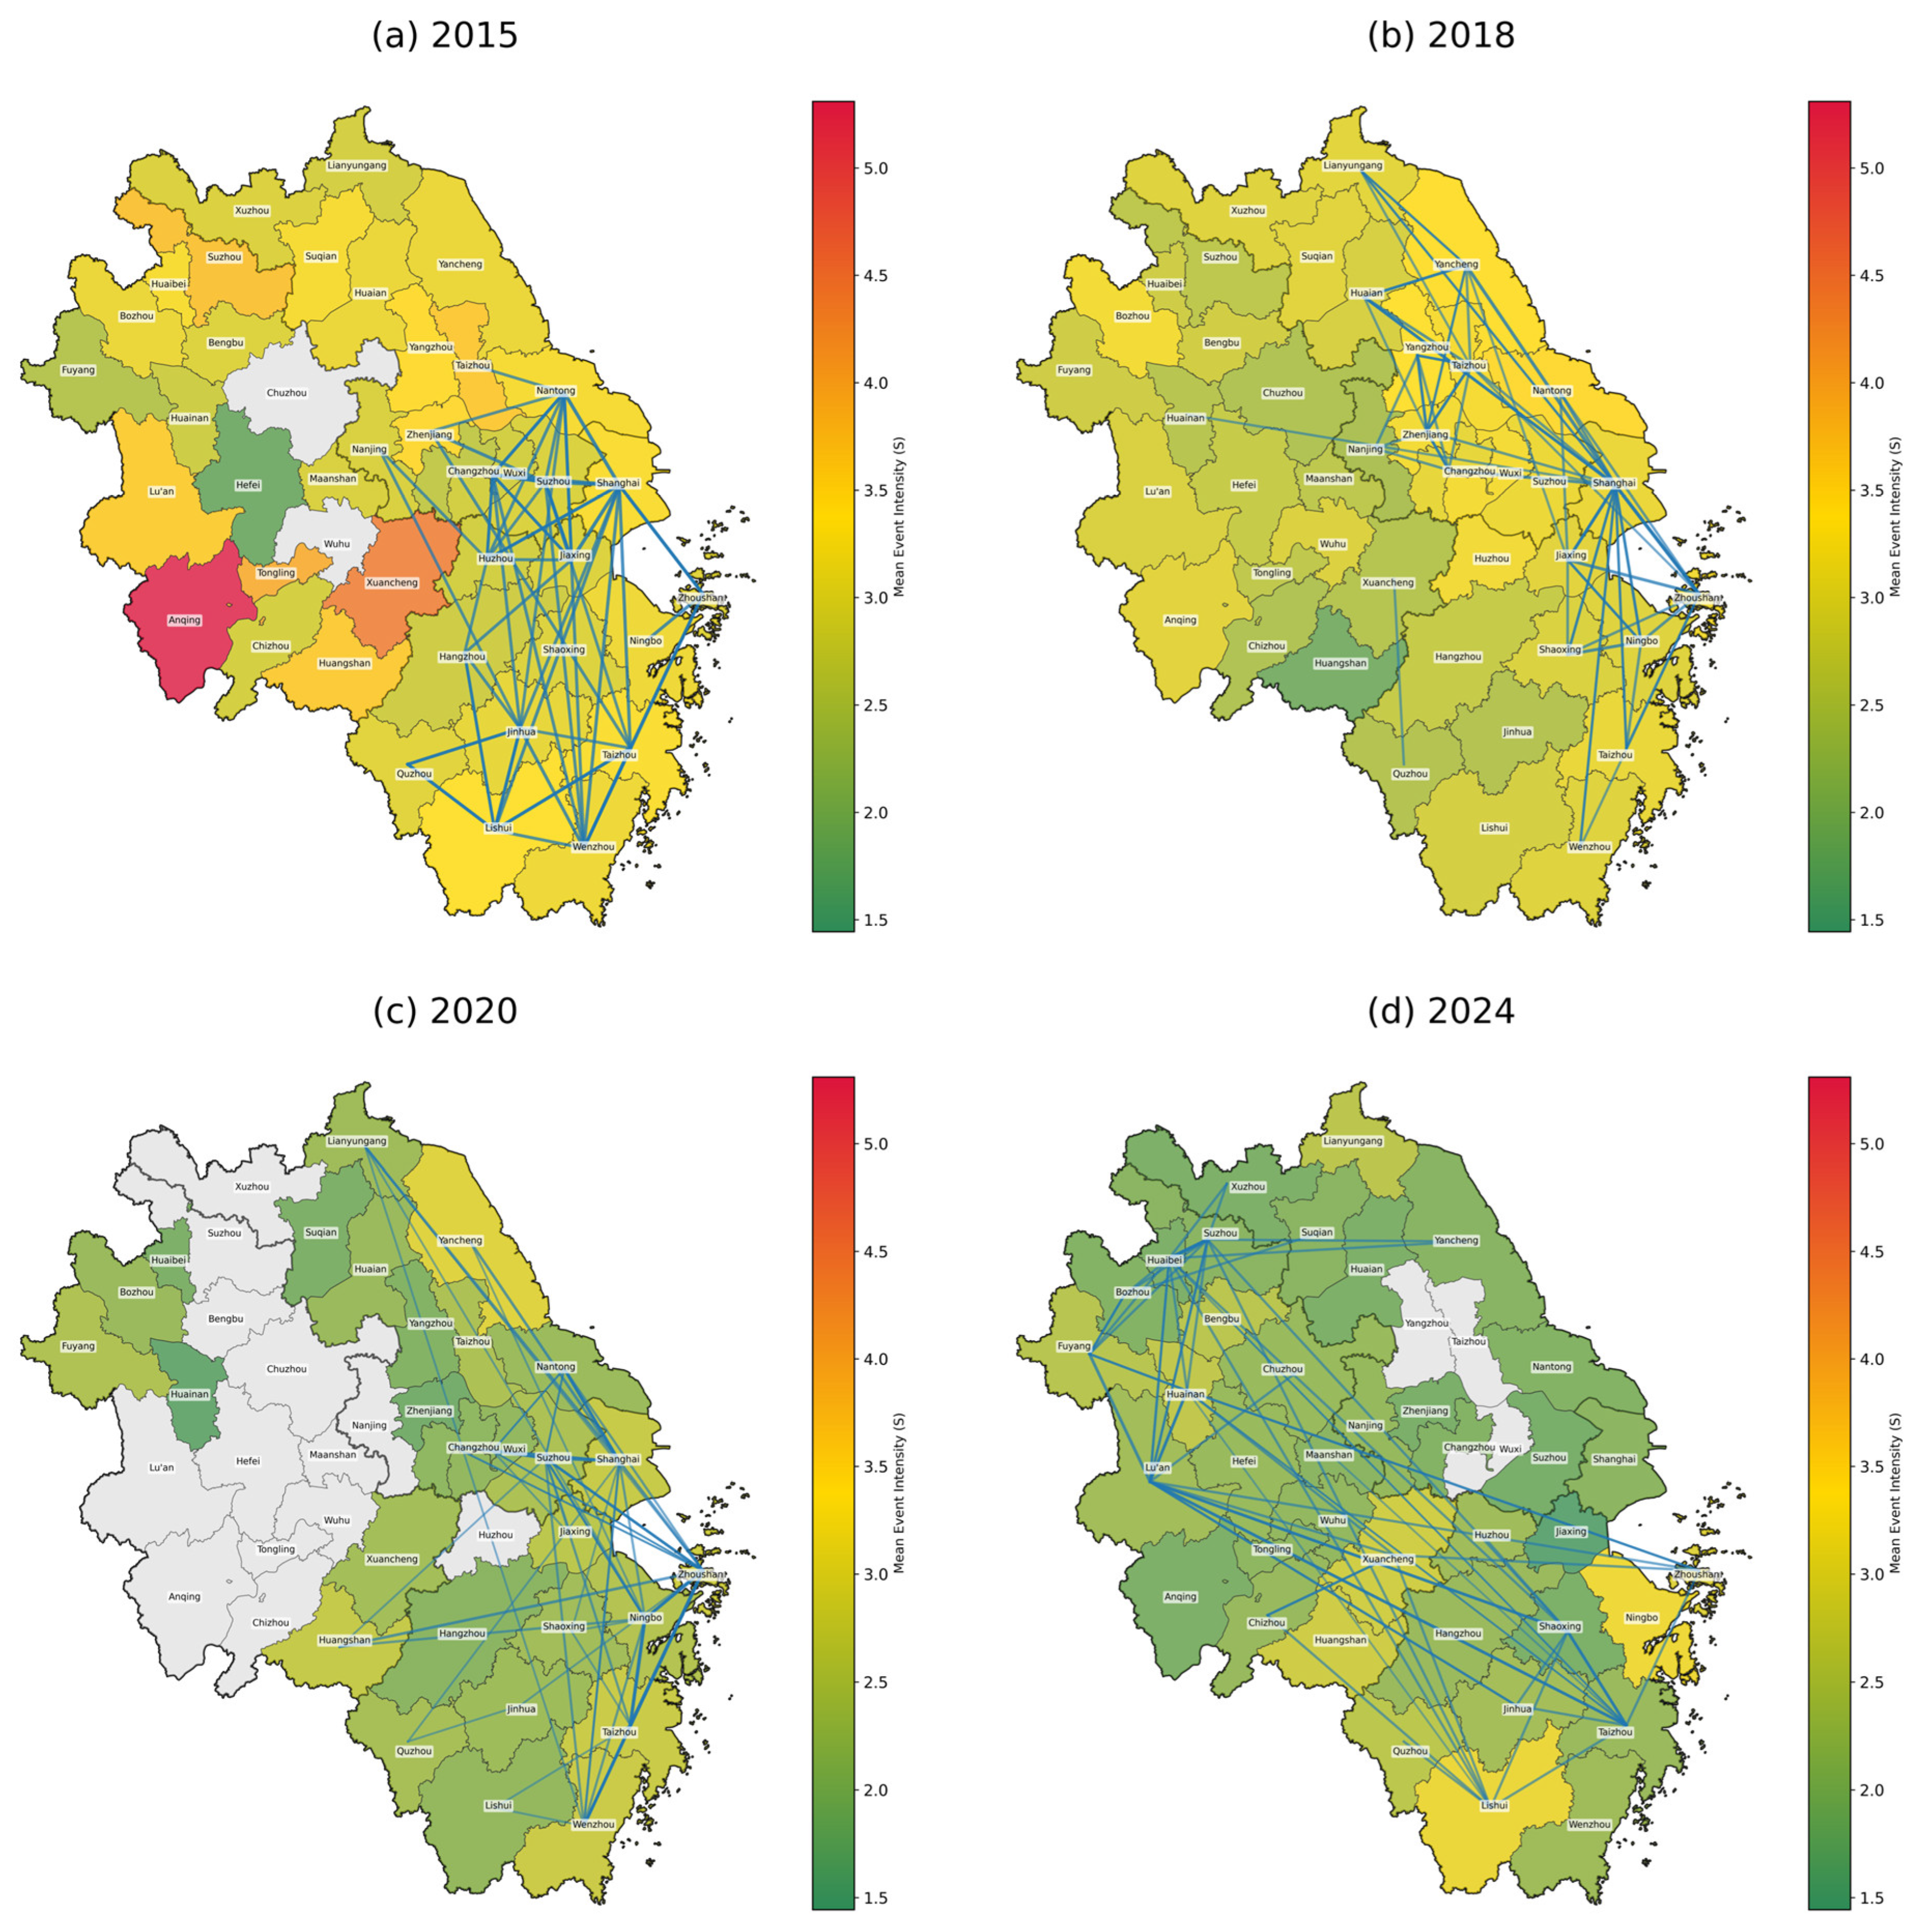
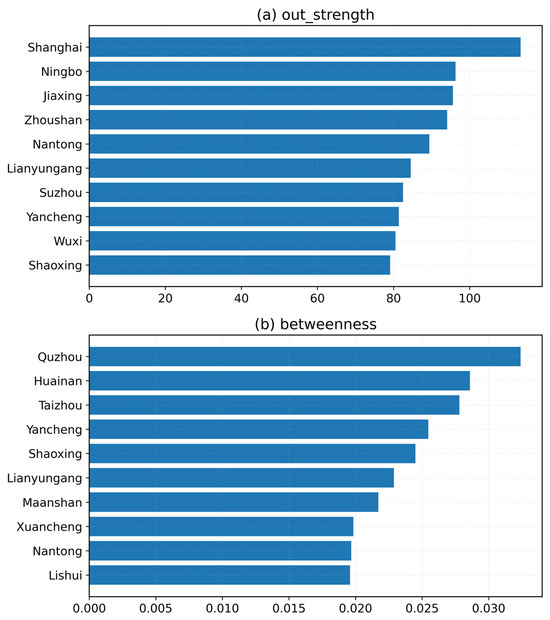
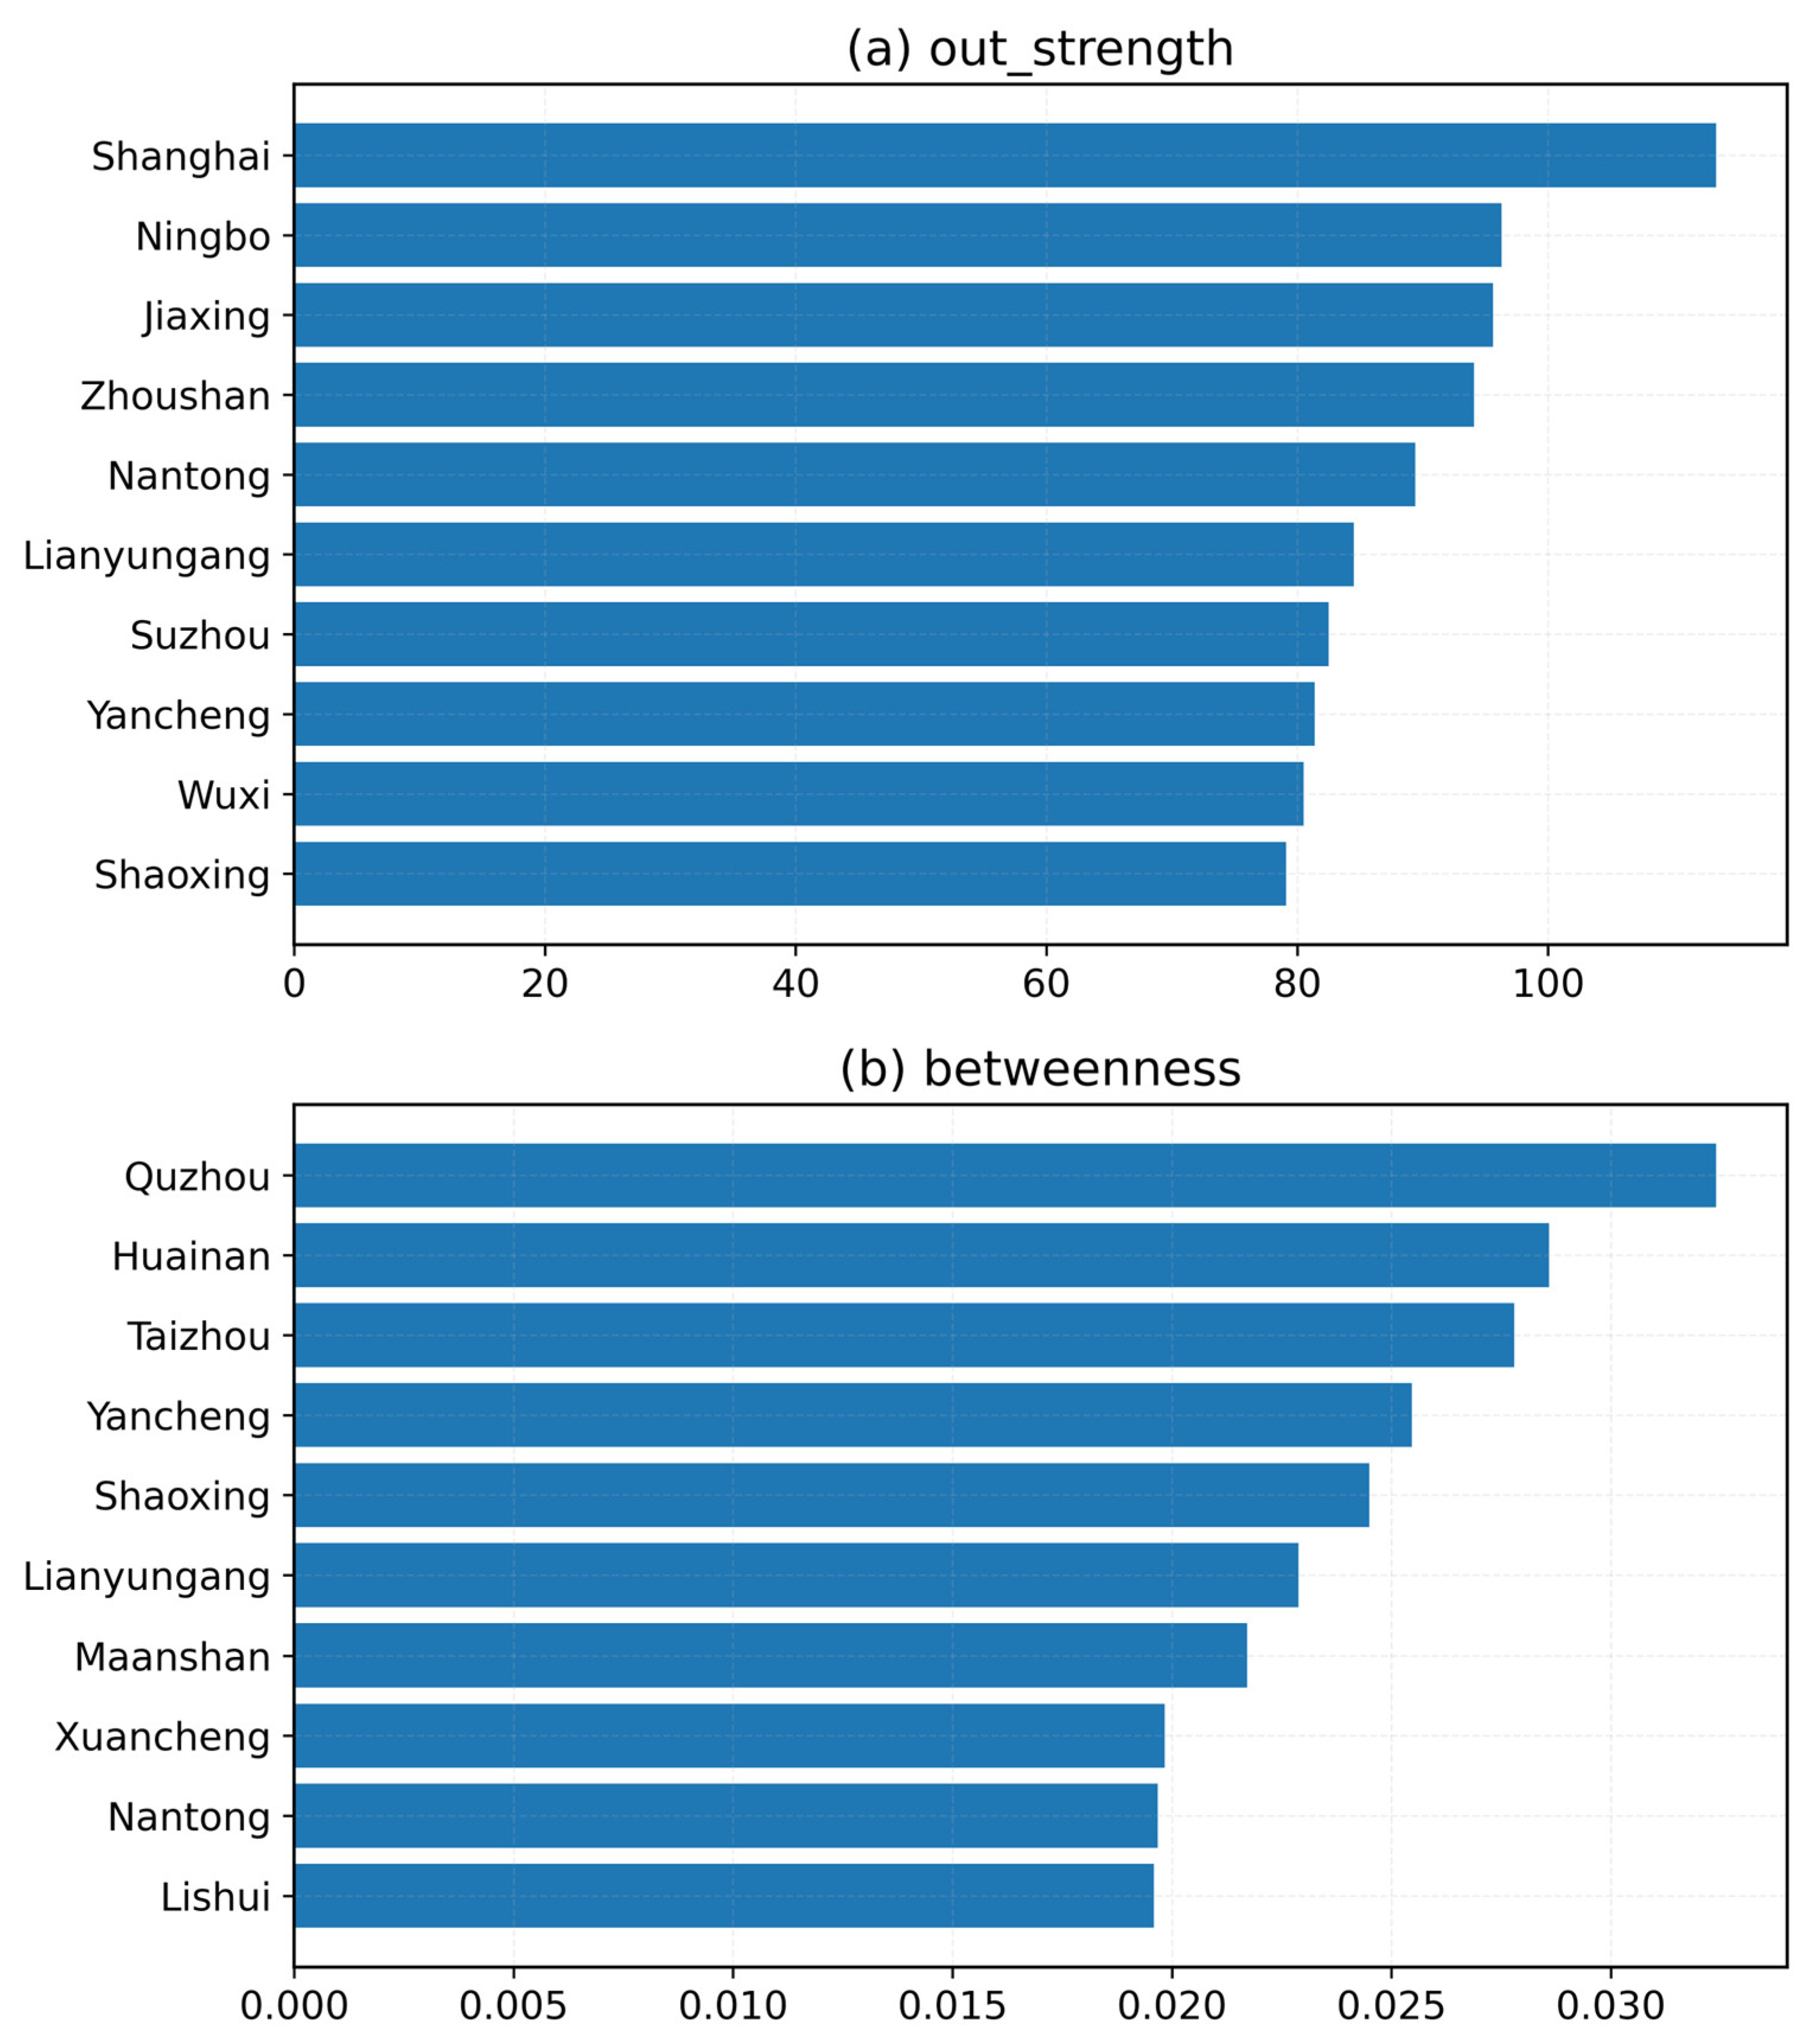
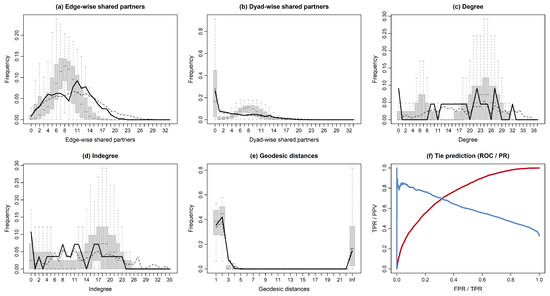
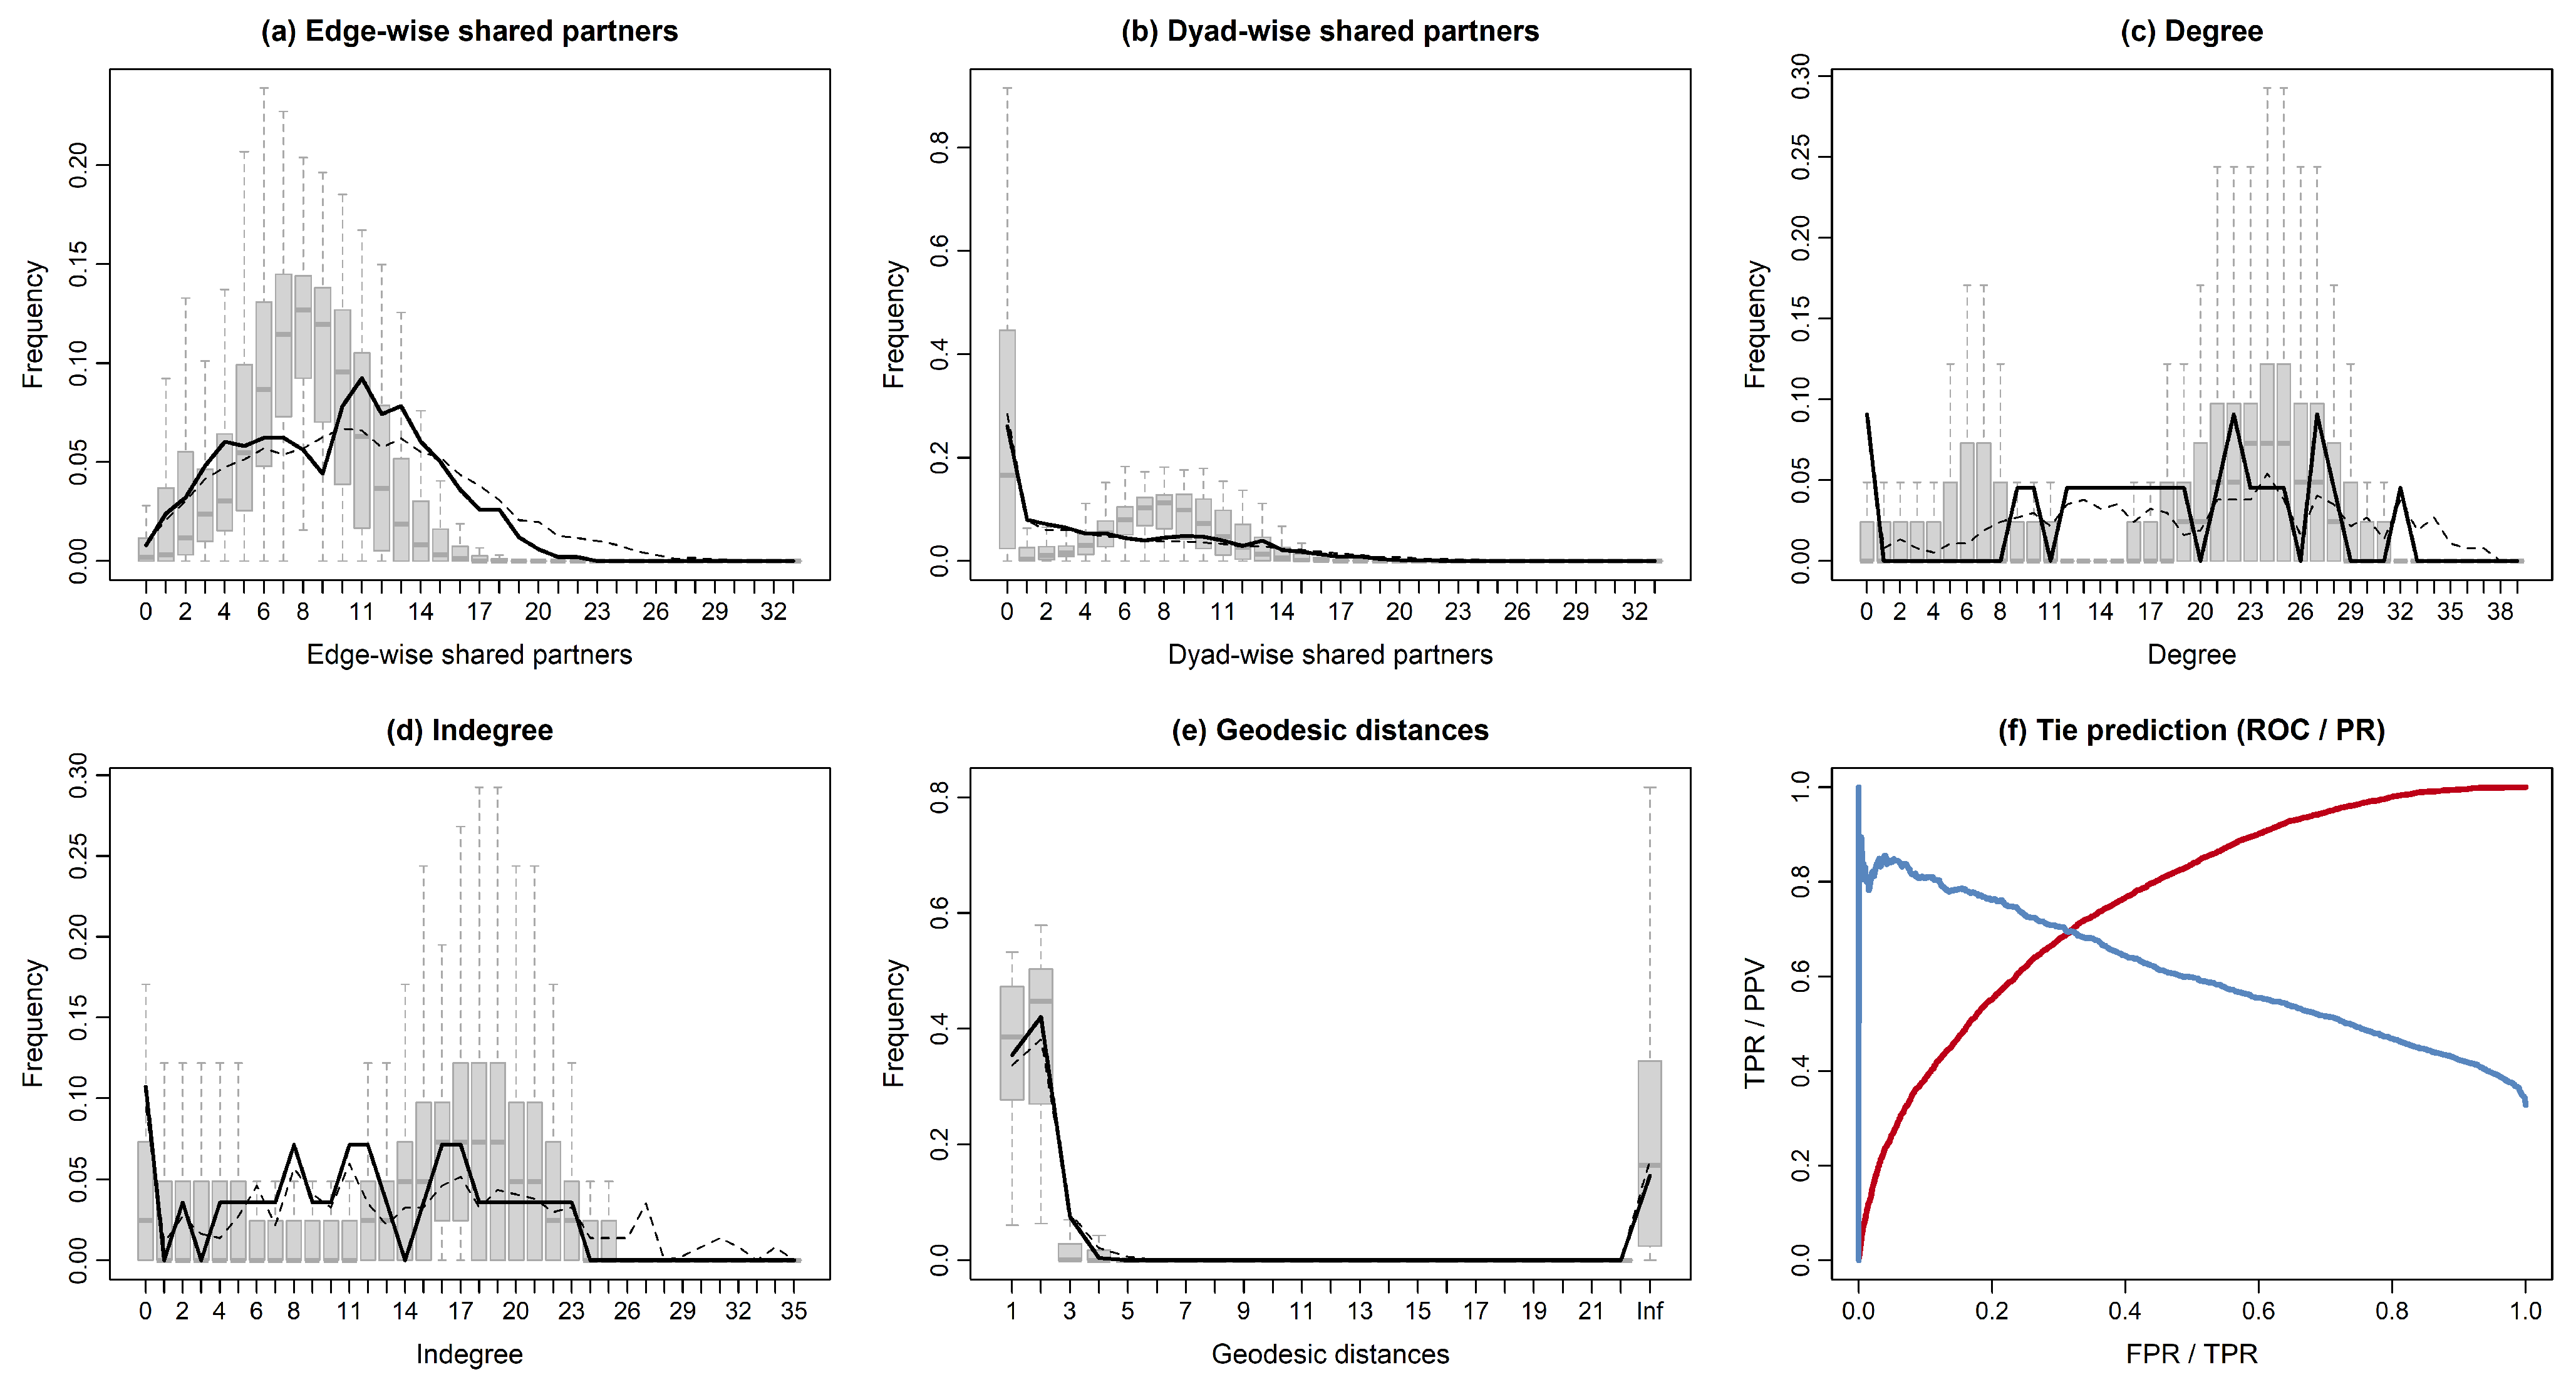

Disclaimer/Publisher’s Note: The statements, opinions and data contained in all publications are solely those of the individual author(s) and contributor(s) and not of MDPI and/or the editor(s). MDPI and/or the editor(s) disclaim responsibility for any injury to people or property resulting from any ideas, methods, instructions or products referred to in the content. |
© 2026 by the authors. Licensee MDPI, Basel, Switzerland. This article is an open access article distributed under the terms and conditions of the Creative Commons Attribution (CC BY) license.