


Abstract
Soil moisture (SM) governs land–atmosphere exchanges and strongly influences agricultural management and hydrological assessment, yet high-resolution mapping remains challenging due to sensor-specific confounding effects and limited field observations. This study develops a practical workflow for point-scale SM estimation and wall-to-wall mapping by integrating multi-sensor remote sensing predictors with ensemble learning. A compact predictor set was constructed from Sentinel-2 optical indices, Sentinel-1 SAR descriptors (σVV and the polarization ratio σVH/σVV), and topographic information, collocated with in situ SM measurements along a transect in the study area. Three tree-based regressors—Random Forest, XGBoost, and CatBoost—were trained under an identical feature configuration and evaluated using R2, Root Mean Square Error (RMSE), and Mean Absolute Error (MAE) together with predicted–observed diagnostics. A stacking ensemble was then implemented using leakage-controlled K-fold out-of-fold predictions to generate meta-features, with a Decision Tree as the meta-learner tuned via a grid search. Results show that base learners achieve comparable skill (R2 ≈ 0.60–0.62; RMSE ≈ 0.038–0.039), while stacking improves test accuracy (RMSE = 0.0346) and provides a stable mapping-ready model. The trained framework was transferred to stacked raster predictors to produce spatially continuous SM maps, revealing coherent moisture heterogeneity across the region. Accordingly, the objective of this study is to develop a compact and application-oriented point-to-map workflow for high-resolution soil moisture estimation by integrating Sentinel-1/2-derived predictors with stacking-based model fusion, rather than to propose a new physically based retrieval model.
1. Introduction
Soil moisture (SM) represents the amount of water stored in the unsaturated soil layer and is a controlling state variable for a wide range of land-surface processes [1,2,3]. Variations in SM influence how incoming energy is partitioned between latent and sensible heat, affect evapotranspiration and vegetation water stress, and modulate how rainfall is converted into infiltration versus runoff [4,5,6]. These coupled effects make SM central to hydrological predictability, agricultural drought assessment, ecosystem functioning, and the characterization of extremes; it has therefore been recognized as an Essential Climate Variable in global climate observing frameworks [7,8,9].
Despite its importance, SM is notoriously difficult to observe comprehensively because it varies sharply across space and time due to precipitation heterogeneity, vegetation dynamics, soil properties, terrain controls, and land management [10,11,12,13]. In situ sensors provide accurate point measurements but cannot feasibly represent landscape-to-regional variability, especially in heterogeneous or inaccessible areas [14,15,16]. Satellite remote sensing provides a scalable alternative by enabling repeated, spatially continuous observations and long-term records suitable for monitoring SM patterns and their evolution. Yet satellite-derived SM products are still constrained by sensor characteristics, retrieval assumptions, and model-related uncertainties, which can limit their reliability and applicability in complex environments [17,18,19].
Microwave remote sensing has formed the backbone of SM retrieval because soil water content alters dielectric properties and, in turn, microwave emission and scattering. Current observation strategies broadly fall into passive microwave radiometry and active microwave radar [20,21,22]. Passive sensors can provide frequent, often near-daily global coverage, but their footprints are typically on the order of tens of kilometers, which is too coarse for many land management and hazard-related applications [23,24,25]. Active systems, especially Synthetic Aperture Radar (SAR), provide much finer spatial detail and are therefore attractive for mapping within-field variability and capturing heterogeneous landscapes [26,27]. However, the higher resolution of SAR comes with increased sensitivity to confounding factors such as incidence angle, surface roughness, vegetation structure, and terrain-induced geometric distortions (e.g., layover and shadow). These characteristics create a fundamental trade-off between spatial detail and retrieval robustness, and motivate methods that can better separate soil moisture signals from competing scattering sources. Historically, SM inversion has relied on empirical relationships, semi-empirical formulations, and physically based forward models [28,29]. Physical approaches leverage microwave–soil interaction theory and often incorporate vegetation effects via simplified radiative transfer concepts such as the Water Cloud Model, while soil surface scattering is represented through models such as Oh/Dubois or more general frameworks like the Integral Equation Model (IEM) [30,31,32,33]. These models are valuable because they preserve interpretability and connect retrievals to measurable physical parameters. In practice, however, their application at scale is hindered by the need for numerous inputs—particularly vegetation descriptors and roughness parameters—that are difficult to observe accurately and consistently over large regions. Additionally, assumptions made for specific soil–vegetation conditions may not transfer well to other contexts, and uncertainty in required inputs can propagate into retrieval error.
Machine learning (ML) methods have increasingly been adopted to complement (or, in some cases, replace) traditional retrieval strategies by learning statistical mappings from satellite observables to reference SM measurements [34,35]. Beyond direct retrieval, AI/ML has been demonstrated as useful for several related objectives, including time-series reconstruction (gap filling), estimation of deeper-layer moisture by combining surface signals with auxiliary predictors, spatial scaling/downscaling across resolutions using multi-resolution inputs, and even short- to medium-range forecasting of SM dynamics [36,37,38,39]. The broader methodological consensus is that ML and physical models should not be viewed as mutually exclusive; instead, integrating data-driven flexibility with physically meaningful constraints is increasingly seen as a pathway toward improved accuracy, scalability, and robustness [40,41]. Nevertheless, ML-based SM estimation remains nontrivial. Performance is sensitive to training data representativeness (spatial coverage, land-cover diversity, seasonality), differences between point-scale ground measurements and satellite footprints, and the presence of confounding factors that vary across landscapes. In SAR-based contexts, where roughness and vegetation can dominate backscatter variations, robust retrieval often requires multi-source predictors that explicitly or implicitly capture these influences, as well as validation designs that reduce optimistic bias [42,43].
Building on these considerations, we develop an application-oriented soil moisture (SM) modeling and mapping workflow. At the feature level, we integrate optical moisture-related indices (Moisture Stress Index, MSI; Normalized Difference Water Index, NDWI), SAR backscatter descriptors (e.g., σVV and σVH/σVV), and Digital Elevation Model (DEM) to jointly represent surface/vegetation water status, dielectric-driven scattering responses, and terrain controls on soil water redistribution as well as SAR observation geometry, thereby mitigating uncertainties associated with relying on a single sensor modality. At the modeling stage, we construct a stacking ensemble with Random Forest, XGBoost, and CatBoost as base learners, generate out-of-fold meta-features via K-fold cross-validation to limit overfitting, and employ a meta-learner to fuse base-model predictions. The trained framework is then transferred to stacked multi-band predictor rasters to produce spatially continuous SM maps at the resolution of the input raster stack, supporting downstream applications that require explicit spatial products rather than site-level estimates.
2. Study Area
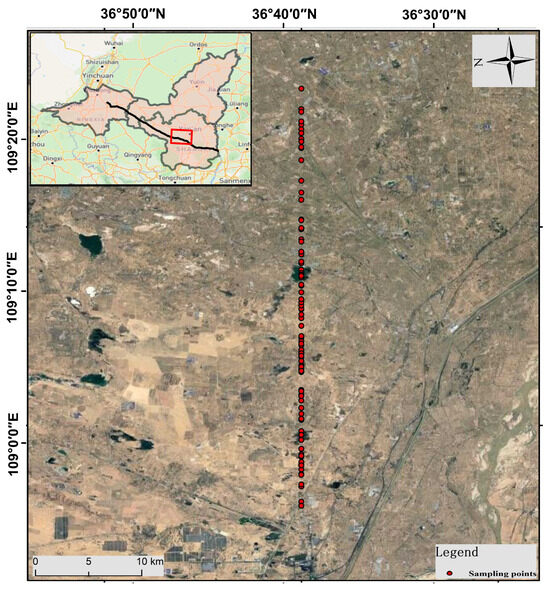
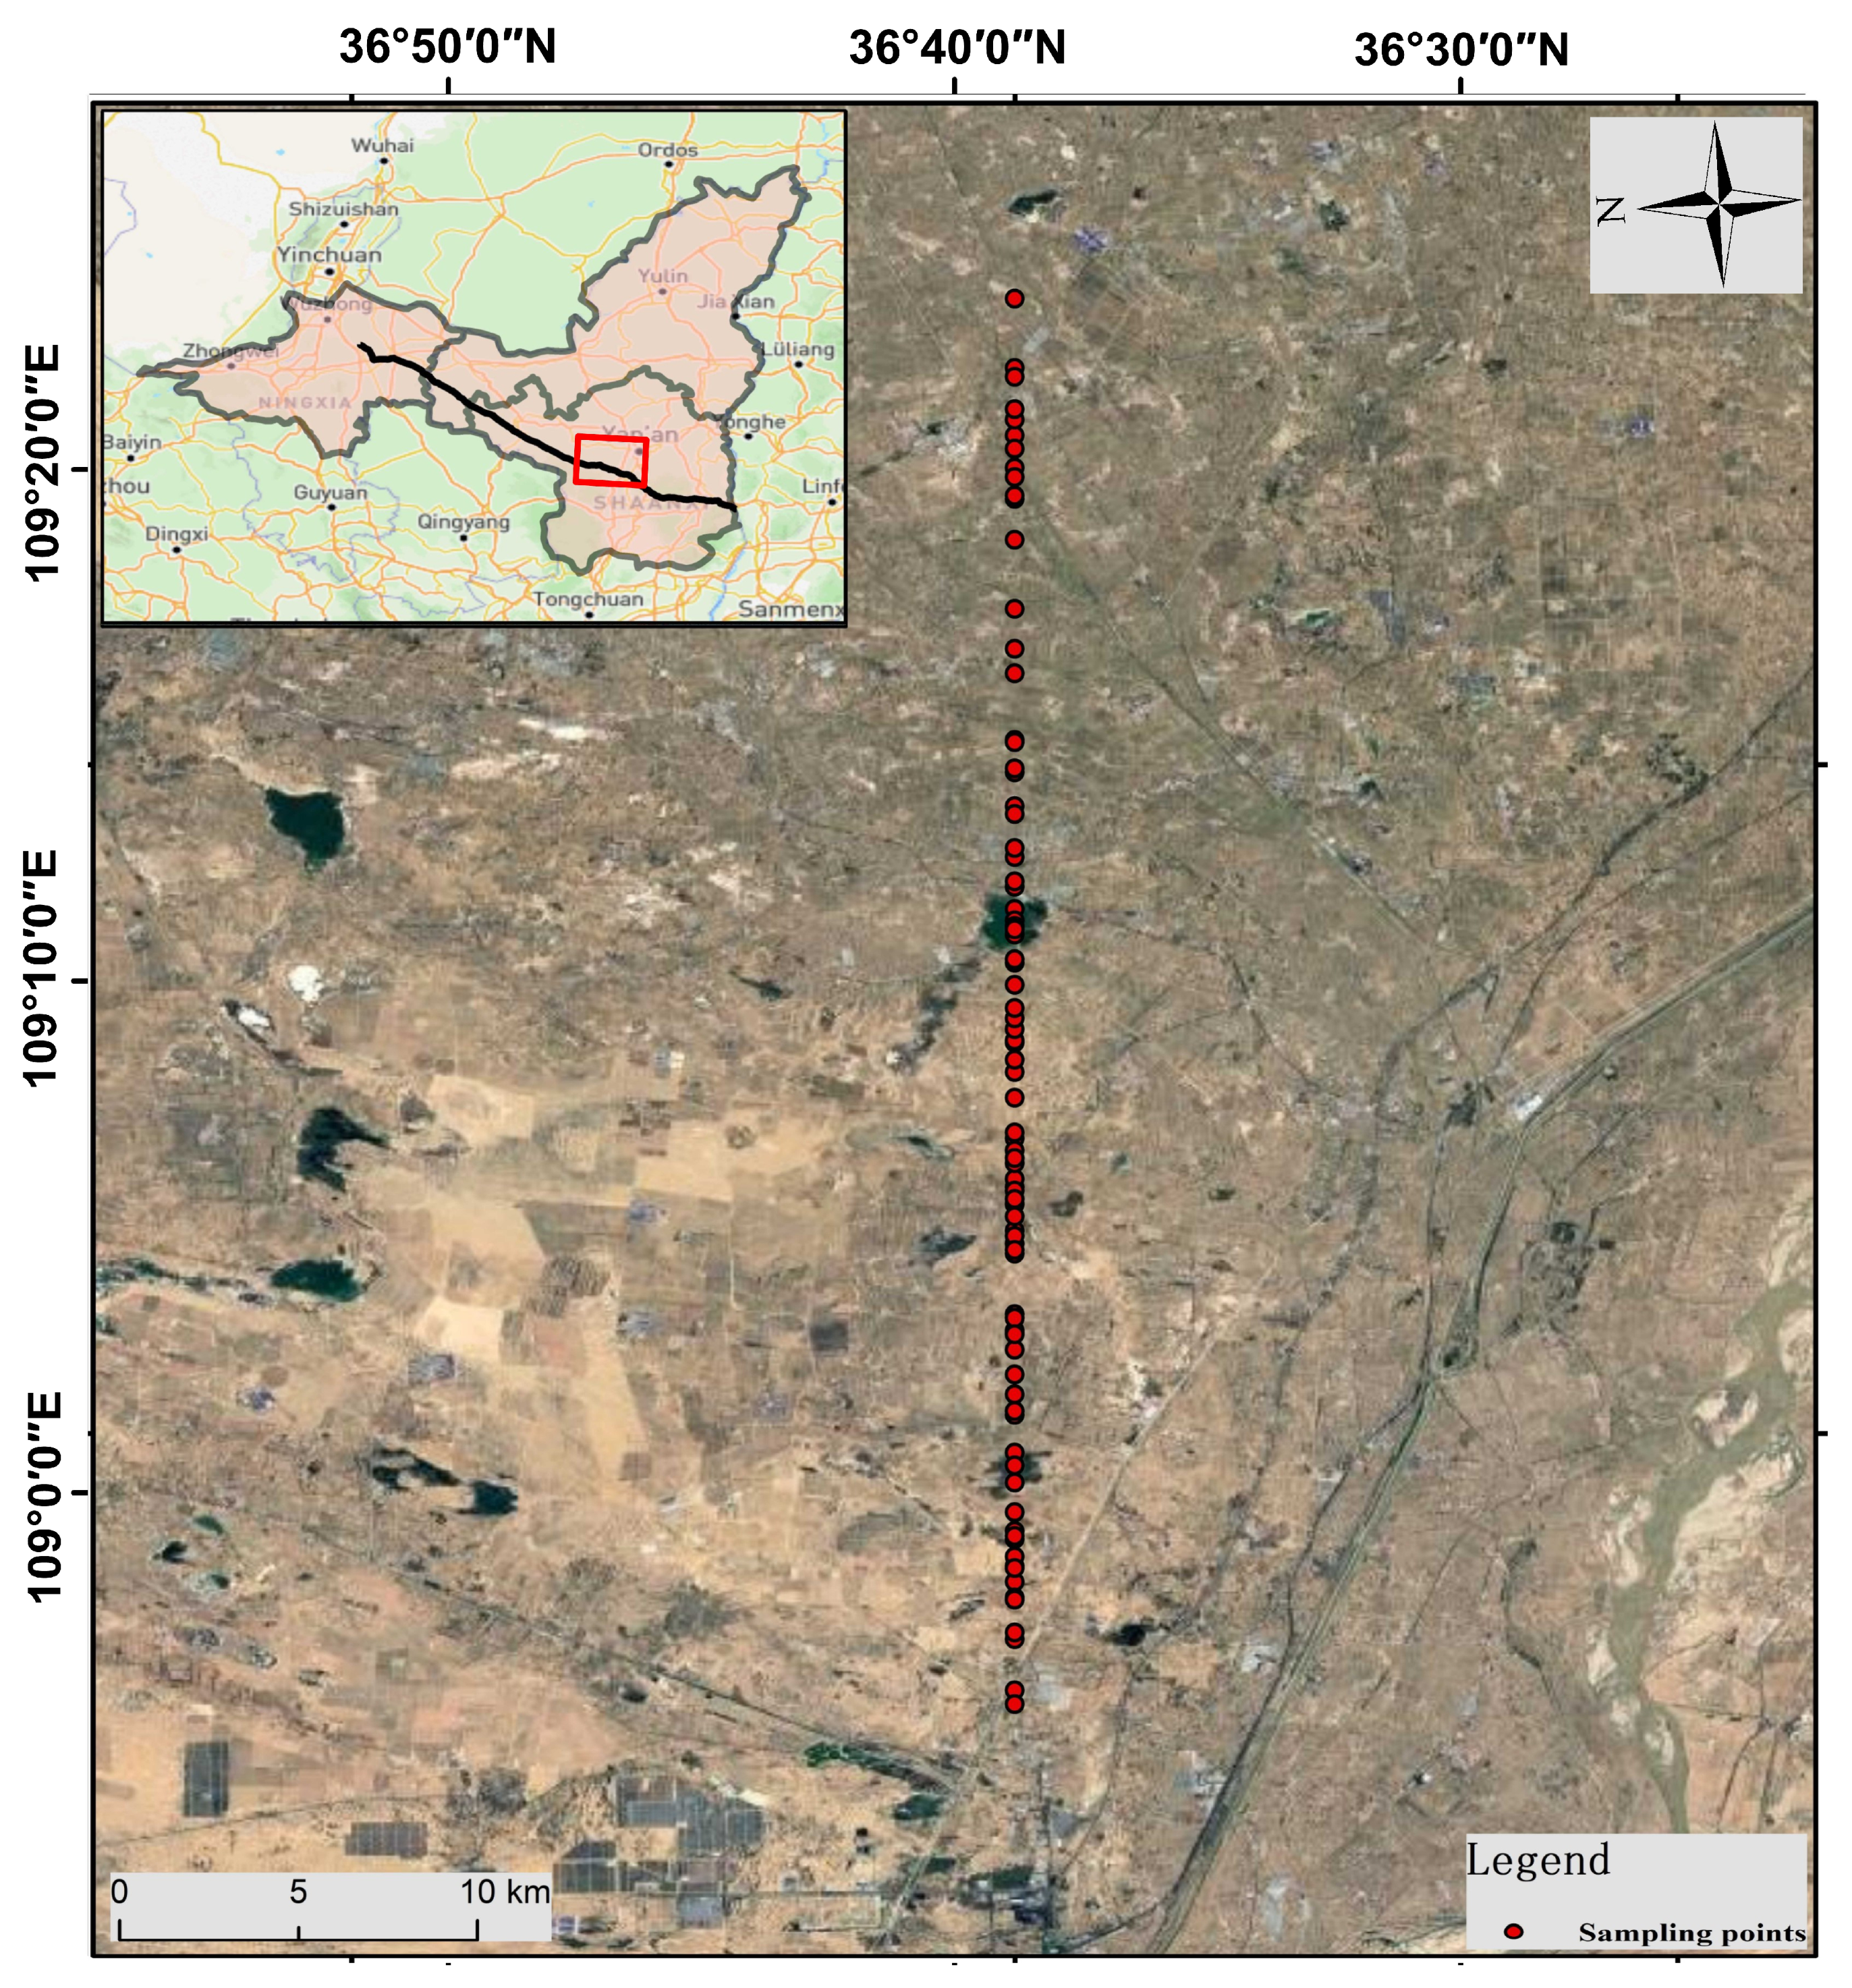
The study area is located in the arid–semiarid transition zone of northwestern China along the northern margin of the Loess Plateau (Figure 1). The investigation is structured around an east–west-oriented ultra-high-voltage (UHV) transmission corridor that traverses the region (black line in Figure 1). Along its route, the corridor crosses a range of land-surface and geomorphic units, including hilly slopes, dissected gully terrain, tableland or gentle-slope surfaces, and locally convergent river-valley or ephemeral channel settings. Land cover exhibits a clear banded and patch-mosaic pattern, shifting from bare ground and sparse grass–shrub communities to agricultural patches and scattered planted woodland/shrubland. This “engineering corridor–multi-surface–high heterogeneity” configuration produces strong spatial nonuniformity in soil moisture along the corridor and distinct event-scale responses to rainfall, making it well suited for corridor-scale soil moisture retrieval and mapping with direct engineering relevance.
Figure 1.
Overview of the study area.
From an operational perspective, soil moisture conditions along the transmission corridor are closely linked to corridor maintenance and hazard risk management. Post-rainfall changes in surface and near-surface water content can affect slope stability, runoff concentration and erosion within gullies, and the trafficability and disturbance sensitivity of ground surfaces around tower foundations and access roads. Accordingly, this study uses the transmission corridor as the primary spatial framework and emphasizes continuous, along-corridor assessment rather than isolated point-based judgments. The objective is to generate interpretable and comparable soil moisture spatial products at the corridor scale, providing fundamental information for environmental inspection, identification of priority segments, and refined risk control along the corridor.
To ensure that model training is both representative of the corridor application scenario and capable of generalization, a representative section in the mid-reach of the corridor was selected as the focal analysis area. A corridor buffer of fixed width was defined around the transmission line to form the modeling and mapping window. This window covers the major near-corridor surface types and topographic positions (ridge–slope–gully/convergent zones), allowing characterization of both longitudinal variability (moisture gradients and surface transitions along the corridor) and transverse contrasts (differences between the two sides of the corridor associated with aspect, vegetation, and soil properties). Field sampling points were deployed within this window, distributed in a corridor-parallel band and locally densified at key topographic positions and representative surface types, so that the observations capture the primary range of wetness conditions across the study domain.
3. Materials and Methods
3.1. Data Preparation
This study integrates field observations with multi-sensor satellite and terrain datasets to build a consistent foundation for soil moisture modeling and mapping. All datasets were selected to provide complementary sensitivity to soil water conditions while maintaining broad spatial coverage over the study area.
In situ soil moisture sampling: Ground observations consisted of 89 in situ soil moisture samples collected at field sampling sites distributed across the study area. Soil moisture was measured in the 0–5 cm surface layer using the oven-drying method. Repeated measurements were acquired at each sampling site and averaged to obtain the final reference value used for model development and evaluation. Soil moisture was reported as volumetric water content (m3 m−3). In this study, the target variable is near-surface soil moisture in the 0–5 cm layer rather than deeper-profile moisture. The proposed workflow is therefore intended for surface or near-surface soil moisture assessment, consistent with the sensitivity depth of the optical and SAR predictors used here. These observations served as the reference dataset for supervised learning, providing the target variable for model training and independent evaluation. Because field measurements represent point-scale conditions, they were used primarily to anchor the statistical relationship between soil moisture and the multi-source remote-sensing predictors rather than to describe spatial patterns directly. Sentinel-1 SAR data: Active microwave observations were obtained from the Sentinel-1 Ground Range Detected (GRD) archive. Sentinel-1 operates at C-band and provides dual-polarization measurements (VV and VH) in Interferometric Wide (IW) swath mode. As an active sensor, Sentinel-1 offers all-weather, day-and-night imaging capability and is largely unaffected by cloud cover, which is particularly advantageous for soil moisture monitoring in regions where optical observations can be intermittently limited. SAR backscatter is sensitive to soil dielectric properties that vary with water content, while also being influenced by vegetation structure and surface roughness. The availability of both co-polarized (VV) and cross-polarized (VH) channels provides additional information content, allowing the data to capture moisture-related scattering responses under a range of land-surface conditions. Sentinel-1’s comparatively high spatial resolution supports the characterization of within-region heterogeneity, which is essential for generating high-resolution soil moisture maps. To reduce temporal mismatch between field observations and satellite predictors, each in situ measurement was collocated with the nearest Sentinel-1 and Sentinel-2 acquisitions within a temporal window of ±6 days. When multiple candidate scenes were available, the acquisition closest to the field sampling time was retained. Samples without valid multi-source observations within this window were excluded from model development. Sentinel-1 GRD scenes were preprocessed through radiometric calibration, terrain correction, and geocoding to a common map projection. Backscatter variables were converted to σ° in dB for the VV and VH channels, and the polarization ratio (σVH/σVV) was subsequently derived from the co-registered bands. A speckle-reduction step was applied prior to predictor extraction to improve local stability while preserving spatial gradients relevant to soil moisture mapping. All predictor layers were finally resampled to a common grid before point-wise collocation and raster-based deployment.
Sentinel-2 optical data: Optical predictors were derived from Sentinel-2 surface reflectance products, covering the same study extent and analysis period. Sentinel-2 provides multispectral observations across the visible, near-infrared (NIR), and shortwave infrared (SWIR) regions. These bands are widely used to characterize vegetation status and surface moisture conditions because reflectance in the NIR and SWIR is sensitive to leaf and canopy water content as well as surface wetness. While optical observations can be affected by cloud contamination, Sentinel-2 offers frequent revisit and high spatial resolution, making it suitable for capturing spatial gradients in land cover and vegetation phenology that influence soil moisture retrieval performance. In this study, Sentinel-2 complements Sentinel-1 by providing spectral information related to surface and vegetation water conditions that is not directly available from microwave backscatter alone. DEM data: Topographic information was represented by the Shuttle Radar Topography Mission (SRTM) digital elevation model (DEM). The DEM is treated as a static geographic predictor that describes terrain patterns and elevation gradients across the study area. Topography influences soil moisture distribution by controlling water movement and redistribution processes, including runoff convergence/divergence, drainage conditions, and the formation of wetter zones near low-lying areas. Incorporating DEM therefore provides essential contextual information that helps explain spatial soil moisture variability beyond what can be inferred from satellite observations alone.
3.2. Selection of Conditioning Factors
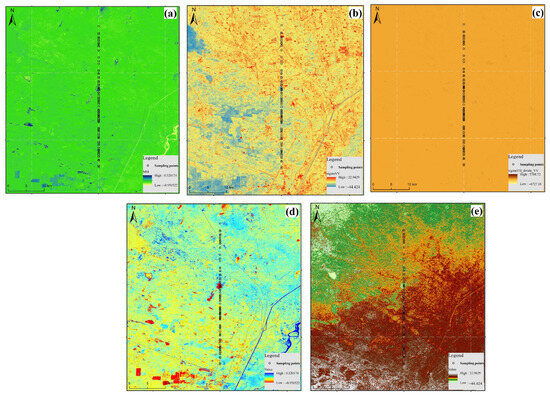
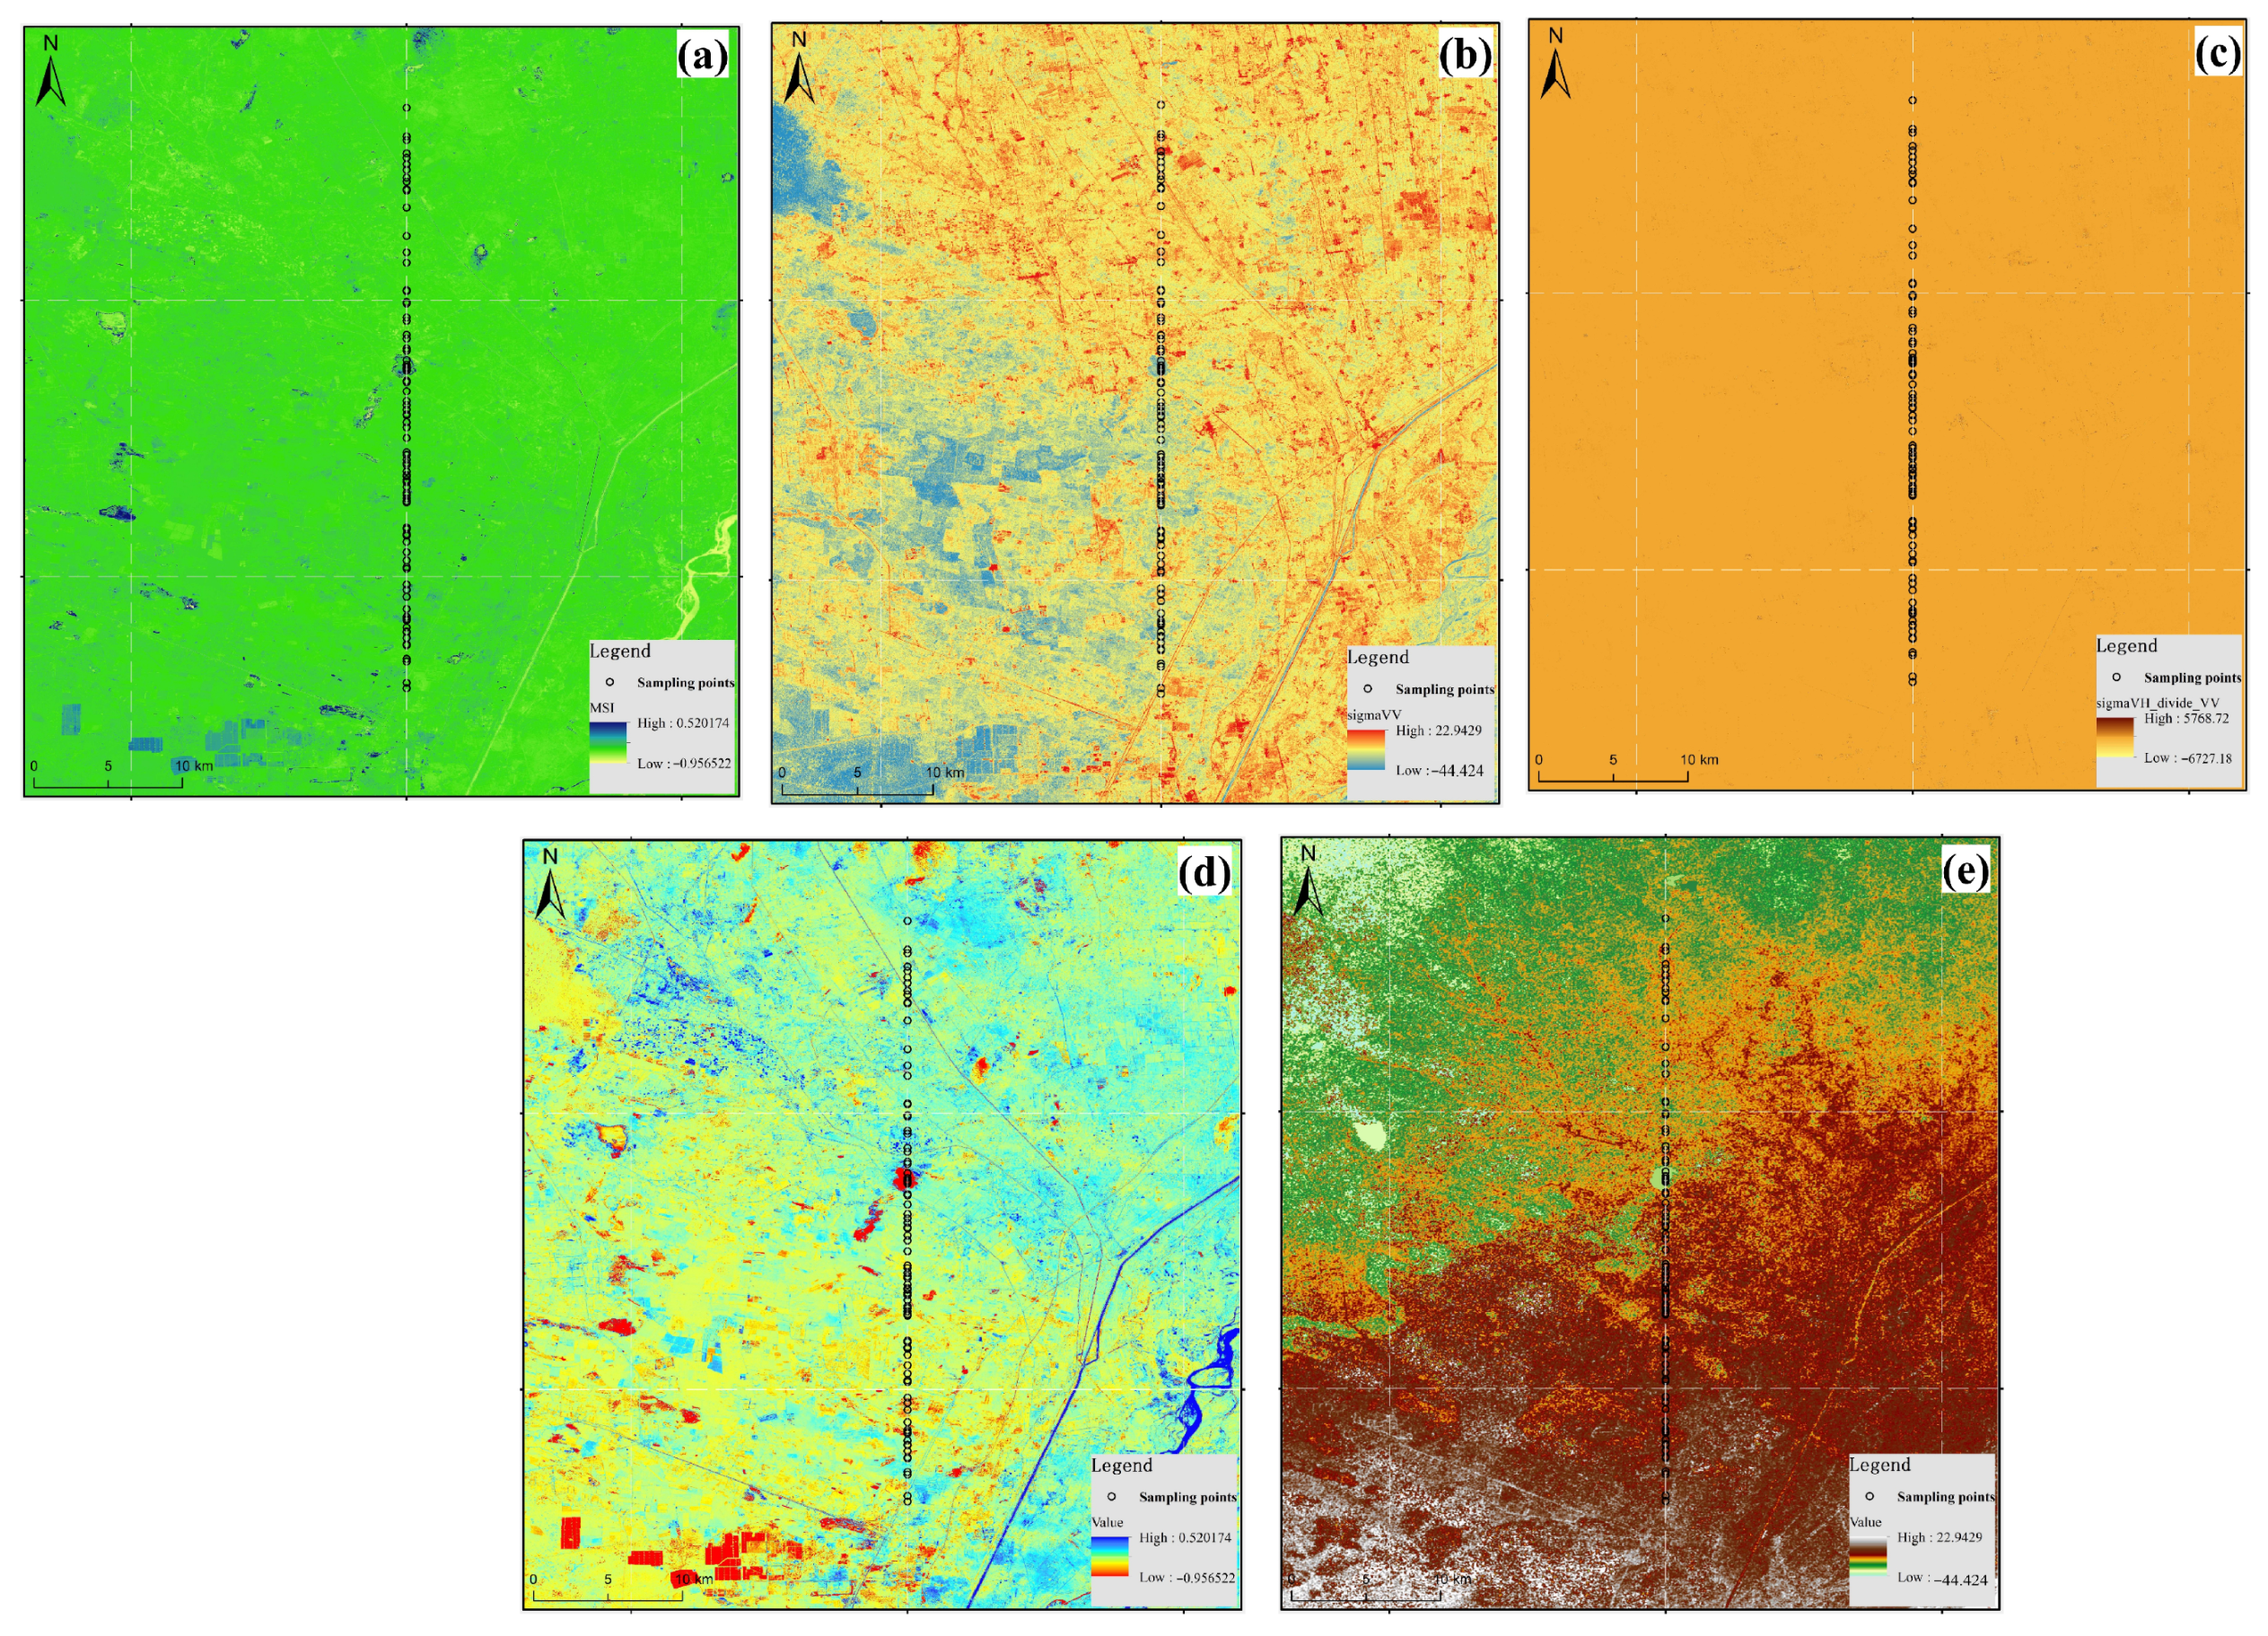
To construct a compact but informative predictor set for soil moisture (SM) estimation, we selected indicators that (i) are physically linked to surface/vegetation water status, (ii) are sensitive to dielectric-driven moisture changes under a wide range of weather conditions, and (iii) provide basic terrain context that governs water redistribution. The final feature set includes two optical indices (MSI, NDWI) from Sentinel-2, two SAR descriptors (σVV and σVH/σVV) from Sentinel-1, and topography (DEM). Sentinel-2 optical indices (MSI, NDWI): Optical reflectance in the NIR and SWIR bands responds to canopy water content and surface wetness, making it suitable for capturing moisture-related variability in agricultural and mixed land-cover environments. We therefore computed MSI and NDWI using Sentinel-2 NIR (B8) and SWIR (B11) bands. These indices provide complementary information on vegetation water status and surface moisture conditions, which is particularly important where vegetation dynamics can partially mask the soil signal. Sentinel-1 SAR descriptors (σVV, σVH/σVV). SAR backscatter is directly influenced by soil dielectric properties and thus remains informative under cloudy conditions and at high temporal frequency. We retained VV backscatter (σVV) as a primary scattering measure and derived the polarization ratio (σVH/σVV) to introduce sensitivity to changes in scattering mechanisms associated with vegetation structure and surface roughness, which are common confounders in SAR-only SM retrieval. DEM (terrain context): Topography (SRTM DEM) was included as a static predictor to represent terrain controls on soil water redistribution and spatial moisture gradients (e.g., convergence in low-lying areas versus drainage on higher terrain). This context is especially relevant for high-resolution mapping where small terrain variations can translate into meaningful SM differences (Figure 2). These variables were used as explanatory predictors rather than direct measurements of soil moisture; the target variable remained the in situ volumetric soil moisture obtained from field observations.
Figure 2.
Multi-source predictor layers used for soil moisture modeling: (a) Sentinel-2 MSI; (b) Sentinel-1 σVV backscatter; (c) Sentinel-1 polarization ratio (σVH/σVV); (d) Sentinel-2 NDWI; (e) DEM-derived elevation.
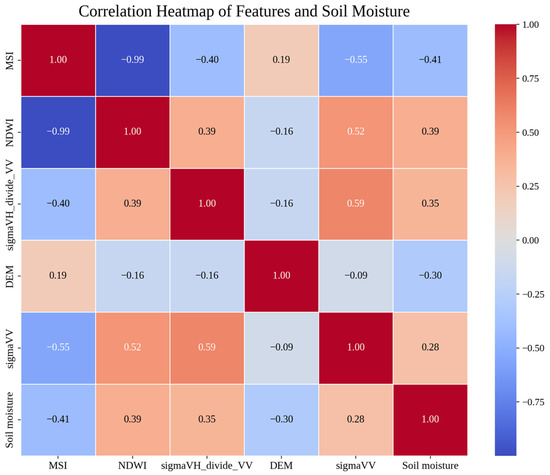
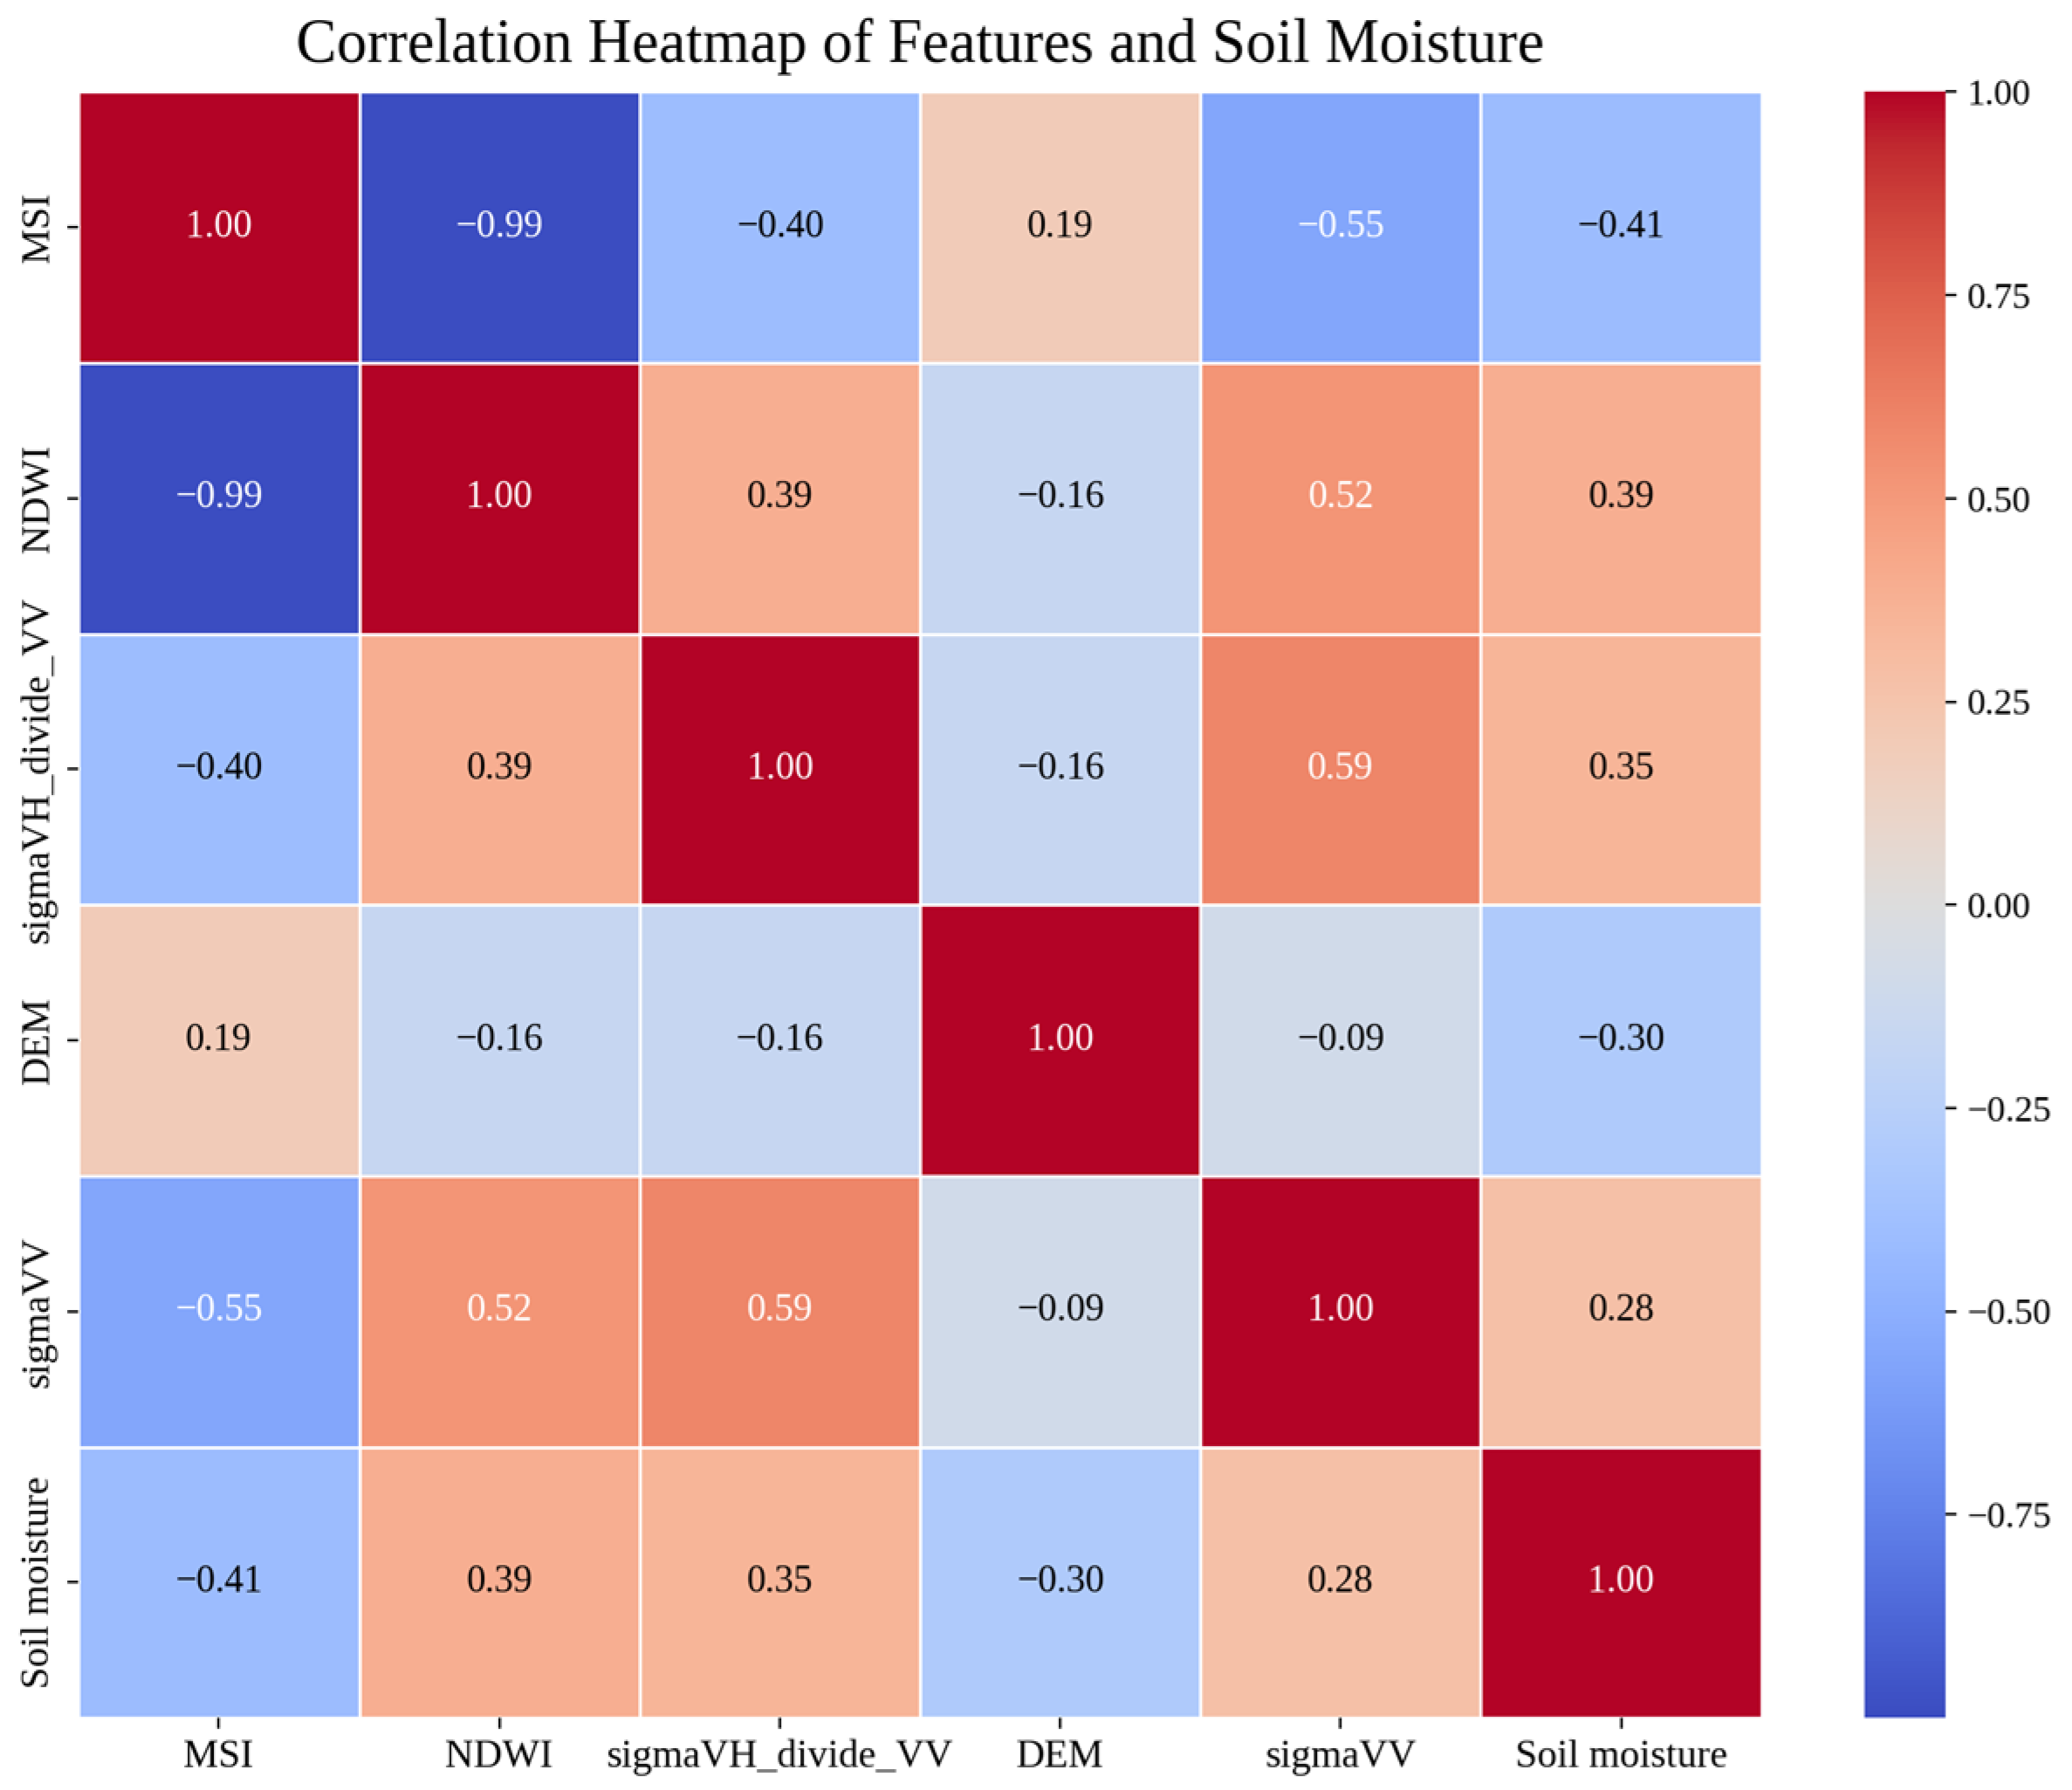
A preliminary correlation analysis supports the relevance of this feature set (Figure 3): each predictor shows a moderate relationship with SM (|r| ≈ 0.28–0.41), indicating that no single indicator dominates and that multi-source fusion is necessary. The optical indices MSI and NDWI are strongly (negatively) correlated, reflecting partially redundant moisture information expressed with opposite sensitivity; given the nonlinearity of SM controls and the use of tree-based ensemble models, both indices were retained to let the model exploit subtle differences across land-cover and phenological conditions. Overall, this five-variable configuration balances interpretability, data availability, and mapping practicality, while capturing complementary pathways through which SM variability is expressed in remote-sensing observations.
Figure 3.
Correlation structure among predictors and soil moisture: Pearson correlation heatmap for MSI, NDWI, σVH/σVV, DEM, σVV, and in situ soil moisture.
3.3. Machine Learning Models
This study adopts three tree-based regression models—Random Forest (RF) [44], XGBoost 3.2.0 [45], and CatBoost 1.2.10 [46]—as the base learners for soil moisture estimation from multi-source predictors. These models were selected because they are capable of representing nonlinear responses and feature interactions that commonly arise when combining optical indices, SAR backscatter descriptors, and terrain variables. Random Forest (RF) is an ensemble method that trains a large number of Decision Trees using bootstrap resampling of the training data and random feature selection at each split. The final prediction is obtained by averaging the outputs of individual trees. This design reduces variance and typically yields stable performance under noisy, heterogeneous land-surface conditions, where relationships between predictors and soil moisture may vary across land-cover types. XGBoost is a gradient-boosting framework in which trees are added sequentially to correct residual errors produced by earlier trees. By optimizing a regularized objective function, XGBoost can capture complex nonlinear patterns while controlling model complexity. It is particularly effective when the signal is distributed across multiple predictors and when interactions among predictors are important. CatBoost is also a gradient-boosting approach with algorithmic refinements that improve training stability and help reduce overfitting. Although it is widely recognized for handling categorical variables, it remains highly competitive for purely numerical predictors due to its robust boosting strategy and built-in regularization. In our setting, CatBoost provides strong predictive capability for soil moisture estimation when the predictor–target relationship is nonlinear and influenced by multiple confounding factors (e.g., vegetation and surface roughness effects on SAR signals). For each base learner, key hyperparameters were optimized on the training subset using cross-validated grid search (or randomized search), and the final configuration was selected according to the lowest validation RMSE. The tuned parameters included, for example, the number of trees and maximum depth for RF, the learning rate/tree depth/number of estimators for XGBoost, and the depth/learning rate/iterations for CatBoost.
3.4. Modeling and Evaluation Strategy
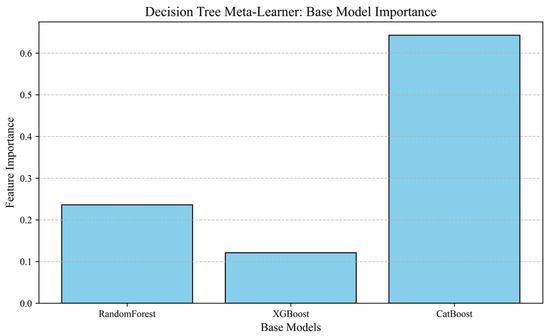
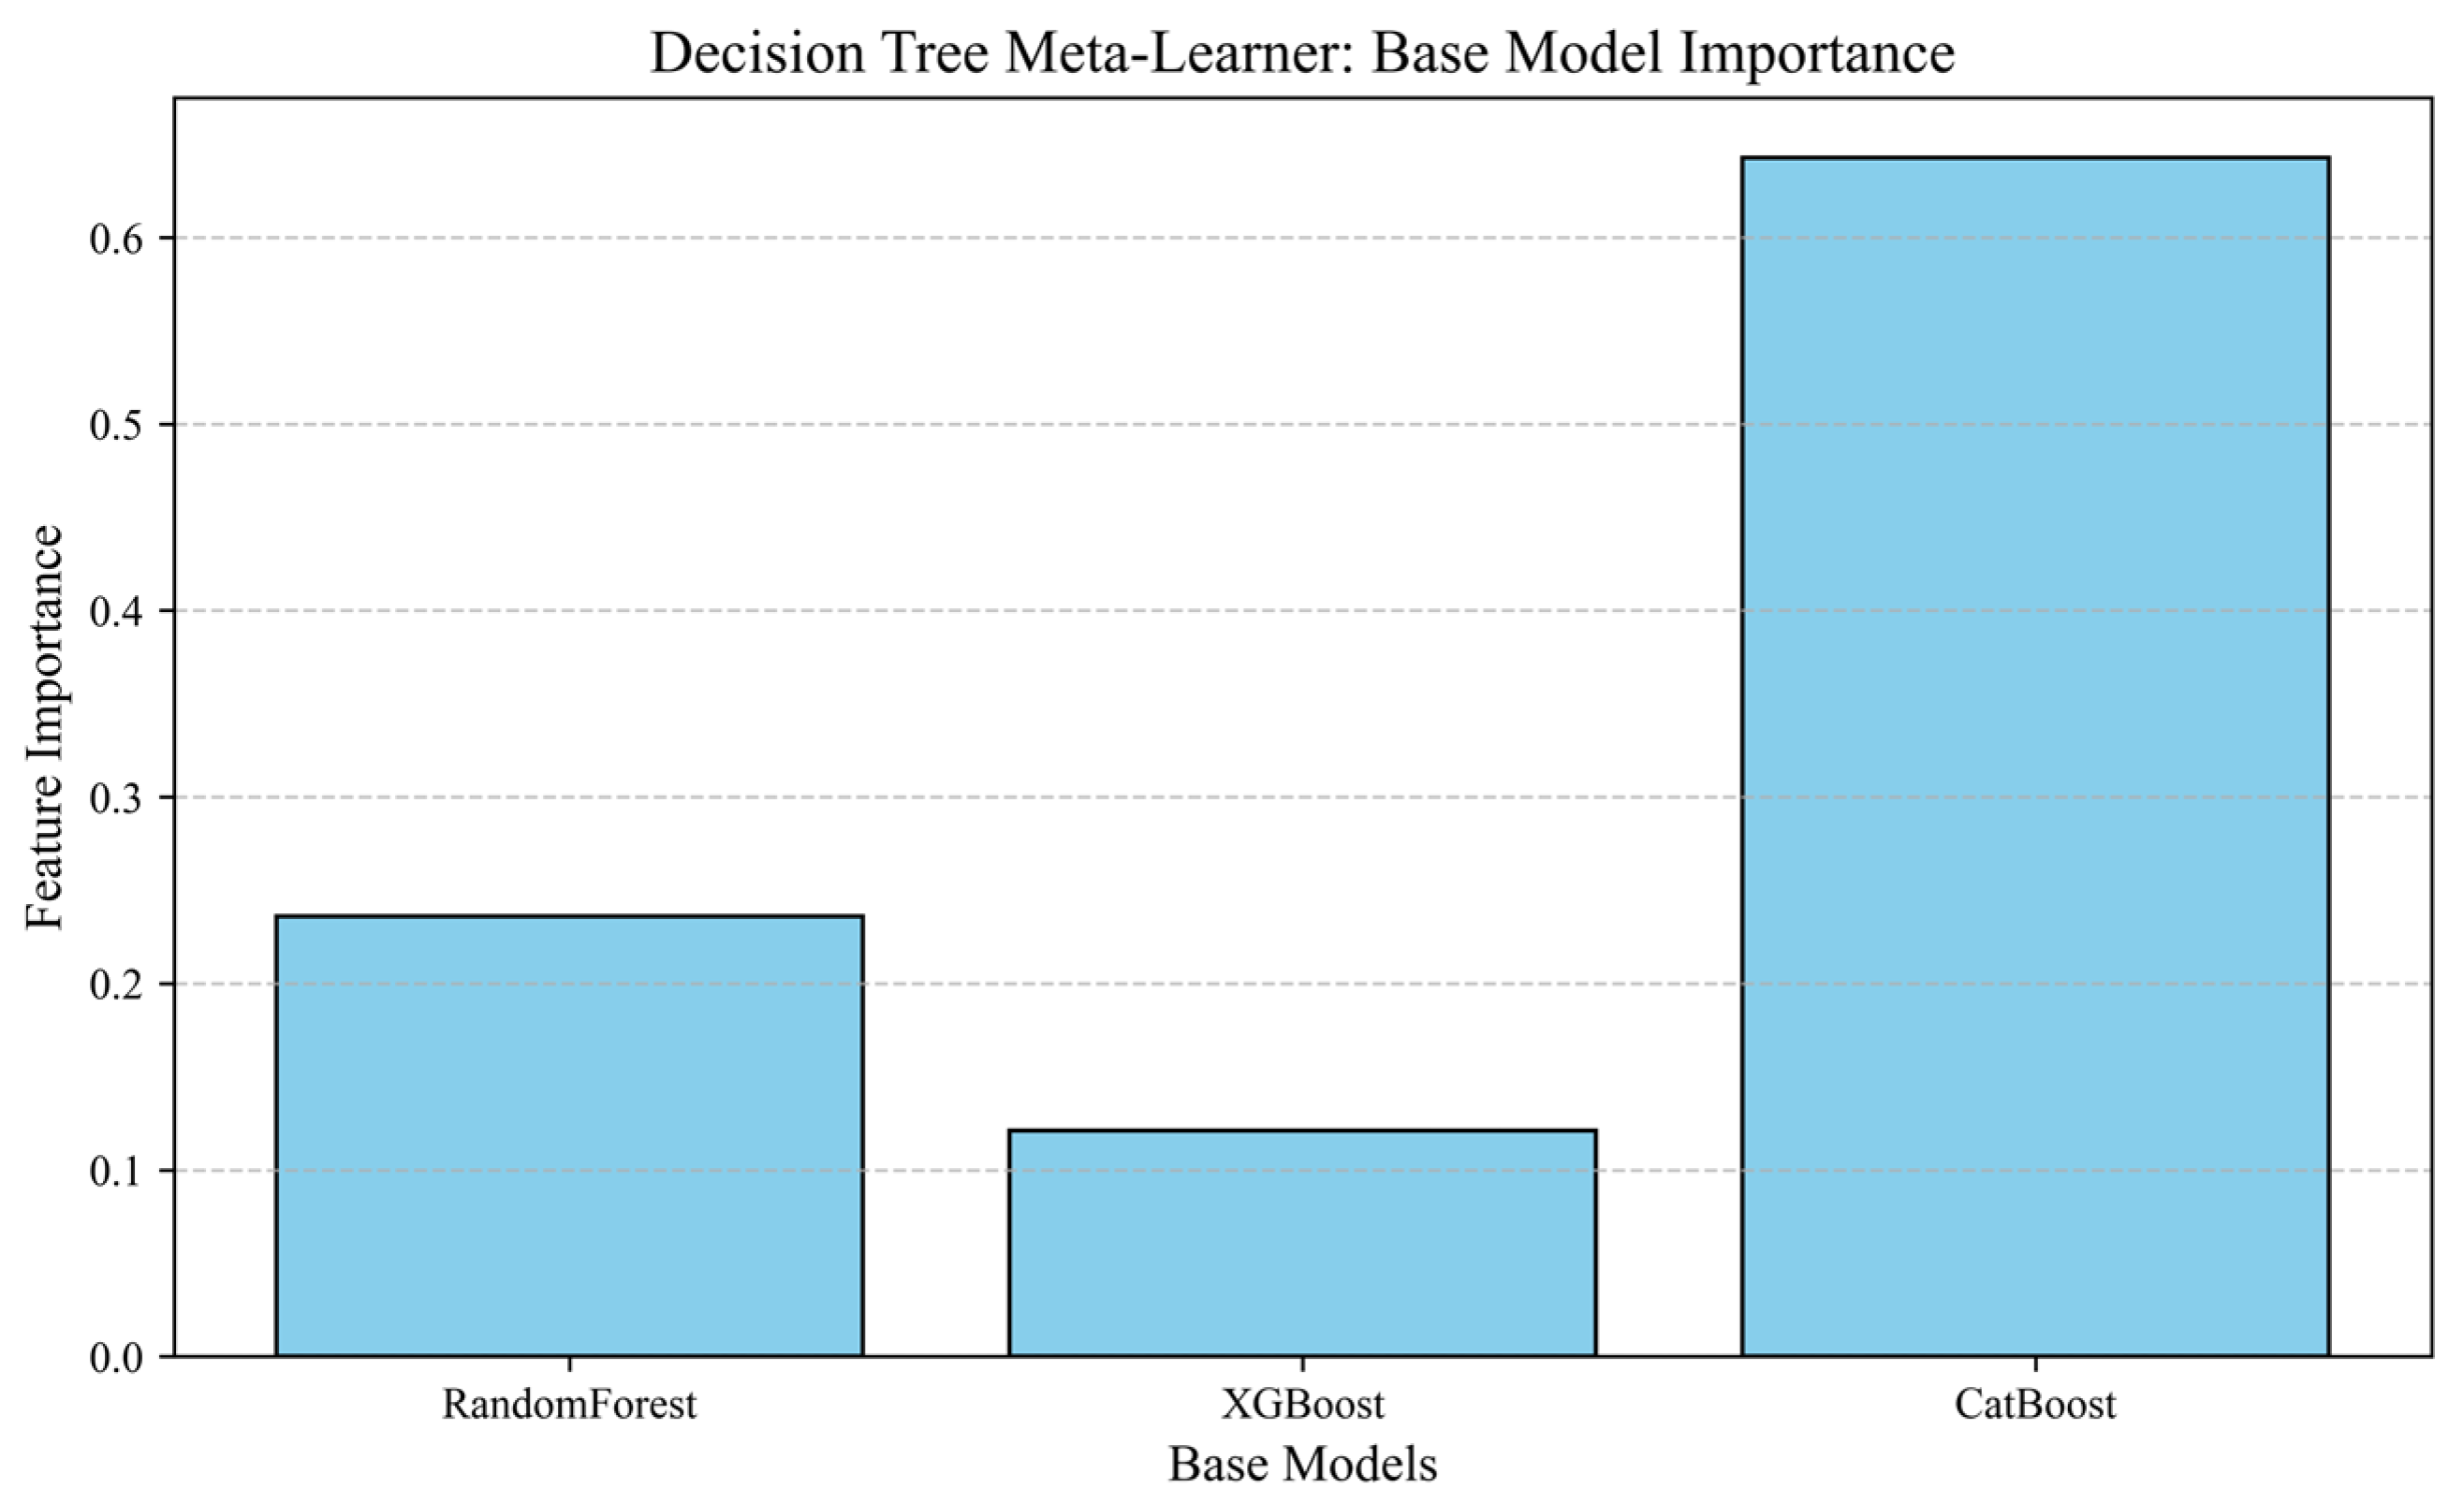
The modeling strategy was designed to deliver reliable soil moisture estimates from a compact multi-source predictor set, while maintaining a strict separation between model development and final evaluation and ensuring consistency between point-based learning and raster-based mapping. The collocated sample dataset was first partitioned into training and test subsets, with the test set reserved as an independent holdout for performance reporting. Because the field samples were distributed along a corridor-like transect, the train–test partition was designed to reduce optimistic bias caused by spatial autocorrelation. Rather than assigning neighboring samples independently at random, the transect was divided into spatial groups, and the training and test subsets were created at the group level so that geographically adjacent samples were not simultaneously used for model fitting and final evaluation. The same grouping principle was maintained during cross-validation for meta-feature generation. Using the training subset, Random Forest, XGBoost, and CatBoost were trained under an identical feature configuration, and their predictions were assessed using complementary metrics (R2, RMSE, and MAE) together with predicted–observed diagnostics to quantify accuracy and identify potential bias. Building on these baselines, we implemented a stacking ensemble to leverage the diversity of the three learners. To prevent information leakage, second-level inputs were generated via K-fold cross-validation: in each fold, the base models were fitted on K−1 folds and used to predict the held-out fold, producing out-of-fold predictions that form the training meta-features; for the independent test set, fold-wise base-model predictions were aggregated to obtain test meta-features, enabling leakage-free evaluation of the ensemble. A Decision Tree regressor was selected as the meta-learner because the relationship among base-model predictions was expected to be nonlinear and potentially regime-dependent rather than purely additive. Compared with more complex second-level learners, a Decision Tree provides an interpretable and computationally lightweight fusion rule, which is suitable for the limited sample size of this study and facilitates inspection of how the ensemble combines the three base learners. The fitted meta-learner provides a direct view of how the ensemble combines the three predictors of soil moisture. As summarized by the base-model importance plot (Figure 4), CatBoost contributes the largest share of predictive information, while Random Forest and XGBoost provide additional complementary signals. This weighting pattern supports the use of multi-model fusion: the final estimate is driven by the strongest learner in the current dataset but is refined by information captured by the other models.
Figure 4.
Relative contribution of base learners in the stacking ensemble: feature importance of Random Forest, XGBoost, and CatBoost derived from the fitted.
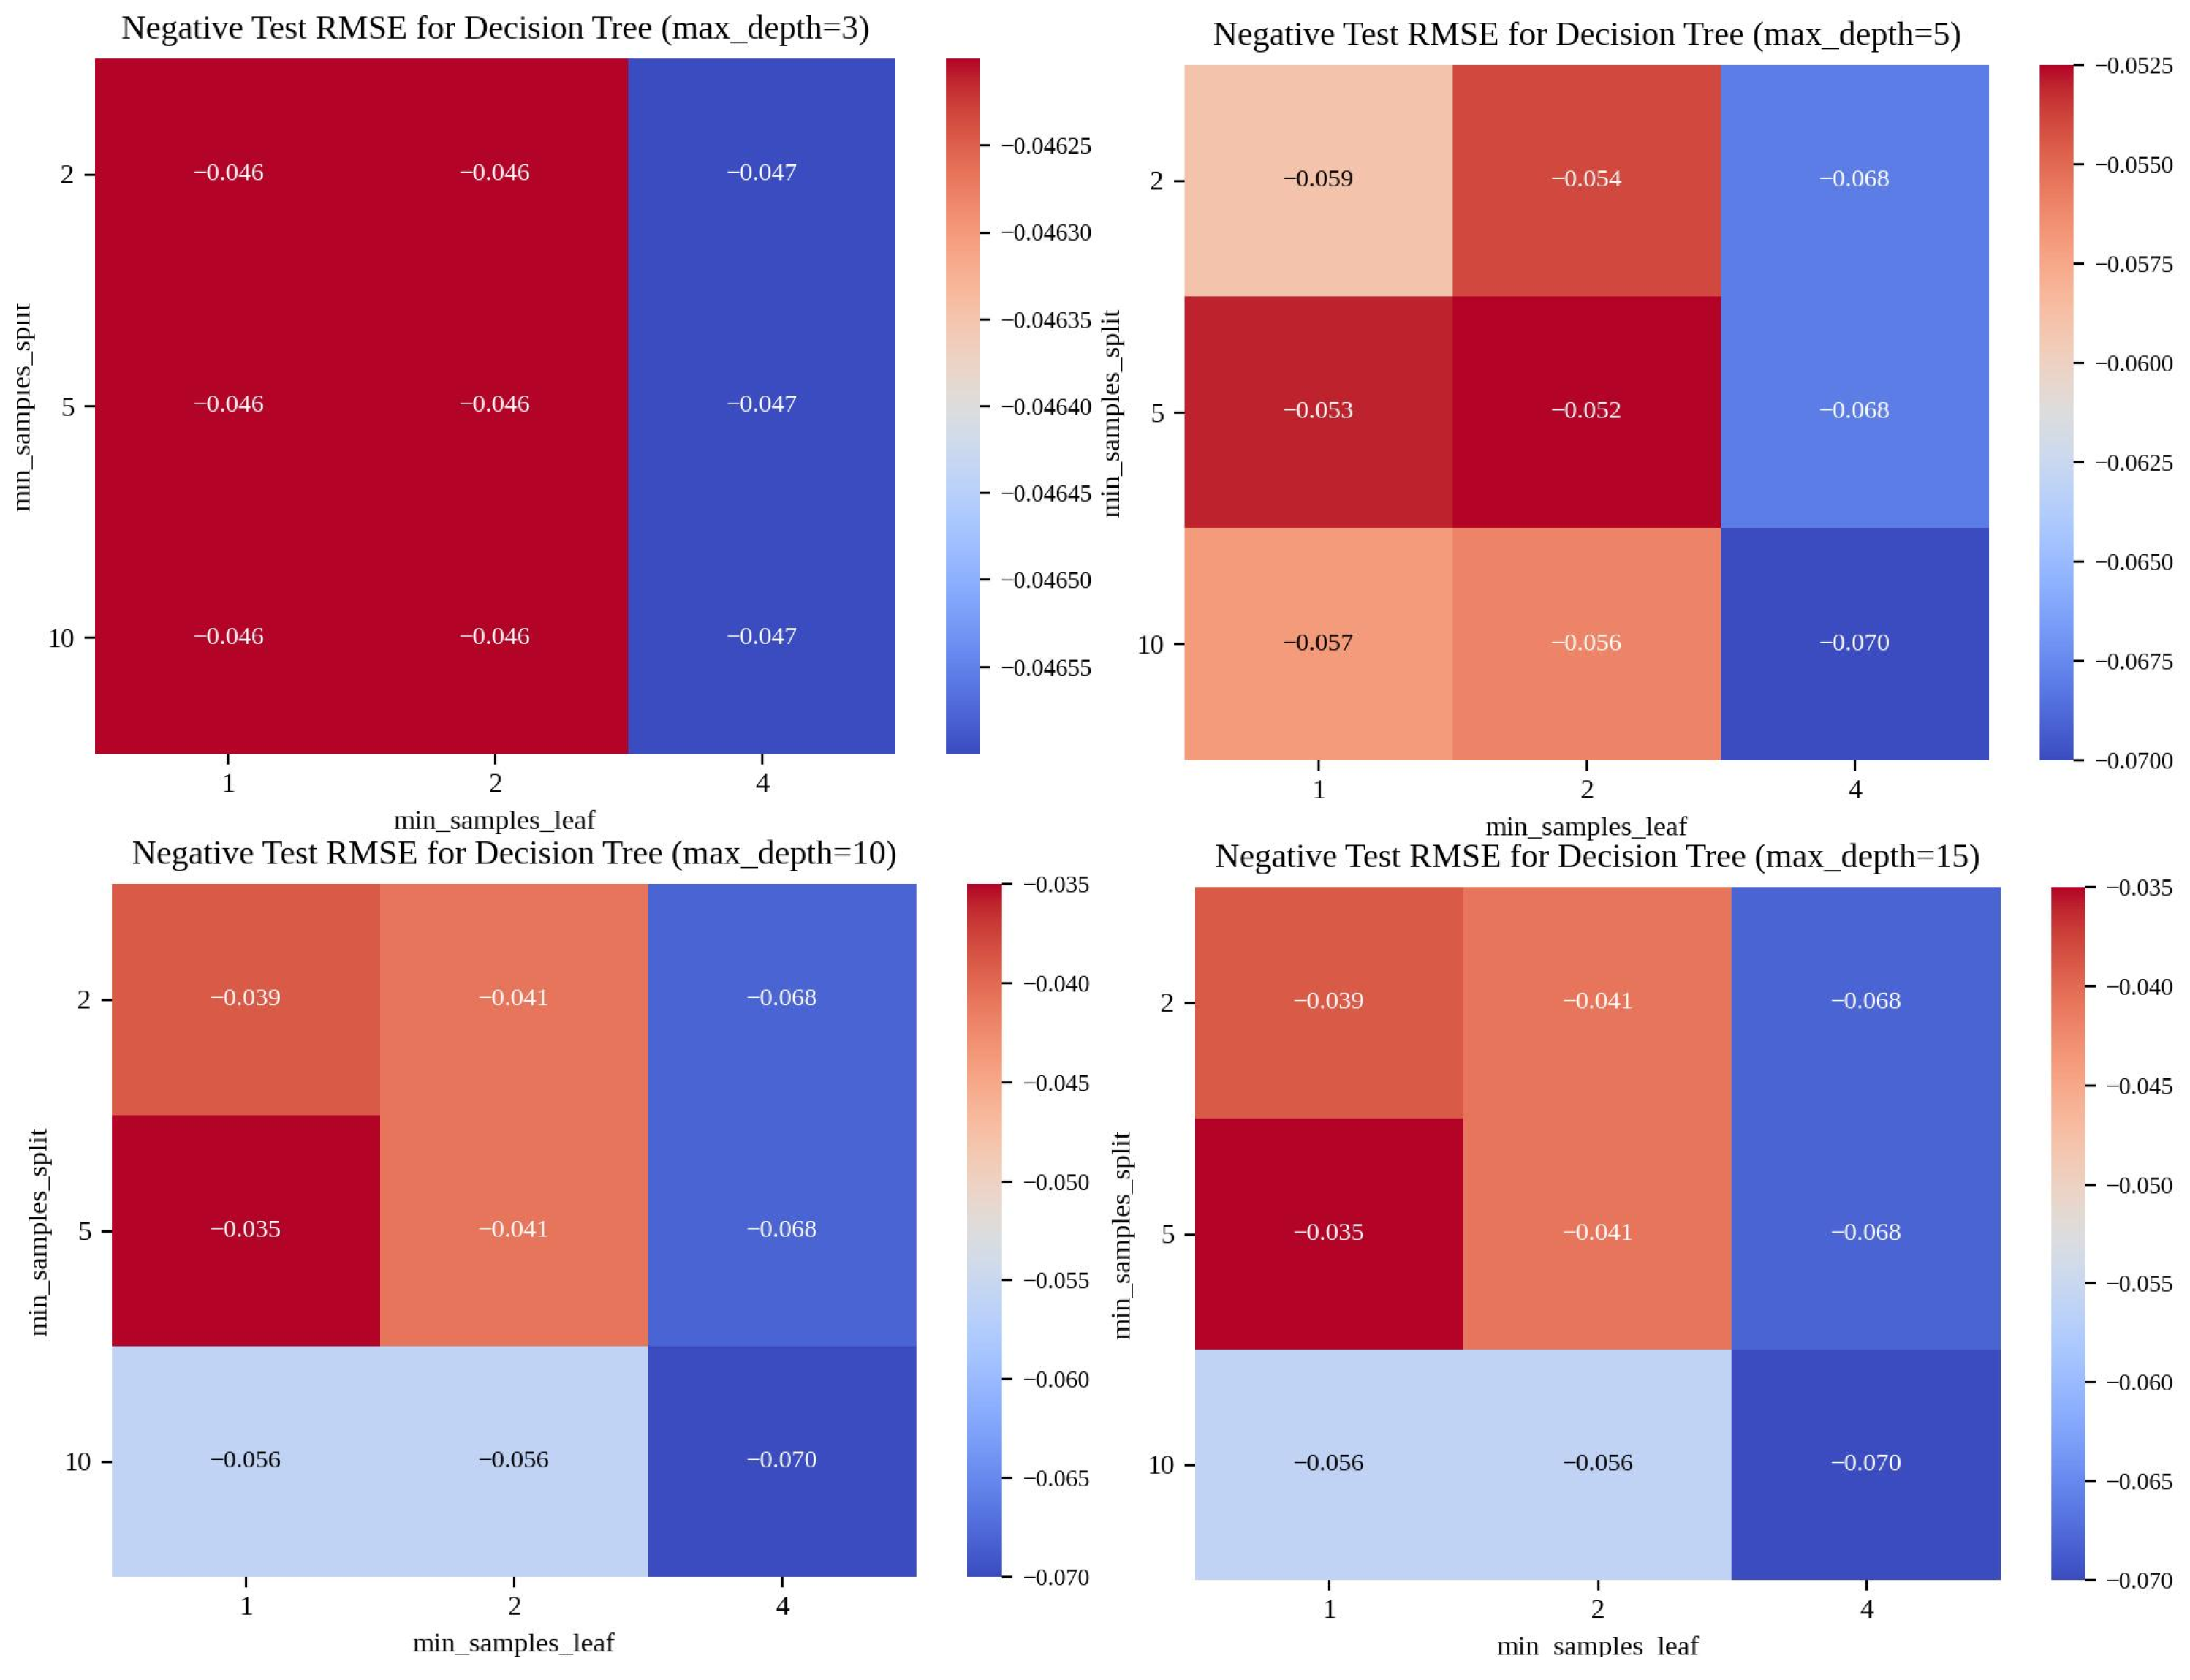
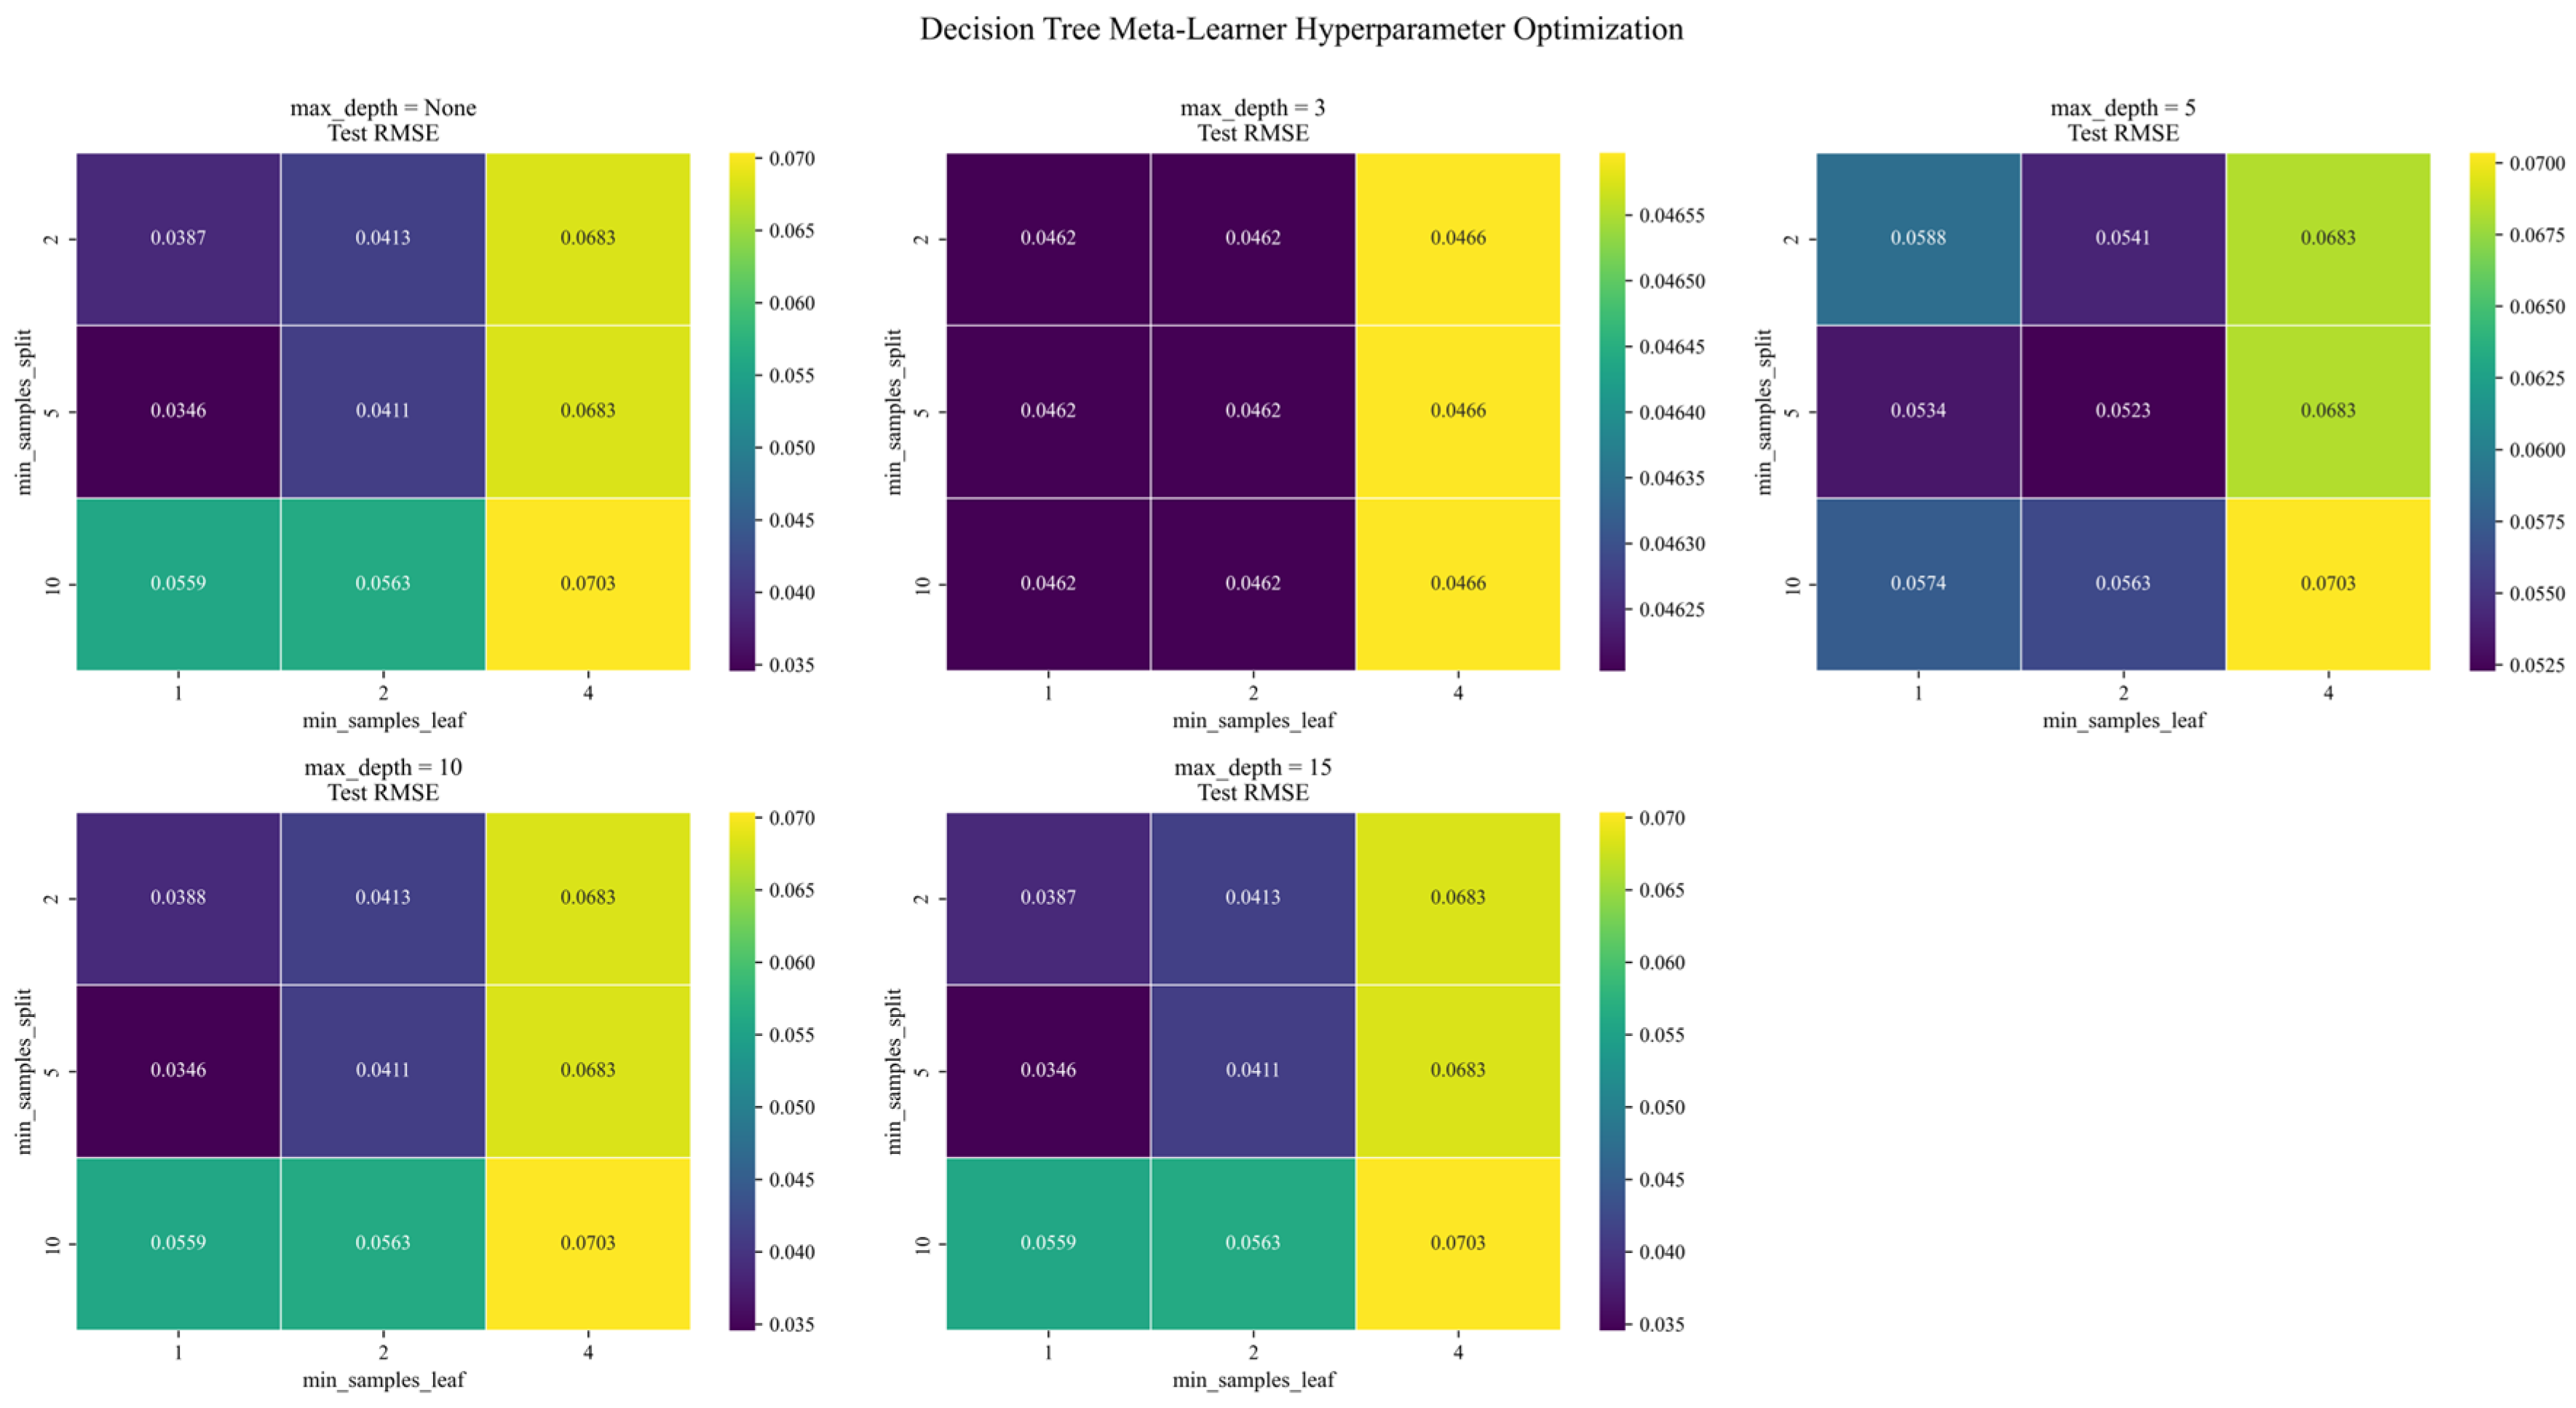
The complexity of the Decision Tree meta-learner was controlled through a structured search over key hyperparameters (max_depth, min_samples_split, and min_samples_leaf). The resulting RMSE heatmaps (Figure 5) visualize the sensitivity of test performance to different parameter combinations across tree depths, providing an explicit basis for selecting a configuration that balances fitting capacity and generalization. The final meta-learner setup was chosen to minimize test RMSE while avoiding unnecessarily complex structures that could amplify overfitting. After finalizing the stacking framework, the same predictor definition and ordering were applied to gridded inputs. Base learners were run on the stacked predictor raster to produce base prediction layers, which were then passed through the meta-learner to generate wall-to-wall soil moisture estimates at the raster-stack resolution. This end-to-end design links point-scale evaluation directly to the deployed mapping workflow and ensures that spatial products are produced under the same modeling assumptions used during training and testing.
Figure 5.
Hyperparameter tuning of the Decision Tree meta-learner: heatmaps of cross-validated test RMSE (reported as negative values) across min_samples_split and min_samples_leaf under different max_depth settings (3, 5, 10, and 15).
4. Results
4.1. Test Set Fit Diagnostics of Base Learners and Evidence of Range Compression
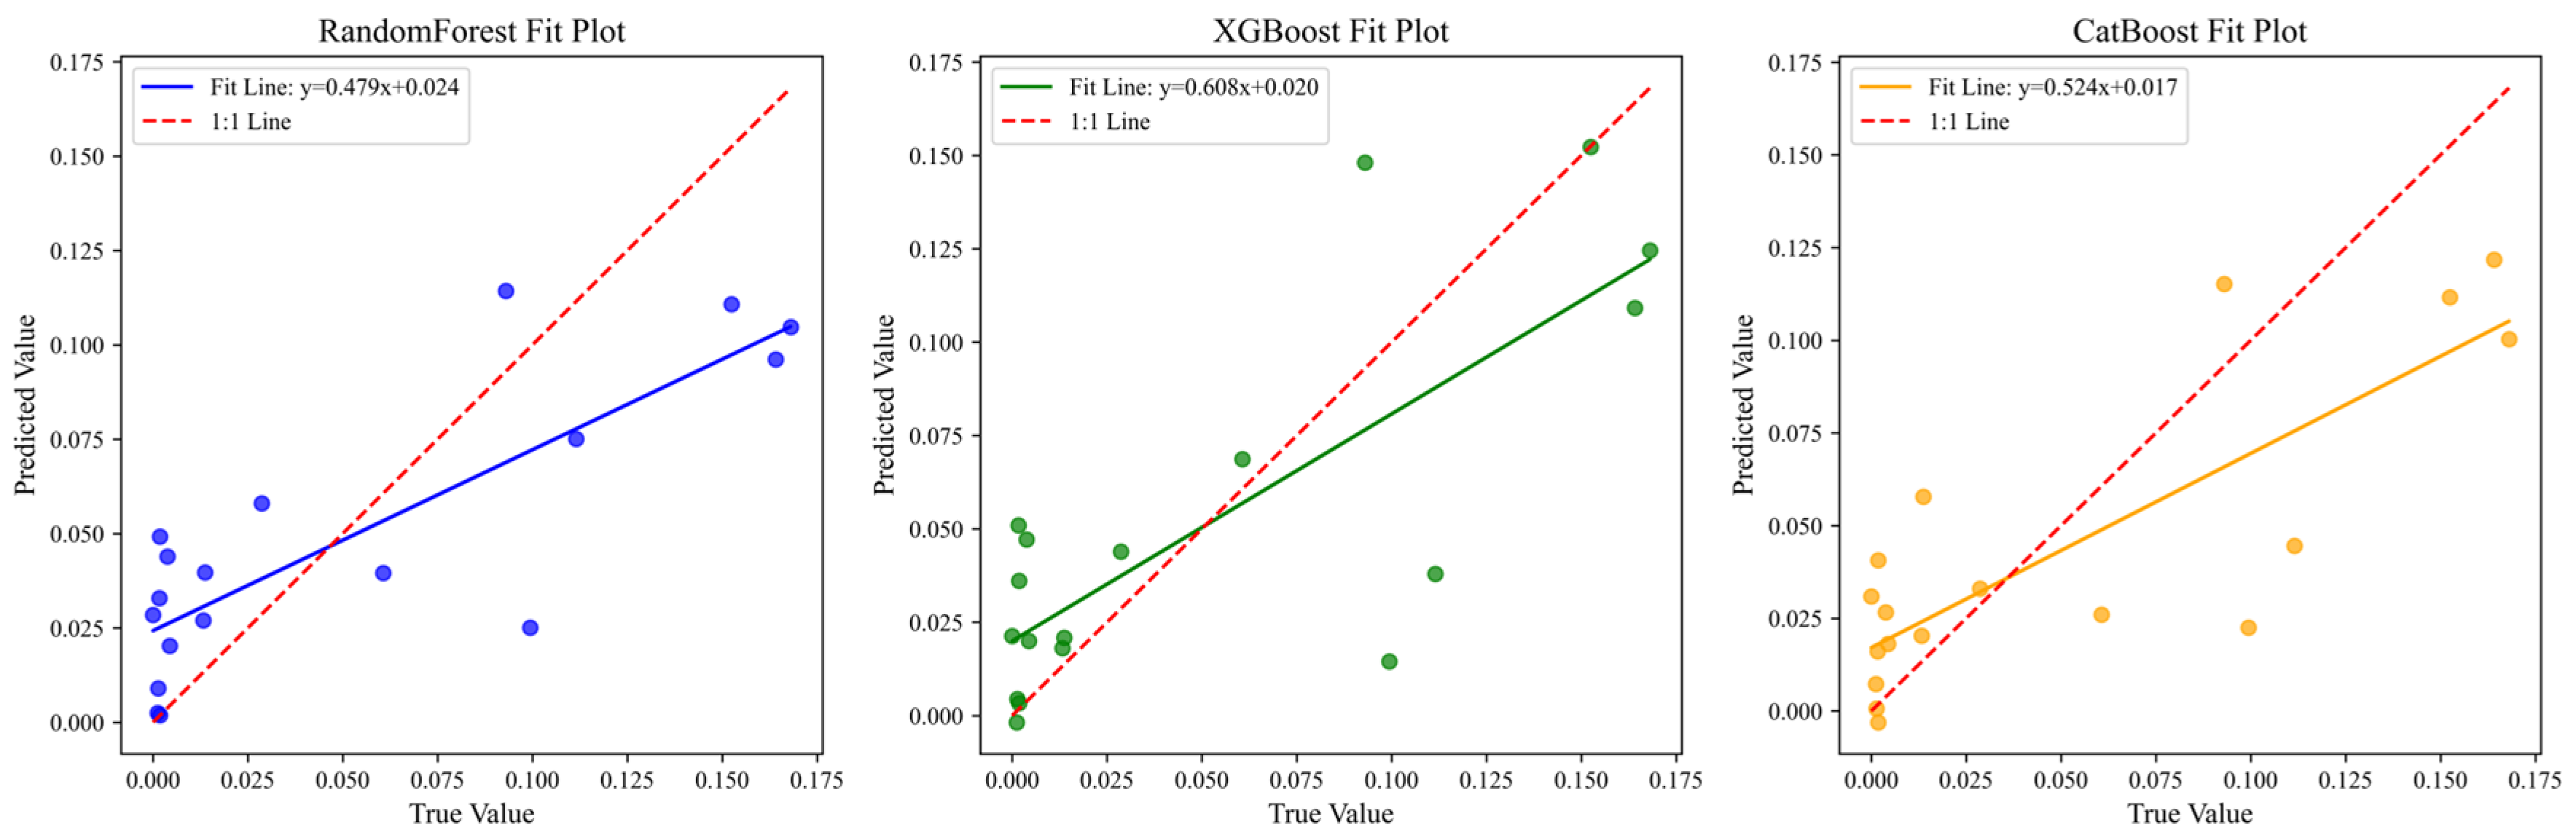
Figure 6 provides the test set fit diagnostics for the three base learners (RF, XGBoost, and CatBoost) by comparing predicted against observed soil moisture. Across all models, the scatter clouds show a clear positive association, confirming that each learner extracts a consistent soil moisture signal from the five-variable predictor set (MSI, NDWI, σVH/σVV, σVV, and DEM). Despite this overall agreement, the distributions also reveal systematic departures from the ideal 1:1 relationship. In particular, the fitted lines display slopes substantially below unity—approximately 0.479 (RF), 0.608 (XGBoost), and 0.524 (CatBoost)—together with small positive intercepts (about 0.017–0.024). This combination is characteristic of range compression, meaning that higher soil moisture values are generally underestimated while very low values tend to be slightly overestimated. Visually, this appears as points lying below the 1:1 line at the upper end of observed moisture and above the 1:1 line near the lowest values. Such behavior is common in data-driven soil moisture estimation when (i) the target variable spans a limited dynamic range, (ii) the number of high-moisture samples is small relative to low-to-moderate conditions, or (iii) predictors contain confounding variability (e.g., vegetation/roughness effects in SAR or phenological effects in optical indices) that weakens the sensitivity to extremes.
Figure 6.
Predicted–observed diagnostics for the three base learners: scatter plots of measured versus predicted soil moisture for Random Forest, XGBoost and CatBoost; the dashed line denotes the 1:1 reference and the solid line is the fitted regression.
Model-to-model differences are still discernible. XGBoost exhibits the steepest fitted slope and comparatively better alignment with the 1:1 line, suggesting a stronger ability to track variations toward the higher end of the observed range. However, its scatter indicates that some samples remain difficult to reproduce, implying localized mismatches between predictors and the point measurements. Random Forest shows a flatter slope and a tighter grouping near low soil moisture values, which is consistent with RF’s tendency to average across trees and produce conservative estimates under limited sample support. CatBoost also shows range compression but with a slightly different error pattern; several moderate-to-high observations are underestimated, while low values remain relatively well captured. Collectively, the three fit plots suggest that the main challenge for the base learners is not capturing the sign of change but reproducing the full amplitude of soil moisture variability across the test set.
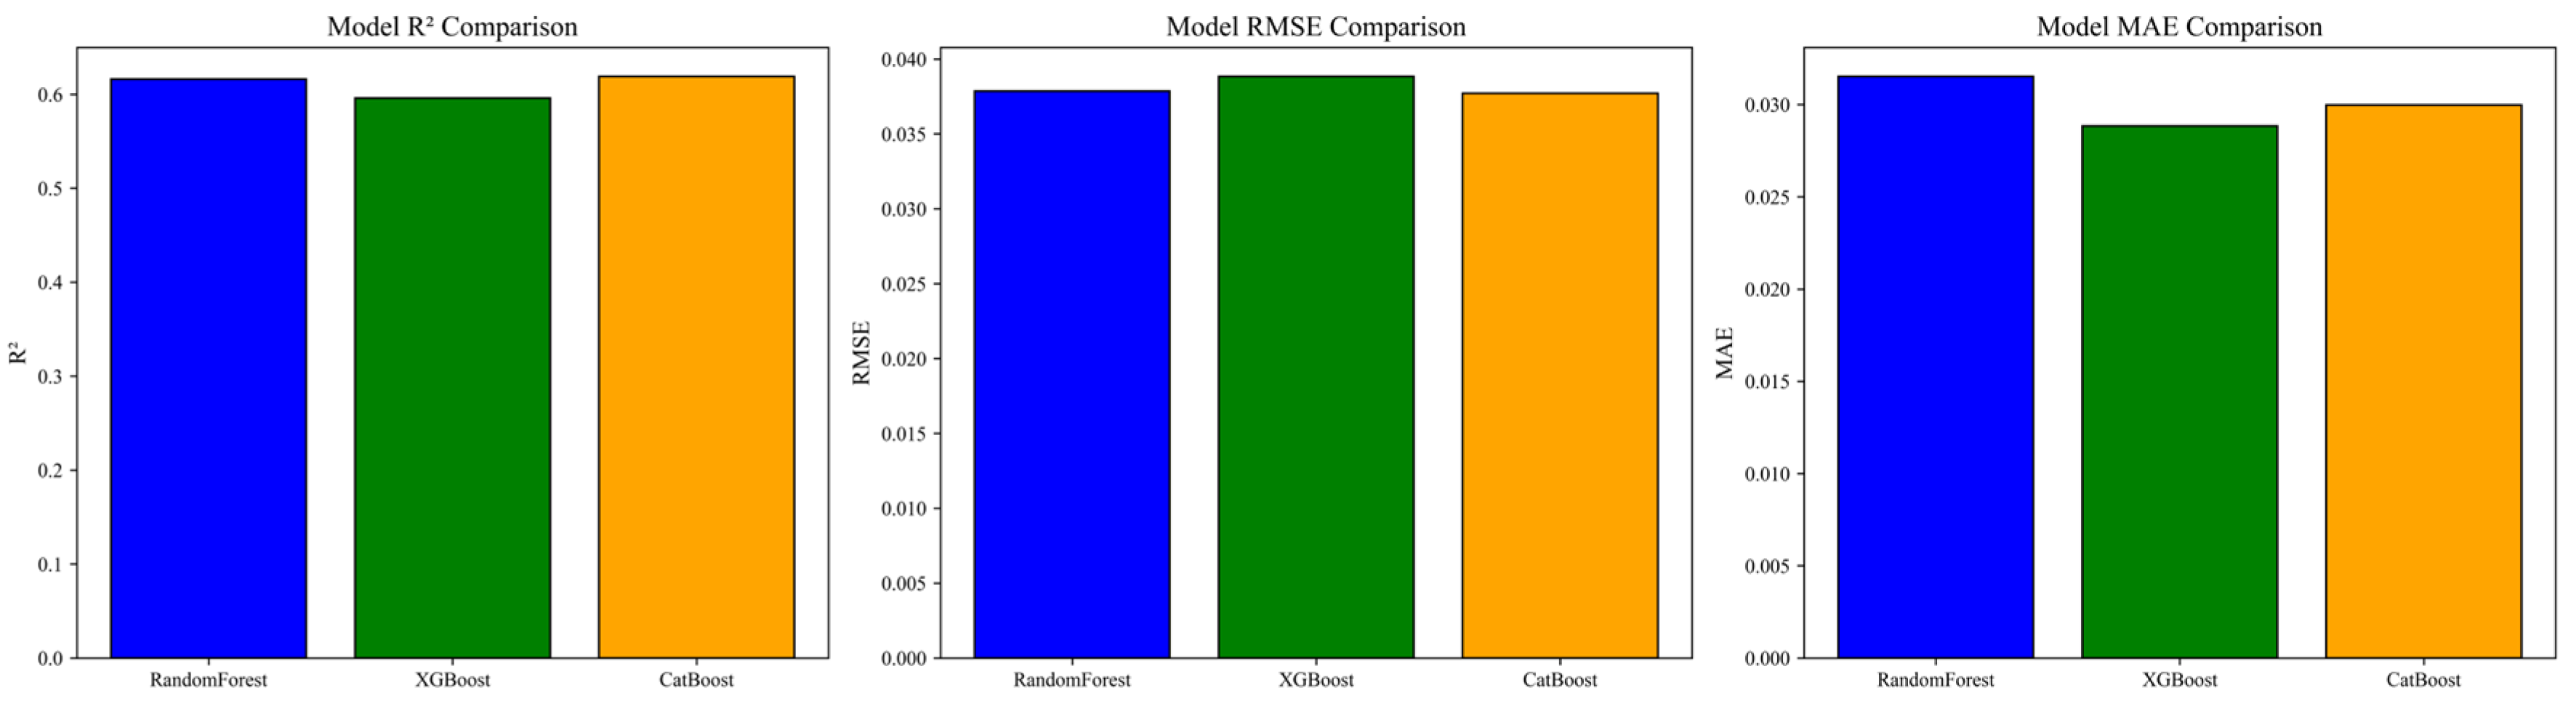
The summary statistics in Figure 7 confirm that the three base learners achieve broadly comparable predictive skill. The coefficient of determination remains in a narrow band (R2 ≈ 0.60–0.62), indicating that a substantial fraction of variance in the point observations is explained by the multi-source predictors. Error magnitudes are also similar, with RMSE around 0.038–0.039 and MAE close to 0.029–0.032, demonstrating consistent performance across models under the same input configuration. The bar charts nevertheless highlight meaningful differences: CatBoost achieves the highest R2, suggesting slightly better overall variance explanation, whereas XGBoost yields the lowest MAE, implying improved typical (absolute) error behavior and potentially fewer moderate-magnitude deviations. Random Forest performs competitively but shows a marginally higher MAE, consistent with its conservative smoothing that can reduce large errors at the cost of systematic underestimation at higher values. Importantly, the fact that the best model differs by metric underscores that the three learners emphasize different aspects of the predictor–target relationship, which provides a practical justification for subsequent ensemble fusion to reduce model-specific biases and improve stability.
Figure 7.
Performance comparison of the base learners: bar charts of R2, RMSE, and MAE for Random Forest, XGBoost, and CatBoost evaluated on the test subset.
4.2. Stacking Ensemble Performance on Training and Test Sets
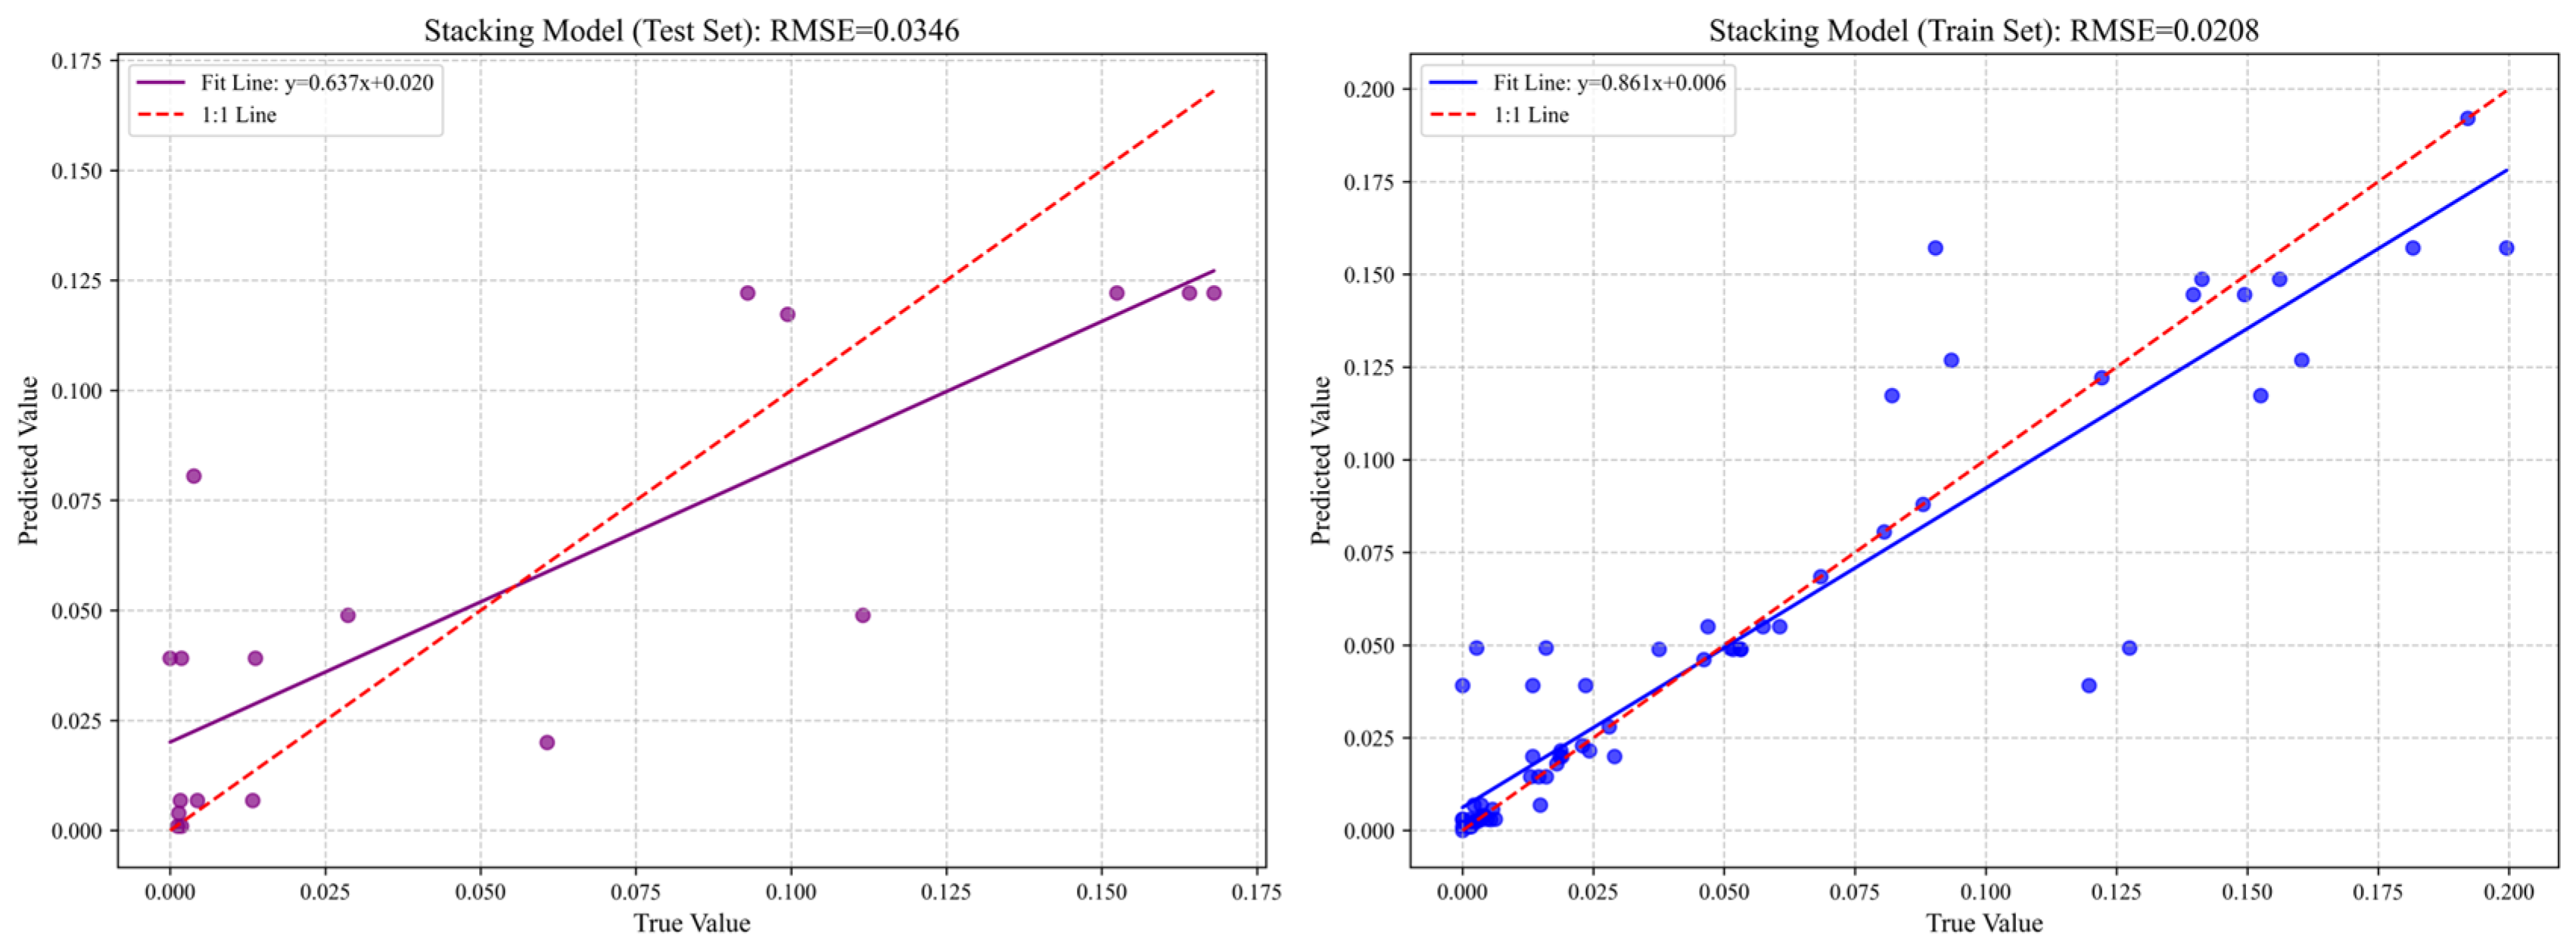
Figure 8 summarizes the performance of the stacking ensemble by comparing predicted and observed soil moisture for both the training set (meta-feature space) and the independent test set. Overall, the stacking model shows improved consistency relative to the individual base learners, particularly in terms of error magnitude on the test set. On the test subset, the ensemble achieves RMSE = 0.0346, which is lower than the base-model RMSE values (≈0.038–0.039), indicating that fusing multiple learners effectively reduces residual error and stabilizes prediction.
Figure 8.
Predicted–observed relationships for the stacking ensemble: scatter plots for the training set and the independent test set, with fitted regression lines and the 1:1 reference line; RMSE is reported for each subset.
The test set scatter plot further reveals that the stacking predictions preserve the monotonic relationship between predicted and observed values, while partially mitigating the range-compression behavior observed in the base models. The fitted line for the test set has a slope of 0.637 with a small positive intercept (0.020), implying that underestimation at higher moisture levels remains but is less severe than in the RF and CatBoost base fits and is comparable to, or slightly improved over, the best-performing base learner in terms of slope. Visually, a larger fraction of points cluster closer to the 1:1 line in the mid-range, suggesting that the meta-learner is able to adaptively leverage the strengths of different base models across different parts of the target distribution. In contrast, the training set panel indicates substantially tighter agreement between predicted and observed values, with RMSE = 0.0208 and a fitted slope of 0.861 (intercept ≈ 0.006). The markedly smaller training error and the closer alignment to the 1:1 line reflect the model’s capacity to fit the training meta-features effectively. The gap between training and test performance suggests a degree of residual generalization loss, which is expected for flexible ensemble models under limited sample size and a narrow moisture range. Nevertheless, the test set improvement demonstrates that the stacking framework provides a net gain in predictive performance and produces a more reliable mapping-ready model than any single base learner under the same predictor configuration.
4.3. Decision Tree Meta-Learner Hyperparameter Tuning
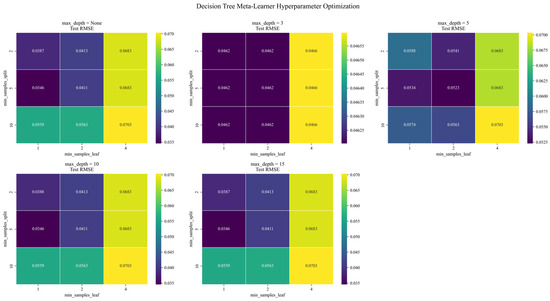
Figure 9 reports the grid search results for tuning the Decision Tree meta-learner in the stacking framework, expressed as test RMSE under different combinations of max_depth, min_samples_split, and min_samples_leaf. A clear performance structure emerges across panels. First, very shallow trees (e.g., max_depth = 3 and 5) consistently produce higher test RMSE than deeper or unrestricted trees, indicating underfitting: the meta-learner is too constrained to capture how the three base-model predictions should be combined across the full range of soil moisture conditions. In contrast, deeper settings (e.g., max_depth = 10 and 15) and the unrestricted tree (max_depth = None) deliver markedly lower errors, suggesting that the fusion relationship between base learners is not purely linear and benefits from a more flexible partitioning of the meta-feature space. Second, the heatmaps show that the regularization parameters dominate generalization. Increasing min_samples_leaf to 4 leads to a sharp degradation in performance in every depth panel (RMSE rising to ~0.068–0.070), implying that overly coarse leaf constraints prevent the meta-learner from adapting to local regimes where base-model strengths differ. Similarly, using min_samples_split = 10 tends to worsen performance relative to smaller or moderate split thresholds, again reflecting excessive restriction. The best-performing region is consistently achieved with small leaf sizes and moderate split constraints, and the global minimum test RMSE in the figure (0.0346) occurs at min_samples_split = 5 and min_samples_leaf = 1, appearing under max_depth = None as well as deeper finite depths (10–15). Overall, Figure 9 indicates that stacking benefits from a meta-learner that is sufficiently expressive (deep enough) but not over-regularized at the leaf level, yielding the most accurate and stable ensemble fusion.
Figure 9.
Hyperparameter optimization of the Decision Tree meta-learner: test set RMSE heatmaps across combinations of min_samples_leaf and min_samples_split under different max_depth settings (None, 3, 5, 10, and 15); the color scale indicates RMSE magnitude to facilitate identification of the most parsimonious configuration with minimal error.
4.4. Wall-to-Wall Soil Moisture Mapping and Spatial Pattern Characterization
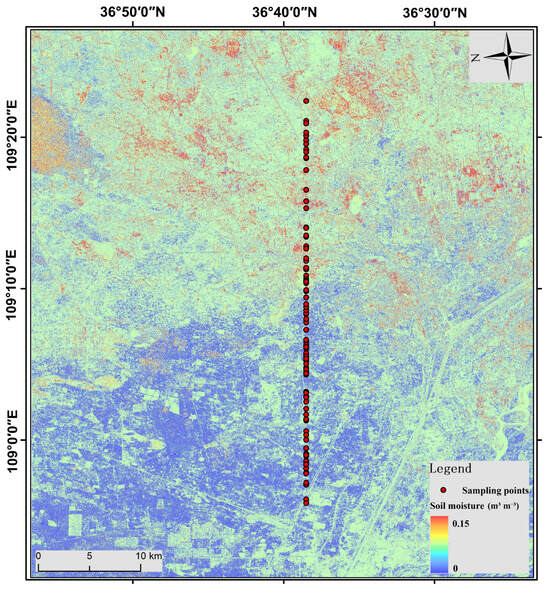
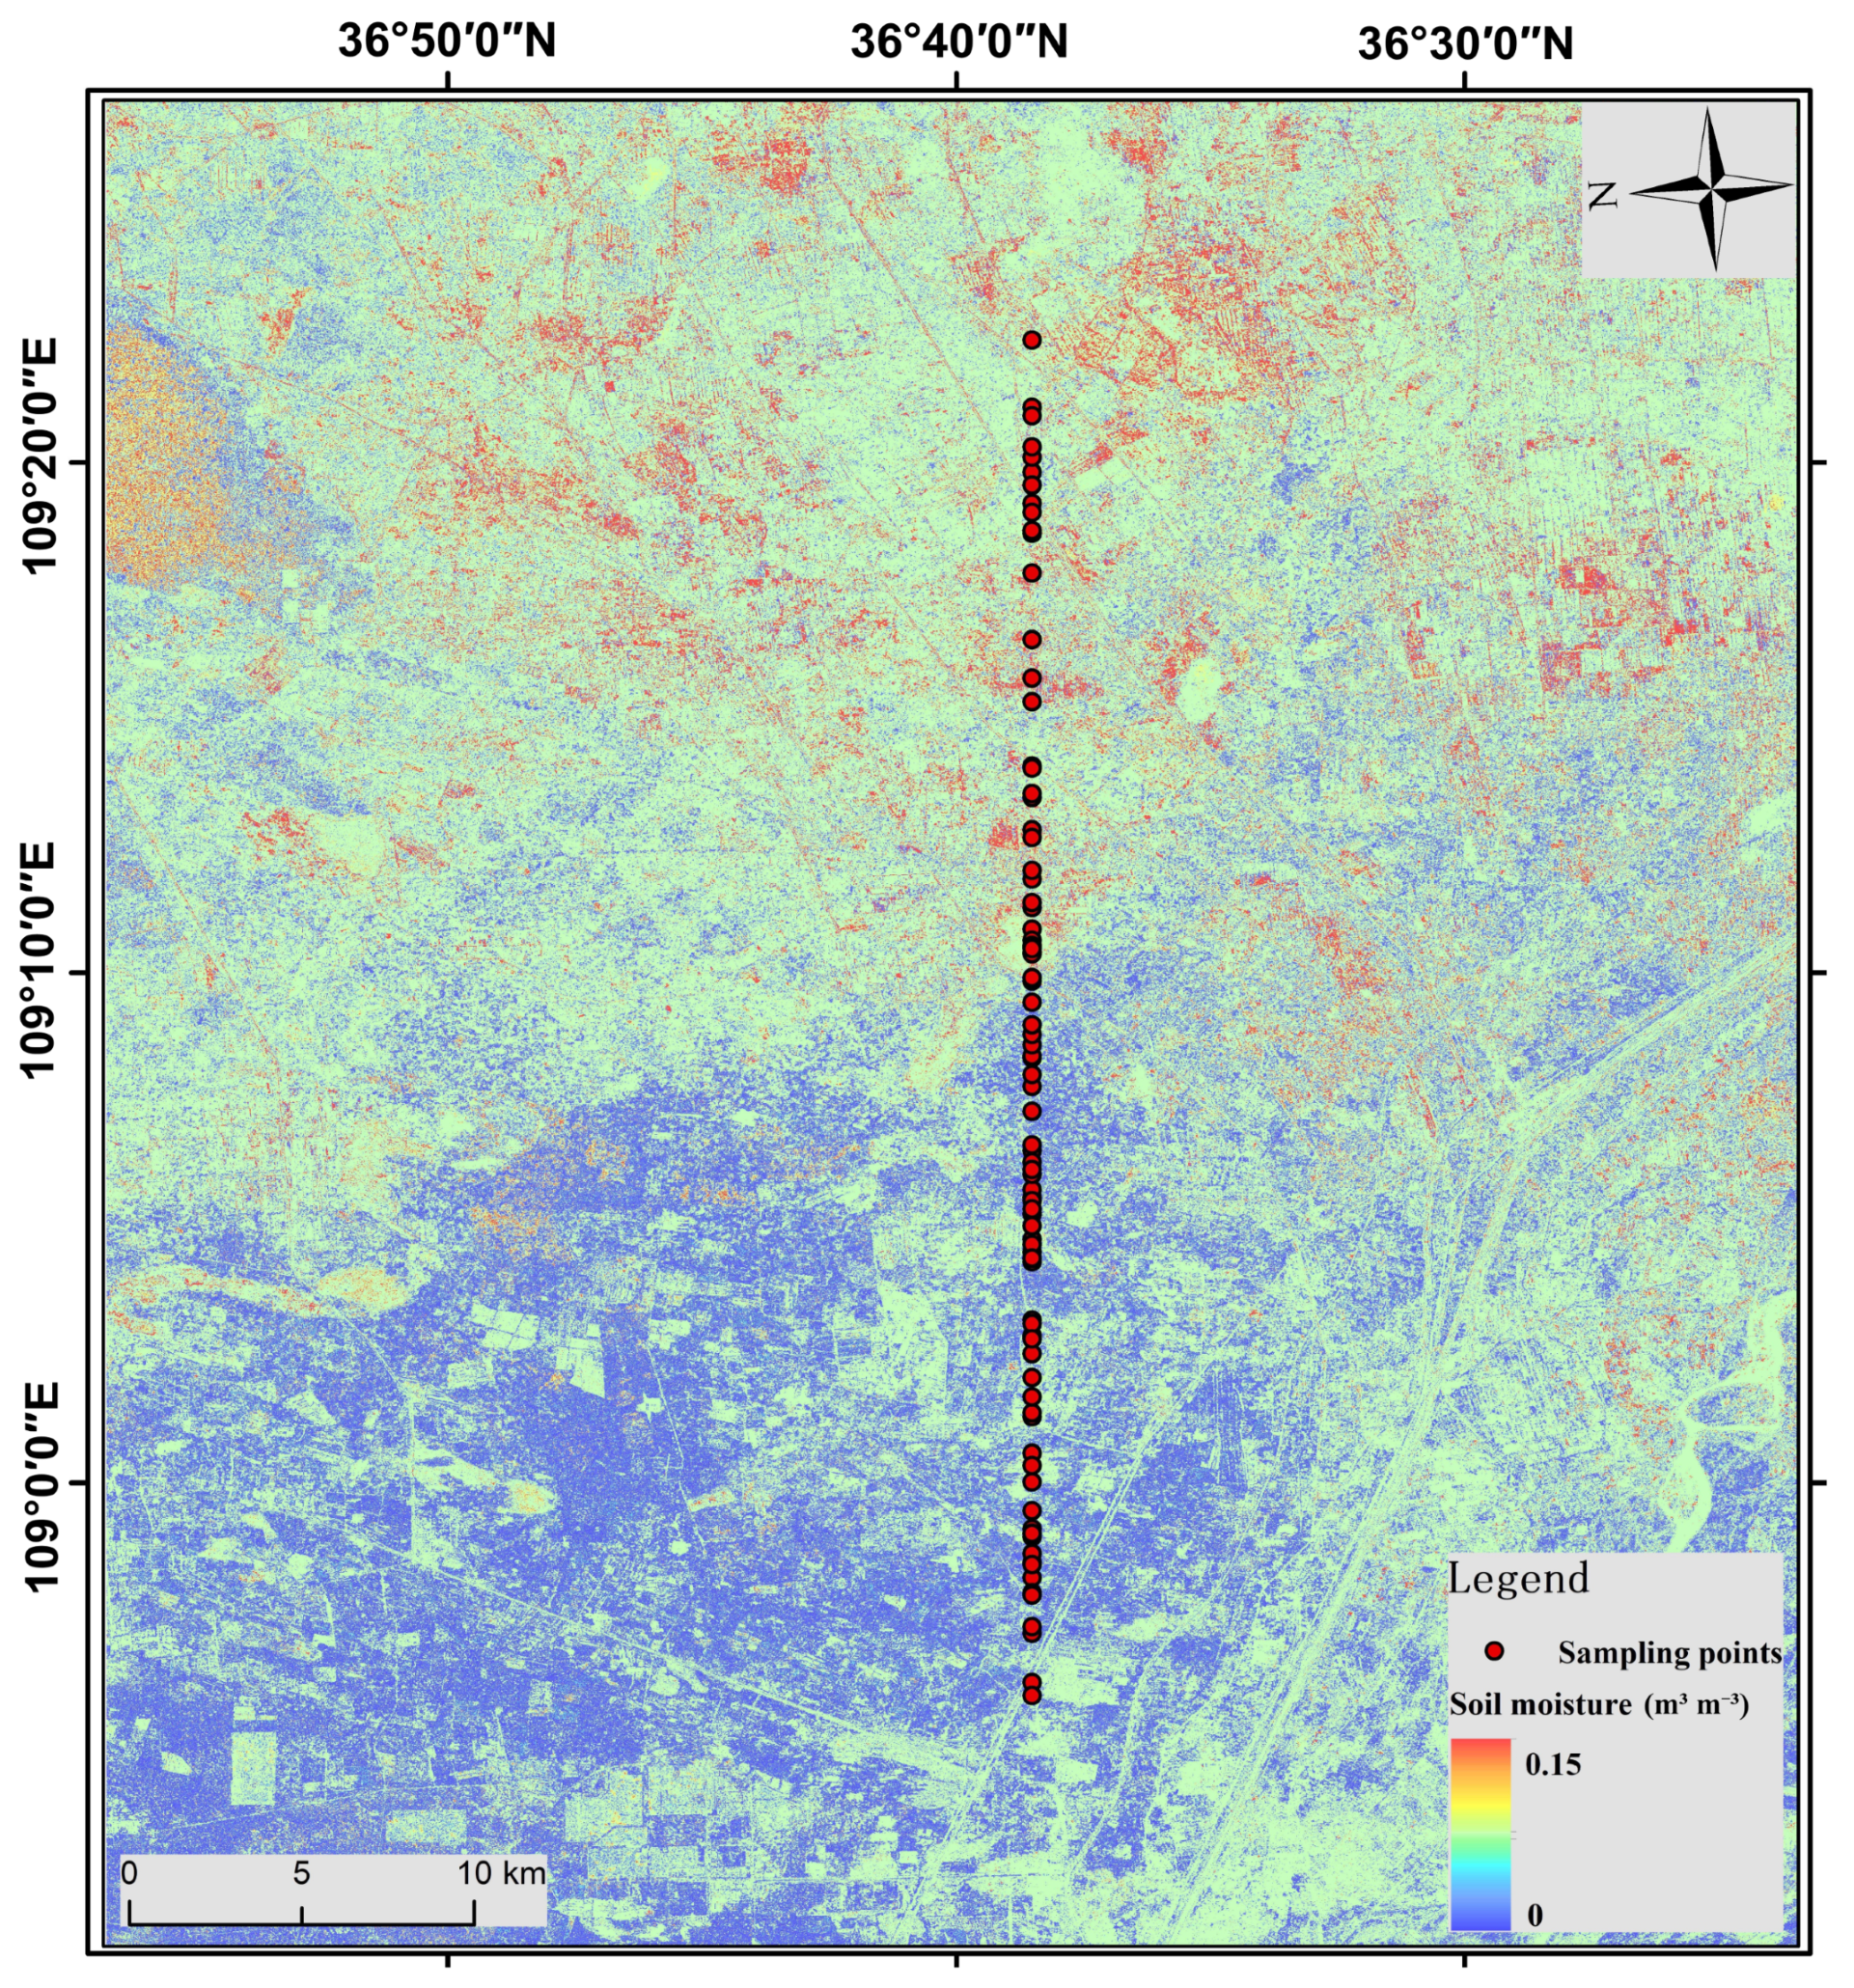
Figure 10 presents the wall-to-wall soil moisture (SM) map generated by applying the trained stacking framework to the stacked multi-band predictor raster. The product is reported at the spatial resolution of the input raster stack and represents surface moisture conditions as continuous values, ranging from near 0 to approximately 0.15 in the mapped domain (color bar). Sampling locations are overlaid as red points, showing that the field observations are distributed along a north–south transect that crosses multiple surface types and moisture regimes, which is beneficial for constraining spatial variability during model training and evaluation.
Figure 10.
Spatial distribution of predicted soil moisture in the study area: wall-to-wall soil moisture map generated by the proposed modeling workflow, with in situ sampling locations overlaid as points; the color ramp denotes soil moisture magnitude (0–0.15), highlighting spatial heterogeneity across the landscape.
The predicted SM field exhibits pronounced spatial heterogeneity, with coherent patches of relatively higher moisture (warm colors) interspersed with extensive areas of lower moisture (cool colors). This patchiness is consistent with the expectation that near-surface moisture varies strongly at fine scales under heterogeneous land-surface conditions (e.g., differences in soil texture, vegetation cover, and land management). In particular, the map shows that low-moisture conditions dominate large portions of the scene, while localized higher-moisture anomalies occur as discrete clusters, suggesting moisture accumulation or wetter surface states in specific zones rather than a uniform regional wetting pattern. From a mapping-quality perspective, the predicted surface appears spatially continuous without abrupt discontinuities at scene edges, indicating that the raster deployment is numerically stable. At the same time, small-scale speckle-like variability is still visible in some areas, which is expected when SAR-derived predictors contribute strongly and when sub-pixel heterogeneity and observation geometry introduce residual texture. Therefore, while the map is suitable for spatially explicit assessment and comparative analysis (e.g., identifying relatively wetter versus drier zones), the absolute values should be interpreted in the context of the sampling period and the predictor limitations, especially in areas where vegetation or surface roughness may partially mask the moisture signal. Uncertainty in the predicted soil moisture field arises from several sources, including temporal mismatch between field observations and satellite acquisitions, point-to-pixel scale inconsistency, residual SAR sensitivity to vegetation and surface roughness, and the limited representation of high-moisture conditions in the training data. Accordingly, the mapped product should be interpreted primarily as a spatially explicit estimate with varying confidence across land-surface regimes, rather than as an error-free absolute measurement field.
5. Discussion and Conclusions
This study demonstrates that a compact multi-source predictor set combining Sentinel-2 optical indices (MSI, NDWI), Sentinel-1 SAR backscatter descriptors (σVV and σVH/σVV), and terrain information (DEM) can support point-scale soil moisture (SM) estimation and subsequent wall-to-wall mapping through tree-based machine learning and stacking. Across the three base learners, the results show consistent predictive skill (R2 around 0.60–0.62), indicating that the selected predictors contain a coherent SM signal despite the confounding influences commonly associated with optical and SAR observations. The fact that comparable accuracy is obtained with only five predictors is practically meaningful, because it suggests that a relatively lightweight feature space can still capture major SM variability when the predictors are physically interpretable and complementary across sensor modalities.
A recurring pattern across all base models is the deviation from the 1:1 line and the slopes markedly lower than unity, indicating range compression. This behavior implies that the models tend to under-predict higher SM conditions and slightly over-predict very low values. Two mechanisms are likely relevant. First, the target distribution appears to be dominated by low-to-moderate moisture conditions, while high-moisture samples are sparse; under such imbalance, tree ensembles often learn conservative mappings that reduce large errors at the expense of damped amplitude. Second, both optical and SAR predictors embed non-moisture variability: optical indices are affected by vegetation phenology, surface residue, and illumination geometry, whereas SAR backscatter responds not only to dielectric changes but also to roughness and vegetation structure. When these factors vary within the sampling footprint or between acquisition times, the predictor–target relationship becomes partially non-unique, which can attenuate the model’s sensitivity to extremes. In this context, the systematic intercepts above zero observed in the fitted lines are also consistent with a “floor effect,” where measurement noise and predictor saturation prevent the predicted values from approaching exact zeros.
The stacking ensemble improves test accuracy (RMSE reduced to 0.0346) relative to the base learners (≈0.038–0.039), demonstrating that the three models capture partially distinct aspects of the SM signal and that a second-level learner can exploit this diversity to reduce residual error. The meta-learner importance indicates that CatBoost contributes the largest share in the final fusion, while Random Forest and XGBoost still provide complementary information. This pattern is plausible given that CatBoost can be particularly effective at learning stable nonlinear interactions under limited sample sizes, whereas RF and XGBoost may be more robust in specific regimes (e.g., low SM or locally heterogeneous surfaces). Importantly, the cross-validated construction of meta-features reduces information leakage, so the observed improvement on the independent test set is more likely to reflect genuine generalization rather than optimistic fitting.
The hyperparameter heatmaps further clarify that the effectiveness of stacking depends strongly on controlling meta-learner complexity. Shallow trees underperform, suggesting that the fusion rule is not adequately represented by a very simple partition of the meta-feature space. At the same time, overly strong regularization—especially large min_samples_leaf—degrades performance substantially, indicating that the ensemble requires sufficient flexibility to switch weighting among base learners across different moisture conditions. The best-performing region (test RMSE ≈ 0.0346) corresponds to small leaf sizes and moderate split constraints, consistent with a meta-learner that is expressive enough to capture regime-dependent fusion without being forced into an overly coarse decision structure.
The final soil moisture map exhibits spatially coherent variability with widespread low-moisture background and localized wetter patches. This spatial pattern is consistent with the expectation that near-surface moisture is strongly heterogeneous at fine scales and responds to both land-surface properties and terrain-driven redistribution. At the same time, the map shows residual speckle-like texture in some areas, likely reflecting the influence of SAR-derived predictors and sub-pixel heterogeneity. These characteristics imply that the product is well suited for relative interpretation—such as identifying wetter versus drier zones, delineating moisture gradients, or screening for anomalously wet areas—while absolute values should be interpreted cautiously in locations where vegetation/roughness effects may dominate SAR responses or where optical indices may be influenced by canopy water and illumination conditions.
Several limitations should be acknowledged. First, the sampling points are distributed primarily along a transect, which may limit the representativeness of land-cover and soil-condition variability across the full scene. This can affect the transferability of the learned relationships to areas that are not well covered by the field samples. Second, the target SM range appears relatively narrow, which can magnify the apparent impact of small absolute errors and encourages conservative predictions. Third, the modeling framework relies on static DEM but does not explicitly include dynamic drivers such as precipitation history or temperature, which may partly explain residual error and the persistence of range compression. The present model was evaluated under the environmental conditions represented by the sampling period of this study and was not explicitly tested across multiple seasons or contrasting climatic backgrounds. Its robustness outside the observed temporal and climatic window therefore remains to be verified through multi-season and multi-year validation. Finally, the use of backscatter-based SAR predictors without explicit correction for vegetation and roughness introduces an inherent ambiguity that machine learning can reduce but not fully eliminate. Notably, the proposed workflow is methodologically transferable; however, it should not be assumed that the trained model generalizes unchanged to all external environments. Its applicability is expected to be strongest in regions with comparable climatic backgrounds, land-cover compositions, terrain conditions, and SAR/optical response characteristics. For deployment outside the immediate study area, additional local calibration samples or transfer learning-based adaptation may be necessary to maintain predictive reliability. Uncertainty in the mapped soil moisture field arises from point-to-pixel scale mismatch, residual temporal mismatch between field and satellite observations, limited representation of high-moisture conditions, and the sensitivity of SAR backscatter to vegetation and surface roughness. Accordingly, the current map should be interpreted primarily as a spatially explicit estimate with varying confidence across land-surface regimes rather than as an error-free absolute measurement field.
Future improvements could focus on strengthening generalization and interpretability without substantially increasing workflow complexity. From a data perspective, expanding the spatial coverage of sampling locations and ensuring more balanced representation of wet conditions would help reduce amplitude damping and improve calibration at high SM. From a modeling perspective, incorporating uncertainty-aware evaluation (e.g., prediction intervals or ensemble spread) would better characterize reliability in different land-surface regimes. From a mapping perspective, applying light spatial post-processing (e.g., edge-preserving smoothing) could suppress SAR-induced speckle while retaining meaningful spatial gradients, provided that such filtering is validated against independent observations. Overall, the results suggest that multi-source feature integration combined with stacking is an effective and deployable approach for high-resolution SM mapping, while emphasizing that sensor confounders, sampling representativeness, and calibration across the full moisture range remain the dominant constraints on further accuracy gains.
The current results are likely sensitive to both sampling density and sampling distribution. A denser sampling design would improve support for local variability and extreme wetness conditions, whereas a more spatially balanced design would likely reduce corridor-specific bias. Future work should evaluate this effect explicitly through density-controlled subsampling or progressive training experiments. The proposed workflow is transferable in methodological terms, but the fitted model should not be assumed to generalize unchanged to all external environments. Its applicability is expected to be strongest in regions with broadly similar terrain, land-cover composition, and sensor-response conditions. For deployment beyond the current study area, additional local calibration samples or transfer-adaptation strategies would likely be required.
Author Contributions
Conceptualization, Y.L.; Methodology, Y.L.; Software, H.Y.; Investigation, Y.L., X.L. (Xiaobo Liu) and X.L. (Xinmin Li); Resources, X.K.; Visualization, Y.L. and B.Z.; Supervision, S.X. All authors have read and agreed to the published version of the manuscript.
Funding
This research was funded by Science and technology project of State Grid Corporation of China (5500-202432155A-1-1-ZN).
Institutional Review Board Statement
Not applicable.
Informed Consent Statement
Not applicable.
Data Availability Statement
Data will be made available on request.
Acknowledgments
This work was supported by the Science and Technology Project of State Grid Corporation of China: Research and Application on Disaster Mechanisms of Loess Landslides Affecting Transmission Lines and Enhancement Technologies for Operation and Maintenance Capability (5500-202432155A-1-1-ZN).
Conflicts of Interest
The authors declare that they have no known competing financial interests or personal relationships that could have appeared to influence the work reported in this paper. The authors are the employees of State Grid Electric Power Co., Ltd. The paper reflects the views of the scientists and not the company.
References
- Corradini, C. Soil moisture in the development of hydrological processes and its determination at different spatial scales. J. Hydrol. 2014, 516, 1–5. [Google Scholar] [CrossRef]
- Babaeian, E.; Sadeghi, M.; Jones, S.B.; Montzka, C.; Vereecken, H.; Tuller, M. Ground, Proximal, and Satellite Remote Sensing of Soil Moisture. Rev. Geophys. 2019, 57, 530–616. [Google Scholar] [CrossRef]
- Raffelli, G.; Previati, M.; Canone, D.; Gisolo, D.; Bevilacqua, I.; Capello, G.; Biddoccu, M.; Cavallo, E.; Deiana, R.; Cassiani, G.; et al. Local- and plot-scale measurements of soil moisture: Time and spatially resolved field techniques in plain, hill and mountain sites. Water 2017, 9, 706. [Google Scholar] [CrossRef]
- Shrestha, P.; Kurtz, W.; Vogel, G.; Schulz, J.P.; Sulis, M.; Hendricks Franssen, H.J.; Kollet, S.; Simmer, C. Connection Between Root Zone Soil Moisture and Surface Energy Flux Partitioning Using Modeling, Observations, and Data Assimilation for a Temperate Grassland Site in Germany. J. Geophys. Res. Biogeosci. 2018, 123, 2839–2862. [Google Scholar] [CrossRef]
- Manfreda, S.; Scanlon, T.M.; Caylor, K.K. On the importance of accurate depiction of infiltration processes on modelled soil moisture and vegetation water stress. Ecohydrology 2010, 3, 155–165. [Google Scholar] [CrossRef]
- Lawrence, D.M.; Thornton, P.E.; Oleson, K.W.; Bonan, G.B. The partitioning of evapotranspiration into transpiration, soil evaporation, and canopy evaporation in a GCM: Impacts on land-atmosphere interaction. J. Hydrometeorol. 2007, 8, 862–880. [Google Scholar] [CrossRef]
- Carrão, H.; Russo, S.; Sepulcre-Canto, G.; Barbosa, P. An empirical standardized soil moisture index for agricultural drought assessment from remotely sensed data. Int. J. Appl. Earth Obs. Geoinf. 2016, 48, 74–84. [Google Scholar] [CrossRef]
- Srivastava, P.K. Satellite Soil Moisture: Review of Theory and Applications in Water Resources. Water Resour. Manag. 2017, 31, 3161–3176. [Google Scholar] [CrossRef]
- Pratola, C.; Barrett, B.; Gruber, A.; Dwyer, E. Quality assessment of the CCI ECV soil moisture product using ENVISAT ASAR wide swath data over Spain, Ireland and Finland. Remote Sens. 2015, 7, 15388–15423. [Google Scholar] [CrossRef]
- Zignol, F.; Lidberg, W.; Greiser, C.; Larson, J.; Hoffrén, R.; Ågren, A.M. Controls on spatial and temporal variability of soil moisture across a heterogeneous boreal forest landscape. Hydrol. Earth Syst. Sci. 2025, 29, 5493–5513. [Google Scholar] [CrossRef]
- Chernykh, D.; Biryukov, R.; Bondarovich, A.; Lubenets, L.; Pavlenko, A.; Rakhymbek, K.; Revenko, D.; Zhantassova, Z. Spatiotemporal Analysis of Soil Moisture Variability and Precipitation Response Across Soil Texture Classes in East Kazakhstan. Land 2025, 14, 1136. [Google Scholar] [CrossRef]
- Blanka-Végi, V.; Tobak, Z.; Sipos, G.; Barta, K.; Szabó, B.; Van Leeuwen, B. Estimation of the Spatiotemporal Variability of Surface soil Moisture Using Machine Learning Methods Integrating Satellite and Ground-based Soil Moisture and Environmental Data. Water Resour. Manag. 2025, 39, 2317–2334. [Google Scholar] [CrossRef]
- Cai, J.; Zhou, B.; Chen, S.; Wang, X.; Yang, S.; Cheng, Z.; Wang, F.; Mei, X.; Wu, D. Spatial and Temporal Variability of Soil Moisture and Its Driving Factors in the Northern Agricultural Regions of China. Water 2024, 16, 556. [Google Scholar] [CrossRef]
- Peng, C.; Zeng, J.; Chen, K.S.; Ma, H.; Letu, H.; Zhang, X.; Shi, P.; Bi, H. Spatial Representativeness of Soil Moisture Stations and Its Influential Factors at a Global Scale. IEEE Trans. Geosci. Remote Sens. 2025, 63, 1–15. [Google Scholar] [CrossRef]
- Yu, Y.; Malone, B.P.; Renzullo, L.J.; Burton, C.A.; Tian, S.; Searle, R.D.; Bishop, T.F.A.; Walker, J.P. Spatial Soil Moisture Prediction from in Situ Data Upscaled to Landsat Footprint: Assessing Area of Applicability of Machine Learning Models. IEEE Trans. Geosci. Remote Sens. 2025, 63, 1–19. [Google Scholar] [CrossRef]
- Yu, L.; Gao, W.; Shamshiri, R.R.; Tao, S.; Ren, Y.; Zhang, Y.; Su, G. Review of research progress on soil moisture sensor technology. Int. J. Agric. Biol. Eng. 2021, 14, 32–42. [Google Scholar] [CrossRef]
- Huang, J.; Sehgal, V.; Alvarez, L.V.; Brocca, L.; Cai, S.; Cheng, R.; Cheng, X.; Du, J.; El Masri, B.; Endsley, K.A.; et al. Remotely Sensed High-Resolution Soil Moisture and Evapotranspiration: Bridging the Gap Between Science and Society. Water Resour. Res. 2025, 61, e2024WR037929. [Google Scholar] [CrossRef]
- Zhai, S.; Leng, P.; Ma, C.; Kasim, A.A.; Ma, T.; Huo, H.; Duan, S.-B.; Liu, X.; Li, Z.-L. SMCR: A first satellite-derived all-weather daily/1-km Soil Moisture Climatological Record (1980–2023). Sci. Data 2026, 13, 115. [Google Scholar] [CrossRef] [PubMed]
- Yin, D.; Song, X.; Zhu, X.; Guo, H.; Zhang, Y.; Zhang, Y. Spatiotemporal Analysis of Soil Moisture Variability and Its Driving Factor. Remote Sens. 2023, 15, 5768. [Google Scholar] [CrossRef]
- Xu, N.; Daccache, A.; Ahmadi, A.; Houtz, D.; Perez-Barquero, F.P. Soil moisture estimation with microwave remote sensing: A systematic review and meta-analysis. Int. J. Digit. Earth 2025, 18, 1–27. [Google Scholar] [CrossRef]
- Zeng, J.; Peng, J.; Zhao, W.; Ma, C.; Ma, H. Microwave Remote Sensing of Soil Moisture. Remote Sens. 2023, 15, 4243. [Google Scholar] [CrossRef]
- Zhang, R.; Chan, S.; Bindlish, R.; Lakshmi, V. A Performance Analysis of Soil Dielectric Models over Organic Soils in Alaska for Passive Microwave Remote Sensing of Soil Moisture. Remote Sens. 2023, 15, 1658. [Google Scholar] [CrossRef]
- Njoku, E.G.; Entekhabi, D. Passive microwave remote sensing of soil moisture. J. Hydrol. 1996, 184, 101–129. [Google Scholar] [CrossRef]
- Meng, X.; Zeng, J.; Yang, Y.; Zhao, W.; Ma, H.; Letu, H.; Zhu, Q.; Liu, Y.; Wang, P.; Peng, J. High-resolution soil moisture mapping through passive microwave remote sensing downscaling. Innov. Geosci. 2024, 2, 100101–100105. [Google Scholar] [CrossRef]
- Portal, G.; Jagdhuber, T.; Vall-Llossera, M.; Camps, A.; Pablos, M.; Entekhabi, D.; Piles, M. Assessment of multi-scale SMOS and SMAP soil moisture products across the Iberian Peninsula. Remote Sens. 2020, 12, 570. [Google Scholar] [CrossRef]
- Wang, Z.; Gao, Q.; Crosetto, M.; Escorihuela, M.J. High-resolution surface soil moisture retrieval: A hybrid machine learning framework integrating change detection and downscaling for precision water management. Int. J. Appl. Earth Obs. Geoinf. 2025, 142, 104702. [Google Scholar] [CrossRef]
- Yu, Y.; Filippi, P.; Bishop, T.F.A. Field-Scale Soil Moisture Estimated From Sentinel-1 SAR Data Using a Knowledge-Guided Deep Learning Approach. In IGARSS 2025—2025 IEEE International Geoscience and Remote Sensing Symposium; IEEE: Piscataway, NJ, USA, 2025; pp. 193–198. [Google Scholar]
- Wang, Y.; Zhao, H.; Fan, J.; Wang, C.; Ji, X.; Jin, D.; Chen, J. A Review of Earth’s Surface Soil Moisture Retrieval Models via Remote Sensing. Water 2023, 15, 3757. [Google Scholar] [CrossRef]
- Ma, C.; Li, X.; McCabe, M.F. Retrieval of high-resolution soil moisture through combination of Sentinel-1 and Sentinel-2 data. Remote Sens. 2020, 12, 2303. [Google Scholar] [CrossRef]
- Li, J.; Wang, S. Using SAR-derived vegetation descriptors in a water cloud model to improve soil moisture retrieval. Remote Sens. 2018, 10, 1370. [Google Scholar] [CrossRef]
- Weiß, T.; Ramsauer, T.; Löw, A.; Marzahn, P. Evaluation of different radiative transfer models for microwave backscatter estimation of wheat fields. Remote Sens. 2020, 12, 3037. [Google Scholar] [CrossRef]
- Abbes, A.B.; Jarray, N.; Farah, I.R. Advances in remote sensing based soil moisture retrieval: Applications, techniques, scales and challenges for combining machine learning and physical models. Artif. Intell. Rev. 2024, 57, 224. [Google Scholar] [CrossRef]
- Wang, L.; He, B.; Bai, X.; Xing, M. Assessment of different vegetation parameters for parameterizing the coupled water cloud model and advanced integral equation model for soil moisture retrieval using time series sentinel-1A data. Photogramm. Eng. Remote Sens. 2019, 85, 43–54. [Google Scholar] [CrossRef]
- Lamichhane, M.; Mehan, S.; Mankin, K.R. Soil Moisture Prediction Using Remote Sensing and Machine Learning Algorithms: A Review on Progress, Challenges, and Opportunities. Remote Sens. 2025, 17, 2397. [Google Scholar] [CrossRef]
- Taheri, M.; Bigdeli, M.; Imanian, H.; Mohammadian, A. An Overview of Machine-Learning Methods for Soil Moisture Estimation. Water 2025, 17, 1638. [Google Scholar] [CrossRef]
- Nadeem, A.A.; Zha, Y.; Shi, L.; Ali, S.; Wang, X.; Zafar, Z.; Afzal, Z.; Tariq, M.A.U.R. Spatial Downscaling and Gap-Filling of SMAP Soil Moisture to High Resolution Using MODIS Surface Variables and Machine Learning Approaches over ShanDian River Basin, China. Remote Sens. 2023, 15, 812. [Google Scholar] [CrossRef]
- Sahaar, S.A.; Niemann, J.D. Estimating Rootzone Soil Moisture by Fusing Multiple Remote Sensing Products with Machine Learning. Remote Sens. 2024, 16, 3699. [Google Scholar] [CrossRef]
- Liu, Y.; Zha, Y.; Ran, G.; Zhang, Y.; Shi, L. SMRFR: A global multilayer soil moisture dataset generated using Random Forest from multi-source data. Sci. Data 2025, 12, 1170. [Google Scholar] [CrossRef]
- Xu, Y.; Cai, S.; Huang, J.; Liu, J.; Shang, J.; Yang, Z.; Zhang, Z. A Multimodal Deep Learning Approach for Soil Moisture Downscaling Using Remote Sensing and Weather Data. J. Geophys. Res. Mach. Learn. Comput. 2025, 2, e2025JH000639. [Google Scholar] [CrossRef]
- Li, Z.; Yang, Q.; Li, J.; Jin, T.; Yuan, Q.; Shen, H.; Zhang, L. Global multi-scale surface soil moisture retrieval coupling physical mechanisms and machine learning in the cloud environment. Remote Sens. Environ. 2025, 329, 114928. [Google Scholar] [CrossRef]
- Guo, N.; Chen, H.; Han, Q.; Wang, T. Evaluating data-driven and hybrid modeling of terrestrial actual evapotranspiration based on an automatic machine learning approach. J. Hydrol. 2024, 628, 130594. [Google Scholar] [CrossRef]
- Bauer-Marschallinger, B.; Freeman, V.; Cao, S.; Paulik, C.; Schaufler, S.; Stachl, T.; Modanesi, S.; Massari, C.; Ciabatta, L.; Brocca, L.; et al. Toward Global Soil Moisture Monitoring with Sentinel-1: Harnessing Assets and Overcoming Obstacles. IEEE Trans. Geosci. Remote Sens. 2019, 57, 520–539. [Google Scholar] [CrossRef]
- Delfani, P.; Thuraga, V.; Banerjee, B.; Chawade, A. Integrative approaches in modern agriculture: IoT, ML and AI for disease forecasting amidst climate change. Precis. Agric. 2024, 25, 2589–2613. [Google Scholar] [CrossRef]
- Breiman, L. Random Forests. Mach. Learn. 2001, 45, 5–32. [Google Scholar] [CrossRef]
- Chen, T.; Guestrin, C. XGBoost: A Scalable Tree Boosting System. In Proceedings of the 22nd ACM SIGKDD International Conference on Knowledge Discovery and Data Mining; ACM: San Francisco, CA, USA, 2016; pp. 785–794. [Google Scholar]
- Prokhorenkova, L.; Gusev, G.; Vorobev, A.; Dorogush, A.V.; Gulin, A. CatBoost: Unbiased boosting with categorical features. Adv. Neural Inf. Process. Syst. 2018, 31, 1–11. [Google Scholar] [CrossRef]
Disclaimer/Publisher’s Note: The statements, opinions and data contained in all publications are solely those of the individual author(s) and contributor(s) and not of MDPI and/or the editor(s). MDPI and/or the editor(s) disclaim responsibility for any injury to people or property resulting from any ideas, methods, instructions or products referred to in the content. |
© 2026 by the authors. Licensee MDPI, Basel, Switzerland. This article is an open access article distributed under the terms and conditions of the Creative Commons Attribution (CC BY) license.