


Abstract
Farmland wind erosion is usually assessed only by emission intensity, with limited understanding of how soil differences propagate through transport and post-wind settling. Here, seven typical farmland soils from west-central Inner Mongolia, northern China, were tested in a closed-circuit wind tunnel under five wind speeds (8.0–14.0 m s−1). Based on particle-size composition, dry aggregate fractions, and organic matter content, the soils were grouped into three particle–aggregate groups. The results showed that, at 14.0 m s−1, differences in measured particle–aggregate properties among soils were first reflected in marked differences in steady dust release intensity and vertically integrated transport input, which ranged from 27.78 to 76.39 mg m−3 and from 14.52 to 135.32 g m−2 10 min−1, respectively. These differences were then transmitted to the near-surface transport layer, where the soils exhibited contrasting patterns in upper-layer contribution, transport height, and vertical particle-size sorting. After wind cessation, the soils further diverged into early-concentrated, transitional, and sustained-accumulation settling types. Steady dust release intensity was positively correlated with transport input and also with early deposition load. These findings indicate that particle-size and aggregate properties influence not only dust release, but also the organization of transport processes and the post-wind fate of particles.
1. Introduction
Farmland soil wind erosion is a major process driving land degradation and changes in the agroecological environment in arid and semiarid regions. Farmland surfaces are continually affected by tillage, irrigation, seedbed preparation, residue management, and crop rotation. As a result, the supply of loose surface particles, aggregate composition, and near-surface roughness show stronger spatiotemporal variability [1,2]. Farmland is therefore both a receptor of wind erosion damage and, during specific seasons or management stages, a potentially important local dust source [2,3,4]. Persistent wind erosion in farmland can selectively remove finer and more nutrient-rich soil fractions, causing surface coarsening and fertility decline, while also increasing near-surface particulate exposure and downwind environmental risk [1,5]. Identifying differences in wind erosion responses among farmland soils and clarifying their causes is therefore essential for understanding dust-source processes in farmland and for assessing wind erosion risk.
Considerable progress has been made through field observations, wind tunnel experiments, and model simulations, with most studies focusing on total soil loss, near-surface sediment transport, or PM emission intensity [1,4,6,7,8]. These studies have shown that aggregate status, surface roughness, tillage disturbance, and residue management can strongly alter soil erodibility and dust emission from farmland soils [2]. Wind erosion responses also vary with soil texture, erosion duration, and wind forcing. Meanwhile, the vertical mass distribution of wind-eroded material is not fixed. Mass fluxes at different heights can be described by different models, and dust fluxes of different particle sizes do not respond uniformly to wind conditions [6,8]. More recently, pedo-transfer-function-based approaches have been used to predict wind-erodibility indicators such as EF and MWD from routine soil properties, but these methods remain empirical predictions of static indices and cannot directly capture the dynamic processes of aggregate breakdown and renewed supply of fine particles during erosion [9]. Together, these findings suggest that differences in farmland wind erosion are not limited to emission magnitude, but may also be expressed in differences in near-surface transport structure and particle-size sorting.
In contrast, the deposition stage remains poorly integrated in studies of farmland wind erosion. Previous research has shown that substantial near-source dust deposition can occur and may affect vegetation, soils, and aquatic environments [10]. Deposition is also not merely the end point of transport. It can further reshape the particle-size composition and spatial distribution of near-surface particulates [11,12]. However, the existing literature still tends to treat emission, vertical transport, and deposition separately. Large differences also remain among studies in regional setting, experimental setup, wind conditions, and observation metrics [12,13,14]. For farmland systems, this gap means that a basic question remains unresolved: are differences among farmland soils expressed only as differences in emission intensity, or are they further transmitted into differences in near-surface transport structure and deposition outcomes?
The key to this question lies in particle–aggregate properties. The amount of material entering the transport layer and its particle-size composition are not controlled solely by the initial soil texture. They also depend on whether the particle–aggregate assemblage can continue to release new fine particles during erosion [3,15,16]. This issue is particularly important for farmland soils, because their surface structure is continually modified by tillage disturbance, irrigation–drying cycles, and mechanical breakdown. Aggregates are therefore under continuous reorganization, and similar apparent texture does not necessarily imply similar release or transport responses [7,17,18]. Previous studies have shown clear size-dependent differences in the vertical fluxes of dust particles and in their relationships with friction velocity. Particle composition aloft, particle-size sorting, and flux partitioning are jointly influenced by the emitted size spectrum, settling velocity, and turbulent mixing [6,8,19]. Therefore, differences in wind erosion responses among farmland soils cannot be understood by comparing only total emission or total transport. Release, near-surface transport, and post-wind deposition need to be compared within a common framework, with particle-size and dry aggregate properties as the organizing basis.
The agro–pastoral ecotone of northern China is a typical wind erosion-prone region for farmland. In west-central Inner Mongolia, multiple agricultural landscape types coexist, including irrigated oasis farmland and rainfed cropland, and they differ markedly in parent material, management history, and surface particle–aggregate condition. This provides an ideal basis for comparing how different farmland soils diverge during release, transport, and deposition. Against this background, this study examined seven typical farmland soils from west-central Inner Mongolia. Wind-speed gradients of 8–14 m s−1 were imposed in a closed-circuit wind tunnel under unified experimental conditions. By combining particle–aggregate classification, monitoring of steady-state emission intensity, multi-height collection of transported particles, and observations of static settling after wind cessation, we systematically analyzed stage-specific differences and linkages in the release, near-surface transport, and deposition of wind-eroded particles among soils. This study addressed four questions: (1) can the seven farmland soils be grouped into particle–aggregate groups from a wind erosion perspective; (2) do soils of different particle–aggregate groups show systematic differences in steady-state emission intensity and total transport; (3) are these differences further expressed as divergence in near-surface transport structure and vertical particle-size sorting; and (4) do different soils differ in the temporal partitioning of deposition, local retention, and continued export after wind cessation? Through these analyses, this study aims to provide experimental evidence for a more process-based understanding of wind erosion processes in farmland soils and to support wind erosion risk assessment and related parameter optimization.
2. Materials and Methods
2.1. Study Area
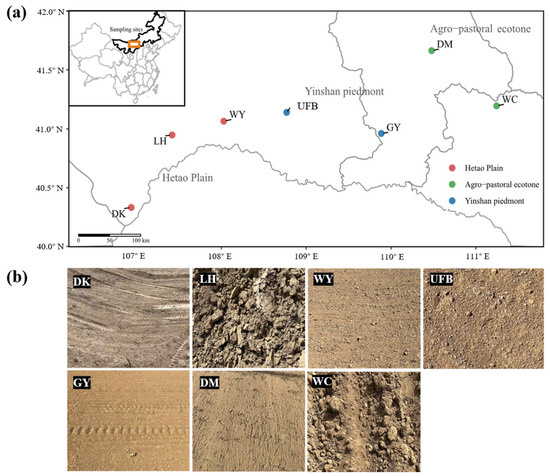
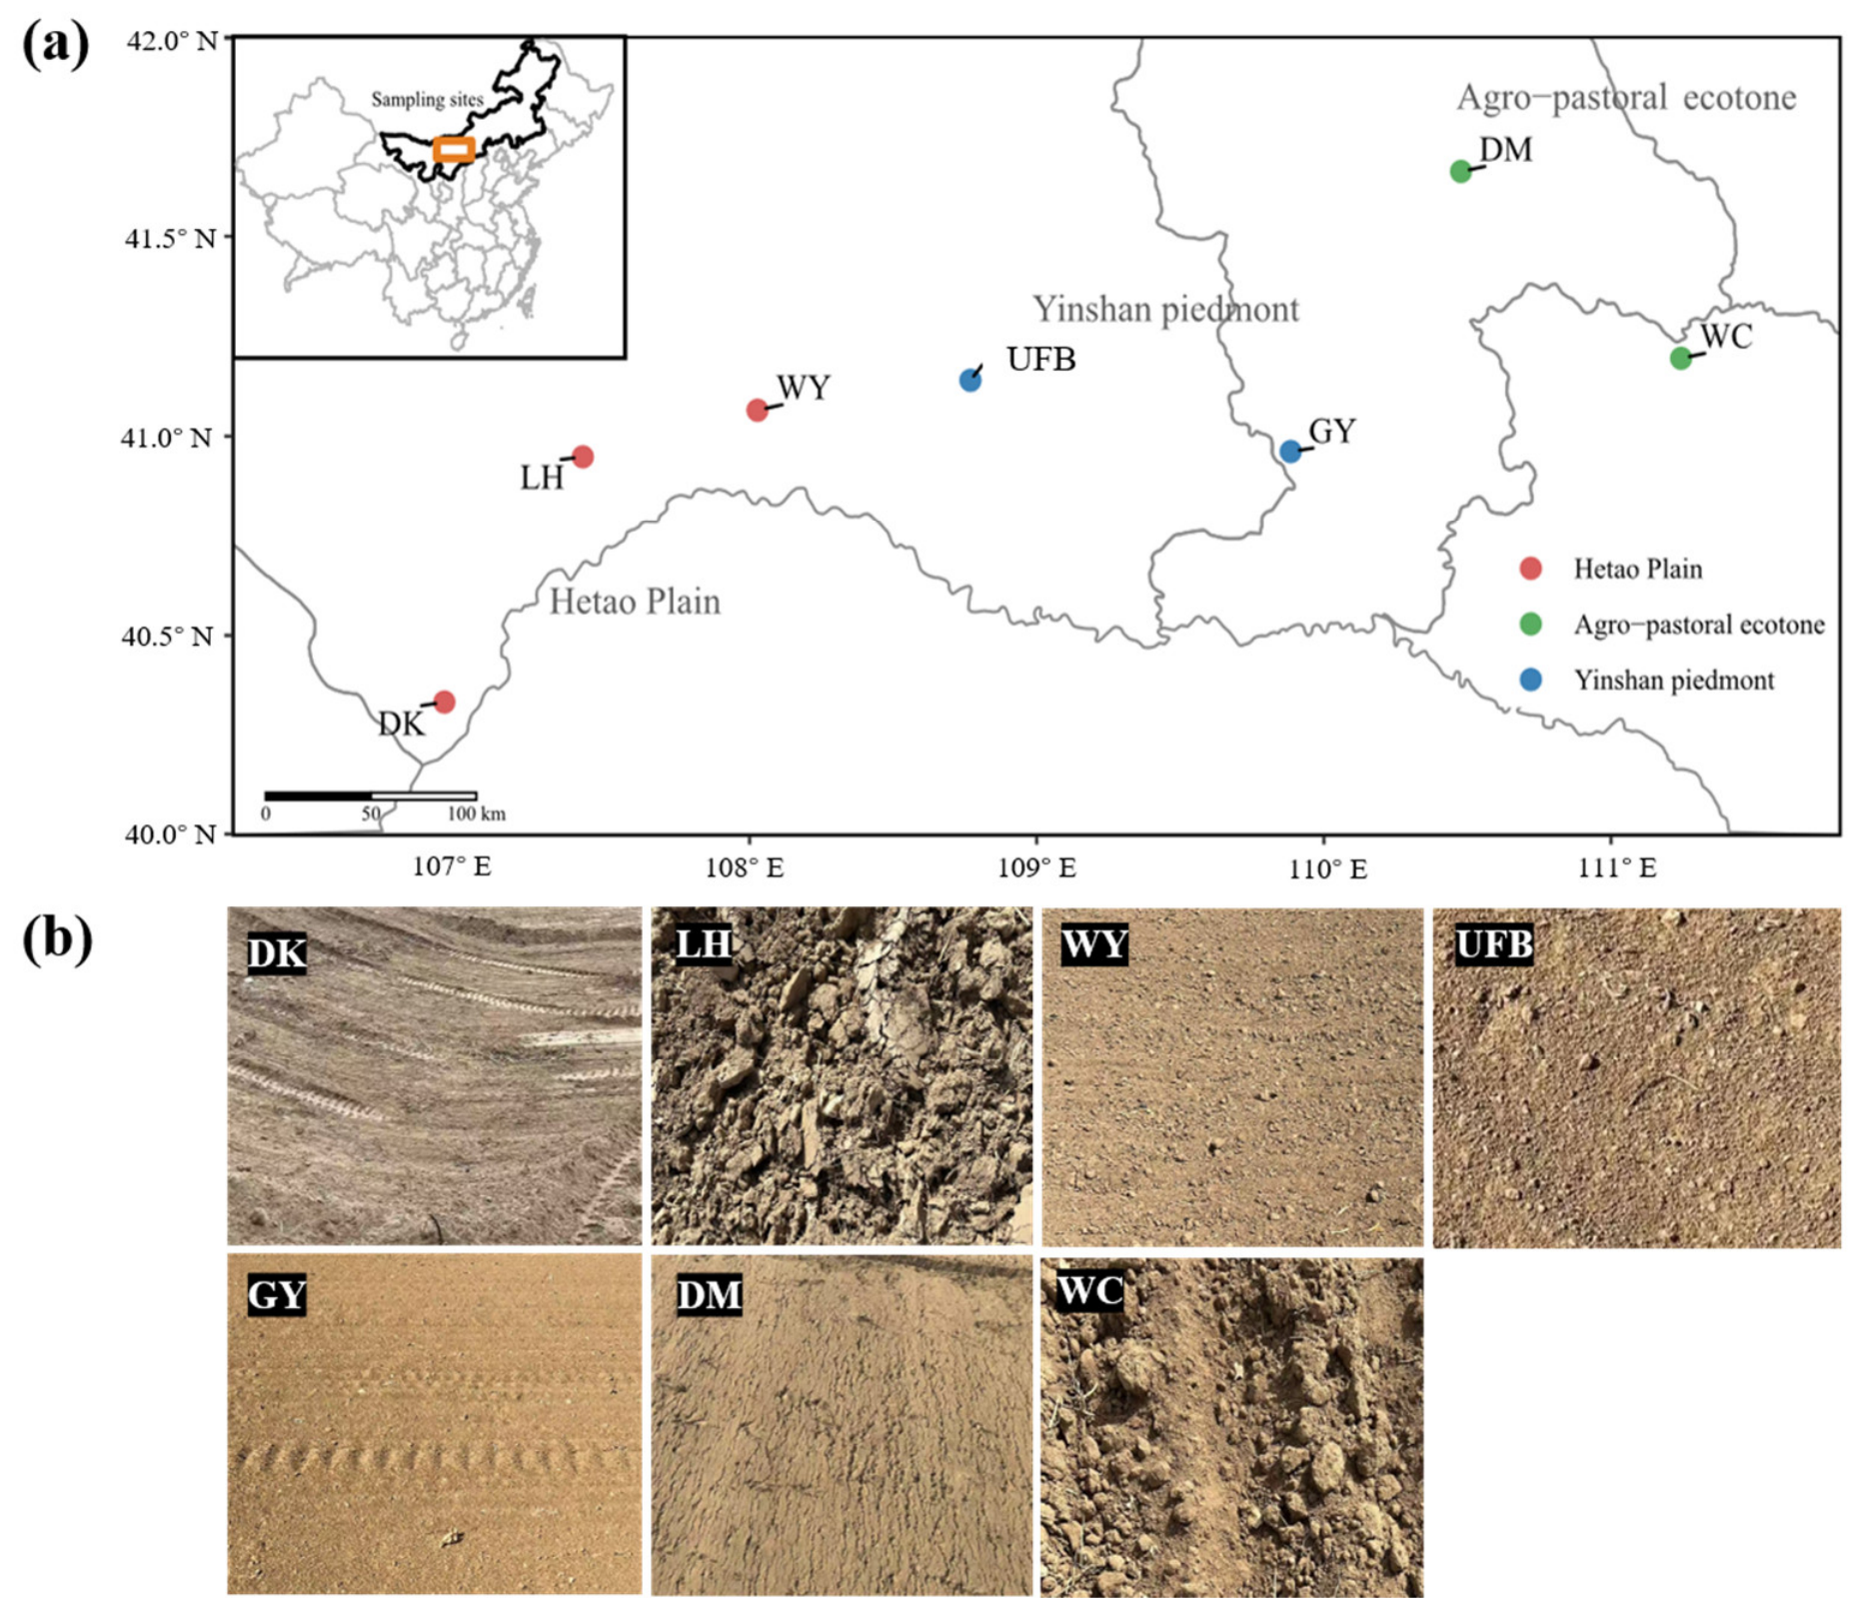
The sampling region was located in west-central Inner Mongolia and extended across the Hetao Irrigation Plain in Bayannur and the agro–pastoral ecotone along the northern piedmont of the Yinshan Mountains (40.95–41.66° N, 107.42–111.24° E), at elevations of 1023–1676 m a.s.l. Sampling sites were distributed in Dengkou County (DK), Linhe District (LH), Wuyuan County (WY), and Urat Front Banner (UFB) of Bayannur, as well as Wuchuan County (WC) of Hohhot, and Darhan Muminggan Banner (DM) and Guyang County (GY) of Baotou (Figure 1). The Hetao Irrigation District is one of the major Yellow River-fed agricultural regions in China. It lies in an arid to semiarid continental monsoon climate zone characterized by low precipitation, strong evaporation, and frequent winds. Annual precipitation in the Hetao Irrigation District is generally low, approximately 130–250 mm, whereas annual evaporation is much higher, commonly exceeding 2100 mm [20,21,22]. Rainfall is unevenly distributed within the year and occurs mainly during the warm growing season, whereas spring is relatively dry and windy. This seasonal mismatch between dry windy conditions and summer-concentrated rainfall provides an important climatic background for farmland wind erosion in the region. Farmland soils in the Hetao Irrigation Plain are mainly developed from irrigation-related alluvial or silted deposits, making this area a typical distribution zone of irrigated agricultural soils [23,24].
Figure 1.
Distribution of sampling sites and surface characteristics of farmland soils. (a) Geographic distribution of the seven sampling sites in west-central Inner Mongolia; (b) Representative photographs of surface conditions at the seven farmland soil sampling sites. Surface soil samples were collected from the 0–4 cm layer, which is the layer most directly involved in particle entrainment and aggregate breakdown during wind erosion. The seven samples were sand-dominated according to the laser-derived particle-size distribution, but they differed in fine-particle proportion, median particle diameter, organic matter content, and dry aggregate-size composition.
In contrast, the adjacent northern Yinshan piedmont and agro–pastoral ecotone represent an ecologically fragile transition zone between cropland and grassland. Precipitation generally increases eastward from the western desert–oasis region toward the agro–pastoral ecotone, but the region remains arid to semiarid and prone to aeolian erosion [25]. These areas have long been affected by wind erosion, land-use change, and soil degradation. Farmland soils there show marked differences in parent material and surface morphology and are generally controlled by loess, proluvial deposits, and their subsequent redistribution processes [24,25,26]. This region therefore includes multiple agricultural surface types, including irrigated farmland on the Hetao Plain, piedmont farmland along the northern Yinshan Mountains, and rainfed farmland in the agro–pastoral ecotone. The coexistence of low precipitation, high evaporative demand, seasonal winds, and heterogeneous farmland surface materials makes this region suitable for comparing differences in dust release, near-surface transport, and subsequent deposition among farmland soils under controlled wind tunnel conditions. The basic site information and measured soil properties of the seven farmland soils are summarized in Table 1.
Table 1.
Basic site information and measured properties of the seven farmland soils.
2.2. Wind Tunnel Facility and Experimental Design
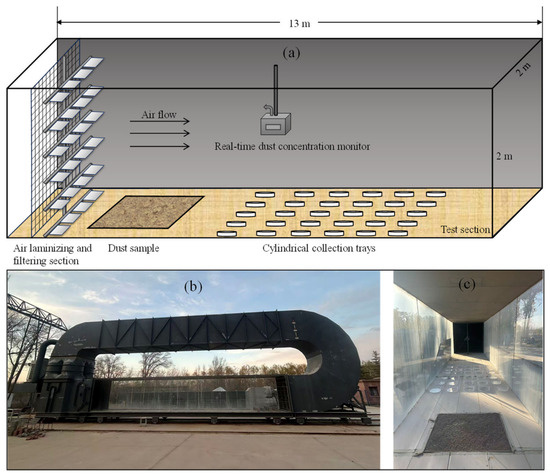
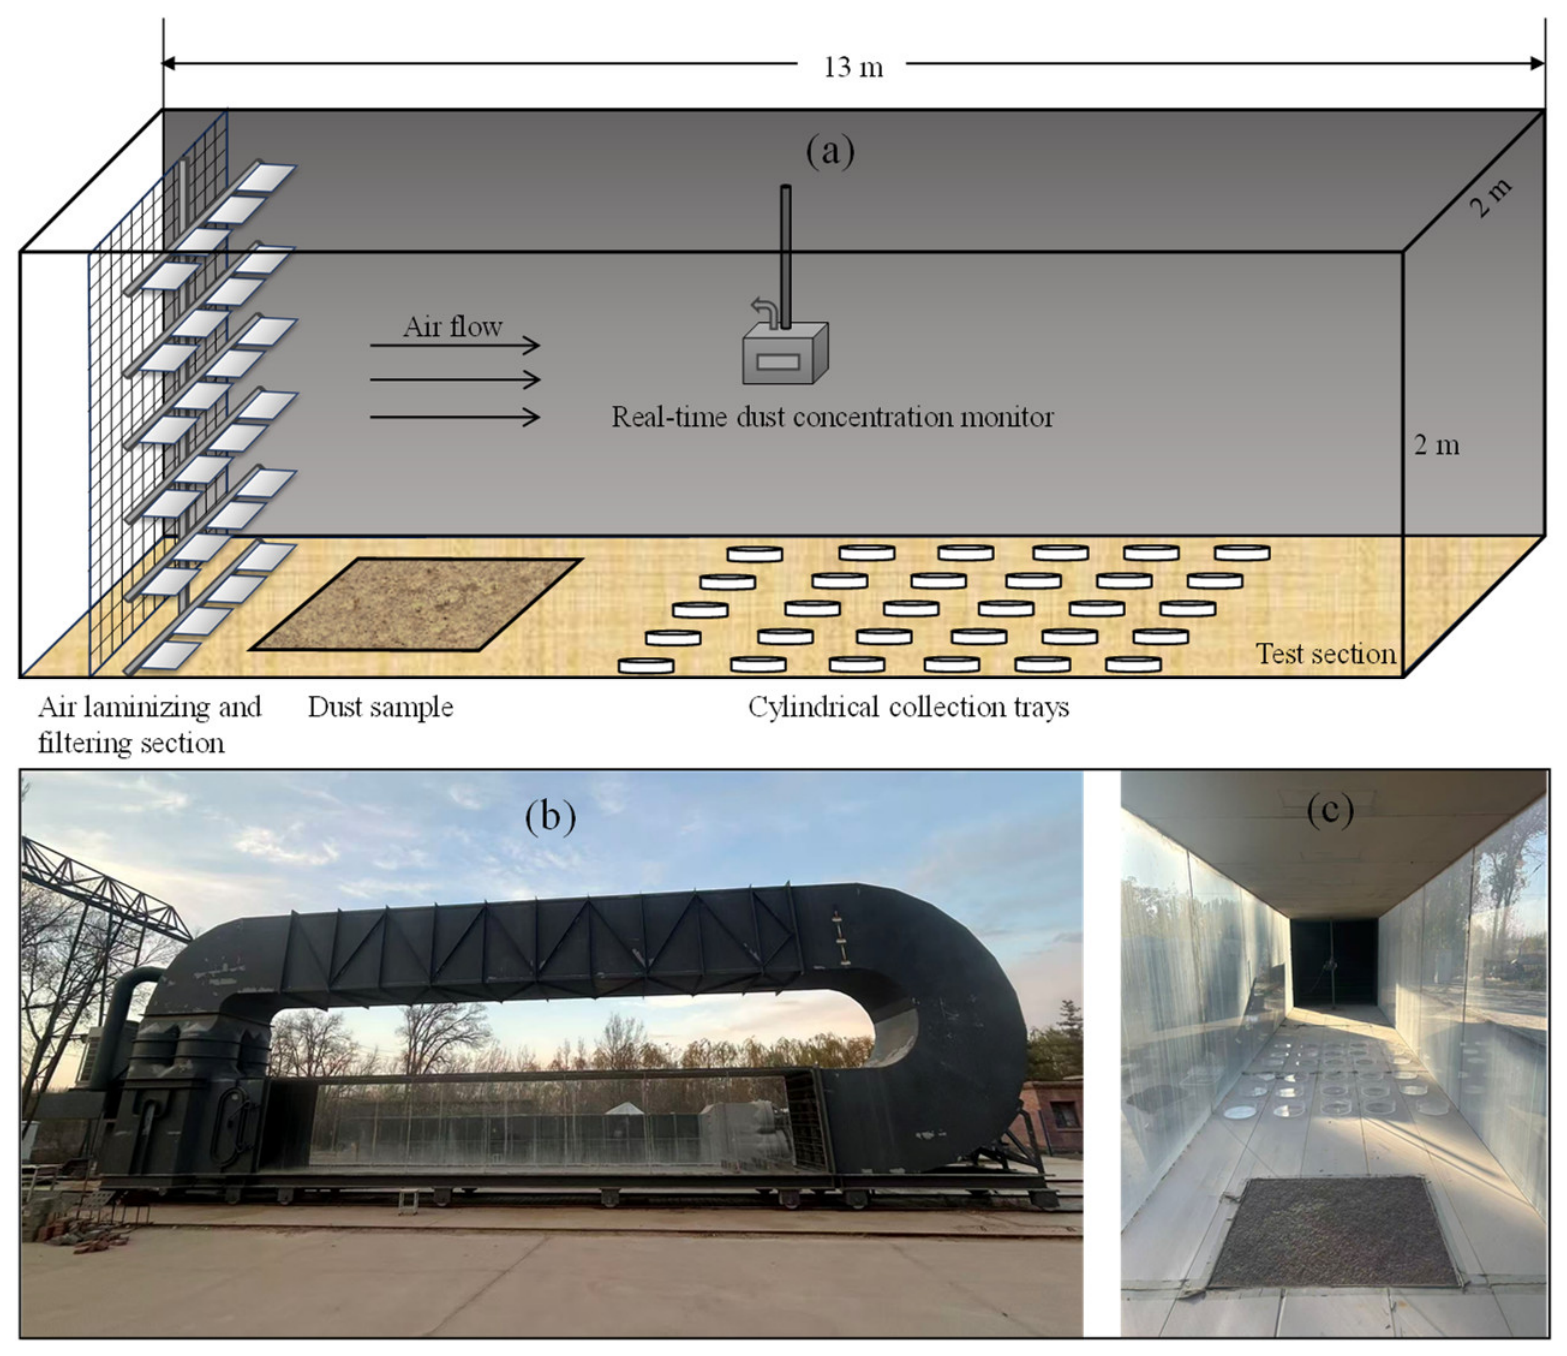
The experiments were conducted in a vertical recirculating wind tunnel at the Desert Forest Experimental Center of the Chinese Academy of Forestry in Dengkou, Inner Mongolia (Figure 2a). This wind tunnel is a closed-circuit system modified from a conventional open-circuit tunnel and is suitable for observations of particle release, transport, and deposition over relatively long durations. The wind tunnel has a total length of 26 m, with a 13 m long test section and a cross-section of 2.0 m × 2.0 m. Airflow is driven by four axial fans installed downstream of the test section, and the mean wind speed can be continuously adjusted from 0 to 20 m s−1. An expansion section, guide vanes, and a settling chamber equipped with a honeycomb and flow-straightening screens are installed upstream of the test section to condition the airflow, producing a more uniform incoming flow with lower turbulence intensity and fewer vortices [27]. These wind tunnel parameters and sampler details were reported to improve the reproducibility and comparability of the experiment [28].
Figure 2.
Wind tunnel apparatus and experimental layout. (a) Schematic of the wind tunnel test section and experimental layout; (b) external view of the vertical recirculating wind tunnel; (c) internal view of the test section and cylindrical collection trays.
Before the wind erosion experiments, the wind field in the test section was characterized using hot-wire anemometers (VelociCalc 9515, TSI Inc., Shoreview, MN, USA). Vertical wind-speed profiles were measured at 2, 5, 10, 20, 40, 80, 120, and 160 cm above the tunnel floor along the central part of the test section. Preliminary wind-field measurements showed that wind speed increased rapidly near the surface and became relatively stable above approximately 40 cm, indicating that the main boundary-layer development occurred within the lower part of the test section. The nominal wind-speed levels used in this study, 8.0, 9.5, 11.0, 12.5, and 14.0 m s−1, were monitored in the central flow region of the test section. These levels covered moderate to strong wind conditions above the threshold for dust emission.
Before each run, the soil samples were air-dried indoors, and plant residues, visible stones, and other coarse debris were removed. The samples were then passed through a 5 mm sieve before use. This treatment was applied to reduce interference from large debris during soil loading and wind erosion, while preserving the original dry aggregate characteristics as much as possible [29,30]. In each run, the soil was evenly spread and leveled in a rectangular soil tray positioned in the floor recess of the test section. The tray surface measured 80 cm × 100 cm, and the soil layer was 3 cm thick. The soil surface was kept flush with the wind tunnel floor to avoid artificial flow disturbance at the leading edge.
Once the target wind speed was reached, particle release and transport were recorded. At the same time, the concentration of suspended particulate matter in the wind tunnel and the vertical distribution of transported mass at multiple heights were monitored. The layout inside the wind tunnel is shown in Figure 2c. The wind-blowing phase lasted 10 min for each run.
Transported particles were collected using a custom multi-height passive sampling frame installed downwind of the soil tray. At each sampling height, five cylindrical borosilicate-glass collection vessels of identical size were used as parallel replicates. Each cylinder was 10 cm in diameter and 3.5 cm in height, and 35 mL of deionized water was added before each run to trap transported particles and prevent re-entrainment. Transported particles were collected within the 5–125 cm layer above the surface at seven sampling heights. After collection, the samples were dried at 80 °C for 12 h and weighed using an analytical balance with an accuracy of 0.0001 g. The collected material was subsequently used to calculate transport mass and vertical transport indicators.
2.3. Soil-Property Measurements
To characterize intrinsic differences among the seven farmland soils and to provide a common basis for subsequent comparisons of release and transport processes, particle-size composition, characteristic particle-size parameters, dry aggregate-size distribution, and organic matter content were measured for each soil. Six variables were selected for PCA: silt content (2–50 μm), median particle size (d50, μm), mass fraction of aggregates > 2 mm, 0.25–1 mm, and <0.063 mm, and soil organic matter content (g kg−1). These variables were chosen to represent three soil-property dimensions relevant to wind erosion response: primary particle-size background, dry aggregate-size composition, and organic-matter-related aggregate cohesion. Sand content was not included separately because it was strongly complementary to the fine-particle fraction and d50. Clay content was also not included because the laser-derived clay-sized fraction was below the reporting resolution and showed no effective variation among samples.
Particle-size composition was measured using an EyeTech particle size and shape analyzer (Ankersmid B.V., Nijverdal, The Netherlands), with three analytical replicates for each soil. Clay, silt, and sand fractions were calculated from the cumulative particle-size distribution using the <2 μm, 2–50 μm, and >50 μm boundaries, respectively. Dry aggregate-size distribution was determined by manual dry sieving using a stacked set of standard flat soil sieves with aperture sizes of 2 mm, 1 mm, 0.25 mm, and 0.063 mm. For each soil, three replicate 100 g air-dried subsamples were independently sieved for 10 min. All sieving procedures were performed by the same operator using the same sieve set, sieving duration, and operator-controlled shaking procedure to reduce methodological variation and artificial aggregate breakage. After sieving, the material retained on each sieve and the material passing through the 0.063 mm sieve were weighed separately. The dry aggregate-size classes were defined as >2 mm, 1–2 mm, 0.25–1 mm, 0.063–0.25 mm, and <0.063 mm, and their mass fractions were calculated as percentages of the initial dry sample mass. Soil organic matter (SOM) was determined using the potassium dichromate oxidation external-heating method and expressed as g kg−1.
These six measured soil-property variables were used for PCA and subsequent k-means grouping, as described in Section 2.5. Wind tunnel response variables, such as emission intensity, total transport input, and deposition indicators, were not included in the PCA to avoid circularity between soil grouping and subsequent process comparisons.
2.4. Indicator Framework for Release, Transport, and Deposition
To compare differences among farmland soils during strong wind erosion and the subsequent static-settling stage after wind cessation, an indicator framework was established for the release, transport, and deposition stages. Except for the comparison of total transport under the full wind-speed gradient, all stage-specific indicators were calculated under the 14 m s−1 condition to ensure comparability across stages.
2.4.1. Release Indicator
The mean suspended particulate mass concentration measured at the monitoring point during the steady stage under the 14 m s−1 wind condition was defined as the steady-state emission intensity, Cstable (mg m−3). This indicator was used to characterize the ability of a soil to continuously supply suspended particles to the wind tunnel airspace under strong wind conditions.
Here, Tstable denotes the steady-state period, Ct is the suspended particulate mass concentration at each observation time within the steady-state period, and n is the number of observations collected during that period.
2.4.2. Vertical Transport Indicators
Multi-height sampling was conducted at the downwind side to obtain transport profiles over the 5–125 cm layer above the surface (seven sampling heights in total). On this basis, two groups of indicators were constructed: transport-input indicators and vertical structural indicators. The former were used to compare the magnitude of particles entering the transport layer among soils, whereas the latter were used to characterize how particles were partitioned and sorted within the transport layer.
- (1)
- Total transport input Lin
Total transport input, Lin (g m−2 10 min−1), represents the total particle input into the 5–125 cm transport layer and was used to compare the transport-input level among soils. Based on the multi-height sampling data, four additional indicators were calculated to characterize differences in transport structure: the lower-layer transport fraction (flow), the upper-layer transport fraction (ftop), the median transport height (z50), and the vertical particle-size sorting slope (bd50,z).
Here, L(z) is the transport mass density at height z, and Δzi is the discrete layer thickness associated with adjacent sampling heights.
- (2)
- Lower-layer transport fraction, flow
The lower-layer transport fraction, flow, is defined as the proportion of transport mass in the 5–25 cm layer relative to the total transport mass in the 5–125 cm layer. It was used to reflect the degree to which transported particles were concentrated near the surface. A higher flow indicates a stronger concentration of transported material in the lower layer.
- (3)
- Upper-layer transport fraction, ftop
The upper-layer transport fraction, ftop, is defined as the proportion of transport mass in the 85–125 cm layer relative to the total transport mass in the 5–125 cm layer. It was used to reflect the relative extent to which particles entered the upper part of the transport layer.
- (4)
- Median transport height, z50
z50 (cm) is defined as the height at which the cumulative transport mass reaches 50% of the total transport mass. It was determined by linear interpolation between the two adjacent sampling heights spanning the 50% threshold and was used to characterize the relative vertical center of mass of transported material.
- (5)
- Vertical particle-size sorting slope, bd50,z
The vertical particle-size sorting slope, bd50,z (μm cm−1), was calculated by linear regression between the median particle size of transported material at different heights, d50(z), and height z. A more negative bd50,z indicates a stronger decrease in median particle size with height and thus stronger vertical particle-size sorting.
2.4.3. Deposition Indicators
To quantify the dust deposition process of different farmland soils under static conditions after wind cessation, suspended dust generated after 10 min of strong wind erosion at 14 m s−1 was used as the source material. Deposition mass and particle-size parameters were analyzed at six settling times: 0.5, 1, 1.5, 2, 3, and 4 h. Based on these data, the following indicators were constructed.
- (1)
- Static-settling kinetic indicators
A single-exponential saturation model was used to describe the change in cumulative deposited mass, M(t), with time t. The model parameters included the asymptotic cumulative deposition amount, a∞ (mg cm−2), the rate constant, k (h−1), the time constant, τ (h), and the initial deposition rate, J0 (mg cm−2 h−1).
Here, R2 was used to evaluate model fit.
- (2)
- Early deposition load and temporal partitioning indicators
The cumulative deposited mass at 0.5 h, a0.5 (mg cm−2), was defined as the early deposition load, and the cumulative deposited mass at 4 h, M4 (mg cm−2), was taken as the cumulative deposition within the static observation window. The ratio M0.5/M4 was used to characterize the fraction of deposition completed during the initial stage, whereas 1 − M0.5/M4 was used to characterize the fraction associated with continued deposition during the later stage.
A larger M0.5/M4 indicates that a greater proportion of deposition was completed within the first 0.5 h. A larger 1 − M0.5/M4 indicates a more pronounced contribution from continued deposition at later times.
- (3)
- Local capture efficiency and continued-export indicators
Local capture efficiency, ϕlocal, represents the proportion of particles entering the transport layer that were retained locally under static-settling conditions. It was calculated by first converting a∞ from mg cm−2 to the same areal unit as Lin, and then taking the ratio of the converted a∞ to Lin.
Here, a∞∗ denotes the asymptotic cumulative deposition amount converted to g m−2.
The median particle size of transported particles aloft, d50,aloft, was further defined as the mean d50 of transported particles across the sampling heights within the 85–125 cm layer. Based on ftop, d50,aloft, and ϕlocal, a long-range transport tendency index LRPtendency and a long-range export index LRPflux were constructed. LRPtendency reflects the relative tendency for long-range transport, whereas LRPflux integrates the intensity of continued export under a given wind condition.
2.5. Data Processing and Statistical Analysis
All statistical analyses and figure preparation were performed in R software (version 4.4.1; R Core Team, Vienna, Austria) using packages including dplyr, tidyr, ggplot2, purrr, and janitor. Before principal component analysis (PCA), all soil-property variables were standardized using Z scores. Particle–aggregate groups were identified using PCA followed by k-means clustering and were used as an independent soil-property framework for subsequent comparisons.
Differences in total transport input among soils at each wind-speed level were tested using the Kruskal–Wallis test because the data were not assumed to meet normality and homogeneity of variance requirements. When the overall test was significant, pairwise comparisons among soils were conducted using Dunn’s post hoc test with Holm adjustment. Different lowercase letters in the figures indicate significant differences among soils at the same wind-speed level at p < 0.05.
The deposition kinetic parameters a∞, k, τ, and J0 were obtained by nonlinear least-squares fitting using nls. To ensure comparability among soils, all cumulative deposition curves were parameterized using the same single-exponential saturation model. For a few samples with relatively poor fit, more complex models were tested for comparison. However, because the number of time points was limited, parameter identifiability was insufficient, and information criteria did not indicate clear improvement, the single-exponential model was retained. The fitted kinetic parameters are reported as auxiliary information in Supplementary Table S2.
Relationships among stage-specific indicators were tested using Spearman rank correlation analysis, including the relationships of Cstable with Lin and a0.5, as well as that of d50,aloft with ϕlocal. Statistical significance was set at p < 0.05.
3. Results
3.1. Particle–Aggregate Grouping of Farmland Soils and Their Main Characteristics
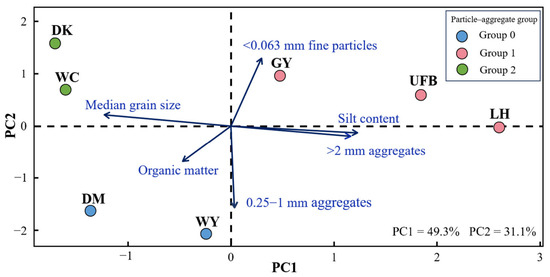
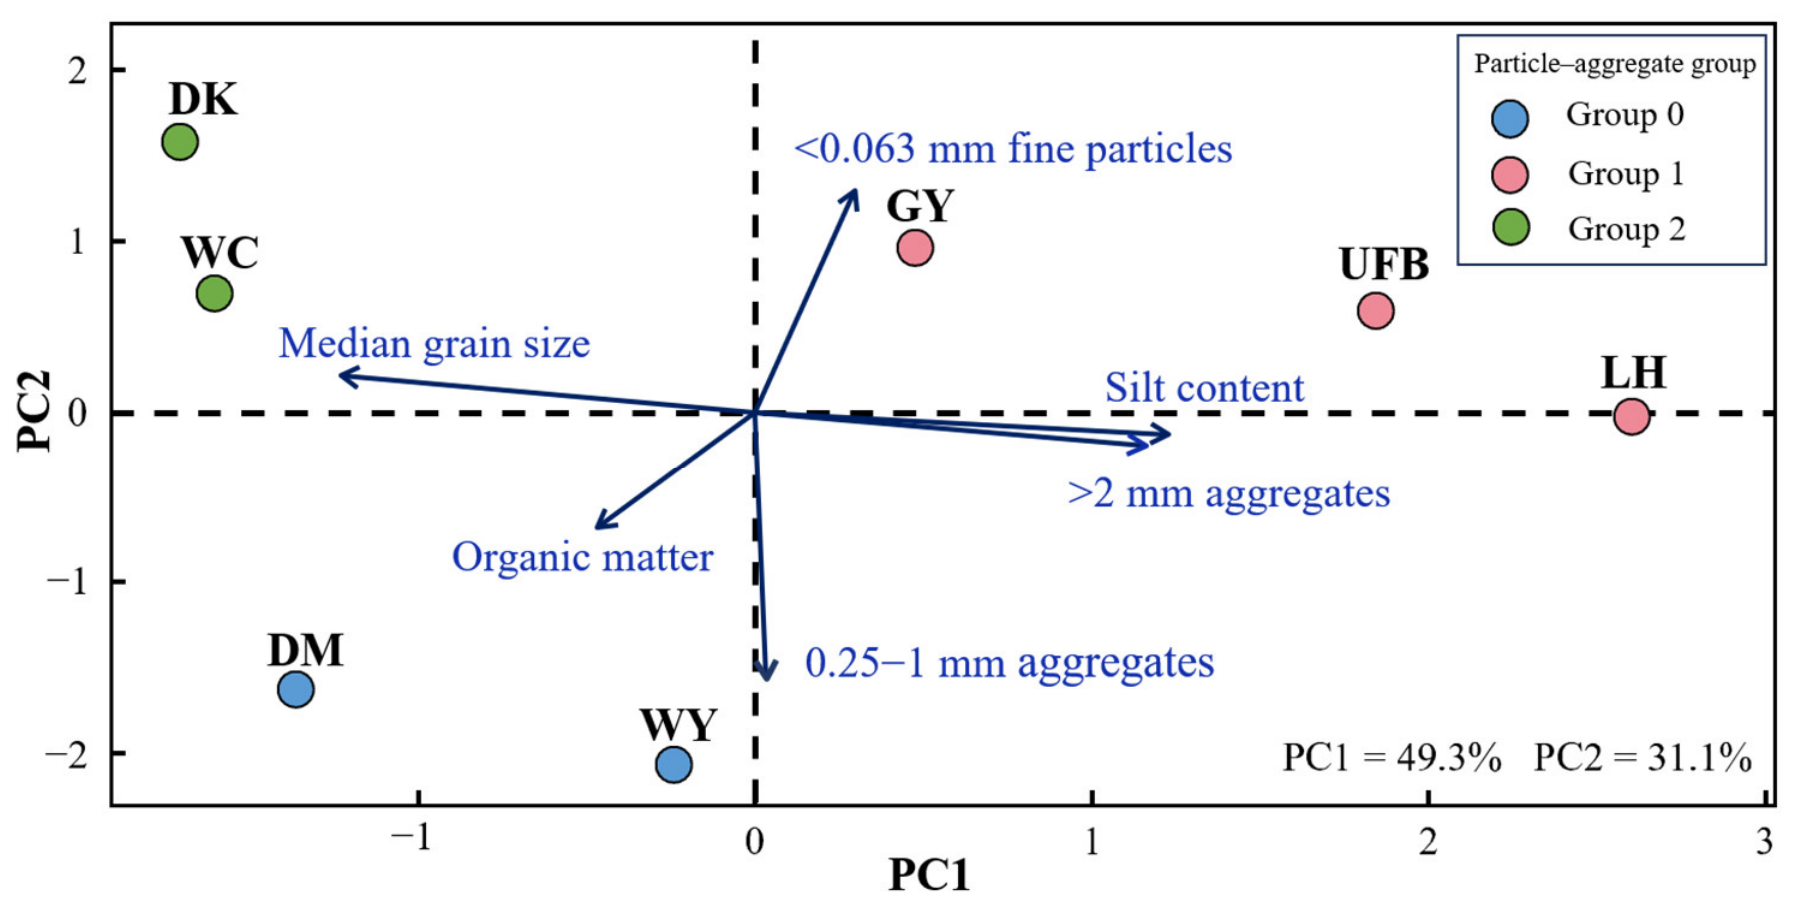
Using the six selected soil-property variables, PCA summarized the main particle–aggregate differences among the seven farmland soils. The first two principal components together explained 80.4% of the variation in measured particle–aggregate properties among soils, with PC1 and PC2 accounting for 49.3% and 31.1%, respectively (Figure 3). PC1 mainly represented a gradient in texture coarseness and the development of large aggregates, whereas PC2 primarily reflected differences in medium-sized aggregates, fine-particle fractions, and organic matter content. These results indicate that the farmland soils in the study area were already clearly differentiated in texture, aggregate composition, and fine-particle background, and that this differentiation was well captured by the first two principal components.
Figure 3.
Principal component analysis of measured particle-size and aggregate properties and the resulting particle–aggregate groups.
Based on clustering of the PC1–PC2 scores, the seven soils were grouped into three particle–aggregate groups, denoted Group 0, Group 1, and Group 2. Group 0 included DM and WY and was characterized by a relatively high proportion of medium-sized aggregates, a low fine-particle fraction, and relatively high organic matter content. Group 1 included GY, LH, and UFB and was characterized by relatively high silt content, smaller d50, and relatively abundant large aggregates and fine particles. Group 2 included DK and WC and was characterized by coarser texture, lower silt content, a lower proportion of 0.25–1 mm aggregates, and a relatively high proportion of particles < 0.063 mm. This particle–aggregate grouping served as the common basis for subsequent comparisons of emission intensity, near-surface transport organization, and post-wind deposition divergence. In other words, the different dust-process pathways discussed below were not compared among undifferentiated soil samples, but among three identifiable particle–aggregate groups.
3.2. Divergence in Emission Intensity and Transport-Input Level Under Strong Winds
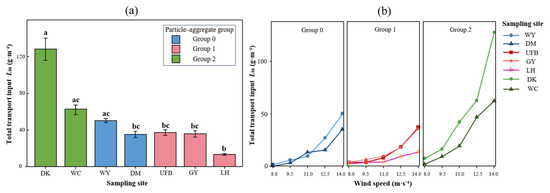
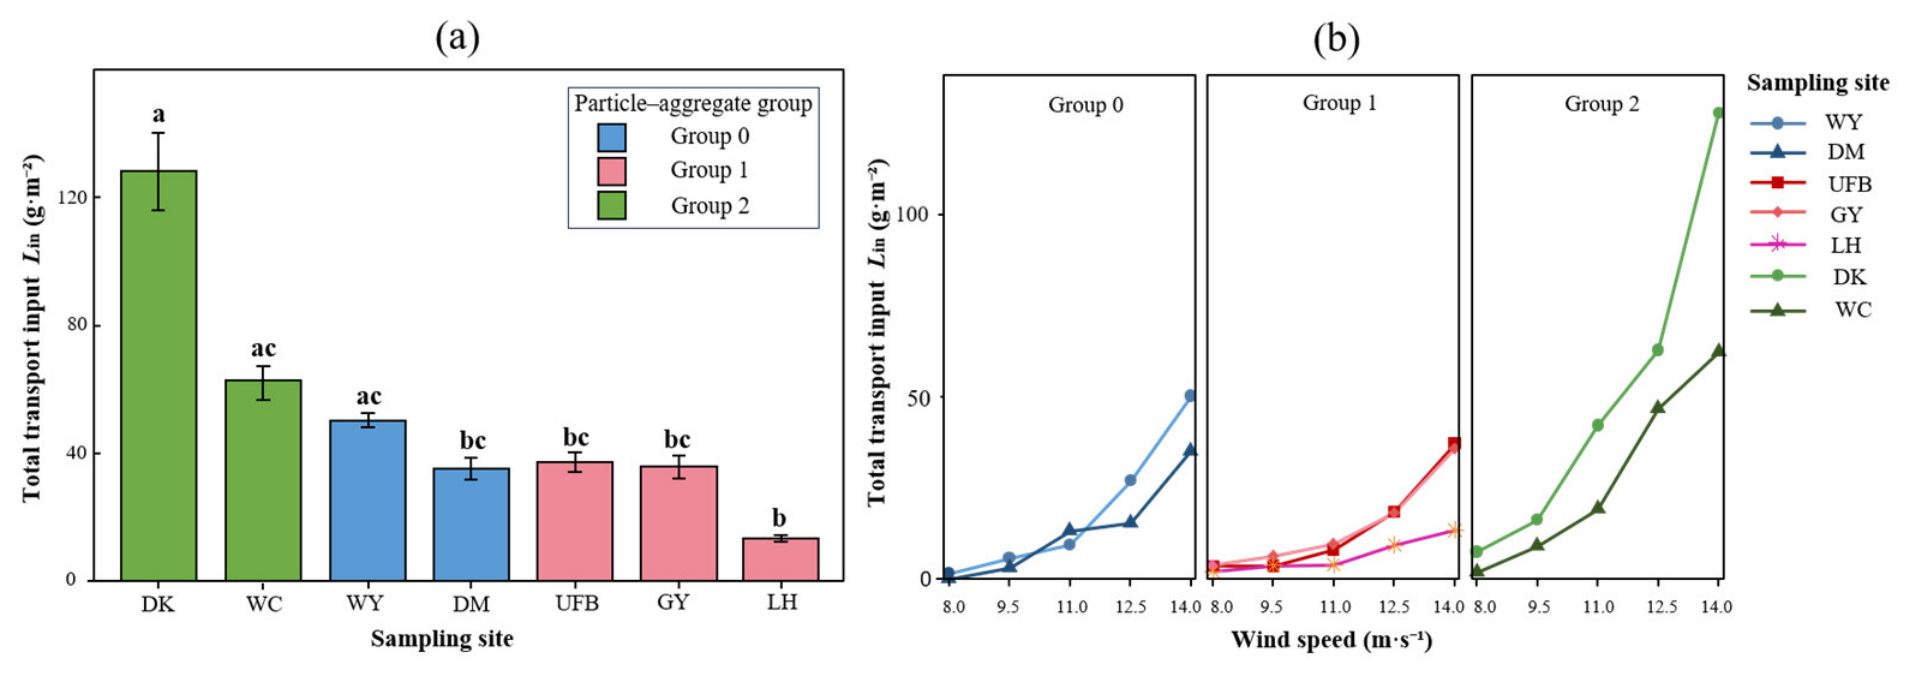
At wind speeds of 8.0, 9.5, 11.0, 12.5, and 14.0 m s−1, total transport input (Lin) increased with wind speed for all soils, but the magnitude of increase differed among soils (Figure 4). Under lower wind speeds, total transport input remained relatively low and differences among soils were limited. As wind speed increased to 11.0–14.0 m s−1, the response curves became progressively more separated. DK showed the largest increase, followed by WC and WY, whereas LH remained at a relatively low level across all wind speeds. Kruskal–Wallis tests showed significant differences among soils at all wind speeds. The H values were 19.049, 21.863, 30.305, 32.133, and 29.124 at 8.0, 9.5, 11.0, 12.5, and 14.0 m s−1, respectively. At 8.0 m s−1, the analysis was based on six soils because the DM soil did not emit dust (df = 5); at the other wind speeds, all seven soils were included (df = 6). All p values were ≤0.0019 (Table 2). These results indicate that increasing wind speed not only enhanced overall transport output, but also amplified transport divergence among soils.
Figure 4.
Inter-soil differences in total transport input and their responses to wind speed among farmland soils. (a) Total transport input among soils under 14.0 m s−1. (b) Changes in total transport input with increasing wind speed. Error bars indicate SE. Different lowercase letters in panel (a) indicate significant differences among soils based on Dunn’s post hoc test with Holm adjustment after a significant Kruskal–Wallis test (p < 0.05).
Table 2.
Kruskal–Wallis test results for differences in total transport input among seven farmland soils at different wind speeds.
To maintain consistency with the subsequent analyses of near-surface transport structure and post-wind static deposition, differences in release and transport input were further compared under a unified strong-wind condition of 14.0 m s−1. Under this condition, the steady-state emission intensity (Cstable) of the seven soils ranged from 27.78 to 76.39 mg m−3 (Table S1), with a 2.75-fold difference between the maximum and minimum values, indicating marked differences in sustained dust release among soils. Total transport input in the 5–125 cm transport layer ranged from 14.52 to 135.32 g m−2 10 min−1, with a 9.32-fold difference between the maximum and minimum values (Figure 4a; Table S1). DK showed the highest values for both indicators, followed by WC and WY. UFB, GY, and DM were intermediate, whereas LH was consistently the lowest. Dunn’s multiple comparisons further showed significant differences between LH and DK, WC, and WY, and also between DK and DM, GY, and UFB (Figure 4a).
3.3. Inter-Soil Differences in Near-Surface Vertical Transport Structure
Under the 14 m s−1 condition, transport differed among soils not only in total input, but also in vertical partitioning structure (Table 3). Using the upper-layer transport fraction (ftop), lower-layer transport fraction (flow), median transport height (z50), and vertical particle-size sorting slope (bd50,z) to characterize transport structure, the seven soils could be broadly grouped into three patterns. One pattern, represented by WY, was characterized by a relatively large contribution from the upper layer and a relatively high transport center. A second pattern, represented by GY, showed stronger lower-layer concentration and a lower transport center. A third pattern, represented by DK, showed the strongest vertical particle-size sorting. The remaining soils generally fell between these end members.
Table 3.
Near-surface vertical transport structure indicators of different farmland soils at 14 m s−1.
From the perspective of vertical mass partitioning, WY had the highest upper-layer transport fraction and the highest median transport height, with ftop and z50 reaching 0.412 and 51.1 cm, respectively. This indicates that a relatively large proportion of transported particles entered the upper part of the transport layer. GY showed the opposite pattern, with the lowest ftop (0.371) and the lowest z50 (41.3 cm), indicating stronger concentration in the lower layer. The z50 values of DM, LH, WC, UFB, and DK were all clustered within 47.0–48.1 cm, but their ftop values differed, indicating that soils with a similar transport center can still differ in their contribution to upper-layer transport.
All seven soils had negative bd50,z values, ranging from −0.16 to −0.86 μm cm−1, indicating a common tendency for particle size to decrease with height. However, the strength of sorting differed among soils. DK had the largest ∣bd50,z∣, indicating the strongest decrease in particle size with height and thus the most pronounced vertical sorting. UFB ranked second. DM had the weakest sorting, indicating relatively small particle-size differences among heights. The divergence in near-surface transport therefore involved not only how high particles were carried, but also how strongly particle sizes were reorganized across the vertical profile.
Notably, although DK had the highest Lin, its z50 was not the highest. In contrast, LH had the lowest total transport input, but its z50 was still close to that of some soils with intermediate transport input. In other words, Lin reflects the magnitude of transport input, whereas z50, ftop, and bd50,z describe how particles were redistributed and sorted after entering the transport layer. These two types of information did not vary synchronously among soils.
The divergence in near-surface transport was related to the particle–aggregate grouping of the soils, but the relationship was not one-to-one. Group 0 showed the strongest internal contrast: WY was characterized by high upper-layer transport and a high transport center, whereas DM showed intermediate transport height and weak sorting. Group 1 ranged from the lower-layer concentrated pattern of GY to the intermediate-height but relatively strongly sorted pattern of UFB. Within Group 2, DK showed the strongest vertical particle-size sorting observed in this study, whereas WC was more intermediate. Overall, the effect of differences in measured particle–aggregate properties on near-surface transport was expressed not only through differences in transport magnitude, but also through differences in how particles were partitioned and sorted within the transport layer.
Under a unified strong-wind condition, different farmland soils did not produce the same near-surface transport pattern. Rather than interpreting soil differences only by total transport input, it is more appropriate to distinguish between differences in transport magnitude and differences in transport structure. The former reflects how much material entered the transport layer, whereas the latter reflects how particles were organized and partitioned once they entered it.
3.4. Temporal Patterns of Static Deposition Among Different Farmland Soils
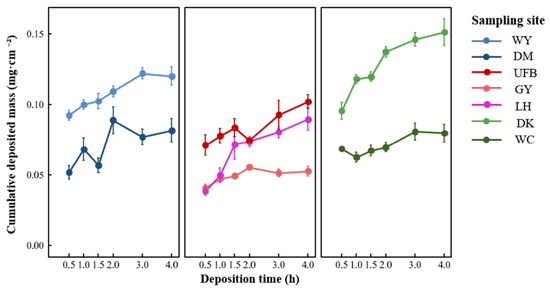
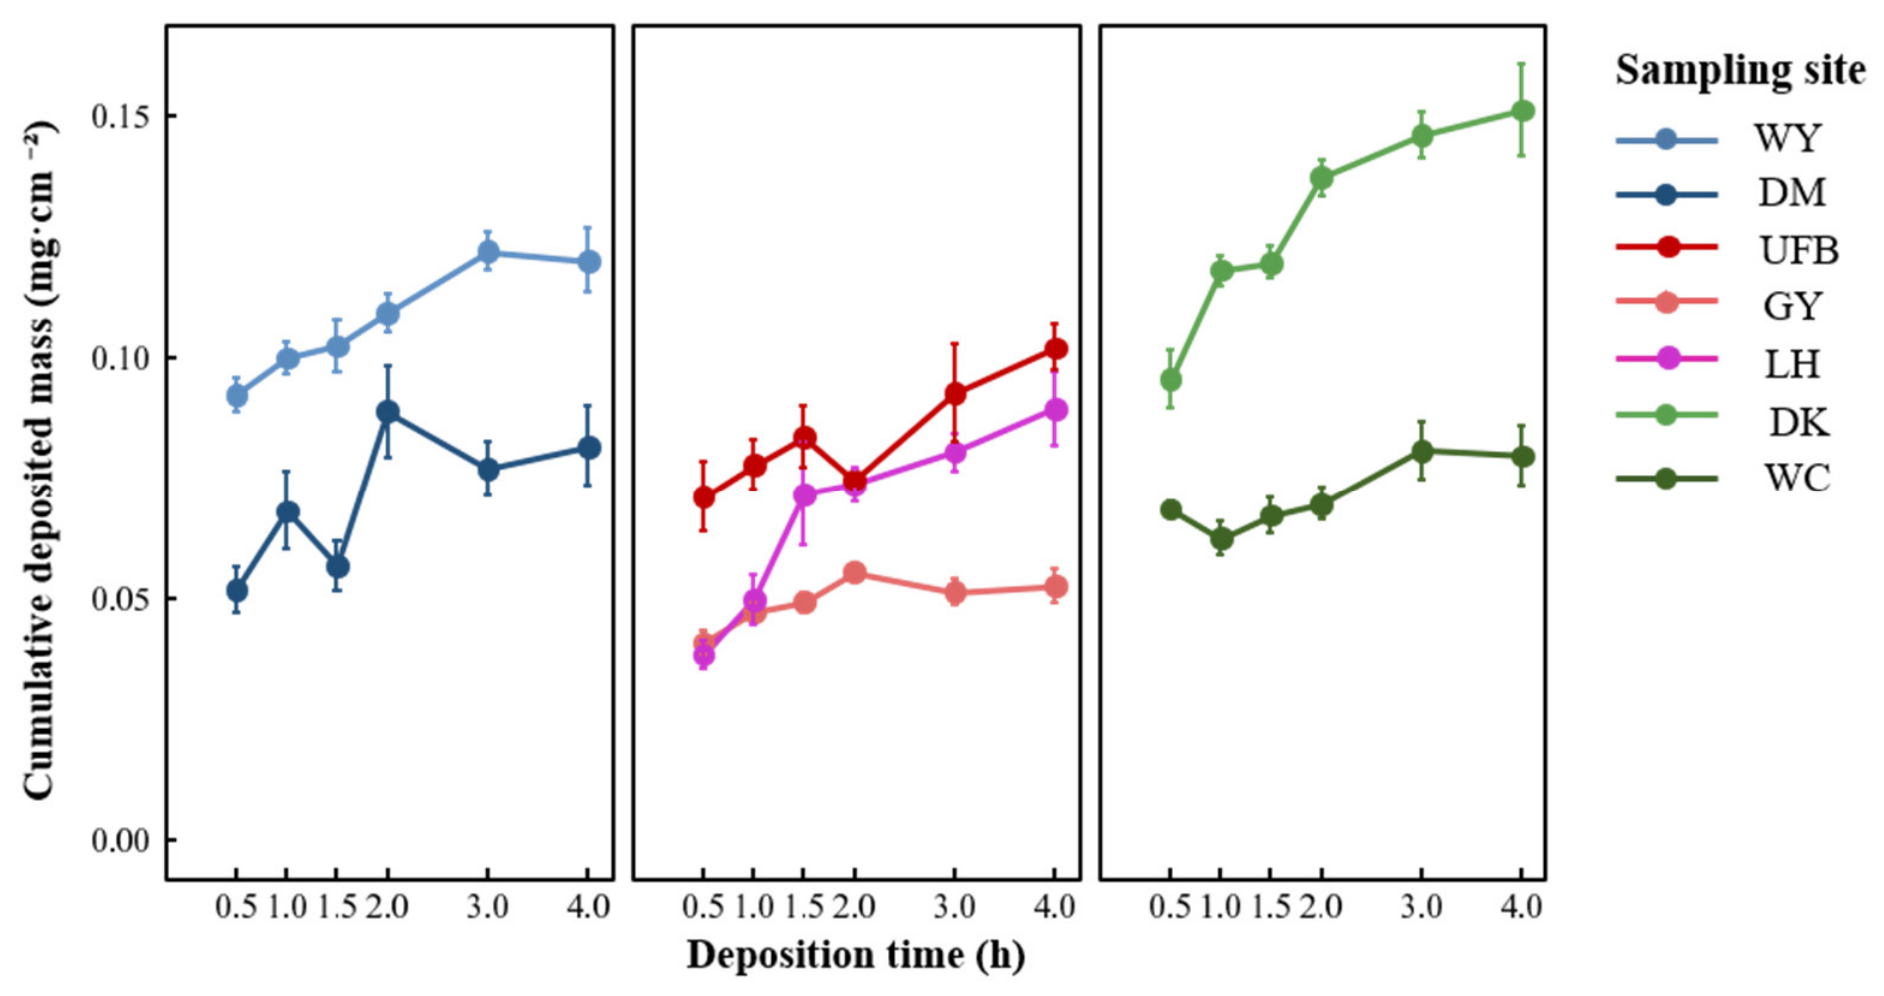
After 10 min of strong wind erosion at 14 m s−1, airflow was stopped and the static deposition of suspended dust from the seven farmland soils was continuously monitored. The results showed that cumulative deposited mass increased with settling time for all soils, but the temporal trajectories differed among soils (Figure 5).
Figure 5.
Temporal variation in cumulative deposited mass during static deposition among different farmland soils.
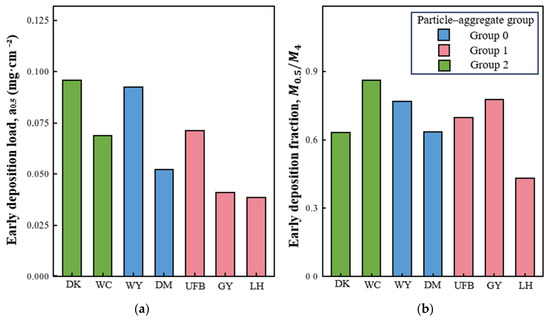
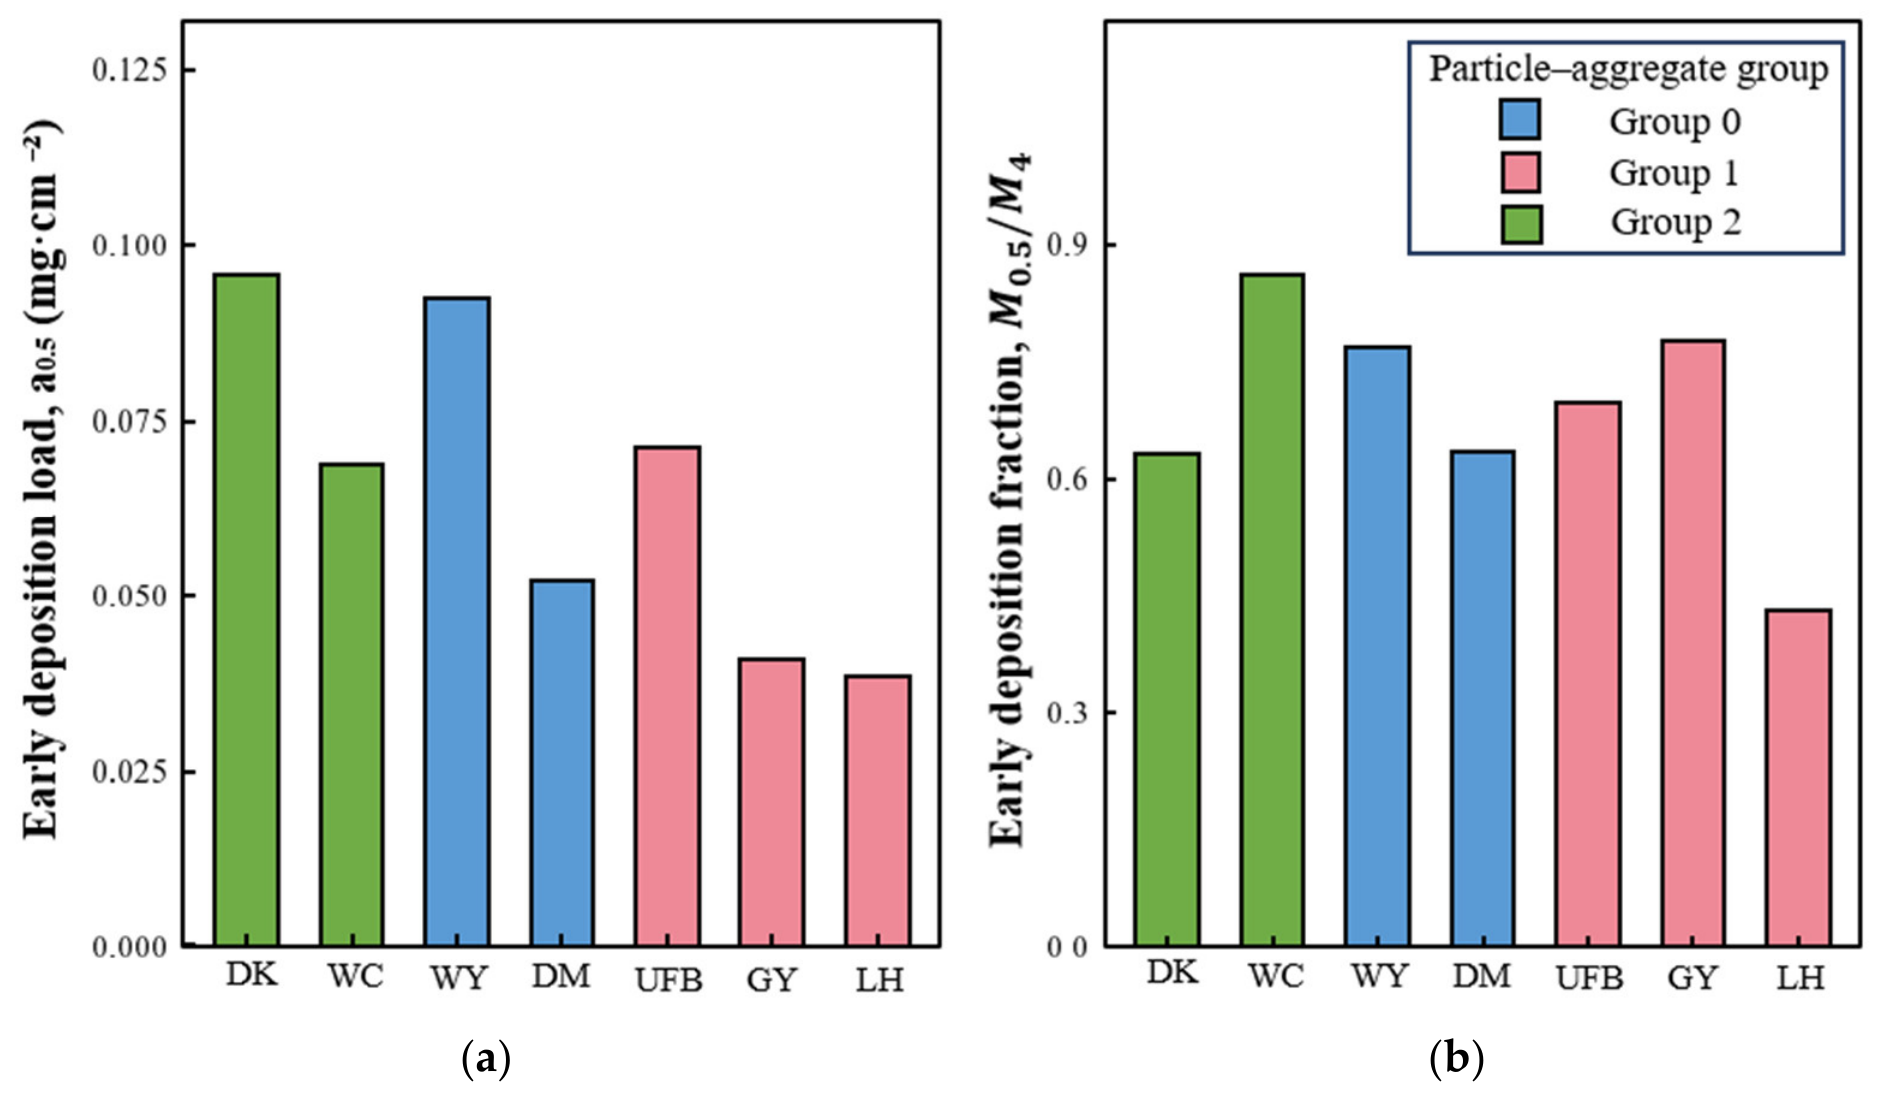
However, the raw cumulative curves simultaneously reflect both total deposited mass and temporal partitioning, and the curve shape alone is therefore insufficient for direct classification of deposition patterns. To separate the effect of total amount, the early deposition fraction, M0.5/M4, was further used to characterize the degree to which deposition was concentrated in the initial stage after wind cessation. The values of M0.5/M4 were 0.829, 0.769, and 0.739 for WC, GY, and WY, respectively, indicating that a large proportion of cumulative deposition occurred within the first 0.5 h; these soils were therefore interpreted as showing an early-concentrated deposition pattern. LH had the lowest value, 0.430, indicating a stronger contribution of continued accumulation during the later stage; it was therefore interpreted as showing a sustained-accumulation pattern. DK, DM, and UFB had intermediate values of 0.633, 0.636, and 0.698, respectively, and were interpreted as transitional. These results indicate that the main differences among farmland soils during the post-wind deposition stage were not limited to differences in final deposition amount, but also involved differences in how deposition was distributed over time.
Further comparison with Figure 6 shows that a high early deposited mass, a0.5, did not necessarily correspond to a high early deposition fraction. DK and WY had the highest a0.5 values, reaching 0.0613 and 0.0592 mg cm−2, respectively, but neither showed the highest M0.5/M4. In contrast, WC did not have the highest a0.5, yet it showed the highest M0.5/M4.
Figure 6.
Differences in early deposition load and early deposition fraction during static deposition among different farmland soils. (a) Early deposition load, a0.5, defined as the cumulative deposited mass at 0.5 h after wind cessation. (b) Early deposition fraction, M0.5/M4, defined as the ratio of cumulative deposition at 0.5 h to that at 4 h. These indicators were used for descriptive comparison of deposition timing. Pairwise significance letters were not added because a0.5 and M0.5/M4 were derived from the observed deposition time series for each soil and were used here as process indicators rather than replicate-based group-comparison variables.
The single-exponential fitting results provided auxiliary information for interpreting deposition timing, but they were not used as the main basis for classifying deposition patterns. Because model fit varied among soils, the fitted kinetic parameters are reported in Supplementary Table S2. In the main text, deposition timing was interpreted primarily using the directly observed indicators a0.5 and M0.5/M4 shown in Figure 6. For example, the fitted time constant τ was smallest for WC and largest for LH, consistent with their early-concentrated and sustained-accumulation tendencies, respectively.
Overall, static deposition of wind-eroded particles was not a uniform single-stage process. Under the same settling conditions, different farmland soils differed both in the contribution of early deposition and in the capacity for continued accumulation during later stages. In general, WC, GY, and WY were characterized by a relatively high contribution from early deposition, LH showed a more pronounced tendency toward continued accumulation, and DK, DM, and UFB occupied intermediate positions.
3.5. Particle-Size Evolution During Static Deposition and Divergence in Local Retention Versus Long-Range Export
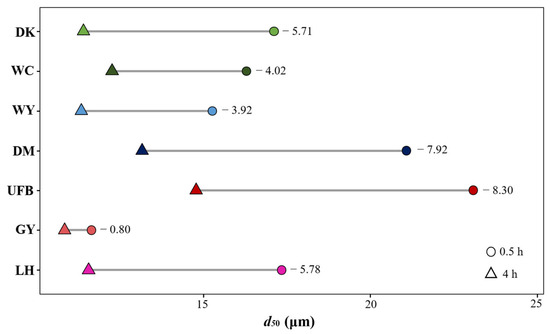
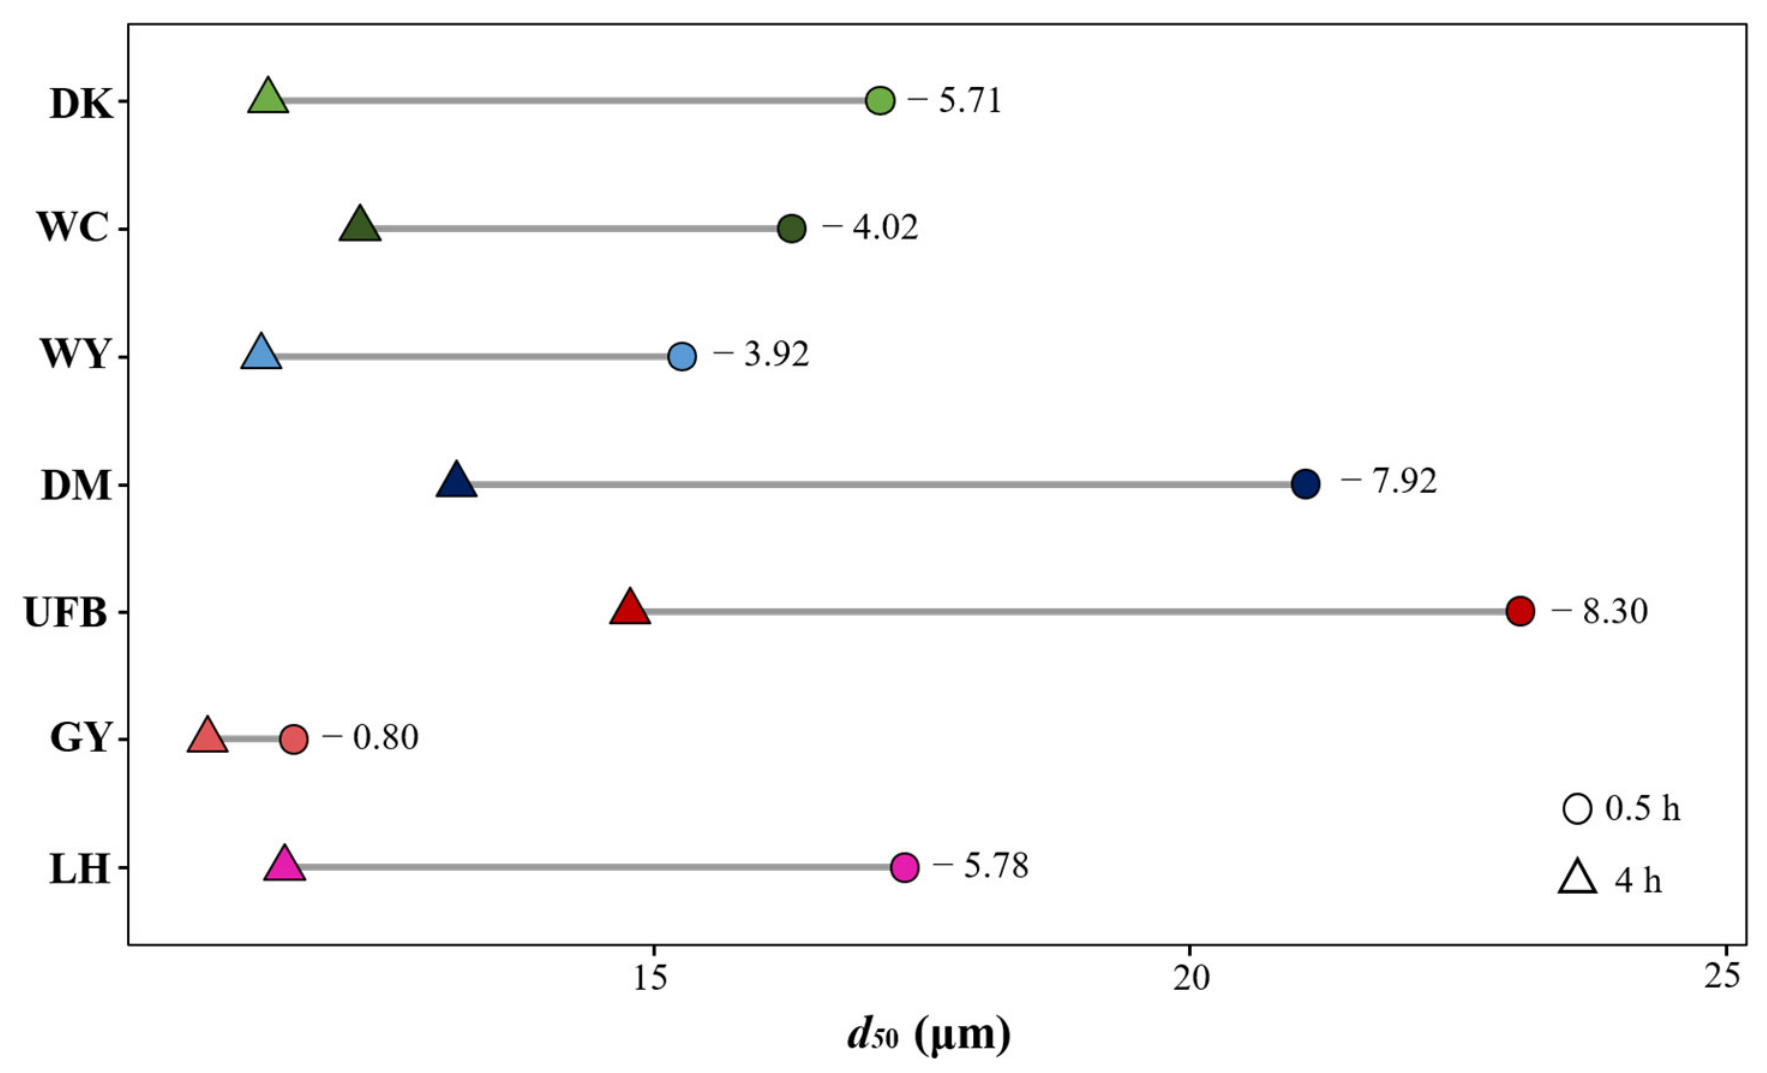
Based on the different temporal patterns of deposition, two time points, 0.5 h and 4 h after wind cessation, were selected to compare deposited-particle characteristics between the early and late stages of the observation period. The median particle size of deposited material decreased in all seven farmland soils, with Δd50 ranging from −0.80 to −8.30 μm. The largest declines occurred in UFB and DM, whereas the smallest decline occurred in GY. This indicates that, relative to the cumulative deposition sample at 0.5 h, the cumulative deposition sample at 4 h shifted consistently toward finer particles.
The local-retention and continued-export indicators derived from the deposition and transport measurements are summarized in Table 4. The common decline in d50 indicates that deposited material generally shifted toward finer particles during the static deposition stage, but this shared pattern was not the main basis for distinguishing final deposition outcomes among soils. Clearer differences were observed in local capture efficiency and continued-export potential. LH had the highest local capture efficiency, ϕlocal, and the lowest long-range export index, LRPflux, indicating a local-retention-dominated pattern. In contrast, DK and WY showed relatively low ϕlocal but high LRPflux, indicating relatively high continued-export potential. WC and GY showed early deposition fractions within the first 0.5 h, indicating pronounced early-concentrated deposition; however, their ϕlocal and LRPflux values remained low to intermediate, suggesting rapid early deposition without particularly high absolute export capacity. DM and UFB occupied intermediate positions and did not show a single strongly dominant deposition outcome. The ranking of the long-range transport tendency index, LRPtendency, was broadly consistent with this overall pattern and can be used as a supplementary indicator of relative outward transport tendency.
Table 4.
Local-retention and continued-export indicators of wind-eroded dust from the seven farmland soils.
These results indicate that the post-wind deposition stage is not simply a passive end point of the transport process. Different farmland soils first diverged in how deposition was distributed over time, and then diverged further in the balance between local retention and continued export. In other words, even after the same strong wind event, wind-eroded particles from different soils did not converge on a single final outcome after entering the deposition stage. Some were more readily retained locally, some maintained a stronger export potential, and others fell between these two end members. The corresponding particle-size changes during static deposition are shown in Figure 7.
Figure 7.
Particle-size evolution during static deposition among different farmland soils.
3.6. Relationships Among the Release, Transport, and Deposition Stages
To further compare process linkages among farmland soils under a strong-wind scenario, representative indicators from the release, near-surface transport, and post-wind deposition stages were analyzed by correlation. The results showed that steady-state emission intensity, Cstable, was significantly positively correlated with the early deposition load, a0.5 (Spearman ρ = 0.893, p = 0.007), and also significantly positively correlated with total transport input, Lin (Spearman ρ = 0.857, p = 0.0137). This indicates that stronger emission and greater particle input into the near-surface transport layer generally led to larger cumulative deposition shortly after wind cessation.
However, soils with higher release intensity and transport input did not necessarily show a higher transport center or the same vertical partitioning pattern. Likewise, soils with a larger early deposition load did not necessarily show a higher early deposition fraction. The release stage determined the initial magnitude of the subsequent process, but it did not by itself determine how particles were organized within the transport layer or how deposition was partitioned over time after wind cessation.
Further analysis showed that the median particle size of transported particles aloft, d50,aloft, was significantly negatively correlated with local capture efficiency, ϕlocal (ρ = −0.786, p = 0.036). This indicates that coarser particles in the upper transport layer were generally associated with lower local retention. In other words, the particle characteristics established in the transport stage continued to influence whether particles were retained locally to a greater extent during deposition or maintained a stronger capacity for long-range export.
Taken together, the results from all stages show that the influence of measured particle–aggregate differences on wind-eroded dust first appeared as stratification in release and transport-input level under strong wind conditions, with DK highest, WC and WY intermediate, and LH lowest. Thereafter, however, the soils did not evolve along a single pathway. Higher input levels could lead to a high-export end state, as in DK and Wuyuan, or to an early-concentrated deposition pattern with limited absolute export, as in WC. Lower input levels, in contrast, were more likely to lead to a LH-type local-retention end state. These results indicate that particle–aggregate properties influence not only how much dust is released during wind erosion, but more importantly how particles are organized within the near-surface layer after release, how they are redistributed after wind cessation, and whether they are ultimately retained locally or continue to be exported farther downwind.
4. Discussion
Wind erosion can be interpreted as a coupled process involving particle entrainment, near-surface transport, and deposition, rather than as an isolated emission event. During this process, dust emission is sustained not only by direct aerodynamic entrainment, but also by saltation bombardment and the renewal of erodible fine particles from the soil surface and aggregates [31,32]. The emitted particles are then partitioned among saltation, short-term suspension, and higher near-surface layers, with their vertical distribution controlled by particle size, settling velocity, turbulent mixing, and source-surface conditions [33]. Finally, deposition determines how much of the mobilized material is locally retained and how much remains available for further downwind transport or later resuspension [10,11]. In this framework, the present study shows that differences in farmland soil particle–aggregate properties can be transmitted across the emission–transport–deposition sequence under the same wind tunnel forcing.
4.1. Particle–Aggregate Properties Regulate Emission Intensity by Controlling the Sustained Supply of Fine Particles
In the emission stage of the wind erosion cycle, the supply of suspendable particles depends not only on the initial fine-particle fraction, but also on whether saltation impacts can continuously break or abrade aggregates and renew the pool of erodible dust [31,32]. This study shows that differences in wind erosion among farmland soils first emerge as differences in emission intensity. Under unified wind tunnel boundary conditions and a strong-wind scenario of 14 m s−1, the steady-state emission intensity, Cstable, of the seven farmland soils ranged from 27.78 to 76.39 mg m−3, with an approximately 2.75-fold difference between the maximum and minimum values. At the same time, Cstable was significantly positively correlated with total particle input, Lin, in the 5–125 cm transport layer (Spearman ρ = 0.857, p = 0.0137). This indicates that, under the present experimental conditions, divergence in subsequent near-surface transport had already become evident at the emission stage. The number of particles entering the transport layer first depended on how high a sustained input level could be maintained at the emission source.
This pattern should not be attributed simply to differences in texture. Rather, it should be interpreted as the result of particle–aggregate properties regulating the sustained supply of fine particles [3,4]. Wind erosion is fundamentally a continuously evolving process. Once surface particles are entrained, saltation bombardment is initiated, and this bombardment promotes aggregate breakdown and the release of new fine particles. Therefore, the key factor controlling emission intensity is not only how many fine particles are initially present in the soil, but also whether aggregate-associated fine particles can be continuously converted into suspendable fractions under persistent saltation impact [2,3,4,15,16,34]. Recent studies on the wind erodibility of agricultural soils have likewise shown that aggregate condition, management practices, and organic matter background jointly influence soil resistance to erosion and particle release potential, whereas a single particle-size index is often insufficient to fully capture these differences [9,14,18,35].
The PCA and clustering results of this study provide direct support for this interpretation. Based on silt content, median particle size, aggregate-size composition, and organic matter content, the seven soils were grouped into three particle–aggregate groups, and the first two principal components together explained 80.4% of the variation in measured particle–aggregate properties. PC1 mainly reflected texture coarseness and the degree of development of large aggregates, whereas PC2 mainly reflected differences in medium-sized aggregates, fine-particle fractions, and organic matter content. In terms of wind erosion processes, these two axes can be viewed as integrated representations of two particle–aggregate dimensions: one governs whether the soil can provide a sufficient background of saltating particles, and the other governs whether fine particles are effectively protected within aggregates or are more readily and continuously released under impact. Group 2 soils were generally characterized by coarser texture, lower silt content, a lower proportion of 0.25–1 mm aggregates, and a relatively high proportion of particles < 0.063 mm, and they also showed relatively high emission levels overall. This suggests that their particle–aggregate combination is more favorable for maintaining continuous generation of suspended particles under strong wind conditions. Group 0 soils were characterized by a relatively high proportion of medium-sized aggregates, a low fine-particle fraction, and relatively high organic matter content, but they also showed substantial internal variation. Even when soils shared a broadly similar particle–aggregate profile, they could still differ markedly in aggregate fragility, the storage of loose surface particles, and their breakdown response under wind erosion. Group 1 soils were characterized by relatively high silt content, smaller d50, and relatively abundant large aggregates and fine particles. Overall, the emission response of farmland soils under strong wind is better understood as the combined result of multiple measured property dimensions, including particle-size composition, aggregate condition, and the availability of fine particles, rather than as the direct outcome of any single soil property.
These results also suggest that parameterization of farmland dust sources should not rely solely on a few static empirical indicators. Empirical models represented by the RWEQ and related approaches typically describe soil erodibility using only a limited number of variables, such as texture or erodible fractions. However, such representations remain limited in their ability to capture aggregate dynamics during erosion, especially continuous aggregate breakdown and the renewed supply of fine particles [14,36]. More recent approaches based on pedo-transfer or spectro-transfer functions have improved the convenience of predicting wind-erodibility indicators, but they are still fundamentally based on static soil properties [9]. In light of the present results, introducing descriptors that integrate the particle–aggregate state of the soil may be more useful for explaining differences in emission response among farmland soils than relying on a single particle-size fraction or a single empirical factor.
4.2. Particle–Aggregate Properties Alter Vertical Transport Pathways and Particle-Size Sorting
After emission, the wind erosion cycle enters a transport-organization stage, in which total transported mass, vertical partitioning, and particle-size sorting are jointly controlled by the emitted size spectrum, saltation–suspension exchange, settling velocity, and turbulent mixing [32]. The second key finding of this study is that differences among farmland soils were expressed not only in the magnitude of total transport input, Lin, but also in the way particles were vertically partitioned after entering the transport layer. Among different soils, even when total transport input was similar, ftop and z50 could still differ substantially. This indicates that although emission intensity determines how much material enters the transport layer, it does not uniquely determine the vertical partitioning of that material. For similar levels of input, different soils can still distribute particles into different height ranges through differences in particle composition and lifting processes.
This soil-property-controlled vertical transport pattern is broadly consistent with previous studies. Earlier work has shown that the vertical distribution of wind-eroded material can change markedly with surface properties and aerodynamic conditions, and that flux profiles under different conditions may follow exponential, power-law, or other mixed forms [6,37]. For example, wind tunnel experiments over rough surfaces and gravel beds have shown that surface roughness can alter near-surface airflow structure and particle motion, thereby affecting wind erosion transport characteristics and their vertical distribution [38]. Field observations have also shown that although vertical dust fluxes of different particle sizes often exhibit relatively stable scaling relationships with friction velocity, their absolute magnitude and the partitioning among particle-size classes still depend on soil condition and the emitted particle-size spectrum [8]. Based on multi-height observations, the present study extends this understanding to farmland soils and shows that vertical partitioning is not simply an extension of emission intensity or total transport input, but rather another process dimension of wind erosion response.
The decrease in median particle size with height, as quantified by the vertical sorting slope bd50,z, results from the combined effects of the initial emitted particle-size spectrum, the proportion of fine particles released by aggregate breakdown, size-dependent settling velocity, and turbulent mixing. Fine particles are more readily mixed upward and remain suspended at higher levels, whereas coarse particles are more likely to remain near the surface or settle rapidly [34,37]. In this study, the strength of vertical particle-size sorting differed among soils, indicating that particle-size and aggregate properties affect not only the initial size composition of emitted material, but also the degree of aggregate breakdown during erosion and the subsequent process of selective transport. Field studies in desert source regions have shown that the emission and vertical distribution of different dust size classes contain rich information on emission mechanisms and source-material properties [19]. For cultivated soils, this linkage may be even more pronounced, because aggregates can be regarded as carriers of large amounts of fine particles. Once transported or broken down, they may release a higher proportion of silt- and clay-sized particles than would be inferred from bulk texture alone [3,15,16]. Differences among soils at the aggregate scale may therefore be amplified into differences in particle-size spectra and vertical partitioning within the transport layer.
On this basis, differences among the three particle–aggregate groups in ftop and z50 are more likely related to three linked processes. First, soils differ in the initial background availability of fine particles. Second, during continued erosion, soils differ in their ability to release additional fine particles through aggregate breakdown. Third, particles of different sizes differ in settling velocity and vertical mixing capacity, which in turn alters their residence time and partitioning among height intervals. Vertical transport structure should therefore not be viewed as a passive result of total transport input. It is more likely produced by the combined effects of initial fine-particle availability, renewed fine-particle supply during erosion, and size-dependent selective transport. In other words, different farmland soils do show observable and quantifiable differences in their ability to deliver fine particles into higher parts of the transport layer, and these differences are closely linked to the particle–aggregate state of the soil.
4.3. The Deposition Stage Is a Redistribution Process That Determines Particle Fate and Environmental Effects
Deposition represents the local-retention stage of the wind erosion cycle, but it is not simply a passive end point. Previous studies have shown that substantial near-source deposition can occur around eroding fields and that deposition can further modify the particle-size distribution and spatial pattern of near-surface dust [10,12]. Farmland soils did not respond uniformly during the static deposition stage after strong winds ceased. The differences were expressed not only in cumulative deposited mass, but also in the temporal organization of deposition and in the final divergence between local retention and continued export. For some soils, wind-eroded particles produced relatively high deposited mass shortly after wind cessation. For others, early deposition was weaker, but accumulation continued during the later stage. At the same time, soils with greater near-field deposition did not necessarily show higher local capture efficiency and could still exhibit a tendency for longer-range transport. This indicates that the deposition stage is not simply a process of gravitational settling of particles from the transport layer, but a stage in which redistribution and divergence continue to occur.
This finding is consistent with the basic understanding of wind erosion. Wind erosion is never a single event of entrainment or transport. It is a continuous chain involving particle entrainment, saltation bombardment, fine-particle release, near-surface transport, and subsequent deposition [34,37,39]. The behavior of particles after wind cessation therefore depends fundamentally on the particle background established during the transport stage. If many particles enter the static stage and a relatively large fraction of them can settle rapidly, a high early deposition load is more likely to form. If the proportion of fine particles is higher and settling velocities are lower, a longer deposition tail is more likely to persist after wind cessation. In addition, the deposition process itself can further reshape particle-size composition and spatial partitioning, thereby affecting the balance between local deposition and downwind input [10,11,12]. The present study further shows that even under the same strong-wind event, different farmland soils can still follow markedly different post-erosion deposition pathways.
The results of this study suggest that static deposition is influenced by the preceding release and transport stages, while also retaining its own selectivity. First, the deposition stage inherits the background differences established earlier in release and transport. The significant correlations of steady-state emission intensity and transport input with early deposition load indicate that stronger emission and greater particle input into the transport layer generally provide more material available for deposition after wind cessation. Second, this relationship does not extend directly to the final deposition outcome. The particle-size composition of transported material differed among soils, especially in the proportion of fine particles present in the upper layer. This difference controlled how long particles could remain suspended after wind cessation and continued to influence both deposition timing and the degree of local retention. Moreover, the deposition process itself imposed a second stage of particle-size selection, so that the direction of particle-size evolution and the final fate of particles continued to diverge [11,19]. A high early deposition load therefore did not necessarily indicate stronger local retention, and rapid early deposition did not necessarily imply weaker continued export.
Previous discussions of farmland wind erosion have tended to focus more on emission intensity, transport flux, or total erosion loss, with relatively limited attention to how particles continue to settle and redistribute after the wind event ends [10,11,37,39]. The present results indicate that wind erosion risk in farmland does not have a single expression. Some soils are more likely to produce a high near-field deposition load, whereas others are more likely to maintain a stronger potential for continued export. Assessment of farmland wind erosion should therefore not stop at the level of dust emission or near-surface particle concentration. It should also consider whether the particles generated by a wind erosion event are more likely to be retained locally or to continue moving into downwind areas after the event ends. In this sense, the deposition stage is also a key process controlling the eventual fate of particles and their environmental effects.
4.4. Limitations and Future Research Directions
This study still has several limitations. First, the experiments were conducted under dry, bare, and sieved (<5 mm) conditions. This setup simplified actual farmland surface conditions, whereas in real field environments, crusting, straw cover, soil moisture, and roughness elements can all strongly affect threshold entrainment and emission pathways [4,40]. Second, only seven soil samples were included. Although these soils captured a certain range of particle–aggregate gradients, they still represent only a limited portion of the broad variability found in farmland soils across Inner Mongolia and other semiarid regions.
Future work can proceed in at least three directions. First, the robustness of the particle–aggregate property–process relationships identified here should be tested under different moisture levels, crusting conditions, and surface cover states. Second, the dynamic evolution of size-resolved emissions during erosion should be quantified, especially the generation of fine particles during aggregate breakdown, to better explain differences among soils in the d50–z gradient. Third, the indicators obtained from wind tunnel experiments should be compared and validated against field observations from real wind erosion events, including vertical dust fluxes and concentration profiles. Such efforts would help translate particle–aggregate-based indicators into operational parameter schemes for wind erosion and dust models.
5. Conclusions
This study demonstrates that differences in wind erosion responses among farmland soils are not limited to emission intensity, but extend through the full release–transport–deposition continuum. The seven farmland soils from west-central Inner Mongolia could be grouped into three particle–aggregate groups based on particle-size composition, dry aggregate fractions, and organic matter content. Under strong wind conditions, differences in particle–aggregate properties were first expressed as clear divergence in steady release intensity and transport input. These differences were then further reflected in near-surface vertical transport structure, including upper-layer transport contribution, median transport height, and vertical particle-size sorting. After wind cessation, the soils also differed in the temporal organization of static settling, local-retention efficiency, and continued-export potential. Overall, the results indicate that particle–aggregate properties influence not only how much material is released, but also how particles are vertically organized during transport and how they are redistributed during post-wind settling. These findings highlight the importance of integrating particle–aggregate state with process coupling across multiple stages when evaluating farmland wind erosion and its potential environmental effects.
Supplementary Materials
The following supporting information can be downloaded at: https://www.mdpi.com/article/10.3390/atmos17060612/s1, Table S1: Total transport input (Lin) and steady-state emission intensity (Cstable) of seven farmland soils at 14 m s−1; Table S2: Fitted kinetic parameters of static settling of wind-eroded dust from different farmland soils; Table S3: Indicators of static settling of wind-eroded dust from different farmland soils.
Author Contributions
Conceptualization, Z.L., W.K., Z.W., F.L. and Y.L. (Yuan Liu); methodology, R.J., Z.L., W.K., J.Z., Z.W., Z.X. and Y.L. (Yuan Liu); validation, R.J. and C.B.; formal analysis, R.J.; investigation, R.J., C.B. and Y.L. (Yuting Liu); resources, Z.L., J.Z., Z.W., Z.X. and Y.L. (Yuan Liu); data curation, R.J. and C.B.; writing—original draft preparation, R.J.; writing—review and editing, F.L., Z.L. and C.B.; visualization, R.J.; supervision, Z.L. and C.B.; project administration, Z.L., F.L. and C.B.; funding acquisition, F.L., Z.L. and C.B. All authors have read and agreed to the published version of the manuscript.
Funding
This research was funded by Natural Science Foundation of Inner Mongolia Autonomous Region, grant number 2024LHMS03039, the Open Project of Inner Mongolia Academy of Forestry Science, grant number KF2024ZD08 and the Scientific Research Foundation of Hebei Minzu Normal University, grant number DR2024003.
Institutional Review Board Statement
Not applicable.
Informed Consent Statement
Not applicable.
Data Availability Statement
The dataset generated and analyzed during the current study is available in Zenodo at https://doi.org/10.5281/zenodo.19720706.
Acknowledgments
We thank the Experimental Center of Desert Forestry, Chinese Academy of Forestry, for providing the experimental facilities and technical support. The authors have reviewed and edited the output and take full responsibility for the content of this publication.
Conflicts of Interest
The authors declare no conflicts of interest.
References
- Gao, S.; Wang, Y.; Shan, M.; Teng, Y.; Hong, N.; Sun, Y.; Mao, J.; Ma, Z.; Xiao, J.; Azzi, M.; et al. Wind-tunnel and modelled PM10 emissions and dust concentrations from agriculture soils in Tianjin, northern China. Aeolian Res. 2020, 42, 100562. [Google Scholar] [CrossRef]
- Katra, I. Soil erosion by wind and dust emission in semi-arid soils due to agricultural activities. Agronomy 2020, 10, 89. [Google Scholar] [CrossRef]
- Zobeck, T.M. Soil properties affecting wind erosion. J. Soil Water Conserv. 1991, 46, 112–118. [Google Scholar] [CrossRef]
- Zobeck, T.M.; Van Pelt, R.S. Wind-induced dust generation and transport mechanics on a bare agricultural field. J. Hazard. Mater. 2006, 132, 26–38. [Google Scholar] [CrossRef] [PubMed]
- Katra, I.; Gross, A.; Swet, N.; Tanner, S.; Krasnov, H.; Angert, A. Substantial dust loss of bioavailable phosphorus from agricultural soils. Sci. Rep. 2016, 6, 24736. [Google Scholar] [CrossRef] [PubMed]
- Sterk, G.; Raats, P.A.C. Comparison of models describing the vertical distribution of wind-eroded sediment. Soil Sci. Soc. Am. J. 1996, 60, 1914–1919. [Google Scholar] [CrossRef]
- Tanner, S.; Katra, I.; Haim, A.; Zaady, E. Short-term soil loss by eolian erosion in response to different rain-fed agricultural practices. Soil Tillage Res. 2016, 155, 149–156. [Google Scholar] [CrossRef]
- Ishizuka, M.; Mikami, M.; Leys, J.F.; Shao, Y.; Yamada, Y.; Heidenreich, S. Power law relation between size-resolved vertical dust flux and friction velocity measured in a fallow wheat field. Aeolian Res. 2014, 12, 87–99. [Google Scholar] [CrossRef]
- Mina, M.; Rezaei, M.; Sameni, A.; Riksen, M.J.P.M.; Ritsema, C. Estimating the indices of soil erodibility to wind erosion using pedo- and spectro-transfer functions in calcareous soils. Geoderma 2023, 438, 116612. [Google Scholar] [CrossRef]
- Hagen, L.J.; Van Pelt, R.S.; Zobeck, T.M.; Retta, A. Dust deposition near an eroding source field. Earth Surf. Process. Landf. 2007, 32, 281–289. [Google Scholar] [CrossRef]
- Fernandes, R.; Dupont, S.; Lamaud, E. Investigating the role of deposition on the size distribution of near-surface dust flux during erosion events. Aeolian Res. 2019, 37, 32–43. [Google Scholar] [CrossRef]
- Avecilla, F.; Panebianco, J.E.; Iturri, L.A.; de Oro, L.A.; Comas, R.N.; Buschiazzo, D.E. Dust deposition in agricultural land scapes: Temporal and spatial dynamics along a transect into a natural forest patch. Aeolian Res. 2023, 63–65, 100887. [Google Scholar] [CrossRef]
- Zobeck, T.M.; Sterk, G.; Funk, R.; Rajot, J.L.; Stout, J.E.; Van Pelt, R.S. Measurement and data analysis methods for field-scale wind erosion studies and model validation. Earth Surf. Process. Landf. 2003, 28, 1163–1188. [Google Scholar] [CrossRef]
- Jarrah, M.; Mayel, S.; Tatarko, J.; Funk, R.; Kuka, K. A review of wind erosion models: Data requirements, processes, and validity. Catena 2020, 187, 104388. [Google Scholar] [CrossRef]
- Chepil, W.S. Properties of soil which influence wind erosion: II. Dry aggregate structure as an index of erodibility. Soil Sci. 1950, 69, 403–414. [Google Scholar] [CrossRef]
- Chepil, W.S. Soil Conditions That Influence Wind Erosion; U.S. Department of Agriculture Technical Bulletin No. 1185; U.S. Government Printing Office: Washington, DC, USA, 1958. [Google Scholar]
- Swet, N.; Katra, I. Reduction in soil aggregation in response to dust emission processes. Geomorphology 2016, 268, 177–183. [Google Scholar] [CrossRef]
- Pi, H.; Zhang, X.; Li, S.; Webb, N.P. Influence of crop rotation, irrigation, fertilization, and tillage on the aggregate property and soil wind erosion potential in the floodplain of the Yellow River. Aeolian Res. 2024, 67–69, 100925. [Google Scholar] [CrossRef]
- González-Flórez, C.; Klose, M.; Alastuey, A.; Dupont, S.; Escribano, J.; Etyemezian, V.; Gonzalez-Romero, A.; Huang, Y.; Kandler, K.; Nikolich, G.; et al. Insights into the size-resolved dust emission from field measurements in the Moroccan Sahara. Atmos. Chem. Phys. 2023, 23, 7177–7212. [Google Scholar] [CrossRef]
- Xu, X.; Huang, G.; Qu, Z.; Pereira, L.S. Assessing the groundwater dynamics and impacts of water saving in the Hetao Irrigation District, Yellow River basin. Agric. Water Manag. 2010, 98, 301–313. [Google Scholar] [CrossRef]
- Liu, Z.; Wang, X.; Huo, Z.; Steenhuis, T.S. A unique vadose zone model for shallow aquifers: The Hetao irrigation district, China. Hydrol. Earth Syst. Sci. 2019, 23, 3097–3115. [Google Scholar] [CrossRef]
- Liu, X.; Ma, S.; Fang, Y.; Wang, S.; Guo, P. A novel approach to identify crop irrigation priority. Agric. Water Manag. 2023, 275, 108008. [Google Scholar] [CrossRef]
- Zhang, Y.; Miao, Q.; Li, R.; Sun, M.; Yang, X.; Wang, W.; Huang, Y.; Feng, W. Distribution and variation of soil water and salt before and after autumn irrigation. Land 2024, 13, 773. [Google Scholar] [CrossRef]
- Bai, S.; Yang, J.; Zhang, Y.; Yan, F.; Yu, L.; Zhang, S. Evaluating ecosystem services and trade-offs based on land-use simulation: A case study in the farming–pastoral ecotone of Northern China. Land 2022, 11, 1115. [Google Scholar] [CrossRef]
- Dai, Y.; Tian, L.; Zhu, P.; Dong, Z.; Zhang, R. Dynamic aeolian erosion evaluation and ecological service assessment in Inner Mongolia, northern China. Geoderma 2022, 406, 115518. [Google Scholar] [CrossRef]
- Li, X.; Xu, X.; Tian, W.; Tian, J.; He, C. Contribution of climate change and vegetation restoration to interannual variability of evapotranspiration in the agro-pastoral ecotone in Northern China. Ecol. Indic. 2023, 154, 110485. [Google Scholar] [CrossRef]
- Liu, M.; Wang, Z.; Xin, Z. A Track-Platform Vertical Expandable Comprehensive Recirculating Wind Tunnel. Chinese Utility Model Patent CN210774598U, 16 June 2020. Available online: https://patents.google.com/patent/CN210774598U/zh (accessed on 2 June 2026).
- Marzen, M.B.; Akshalov, K.; Grima, C.M.A.; Avecilla, F.; Buschiazzo, D.E.; Colazo, J.C.; Del Bello, E.; Engelmann, L.; Etyemezian, V.; Fischella, M.R.; et al. Switch on tunnel vision: Portable wind tunnels to understand and quantify aeolian processes. Earth-Sci. Rev. 2026, 275, 105396. [Google Scholar] [CrossRef]
- Li, Q.; Kang, F.; Zhang, Z.; Ma, C.; Nan, W. Simulated experiment on wind erosion resistance of Salix residual in the agro-pastoral ecotone. Front. Environ. Sci. 2021, 9, 574883. [Google Scholar] [CrossRef]
- Zhang, Z.; Yu, W.; Li, Q.; Sun, H.; Feng, Z.; Zou, J. Erosion-reducing potential of Salix psammophila roots in the water-wind crisscrossed erosion region of the Chinese Loess Plateau: A simulated investigation. Front. Environ. Sci. 2023, 10, 1109174. [Google Scholar] [CrossRef]
- Bagnold, R.A. The Physics of Blown Sand and Desert Dunes; Methuen & Co., Ltd.: London, UK, 1941. [Google Scholar]
- Shao, Y.; Raupach, M.R.; Findlater, P.A. Effect of saltation bombardment on the entrainment of dust by wind. J. Geophys. Res. Atmos. 1993, 98, 12719–12726. [Google Scholar] [CrossRef]
- Kok, J.F.; Parteli, E.J.R.; Michaels, T.I.; Bou Karam, D. The physics of wind-blown sand and dust. Rep. Prog. Phys. 2012, 75, 106901. [Google Scholar] [CrossRef] [PubMed]
- Alfaro, S.C.; Gomes, L. Modeling mineral aerosol production by wind erosion: Emission intensities and aerosol size distributions in source areas. J. Geophys. Res. Atmos. 2001, 106, 18075–18084. [Google Scholar] [CrossRef]
- Khatei, G.; Rinaldo, T.; Van Pelt, R.S.; D’Odorico, P.; Ravi, S. Wind erodibility and particulate matter emissions of salt-affected soils: The case of dry soils in a low humidity atmosphere. J. Geophys. Res. Atmos. 2024, 129, e2023JD039576. [Google Scholar] [CrossRef]
- Fryrear, D.W.; Saleh, A.; Bilbro, J.D.; Schomberg, H.M.; Stout, J.E.; Zobeck, T.M. Revised Wind Erosion Equation (RWEQ); Technical Bulletin No. 1; Wind Erosion and Water Conservation Research Unit, USDA-ARS, Southern Plains Area Cropping Systems Research Laboratory: Big Spring, TX, USA, 1998. [Google Scholar]
- Shao, Y. Physics and Modelling of Wind Erosion; Springer: Dordrecht, The Netherlands, 2008. [Google Scholar] [CrossRef]
- Dong, Z.; Liu, X.; Wang, X. Aerodynamic roughness of gravel surfaces. Geomorphology 2002, 43, 17–31. [Google Scholar] [CrossRef]
- Ravi, S.; D’Odorico, P.; Breshears, D.D.; Field, J.P.; Goudie, A.S.; Huxman, T.E.; Li, J.; Okin, G.S.; Swap, R.J.; Thomas, A.D.; et al. Aeolian processes in the biosphere. Rev. Geophys. 2011, 49, RG3001. [Google Scholar] [CrossRef]
- Hagen, L.J. Crop residue effects on aerodynamic processes and wind erosion. Theor. Appl. Climatol. 1996, 54, 39–46. [Google Scholar] [CrossRef]

Disclaimer/Publisher’s Note: The statements, opinions and data contained in all publications are solely those of the individual author(s) and contributor(s) and not of MDPI and/or the editor(s). MDPI and/or the editor(s) disclaim responsibility for any injury to people or property resulting from any ideas, methods, instructions or products referred to in the content. |
© 2026 by the authors. Licensee MDPI, Basel, Switzerland. This article is an open access article distributed under the terms and conditions of the Creative Commons Attribution (CC BY) license.