


Abstract
In recent decades, summer extreme high-temperature (EHT) events in the Sichuan–Chongqing (SC) region of southwestern China have become increasingly frequent under global warming. Carbon dioxide removal (CDR) is considered a key strategy for achieving the temperature targets of the Paris Agreement; however, the response of regional EHT events to CDR remains poorly understood. Based on CN05.1 observations and idealized CO2 ramp-up and ramp-down experiments from the CMIP6 Carbon Dioxide Removal Model Intercomparison Project (CDRMIP), this study investigates the historical characteristics of summer EHT events over eastern SC and their responses to CDR. The results show that historical EHT events have become more frequent, longer-lasting, and more intense, indicating an overall intensification of regional high-temperature risk. Under idealized CO2 pathways, regional mean temperature and EHT frequency exhibit pronounced asymmetric and hysteretic responses, with positive anomalies persisting even after CO2 returns to its initial level. This asymmetric response is closely associated with the enhanced slow oceanic response during the ramp-down period. Stronger El Niño-like and Indian Ocean Dipole-like SST warming intensifies the South Asian High and western Pacific subtropical high, favoring elevated summer temperatures and increased EHT events over eastern SC. Soil moisture also heats the atmosphere by altering the surface latent heat flux in the southwestern part of the study region during ramp-down period. These findings not only improve the understanding of regional extreme event responses in the SC region under carbon neutrality, but also confirm the positive effect of carbon neutrality targets on mitigating regional extreme climate change, thereby highlighting the urgent need to control CO2 emissions.
1. Introduction
Since the onset of the Industrial Revolution, anthropogenic activities have led to a rapid rise in atmospheric carbon dioxide (CO2) concentrations, intensifying the greenhouse effect and driving global warming. Within this context, extreme heat events have become increasingly frequent worldwide, posing profound risks to public health, agricultural productivity, and socio-economic systems [1,2]. The IPCC Sixth Assessment Report [3] highlights that the global mean surface temperature had already risen by approximately 1.1 °C above the pre-industrial (PI) level, and that ongoing warming has significantly amplified the probability and severity of diverse extreme weather events. To mitigate the threat of runaway climate change, the Paris Agreement calls for global warming to be limited to 2 °C or even 1.5 °C. Realizing this objective requires that global emissions peak imminently and then decline sharply to achieve net zero by 2050 [4,5]. Consequently, the deployment of Carbon Dioxide Removal (CDR) technology is increasingly viewed as a necessary strategy to reduce atmospheric CO2 concentrations [6].
While CDR is deemed essential for climate mitigation, understanding the efficacy of this approach requires systematic model evaluation. Under the Coupled Model Intercomparison Project Phase 6 (CMIP6) framework, the Carbon Dioxide Removal Model Intercomparison Project (CDRMIP) was designed to systematically assess climate system responses during CO2 removal [7]. In the idealized experiment of the CDRMIP, CO2 concentration increases by 1% per year until it quadruples relative to the PI level, followed by a symmetric 1% per year decrease until it returns to the PI level. Utilizing CDRMIP outputs, previous studies have revealed pronounced irreversibility in the evolution of most climate system components under CDR scenarios, with significant anomalies persisting even after CO2 concentrations recover to the PI level [8,9,10,11,12]. Kim et al. [13] and Mondal et al. [14] reported that 89% and 58% of global regions experience irreversible responses in temperature and precipitation, respectively, with irreversible extreme precipitation changes affecting 69% of the world’s land areas.
Situated at the transition between the eastern Tibetan Plateau and the Sichuan Basin, the Sichuan–Chongqing (SC) region is prone to prolonged extreme high-temperature (EHT) events in summer (July–August) due to its complex topography and basin effects, making it one of the heat hotspots in China [15,16,17]. Notably, the summer of 2022 witnessed the most intense, widespread, and persistent EHT event in the region since 1961, imposing severe strain on public livelihoods, energy security, and industrial and agricultural production. This was followed by another severe and persistent EHT event during the summer-to-autumn transition of 2024, which ranked second only to the 2022 event in terms of intensity [18,19]. Previous studies using CMIP6 models have projected significant upward trends in multiple EHT indices across southwest China under future climate scenarios, with larger increases under high-emission scenarios [20,21]. However, research on the evolution of EHT events in the SC region under CDR scenarios remains limited. Do EHT events increase with rising CO2 emissions and decrease as CO2 concentrations fall? Is their response to CDR symmetric and reversible? This study will address these questions using outputs from CDRMIP experiment of CMIP6.
2. Data and Methodology
2.1. Study Area
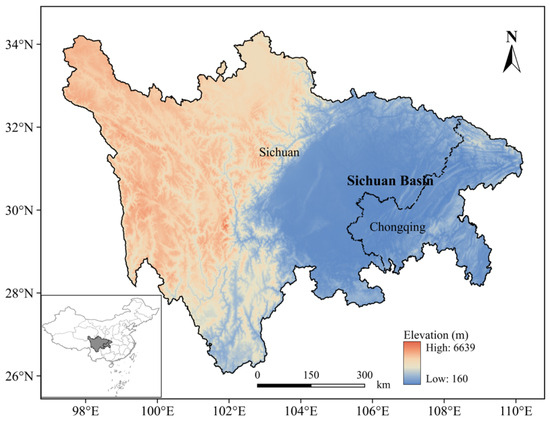
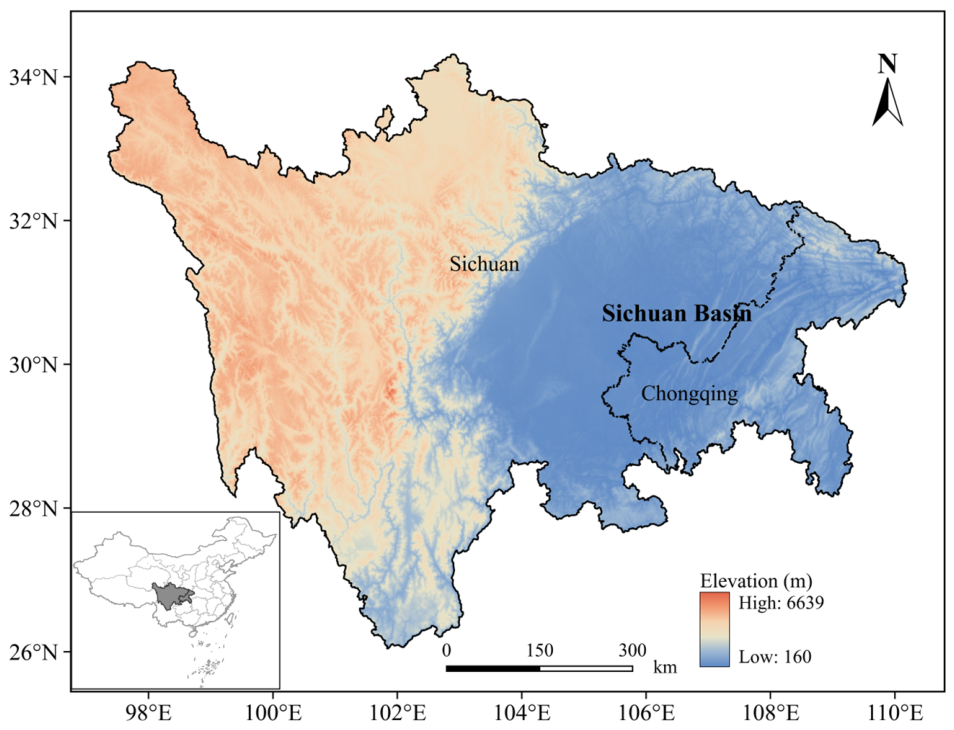
The Sichuan–Chongqing (SC) region comprises Sichuan Province and Chongqing Municipality in southwestern China. It covers approximately 568,000 km2 and extends from 26°03′ N to 34°19′ N and from 97°21′ E to 110°11′ E (Figure 1). Located in the transitional zone between the eastern edge of the Tibetan Plateau and the middle-lower Yangtze Plain, the region is centered around the Sichuan Basin, surrounded by plateaus, mountains, and hills. This unique topography creates a distinct spatial pattern characterized by higher elevations in the west and lower in the east, along with a pronounced three-dimensional climate. Given that the SC region is one of the most densely populated and hazard-prone areas in China, it is vital to understand the future changes in EHT events there.
Figure 1.
Geographic location and topography of the Sichuan–Chongqing region.
2.2. Data
Observed daily maximum (Tmax), minimum (Tmin), and mean (Tmean) temperatures for the period 1981–2022 are obtained from the CN05.1 dataset, which has a 0.25° × 0.25° horizontal resolution and is provided by the National Climate Center [22]. In this study, summer refers specifically to July and August.
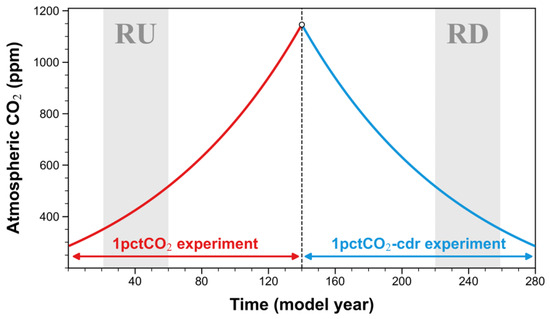
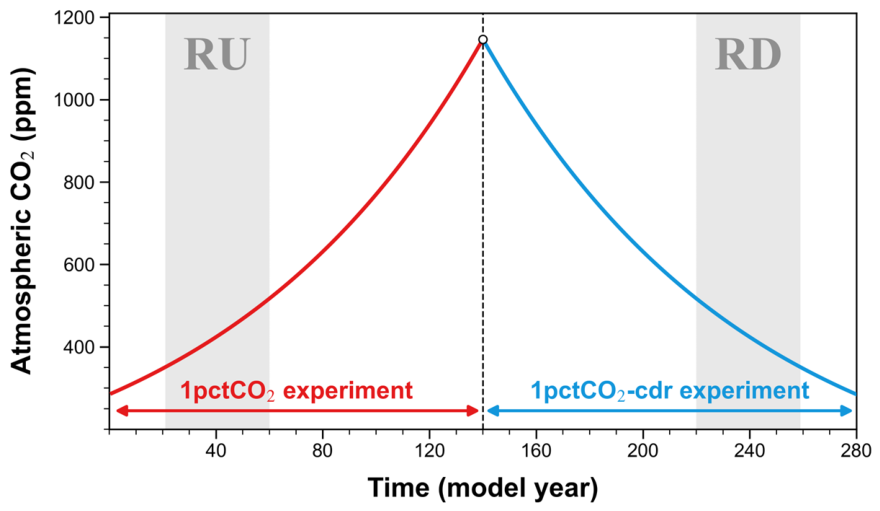
This study uses daily outputs from the following four CMIP6 experiments: (1) the historical experiment, driven by time-varying anthropogenic and natural forcings based on observational estimates for the period 1850–2014; (2) the pre-industrial control (piControl) experiment, in which external forcings are fixed at PI levels with a global mean atmospheric CO2 concentration of 284.7 ppm; (3) the 1pctCO2 experiment, initialized from the end of the piControl run and CO2 concentration increases by 1% per year for 140 years until it reaches four times the PI level (hereafter referred to as the ramp-up period); and (4) the 1pctCO2-cdr experiment, which begins at the end of the 1pctCO2 experiment and CO2 concentration decreases by 1% per year until it returns to the PI level (hereafter referred to as the ramp-down period). All other forcings in the 1pctCO2 and 1pctCO2-cdr experiments are kept at their 1850 levels. Figure 2 shows the evolution of atmospheric CO2 concentration in these two experiments. To investigate the response of EHT events to CO2 removal scenarios, two distinct 40-year periods with identical CO2 concentration are selected: years 21–60 during the CO2 ramp-up period (RU) and years 220–259 during the CO2 ramp-down period (RD).
Figure 2.
Experimental design of the CDR scenario and changes in CO2 concentration. The vertical dashed line denotes the CO2 peak year (Year 140). Two gray shaded regions in Years 21–60 (RU) and Years 220–259 (RD) indicate two 40-year periods with the same average CO2 concentration during the ramp-up and ramp-down periods, respectively.
Nine models (ACCESS-ESM1-5, CanESM5, CAS-ESM2-0, CESM2, CNRM-ESM2-1, GFDL-ESM4, MIROC-ES2L, NorESM2-LM, and UKESM1-0-LL) participated in the CDRMIP experiments. All these models only provided single-member simulations, as multi-member simulations have not yet been required by the CDRMIP. However, only six of these models (Table 1) are selected for this study, as CAS-ESM2-0, CESM2, and GFDL-ESM4 lack the required daily temperature data. All model outputs are regridded to a common 1° × 1° grid using bilinear interpolation. Results are considered to be robust if at least 80% of the models agree on the sign of the multi-model ensemble (MME).
Table 1.
Basic Information of 6 global coupled climate models from CMIP6.
2.3. Methods
2.3.1. Definition of EHT Events and Indices
An extreme high-temperature (EHT) day is defined when the daily Tmax exceeds the 90th percentile of the reference period, calculated using a 5-day sliding window centered on the calendar day. An EHT event is defined as a period of at least three consecutive EHT days [23,24]. Following the climate indices defined by the Expert Team on Climate Change Detection and Indices (ETCCDI) [25,26], six EHT indices are selected and defined in this study: the extreme high temperature threshold (TX90), frequency (EHTF), duration (EHTD), intensity (EHTI), start date (EHTSD), and end date (EHTED) of EHT events. Detailed definitions are provided in Table 2.
Table 2.
Definitions of the EHT indices.
2.3.2. Metrics of Model Performance
We applied two evaluation metrics to assess the performance of the six selected CMIP6 models in simulating EHT characteristics in the SC region.
The relative root-mean-square error () is used to quantitatively estimate the empirical reliability and robustness of climate simulation capability [27,28]. It is defined as:
where RMSE is the root-mean-square error between the model simulation and observations across all grid points in the target region, and is the ensemble median of for the selected models. A negative (positive) value denotes superior (inferior) simulation performance compared to the majority of the models.
The interannual variability skill () score is used to evaluate the ability of CMIP6 models to reproduce the observed interannual variability. It is calculated as:
where and are the interannual standard deviations of the model and the observational data, respectively. A smaller indicates better agreement with the observations [29].
3. Results
3.1. Spatiotemporal Characteristics of Historical EHT Events
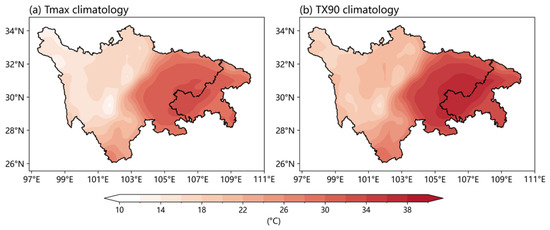
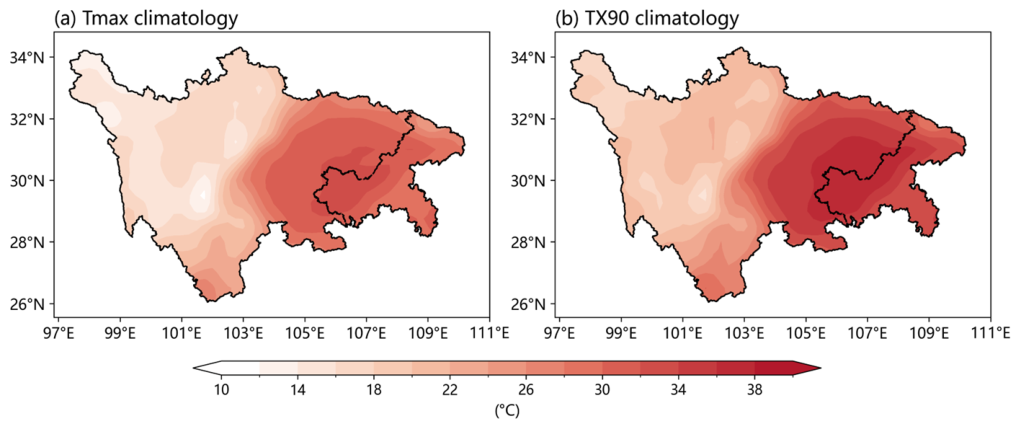
Figure 3 shows the spatial distribution of summer mean Tmax and TX90 across the SC region during 1981–2022. Tmax exhibits a pronounced east–west gradient, with values exceeding 30 °C in the east and dropping below 18 °C in the mountainous west (Figure 3a). The spatial pattern of TX90 is similar to that of Tmax (Figure 3b). The spatial distribution of the temperature is closely related to topography. Western Sichuan is a high-altitude mountainous region, and the heat accumulation effect of the Sichuan Basin makes this region one of the core areas for summer high temperature in China. Given that summer TX90 in western Sichuan is generally below 20 °C, the following analysis only focuses on EHT events in the eastern SC region.
Figure 3.
Climatological mean of Tmax (a) and TX90 (b) for the period 1981–2022 (units: °C).
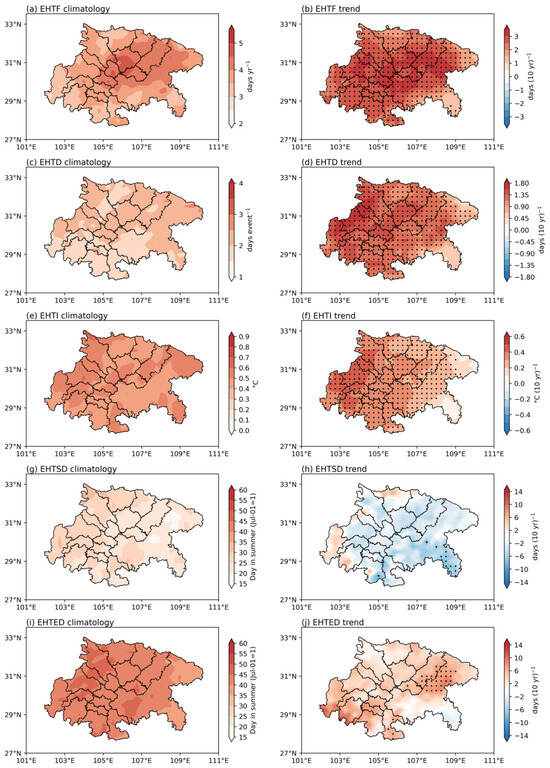
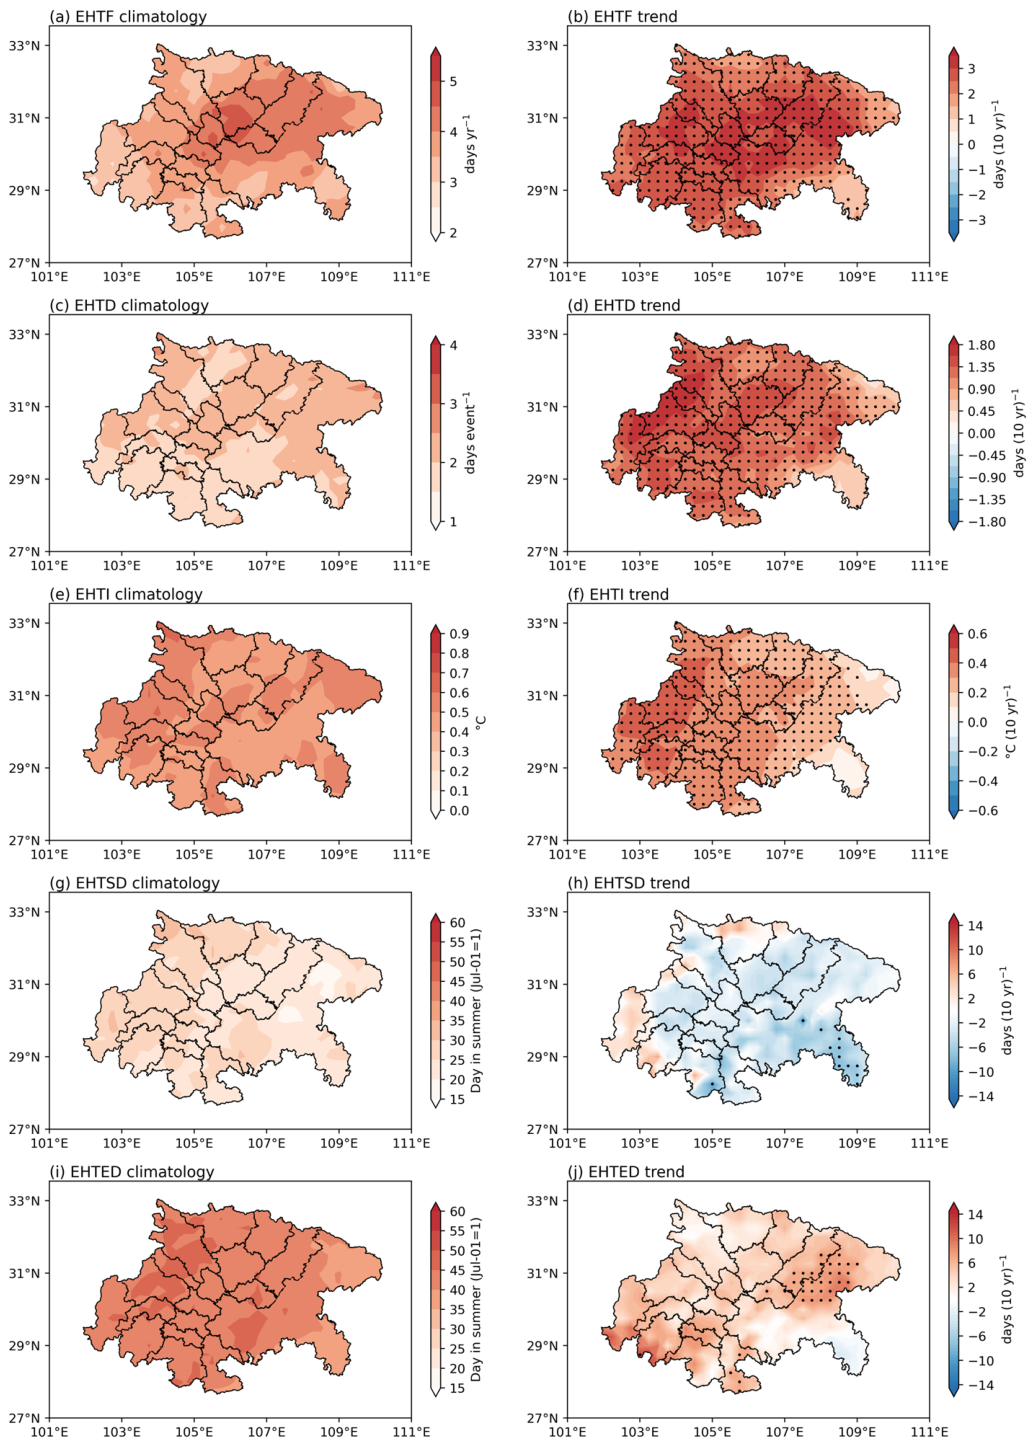
To further characterize the fundamental features of summer EHT events in the SC region, Figure 4 illustrates the climatological means and linear trends of five EHT indices during 1981–2022. Relatively high EHTF is observed over the central–eastern basin and northern Chongqing, exceeding three days and locally reaching more than five days. In contrast, areas in the western basin near the high-altitude transition zone exhibit lower frequencies (Figure 4a). The duration (EHTD) also peaks in the central–eastern basin, with most areas experiencing approximately two days or more (Figure 4c). The intensity (EHTI) is slightly higher in the western basin and northern Chongqing, with a regional average of around 0.5 °C (Figure 4e). EHTF, EHTD, and EHTI all show significant upward trends, indicating that EHT events in eastern SC have become more frequent, longer-lasting, and more intense over the past 40 years (Figure 4b,d,f). Regarding the start and end dates, the first occurrence of EHT events (EHTSD) in summer is typically concentrated in mid-to-late July (Figure 4g) and exhibits an overall advancing trend of approximately six days per decade during 1981–2022, although this trend is not significant at the 90% confidence level over most areas (Figure 4h). EHT events generally end by mid-August (Figure 4i) and show a delaying trend (Figure 4j).
Figure 4.
Climatological means (left panels) and linear trends (right panels) of summer EHT indices during 1981–2022. Dotted regions indicate trends significant at the 95% confidence level.
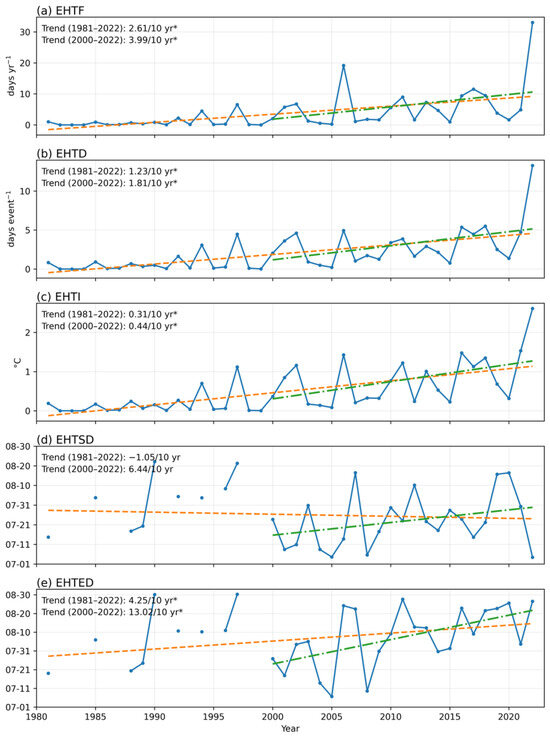
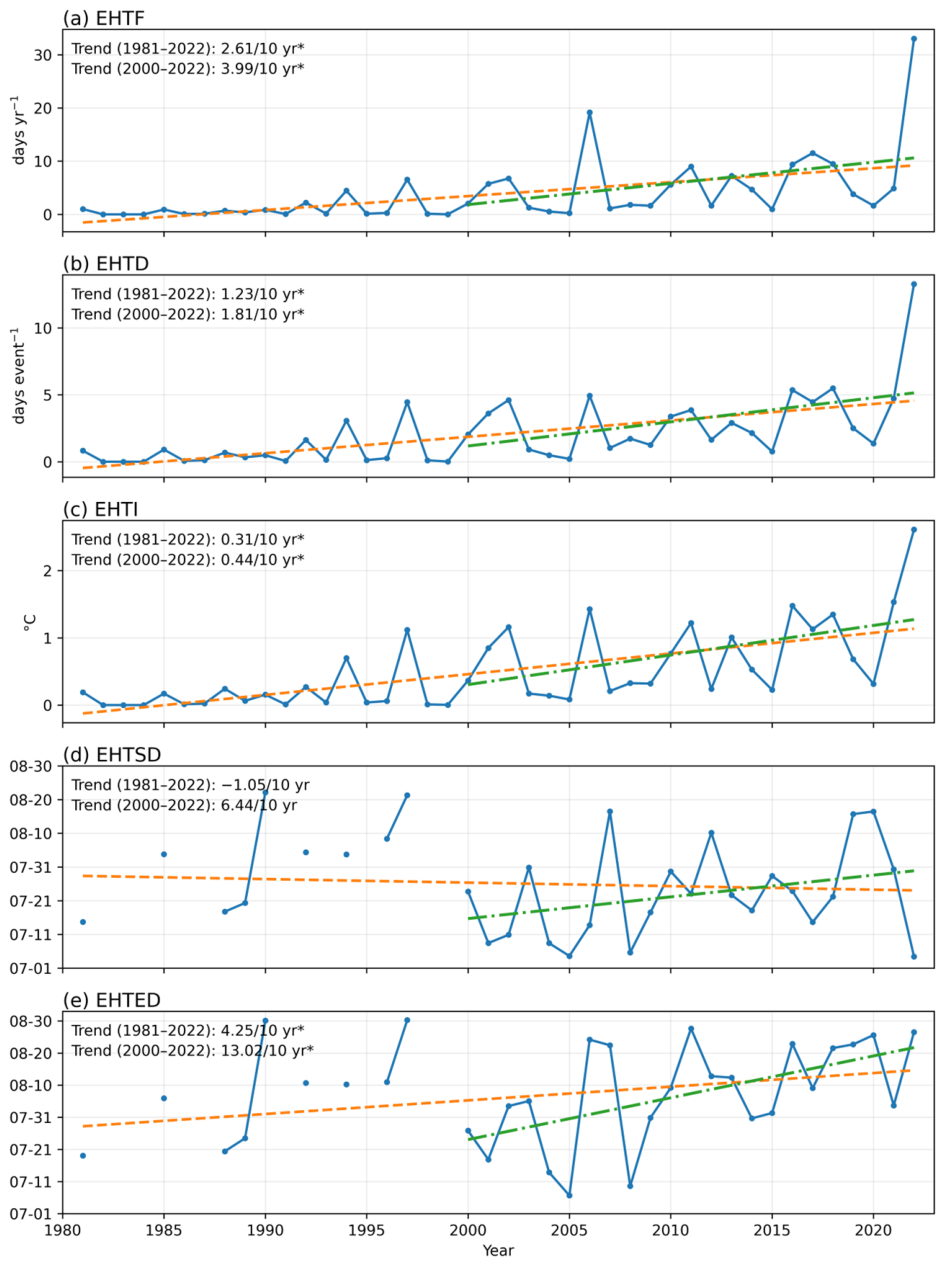
Figure 5 presents the interannual variations in regionally averaged EHT indices for the eastern SC region. During 1981–2022, the EHTF, EHTD, EHTI, and EHTED indices exhibited significant increasing trends, with rates of 2.61 days per decade, 1.23 days per decade, 0.31 °C per decade, and 4.25 days per decade, respectively (Figure 5, orange lines). EHTSD shows a weak and insignificant negative trend during 1981–2022 (Figure 5d, orange line). These results are consistent with the findings in Figure 4.
Figure 5.
Time series of regionally averaged summer EHT indices over the eastern SC region during 1981–2022. Blue lines denote annual values, while orange dashed and green dashed lines indicate linear trends for 1981–2022 and 2000–2022, respectively. Symbol (*) denotes trends significant at the 95% confidence level.
Summer EHT events were rare before 1990 and have occurred almost every year after 2000 (Figure 5). This finding is consistent with previous studies. Wei et al. [30] documented an abrupt increase in heatwave events in China around the 1990s and suggested that this intensification was related not only to the long-term warming trend but also to the climate variability associated with the Atlantic multidecadal oscillation and the interdecadal Pacific oscillation. We further analyze the trends for the post-2000 period. During 2000–2022, the trend of EHTF, EHTD, EHTI, and EHTED remain positive, and the magnitudes of the rates are much larger than those for 1981–2022. In contrast, the negative EHTSD trend observed during 1981–2022 turns positive during 2000–2022, but it remains statistically insignificant. This indicates that the trend of EHTSD is highly sensitive to the choice of study period, and overall, EHTSD shows no significant trend change.
3.2. Asymmetric Response of EHT Events to CDR
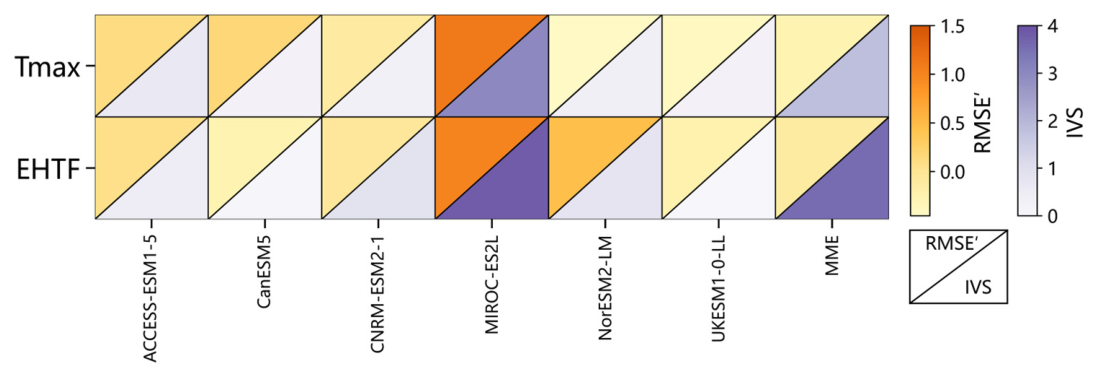
Before analyzing the response of EHT events under the CDR scenario, we evaluate the performance of the six selected models. Figure 6 presents the statistical metrics comparing model simulations of EHT events against the observational reference, where lighter colors indicate better model performance. The results demonstrate that MIROC-ES2L exhibits relatively larger errors in simulating both Tmax and EHTF. In contrast, the remaining five models show good climate simulation capability, with < 0.5 and < 1. To ensure the reliability of the CDR response analysis, MIROC-ES2L is excluded, and the MME is constructed using the remaining five models.
Figure 6.
Relative root-mean-square error () and interannual variability skill score () of Tmax and EHTF simulated by CMIP6 models against observational data.
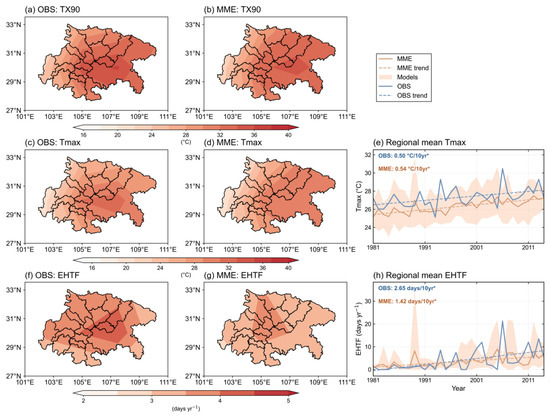
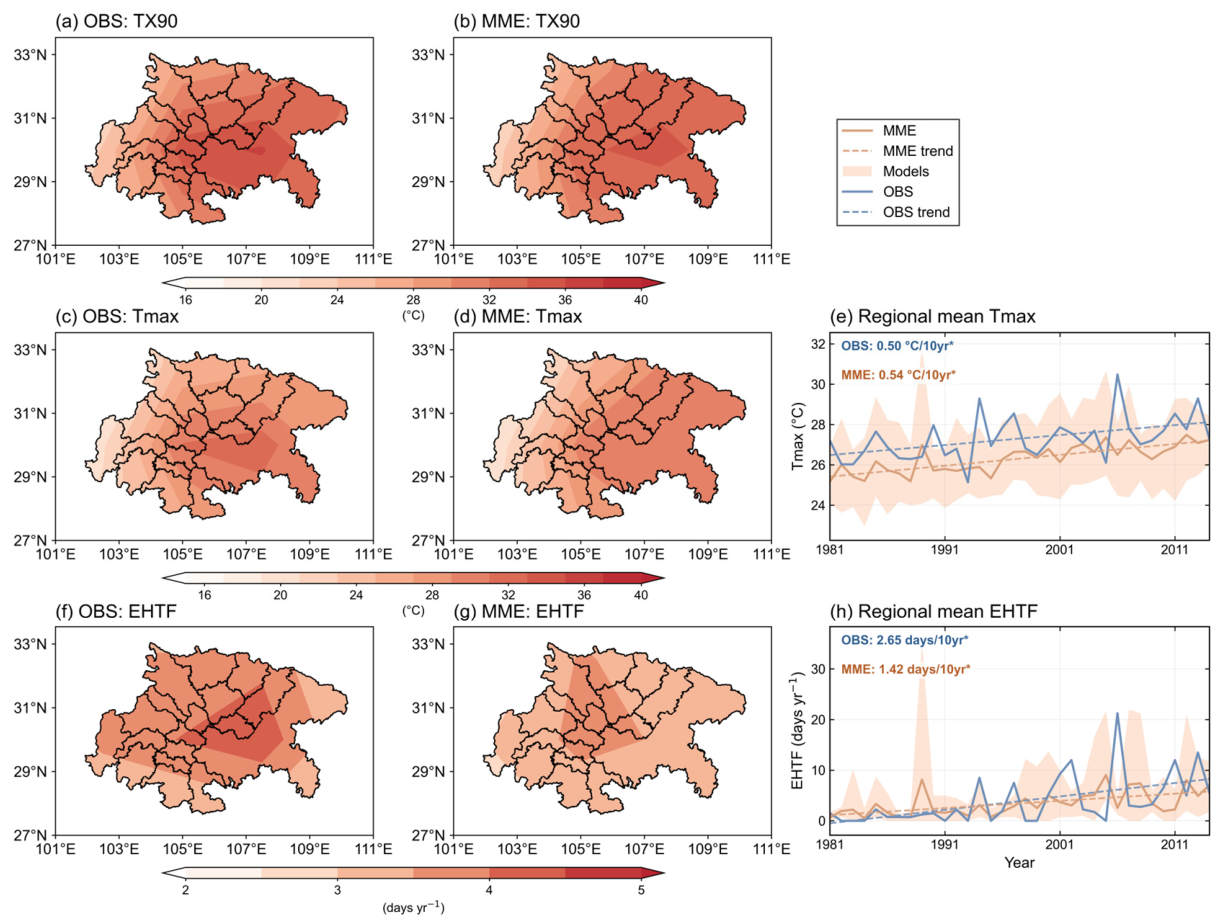
Figure 7 further compares the observed climatological spatial distributions of TX90, Tmax, and EHTF, as well as the temporal evolution of regional mean Tmax and EHTF, with those simulated by the MME over eastern SC. Regarding the spatial distributions, the MME reproduces the overall observed spatial patterns characterized by relatively high values in the central region, although the magnitudes are underestimated (Figure 7a–d,f,g). In terms of temporal evolution, the MME exhibits weaker interannual variability compared to observations, and it captures the long-term increasing trends of Tmax and EHTF, but underestimates the EHTF trend (Figure 7e,h). To ensure the robustness of the subsequent mechanism analysis, we take model sign consistency tests into account in the following analysis. We stippled regions where at least 80% of the selected models agreed on the sign of the simulated results, i.e., four out of five models showed the same sign.
Figure 7.
Spatial distributions of TX90, Tmax, and EHTF and regional mean time series of Tmax and EHTF over eastern SC during 1981–2014. Panels (a–d,f,g) show the observed and MME climatological distributions of TX90, Tmax, and EHTF, respectively. Panels (e,h) show the regional mean time series of Tmax and EHTF, respectively. Symbol (*) denotes trends significant at the 95% confidence level.
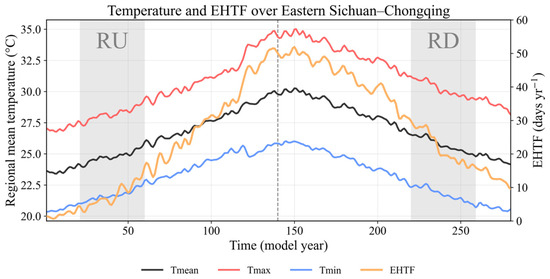
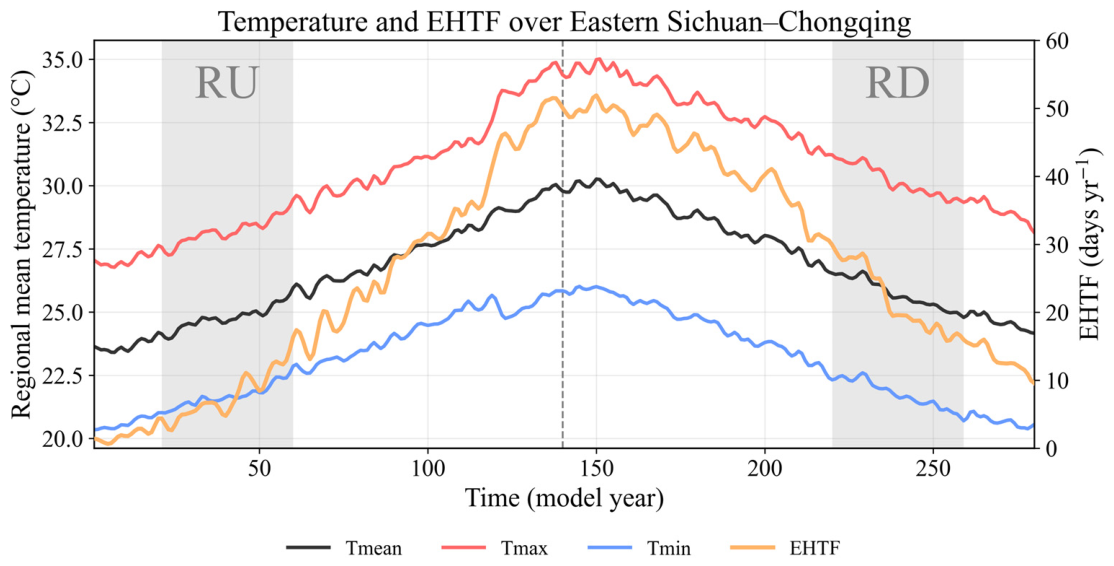
Figure 8 shows the temporal evolution of summer air temperature and EHTF in eastern SC under the idealized CDR scenario. As CO2 rises, the mean, maximum, and minimum temperatures, along with EHTF, all increase consistently. Following a decrease in CO2, these variables continue to rise for approximately 10 years before gradually declining. When considering the RU and RD periods with identical CO2 concentration levels, all indices are higher during the RD period than during the RU period. Even after CO2 returns to the PI level, all indices remain above their PI baselines, with anomalies of 0.7 °C, 0.6 °C, 0.9 °C, and 8 days for Tmean, Tmax, Tmin and EHTF, respectively. These results suggest that temperature and EHT events exhibit an asymmetric and hysteretic response to symmetric CO2 forcing.
Figure 8.
Time series of Tmean (black line), Tmax (red line), Tmin (blue line), and EHTF (orange line) in the idealized CO2 ramp-up and ramp-down experiments. The vertical dashed line denotes the CO2 peak year (Year 140). Two gray shaded regions in Years 21–60 (RU) and Years 220–259 (RD) indicate two 40-year periods with the same average CO2 concentration during the ramp-up and ramp-down periods, respectively.
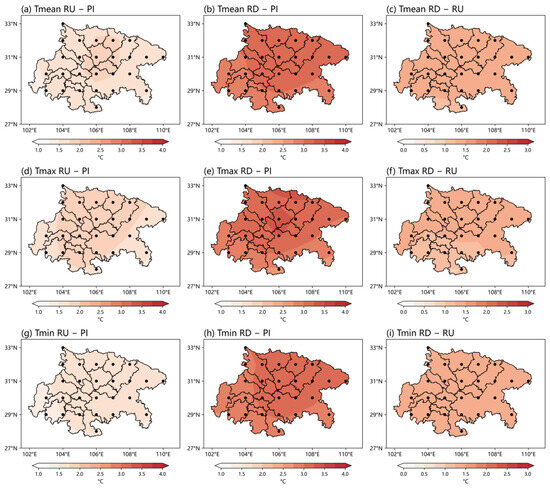
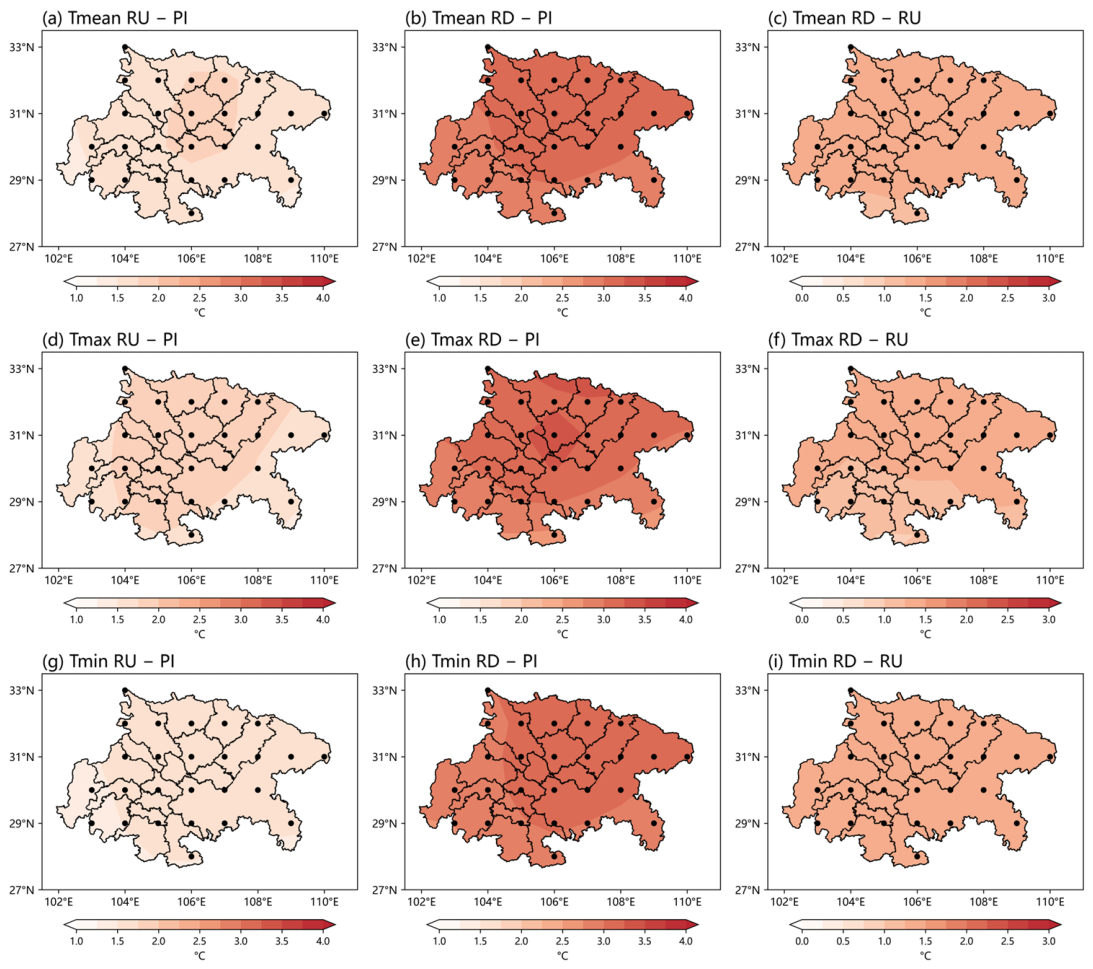
During both the RU and RD periods, Tmean, Tmax, and Tmin exhibit consistent warming across eastern SC relative to PI levels (Figure 9). All three temperature indices are significantly higher during the RD period than during the RU period, with warming magnitudes ranging from approximately 1–2 °C during the RU period (Figure 9a,d,g) to 2.5–3.5 °C during the RD period (Figure 9b,e,h). Consequently, although CO2 concentration during the RD period returns to the same level as in the RU period, the temperatures fail to recover to their previous state (Figure 9c,f,i), reflecting an asymmetric temperature response to CDR. This asymmetric response remains robust even when the two selected periods are changed.
Figure 9.
Responses of Tmean (a–c), Tmax (d–f), and Tmin (g–i) to CO2 forcing. Temperature anomalies during the RU (left) and RD (middle) periods relative to PI, and the differences between RD and RU (right). Black dots indicate regions where at least 80% of models agree on the sign of the MME.
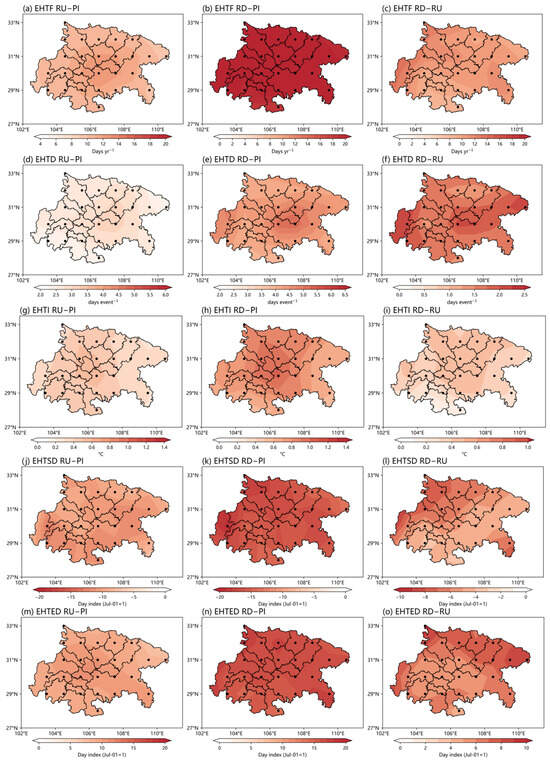
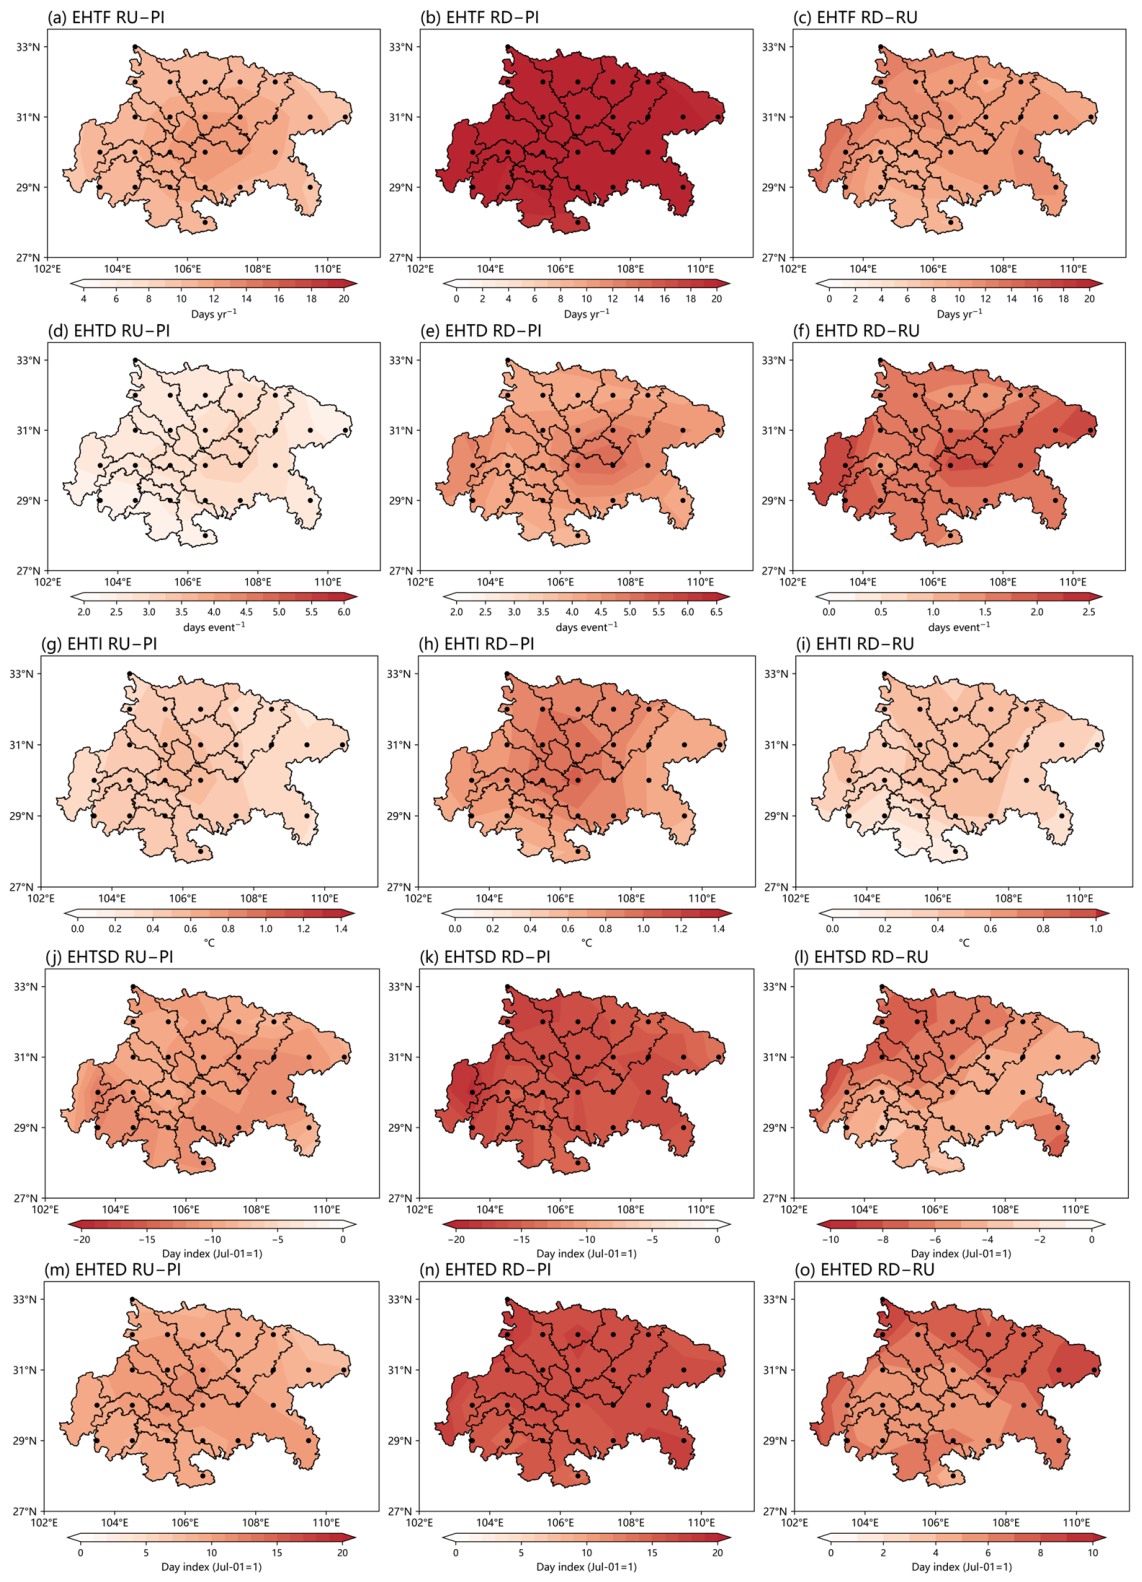
Figure 10 shows the changes in the five EHT indices relative to PI during the RU and RD periods, along with their differences (RD minus RU). In both periods, EHTF, EHTD, EHTI, and EHTED exhibit positive anomalies over most of eastern SC, whereas EHTSD exhibits negative anomalies. Notably, these anomalies are generally much stronger during the RD period than during the RU period. Consistently, the RD–RU differences reveal higher EHTF, EHTD, EHTI, and EHTED, but lower EHTSD. These results suggest that summer EHT events in eastern SC are more frequent, persistent, and intense during the RD period. Moreover, these events tend to start earlier and end later, thereby extending the period of EHT occurrence.
Figure 10.
Responses of EHTF (a–c), EHTD (d–f), EHTI (g–i), EHTSD (j–l) and EHTED (m–o) to CO2 forcing. For EHTSD (j–l) and EHTED (m–o), day 1 corresponds to July 1. Black dots indicate regions where at least 80% of models agree on the sign of the MME.
3.3. Atmospheric Circulation Change and Its Driving Mechanisms
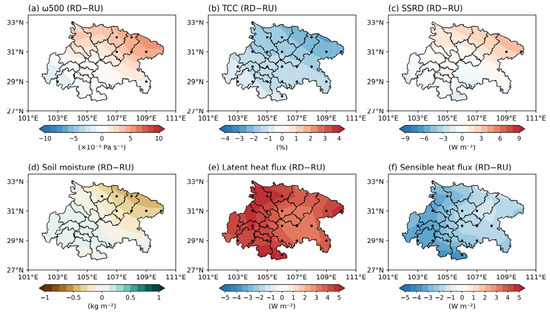
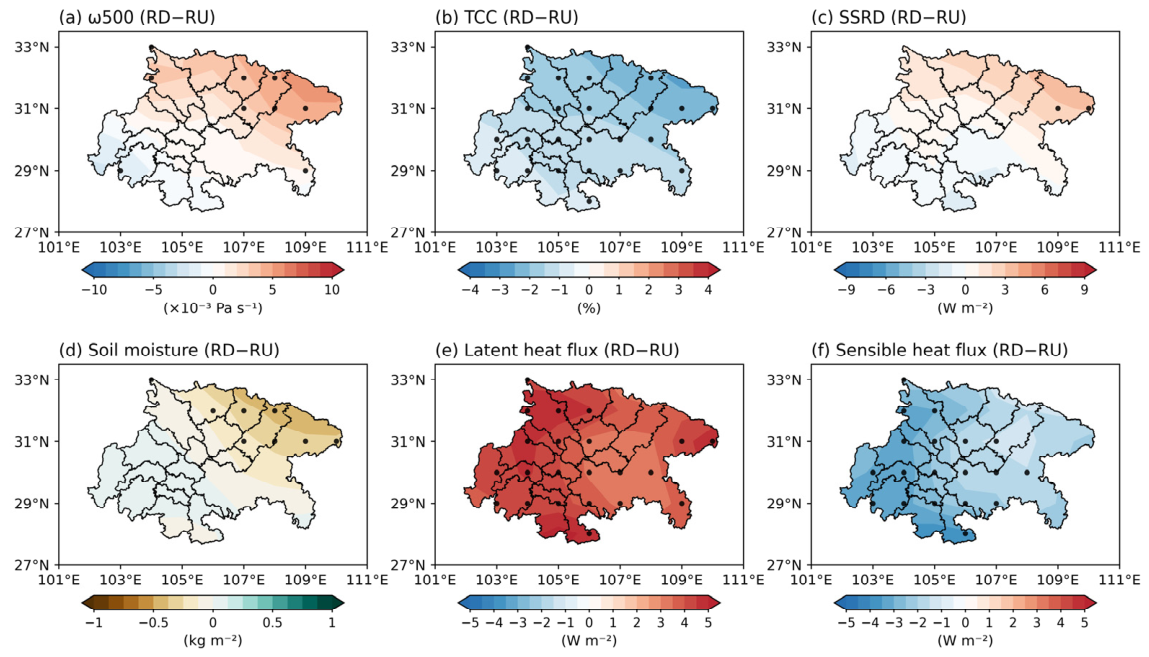
To elucidate the underlying mechanisms driving this asymmetric response in extreme events, we examine the changes in atmospheric circulation across the two periods. Figure 11 depicts the differences in vertical velocity (ω500), total cloud cover (TCC), and surface downward shortwave radiation (SSRD) between the RD and RU periods. Over the northeastern part of the study region, enhanced subsidence (Figure 11a) during the RD period suppresses local cloud formation (Figure 11b), resulting in increased SSRD (Figure 11c). This radiative forcing leads to stronger warming (Figure 9) and more frequent EHT events (Figure 10) during the RD period. However, the southwestern corner of the study region exhibits anomalous ascending motion (Figure 11a) and reduced SSRD (Figure 11c). Therefore, the aforementioned mechanisms cannot explain the increased heatwaves in this area during the RD period (Figure 10). In addition to atmospheric circulation, land surface conditions can also influence the occurrence of heatwave events through land-air coupling [31,32]. Compared with the RU period, soil becomes drier in the northeastern part of the study region and wetter in the southwestern part during the RD period (Figure 11d). This pattern is attributed to the precipitation changes over the SC region under a warming climate [33]. In the southwestern part, wetter soil promoted increased evaporation, transferring more energy from the surface to the atmosphere as latent heat (Figure 11e) and thereby heating the atmosphere.
Figure 11.
Differences in 500-hPa vertical pressure velocity ((a); unit: 10−3 Pa s−1), total cloud cover ((b); unit: %), surface downward shortwave radiation ((c); unit: W m−2), soil moisture ((d); unit: kg m−2), latent heat flux ((e); unit: W m−2), and sensible heat flux ((f); unit: W m−2) between the RD and RU periods. Black dots denote regions where at least 80% of models agree on the sign of the MME.
Previous studies have demonstrated that variations in the position and intensity of the South Asian High (SAH) and the Western Pacific Subtropical High (WPSH) during summer significantly modulate EHT events in the SC region [34,35]. Specifically, the SAH is primarily located in the upper troposphere over the Tibetan Plateau and South Asia, and its eastward extension can enhance upper-level anticyclonic circulation over Southwest China. The WPSH, mainly situated over the western North Pacific and subtropical East Asia, can directly influence the Sichuan Basin and surrounding areas through its westward extension. The strengthening and eastward/westward extension of both systems toward the SC region help maintain anomalous regional subsidence, thereby promoting near-surface warming and the occurrence of EHT events [36].
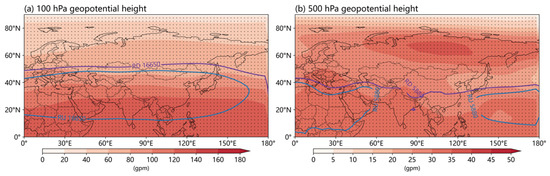
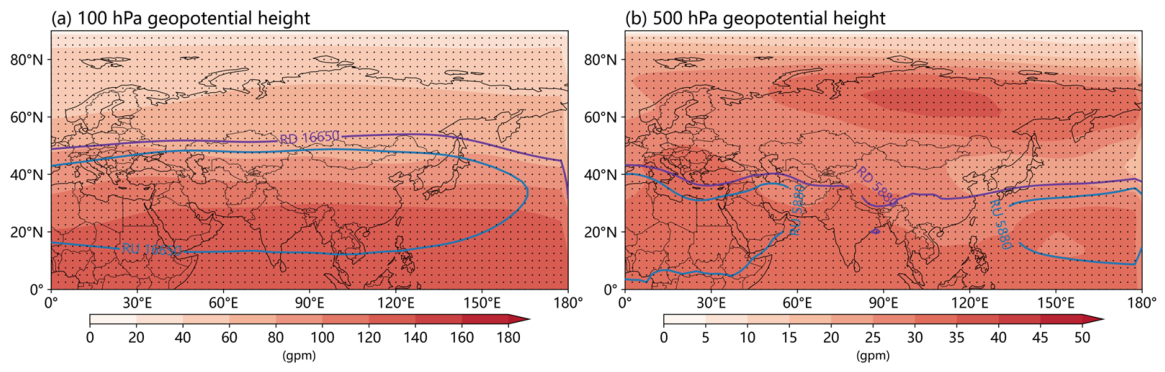
Therefore, to explain the differences in local vertical motion in Figure 10a, we present the 100-hPa and 500-hPa geopotential height differences between the RU and RD periods (Figure 12). Compared to the RU period, both the 100-hPa and 500-hPa geopotential heights are markedly higher during the RD period (Figure 12). This pattern is characterized by a strengthened and eastward-extending SAH, together with a strengthened and westward-extending WPSH, leading to anomalous descending motion over the eastern SC region (Figure 11a).
Figure 12.
Same as Figure 10, but for geopotential heights of 100 hPa (a) and 500 hPa (b). The blue (purple) line represents the 16,750 gpm contour at 100 hPa and the 5880 gpm contour at 500 hPa for the RU (RD) period. Black dots indicate regions where at least 80% of models agree on the sign of the MME.
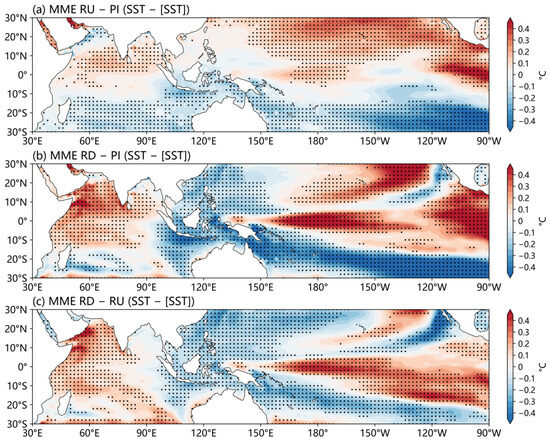
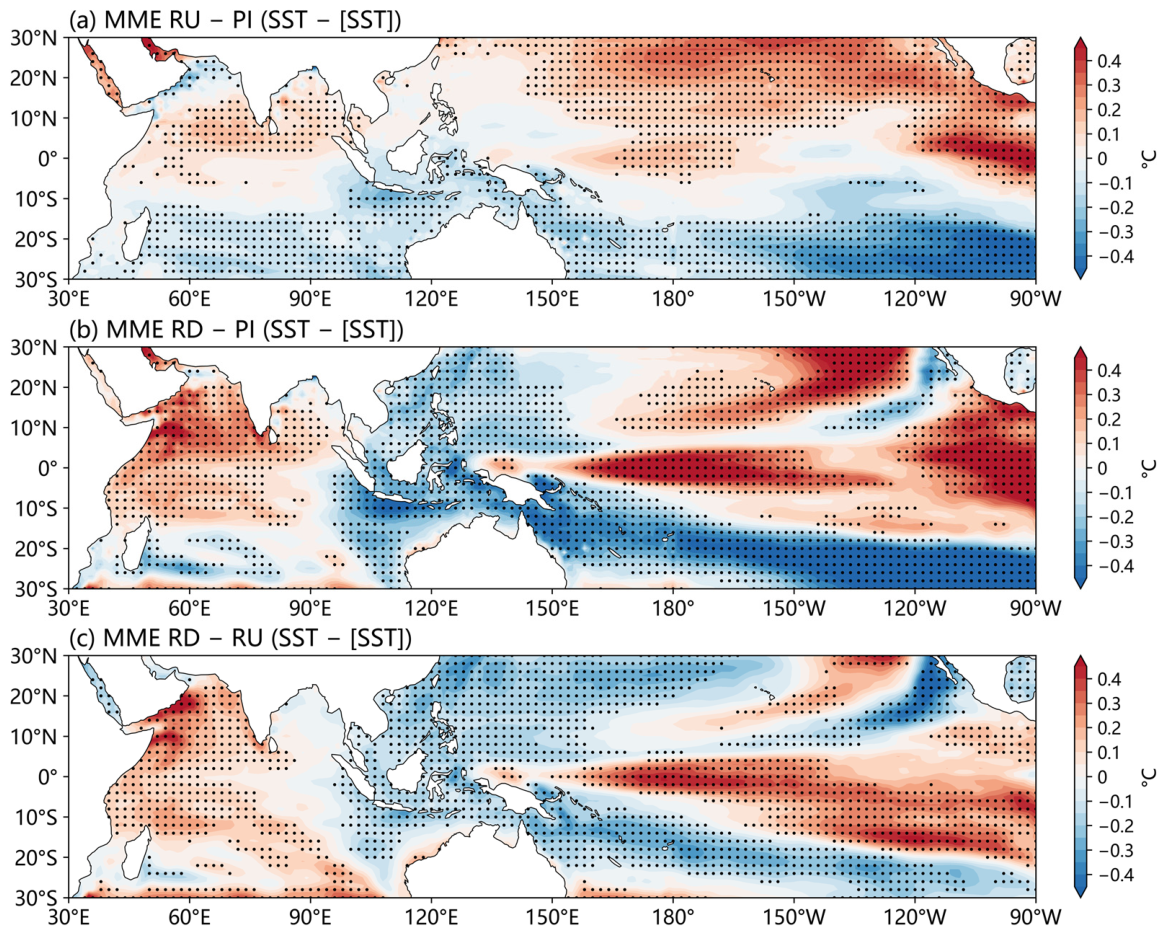
Tropical sea surface temperature (SST) plays an important role in modulating the variability of the SAH and the WPSH [37,38,39]. Figure 13 presents SST anomalies (SSTAs) relative to the PI level and the differences between the RU and RD periods. During both periods, SSTAs exhibit an El Niño-like warming pattern in the tropical Pacific and an Indian Ocean Dipole (IOD)-like warming pattern in the Indian Ocean (Figure 13a,b). These warming signals are significantly more pronounced during the RD period compared to the RU period (Figure 13c), which is consistent with previous studies [40,41,42]. Zhang et al. [43] attributed this asymmetric SST response to the continued accumulation of ocean heat after CO2 peaks. The El Niño warming in the equatorial central Pacific favors the formation of an anomalous low-level anticyclone over the western North Pacific through modulating lower-level convergence and atmospheric stability [44,45], thereby intensifying the WPSH. Concurrently, warming in the tropical Indian Ocean enhances convective heating, which excites a Matsuno–Gill-type circulation and subsequently strengthens the SAH [46].
Figure 13.
Spatial patterns of the tropical sea surface temperature anomalies, expressed as SST − [SST] (°C), where [SST] is the tropical-mean SST averaged over 30°S–30° N. (a) RU − PI, (b) RD − PI, and (c) RD − RU. Black dots denote the regions where at least 80% of models agree on the sign of the MME.
4. Discussion
4.1. Tropical SST Responses in CO2 Ramp-Up and Ramp-Down Experiments
Tropical SST anomalies play an important role in modulating the asymmetric response of summer EHT events over eastern SC. The climate response to CO2 forcing involves two distinct timescales [42,47]. The fast response, driven by atmospheric radiative adjustment and upper ocean warming, evolves nearly synchronously with CO2 concentrations, whereas the slow response is controlled by the huge heat capacity of ocean and deep ocean heat storage, exhibiting pronounced hysteresis and gradually dominating climate anomalies during the CO2 ramp-down period. During the CO2 ramp-up period, the upper ocean warms faster than the deep ocean and transfers heat downward [8,12]. During the CO2 ramp-down period, the upper ocean begins to cool gradually, whereas the deep ocean continues to warm, leading to an asynchronous recovery between the surface and deep ocean. This adjustment in the vertical thermal structure weakens the vertical temperature gradient of ocean and mitigates the cold upwelling efficiency over the tropical central-eastern Pacific, thereby favoring a relatively stronger El Niño-like warming pattern during the RD period [40,43,48]. Meanwhile, persistent anomalous warming in the tropical Indian Ocean may act together with Pacific anomalies to weaken the Walker circulation and modulate the large-scale circulation over East Asia, thereby providing a more favorable background for the intensification of EHT events over eastern SC.
4.2. Local Physical Processes Modulating Regional EHT Events
We have explained the asymmetric response of temperature and heatwaves in the eastern SC region during the RD period based on changes in atmospheric circulation and soil moisture conditions. Furthermore, other local physical processes may also modulate the asymmetric response of EHT events over eastern SC. Boundary layer height affects the vertical mixing of heat and moisture near the surface, thereby regulating heat accumulation and dispersion in the lower atmosphere. A lower boundary layer or weaker vertical mixing can trap more heat near the surface, favoring the persistence and intensification of EHT events [49,50,51]. In addition, urban heat island effects and land-use changes can modify the local surface energy balance by altering surface albedo, roughness, evapotranspiration, and heat storage capacity, which may further increase high-temperature risk in urbanized areas [52,53]. Future studies should incorporate larger ensembles of high-resolution models and sensitivity experiments to better assess the relative roles of these physical processes in driving the asymmetric response of EHT events over eastern SC.
4.3. Model Uncertainty
Global climate models are essential tools for future climate change research. However, due to their relatively coarse spatial resolution, most CMIP6 models struggle to accurately capture fine-scale regional climate characteristics and local climate change processes. This limitation increases the uncertainty of our conclusions. Notably, previous studies have pointed out that these models tend to underestimate both the historical mean of regional average high-temperature anomalies and their projections of end-of-century extreme heat events [54]. From this perspective, the magnitude of temperature increase under the CDR scenario obtained in this study might also be underestimated. Overall, future efforts should focus on further improving model resolution and deepening the understanding of local climate process mechanisms, in order to enhance the performance and application value of these models.
5. Conclusions
This study utilizes CN05.1 observational data to characterize the historical spatiotemporal evolution of summer EHT events over eastern SC, and then employs the idealized 1pctCO2 and 1pctCO2-cdr experiments from the CMIP6 CDRMIP framework to investigate the asymmetric response of EHT events to CO2 pathways during the RU and RD periods, along with the underlying physical mechanisms. The main conclusions are as follows.
- (1)
- EHT events in eastern SC were rare prior to 1990 but have occurred almost every year since 2000. These events typically commence in mid-to-late July and end by mid-August. Significant upward trends in EHTF, EHTD, and EHTI indicate that EHT events have become more frequent, persistent, and intense over the past 40 years. Furthermore, EHTED shows a tendency toward delay, suggesting a prolonged period of high-temperature risk. However, the trend of EHTSD is weak and highly sensitive to the choice of study period.
- (2)
- The regional mean Tmean, Tmax, Tmin, and EHTF show pronounced asymmetric and hysteretic responses to the idealized CO2 ramp-up and ramp-down pathways. All variables increase consistently with rising CO2 concentrations and continue to rise for about ten years after CO2 peaks. Although they subsequently decline as CO2 decreases, they all exhibit significantly positive anomalies even when the CO2 concentration returns to PI levels. Moreover, EHTD, EHTI, and EHTED are generally higher during the ramp-down period than during the ramp-up period, whereas EHTSD is lower during the ramp-down period.
- (3)
- The asymmetric response of EHT events is primarily driven by stronger El Niño-like and IOD-like warming during the CO2 ramp-down period, which intensifies the SAH and WPSH. The enhanced subsidence associated with these systems over the eastern SC region suppresses local cloud formation and increases surface shortwave radiation, thereby favoring rising temperatures and more frequent extreme heat events. In addition to atmospheric circulation, land surface conditions can also influence EHT occurrence through land–air coupling. In the southwestern part of the study region, wetter soil during the RD period promotes increased evaporation, transferring more energy from the surface to the atmosphere as latent heat and consequently heating the atmosphere.
This study has several limitations. First, due to data availability, only a limited number of models were used, which may affect the representation of regional details. Second, the CDR experiment is highly idealized and considers only changes in CO2 concentrations, excluding other real-world factors such as aerosol concentrations and land use that may also influence the climate system through thermodynamic and dynamic processes. Therefore, this paper provides useful insights into regional climate responses under idealized CDR but should not be viewed as direct projections of realistic CDR deployment pathways. Finally, while multi-model ensemble means and inter-model agreement tests were applied to enhance the robustness of the results, the limited number of available CDRMIP models hinders a comprehensive uncertainty analysis.
Author Contributions
Conceptualization, Z.C. and Z.W.; methodology, B.J. and Z.C.; software, B.J.; validation, B.J. and Y.F.; writing—original draft preparation, B.J.; writing—review and editing, B.J., Z.C., Y.F. and Z.W. All authors have read and agreed to the published version of the manuscript.
Funding
This study was supported by the National Key Research and Development Programs of China under Grant 2024YFF0808304; the National Natural Science Foundation of China, grant 42475049; the Natural Science Foundation of Sichuan Province (2026NSFSCZY0088); Open Research Fund Program of Climate Change and Resource Utilization in Complex Terrain Regions Key Laboratory of Sichuan Province (PAEKL-2025-K01); and Heavy Rain and Drought-Flood Disasters in Plateau and Basin Key Laboratory of Sichuan Province (SZKT202403).
Institutional Review Board Statement
Not applicable.
Informed Consent Statement
Not applicable.
Data Availability Statement
The CMIP6/CDRMIP model outputs used in this study are publicly available through the Earth System Grid Federation at https://esgf-node.llnl.gov/projects/cmip6/ (accessed on 10 January 2026). The CN05.1 gridded observational dataset can be obtained from .https://nzc.iap.ac.cn/content?cid=24&aid=999 (accessed on 10 January 2026). The processed data supporting the findings of this study are available from the corresponding author upon reasonable request.
Acknowledgments
We thank the World Climate Research Programme’s Working Group on Coupled Modelling and the climate modeling centers for producing and making available the CMIP6/CDRMIP model outputs. We also acknowledge the Earth System Grid Federation for archiving and providing access to the CMIP6 data. We thank the National Climate Center, China Meteorological Administration, for developing the CN05.1 gridded observational dataset.
Conflicts of Interest
The author declares no conflicts of interest.
Abbreviations
The following abbreviations are used in this manuscript:
| CDR | Carbon dioxide removal |
| CDRMIP | Carbon Dioxide Removal Model Intercomparison Project |
| CMIP6 | Coupled Model Intercomparison Project Phase 6 |
| EHT | Extreme high temperature |
| MME | Multi-model ensemble |
| PI | Pre-industrial |
| RD | Ramp-down |
| RU | Ramp-down |
| SAH | South Asian High |
| SC | Sichuan–Chongqing |
| SST | Sea surface temperature |
| WPSH | Western Pacific subtropical high |
References
- Ren, G.; Zhou, Y. Urbanization effect on trends of extreme temperature indices of national stations over mainland China, 1961–2008. J. Clim. 2014, 27, 2340–2360. [Google Scholar] [CrossRef]
- Qin, D.H. (Ed.) China National Assessment Report on Risk Management and Adaptation of Climate Extremes and Disasters; Science Press: Beijing, China, 2015. (In Chinese) [Google Scholar]
- IPCC. Summary for Policymakers. In Climate Change 2021: The Physical Science Basis. Contribution of Working Group I to the Sixth Assessment Report of the Intergovernmental Panel on Climate Change; Masson-Delmotte, V., Zhai, P., Pirani, A., Connors, S.L., Péan, C., Berger, S., Caud, N., Chen, Y., Goldfarb, L., Gomis, M.I., Eds.; Cambridge University Press: Cambridge, UK, 2021; pp. 3–32. [Google Scholar] [CrossRef]
- Rogelj, J.; Popp, A.; Calvin, K.V.; Luderer, G.; Emmerling, J.; Gernaat, D.; Fujimori, S.; Strefler, J.; Hasegawa, T.; Marangoni, G.; et al. Scenarios towards limiting global mean temperature increase below 1.5 °C. Nat. Clim. Change 2018, 8, 325–332. [Google Scholar] [CrossRef]
- Sanderson, B.M.; Xu, Y.; Tebaldi, C.; Wehner, M.; O’Neill, B.; Jahn, A.; Pendergrass, A.G.; Lehner, F.; Strand, W.G.; Lin, L.; et al. Community climate simulations to assess avoided impacts in 1.5 and 2 °C futures. Earth Syst. Dynam. 2017, 8, 827–847. [Google Scholar] [CrossRef]
- Smith, H.B.; Vaughan, N.E.; Forster, J. Long-term national climate strategies bet on forests and soils to reach net-zero. Commun. Earth Environ. 2022, 3, 305. [Google Scholar] [CrossRef]
- Keller, D.P.; Lenton, A.; Scott, V.; Vaughan, N.E.; Bauer, N.; Ji, D.; Jones, C.D.; Kravitz, B.; Muri, H.; Zickfeld, K. The carbon dioxide removal model intercomparison project (CDRMIP): Rationale and experimental protocol for CMIP6. Geosci. Model Dev. 2018, 11, 1133–1160. [Google Scholar] [CrossRef]
- Yeh, S.-W.; Song, S.-Y.; Allan, R.P.; An, S.-I.; Shin, J. Contrasting response of hydrological cycle over land and ocean to a changing CO2 pathway. npj Clim. Atmos. Sci. 2021, 4, 53. [Google Scholar] [CrossRef]
- Kug, J.-S.; Oh, J.-H.; An, S.-I.; Yeh, S.-W.; Min, S.-K.; Son, S.-W.; Kam, J.; Ham, Y.-G.; Shin, J. Hysteresis of the intertropical convergence zone to CO2 forcing. Nat. Clim. Change 2022, 12, 47–53. [Google Scholar] [CrossRef]
- Li, S.; Hu, K.; Huang, G.; Zheng, X.-T. The reversibility of Antarctic sea ice loss under CO2 removal scenarios. Geophys. Res. Lett. 2025, 52, e2025GL116756. [Google Scholar] [CrossRef]
- Qu, X.; Huang, G. The primary factors influencing the cooling effect of carbon dioxide removal. npj Clim. Atmos. Sci. 2023, 6, 215. [Google Scholar] [CrossRef]
- Zhou, S.; Huang, P.; Xie, S.-P.; Huang, G.; Wang, L. Varying contributions of fast and slow responses cause asymmetric tropical rainfall change between CO2 ramp-up and ramp-down. Sci. Bull. 2022, 67, 1702–1711. [Google Scholar] [CrossRef] [PubMed]
- Kim, S.-K.; Shin, J.; An, S.-I.; Kim, H.-J.; Im, N.; Xie, S.-P.; Kug, J.-S.; Yeh, S.-W. Widespread irreversible changes in surface temperature and precipitation in response to CO2 forcing. Nat. Clim. Change 2022, 12, 834–840. [Google Scholar] [CrossRef]
- Mondal, S.K.; An, S.-I.; Min, S.-K.; Kim, S.-K.; Shin, J.; Paik, S.; Im, N.; Liu, C. Hysteresis and irreversibility of global extreme precipitation to anthropogenic CO2 emission. Weather Clim. Extrem. 2023, 40, 100561. [Google Scholar] [CrossRef]
- Deng, K.; Jiang, X.; Hu, C.; Chen, D. More frequent summer heat waves in southwestern China linked to the recent declining of Arctic sea ice. Environ. Res. Lett. 2020, 15, 074011. [Google Scholar] [CrossRef]
- Huang, X.; Zhang, T.; Jiang, X.; Liu, S.; Xiao, D. Interannual variability of mid-summer heat wave frequency over the Sichuan Basin. Int. J. Climatol. 2021, 41, 5036–5050. [Google Scholar] [CrossRef]
- Zhou, J.; Zhao, J.; Li, Y.; Bai, Y.; Wu, Y.; Xiang, B.; Zhu, H. The hottest center: Characteristics of high temperatures in midsummer of 2022 in Chongqing and its comparison with 2006. Theor. Appl. Climatol. 2024, 155, 151–162. [Google Scholar] [CrossRef]
- Li, X.; Wang, X.; Wang, L. Characteristics and causal drivers of the summer 2024 heatwaves in the Sichuan–Chongqing region, Southwest China. Theor. Appl. Climatol. 2026, 157, 207. [Google Scholar] [CrossRef]
- Pang, Y.; Wu, J.; Liu, B.; Zhou, C.; Guo, L. Comparison of the heatwaves of 2022 and 2024 in the Sichuan Basin, China: The similarity and different roles of oceans and BSISO. Clim. Dyn. 2026, 64, 28. [Google Scholar] [CrossRef]
- Zhang, F.; Wei, L.; Li, Y.; Tang, H.; Zhang, T.; Yang, B. Evaluation and projection of extreme high temperature indices in southwestern China using NEX-GDDP-CMIP6. J. Meteorol. Res. 2024, 38, 88–107. [Google Scholar] [CrossRef]
- Li, X.; Chen, Z.; Wang, L.; Liu, H. Future projections of extreme temperature events in Southwest China using nine models in CMIP6. Front. Earth Sci. 2022, 10, 942781. [Google Scholar] [CrossRef]
- Wu, J.; Gao, X.-J. A gridded daily observation dataset over China region and comparison with the other datasets. Chin. J. Geophys. 2013, 56, 1102–1111. (In Chinese) [Google Scholar] [CrossRef]
- Zhang, M.; Dong, B.; Schiemann, R.; Robson, J. Summer compound heatwaves over China: Projected changes at different global warming levels and related physical processes. Clim. Dyn. 2024, 62, 1887–1907. [Google Scholar] [CrossRef]
- Xu, F.; Luo, M. Changes of concurrent drought and heat extremes in the arid and semi-arid regions of China during 1961–2014. Atmos. Sci. Lett. 2019, 20, e947. [Google Scholar] [CrossRef]
- Zhang, X.; Alexander, L.; Hegerl, G.C.; Jones, P.; Tank, A.K.; Peterson, T.C.; Trewin, B.; Zwiers, F.W. Indices for monitoring changes in extremes based on daily temperature and precipitation data. WIREs Clim. Change 2011, 2, 851–870. [Google Scholar] [CrossRef]
- Perkins, S.E.; Alexander, L.V.; Nairn, J.R. Increasing frequency, intensity and duration of observed global heatwaves and warm spells. Geophys. Res. Lett. 2012, 39, L20714. [Google Scholar] [CrossRef]
- Ge, F.; Zhu, S.; Luo, H.; Zhi, X.; Wang, H. Future changes in precipitation extremes over Southeast Asia: Insights from CMIP6 multi-model ensemble. Environ. Res. Lett. 2021, 16, 024013. [Google Scholar] [CrossRef]
- Sun, X.; Ge, F.; Chen, Q.; Fraedrich, K.; Li, X. How striking is the intergenerational difference in exposure to compound heatwaves over Southeast Asia? Earth’s Future 2023, 11, e2022EF003179. [Google Scholar] [CrossRef]
- Jiang, Z.; Li, W.; Xu, J.; Li, L. Extreme precipitation indices over China in CMIP5 models. Part I: Model evaluation. J. Clim. 2015, 28, 8603–8619. [Google Scholar] [CrossRef]
- Wei, J.; Han, W.; Wang, W.; Zhang, L.; Rajagopalan, B. Intensification of Heatwaves in China in Recent Decades: Roles of Climate Modes. npj Clim. Atmos. Sci. 2023, 6, 98. [Google Scholar] [CrossRef]
- Zhang, J.; Wu, L. Land-atmosphere coupling amplifies hot extremes over China. Chin. Sci. Bull. 2011, 56, 3328–3332. [Google Scholar] [CrossRef]
- Shao, J.; Ma, H.; Song, Y.; Chen, H. Roles of Soil Moisture–Air Temperature Coupling in Three Types of Heatwaves over the Greater Bay Area of China. J. Meteorol. Res. 2025, 39, 959–973. [Google Scholar] [CrossRef]
- Yao, Y.; Li, X.; Wang, L.; Li, H. Future projection of rainstorm and flood disaster risk in Sichuan-Chongqing region under CMIP6 different climate change scenarios. Plateau Meteorol. 2025, 44, 943–960. (In Chinese) [Google Scholar] [CrossRef]
- Sun, Z.; Zhang, Q.; Sun, R.; Deng, B. Characteristics of the extreme high temperature and drought and their main impacts in southwestern China of 2022. J. Arid Meteorol. 2022, 40, 764–770. (In Chinese) [Google Scholar] [CrossRef]
- Shi, R.; Qi, D.; Chen, D.; Ren, Q. Diagnosis on characteristics and mechanisms of persistent high temperature event over Sichuan in 2016. Plateau Mt. Meteorol. Res. 2021, 41, 77–82. (In Chinese) [Google Scholar] [CrossRef]
- Deng, K.; Yang, S.; Gu, D.; Lin, A.; Li, C. Record-breaking heat wave in southern China and delayed onset of South China Sea summer monsoon driven by the Pacific subtropical high. Clim. Dyn. 2020, 54, 3751–3764. [Google Scholar] [CrossRef]
- Xie, S.-P.; Hu, K.; Hafner, J.; Tokinaga, H.; Du, Y.; Huang, G.; Sampe, T. Indian Ocean capacitor effect on Indo–western Pacific climate during the summer following El Niño. J. Clim. 2009, 22, 730–747. [Google Scholar] [CrossRef]
- Huang, G.; Qu, X.; Hu, K. The impact of the tropical Indian Ocean on South Asian High in boreal summer. Adv. Atmos. Sci. 2011, 28, 421–432. [Google Scholar] [CrossRef]
- Zhou, T.; Yu, R.; Zhang, J.; Drange, H.; Cassou, C.; Deser, C.; Hodson, D.L.R.; Sanchez-Gomez, E.; Li, J.; Keenlyside, N.; et al. Why the western Pacific subtropical high has extended westward since the late 1970s. J. Clim. 2009, 22, 2199–2215. [Google Scholar] [CrossRef]
- Jo, S.-Y.; Seong, M.-G.; Min, S.-K.; Kug, J.-S.; Yeh, S.-W.; An, S.-I.; Son, S.-W.; Shin, J. Hysteresis behaviors in East Asian extreme precipitation frequency to CO2 pathway. Geophys. Res. Lett. 2022, 49, e2022GL099814. [Google Scholar] [CrossRef]
- Long, S.-M.; Xie, S.-P.; Zheng, X.-T.; Liu, Q. Fast and slow responses to global warming: Sea surface temperature and precipitation patterns. J. Clim. 2014, 27, 285–299. [Google Scholar] [CrossRef]
- Song, S.-Y.; Yeh, S.-W.; An, S.-I.; Kug, J.-S.; Min, S.-K.; Son, S.-W.; Shin, J. Asymmetrical response of summer rainfall in East Asia to CO2 forcing. Sci. Bull. 2022, 67, 213–222. [Google Scholar] [CrossRef] [PubMed]
- Zhang, S.; Qu, X.; Huang, G.; Hu, P. Asymmetric response of South Asian summer monsoon rainfall in a carbon dioxide removal scenario. npj Clim. Atmos. Sci. 2023, 6, 10. [Google Scholar] [CrossRef]
- Huang, Y.; Wang, B.; Li, X.; Wang, H. Changes in the influence of the western Pacific subtropical high on Asian summer monsoon rainfall in the late 1990s. Clim. Dyn. 2018, 51, 443–455. [Google Scholar] [CrossRef]
- Wang, B.; Zhang, Q. Pacific–East Asian teleconnection. Part II: How the Philippine Sea anomalous anticyclone is established during El Niño development. J. Clim. 2002, 15, 3252–3265. [Google Scholar] [CrossRef]
- Yang, J.; Liu, Q.; Xie, S.-P.; Liu, Z.; Wu, L. Impact of the Indian Ocean SST basin mode on the Asian summer monsoon. Geophys. Res. Lett. 2007, 34, L02708. [Google Scholar] [CrossRef]
- Long, S.-M.; Xie, S.-P.; Du, Y.; Liu, Q.; Zheng, X.-T.; Huang, G.; Hu, K.; Ying, J. Effects of ocean slow response under low warming targets. J. Clim. 2020, 33, 477–496. [Google Scholar] [CrossRef]
- Zhang, S.; Qu, X.; Huang, G.; Hu, P. Reduced rainfall over the Amazon basin in an idealized CO2 removal scenario: Remote dynamic processes. J. Environ. Sci. 2025, 155, 525–537. [Google Scholar] [CrossRef] [PubMed]
- Cao, B.; Wang, X.; Ning, G.; Yuan, L.; Jiang, M.; Zhang, X.; Wang, S. Factors influencing the boundary layer height and their relationship with air quality in the Sichuan Basin, China. Sci. Total Environ. 2020, 727, 138584. [Google Scholar] [CrossRef] [PubMed]
- Feng, X.; Wei, S.; Wang, S. Temperature inversions in the atmospheric boundary layer and lower troposphere over the Sichuan Basin, China: Climatology and impacts on air pollution. Sci. Total Environ. 2020, 726, 138579. [Google Scholar] [CrossRef] [PubMed]
- Wang, Z.; Luo, H.; Yang, S. Different mechanisms for the extremely hot central-eastern China in July–August 2022 from a Eurasian large-scale circulation perspective. Environ. Res. Lett. 2023, 18, 024023. [Google Scholar] [CrossRef]
- Yang, X.; Leung, L.R.; Zhao, N.; Zhao, C.; Qian, Y.; Hu, K.; Liu, X.; Chen, B. Contribution of urbanization to the increase of extreme heat events in an urban agglomeration in east China. Geophys. Res. Lett. 2017, 44, 6940–6950. [Google Scholar] [CrossRef]
- Liu, X.; Tian, G.; Feng, J.; Hou, H.; Ma, B. Adaptation strategies for urban warming: Assessing the impacts of heat waves on cooling capabilities in Chongqing, China. Urban Clim. 2022, 45, 101269. [Google Scholar] [CrossRef]
- Duan, L.; Freese, L.M.; Bala, G.; Caldeira, K. Historical model biases in monthly high temperature anomalies indicate under-estimation of future temperature extremes. Commun. Earth Environ. 2025, 6, 604. [Google Scholar] [CrossRef]

Disclaimer/Publisher’s Note: The statements, opinions and data contained in all publications are solely those of the individual author(s) and contributor(s) and not of MDPI and/or the editor(s). MDPI and/or the editor(s) disclaim responsibility for any injury to people or property resulting from any ideas, methods, instructions or products referred to in the content. |
© 2026 by the authors. Licensee MDPI, Basel, Switzerland. This article is an open access article distributed under the terms and conditions of the Creative Commons Attribution (CC BY) license.