


Abstract
Land Surface Temperature (LST) is essential for climate monitoring, drought assessment, and urban heat analysis. Despite its importance, the Landsat-8 Collection 2 Level-2 (C2L2) LST product has not been rigorously validated using ground measurements—a critical gap this study addresses. We present the first comprehensive accuracy assessment using 382 coincident satellite–ground observations collected from seven Surface Radiation Budget Network (SURFRAD) stations distributed across diverse climatic regions of the United States during the period 2023–2025. The validation results indicate strong overall agreement between satellite-derived and ground-measured temperatures, yielding an RMSE of 4.20 °C, a coefficient of determination (R2) of 0.91, and a Pearson correlation coefficient (r) of 0.98. These statistics demonstrate the high reliability of the C2L2 LST product across a wide range of environmental conditions. Nevertheless, a systematic warm bias of 1.75 °C was observed, indicating a tendency toward temperature overestimation. Model performance exhibited pronounced seasonal variability. The highest accuracy was achieved during winter conditions (RMSE = 2.17 °C; r = 0.99), whereas performance declined considerably during summer months (RMSE = 5.84 °C; r = 0.91). Analysis of atmospheric water vapor content revealed significant associations with retrieval errors at high-elevation and arid locations, particularly at FPK (r = 0.78) and DRA (r = 0.75), based on 106 matched observations. These relationships provide important insight into the atmospheric factors contributing to seasonal variations in retrieval accuracy. Temperature-dependent analyses further demonstrated that retrieval uncertainty increases with surface temperature. Performance progressively deteriorated from cooler to warmer thermal regimes, with RMSE values increasing from approximately 2.05 °C for temperatures below 20 °C to 5.71 °C for temperatures exceeding 40 °C. Spatial evaluation also revealed substantial differences among stations. Relatively homogeneous, low-elevation sites exhibited superior performance (GWN: RMSE = 2.60 °C; SXF: RMSE = 2.55 °C), whereas stations located in mountainous or topographically complex environments showed reduced accuracy (TBL: RMSE = 5.14 °C; FPK: RMSE = 5.62 °C). These outcomes emphasize the influence of terrain complexity and atmospheric heterogeneity on LST retrieval performance. Overall, this study establishes the first comprehensive benchmark for evaluating the reliability of Landsat-8 C2L2 LST products. The results provide valuable guidance for their application in climate research, precision agriculture, hydrological modeling, and environmental monitoring. Furthermore, the findings identify specific environmental conditions requiring enhanced validation efforts and suggest opportunities for future algorithm refinement through improved atmospheric correction procedures and more accurate surface emissivity characterization.
1. Introduction
Land Surface Temperature (LST) is a critical environmental variable for characterizing the energy exchange between the Earth’s surface and the atmosphere. It plays a pivotal role in numerous biophysical and hydrological processes across local to global scales, including evapotranspiration estimation, drought monitoring, urban heat island analysis, and crop water stress assessment [1,2]. In the context of escalating climate change, the demand for accurate and consistent LST measurements has intensified to support environmental studies and improve predictive climate models [3,4,5,6,7,8,9,10].
Among the available methods, thermal infrared (TIR) remote sensing is a prominent approach for acquiring LST data [11]. TIR sensors, particularly those operating around 9.7 μm, measure emitted thermal radiation from surfaces. The derived LST product has become essential for Earth system monitoring. The launch of Landsat-8 in 2013 marked a significant advancement, with the Thermal Infrared Sensor (TIRS) providing two thermal bands (10.6–11.2 µm and 11.5–12.5 µm). These offer a native spatial resolution of 100 m, resampled to 30 m via cubic convolution for user access [12,13,14]. Despite the innovative dual-band design, post-launch calibration issues—notably stray light contamination in Band 11—resulted in an ~8% overestimation in radiance, nearly double that of Band 10 [15,16]. Although a Stray Light Correction Algorithm (SLCA) was implemented in 2017, the Landsat team continues to caution against using Band 11 in high-accuracy LST retrievals [14].
Several studies have assessed the performance of different LST retrieval methods. For instance, Yu et al. (2014) compared three different methods for retrieving LST from Landsat-8: the radiative transfer equation (RTE) method, the split-window (SW) algorithm, and the single-channel (SC) method developed by Jiménez-Muñoz et al. (2009) [17,18]. In this study, validation was carried out using simulated land surface temperature datasets generated through the MODTRAN atmospheric radiative transfer model, with atmospheric profiles and ground truth LST values serving as reference data rather than direct in situ measurements, allowing a controlled assessment of algorithm sensitivity to atmospheric parameters. Yu et al. (2014) used ground-based water vapor measurements to calculate the coefficients, finding that the RTE method yielded the lowest error when atmospheric parameters were accurately known, while the SC method using Band 10 provided superior results compared to Band 11 due to the latter’s higher sensitivity to atmospheric water vapor [17,19]. In 2015, Du et al. (2015) [20] developed a new SW algorithm for retrieving LST from Landsat-8, achieving accuracy better than 1 K in simulations when the atmospheric water vapor content was between 0 and 6.3 g/cm2. The validation approach relied primarily on simulated datasets generated using radiative transfer modeling (MODTRAN), where the retrieved LST values were compared against predefined “true” LST inputs under varying atmospheric conditions, without the use of ground-based in situ temperature measurements, focusing on algorithmic robustness rather than site-specific performance [20]. Subsequent research by [21] further improved the single-channel methodology by incorporating both water vapor and air temperature as input parameters, demonstrating overall errors of approximately 1 K and a bias of −0.5 K [21]. Unlike previous simulation-based studies, validation in this work was performed using in situ land surface temperature observations collected from ground meteorological stations across multiple climatic and land cover environments, enabling a direct comparison between satellite-derived LST and ground-measured surface temperatures. This represented a significant improvement over previous SC models that relied solely on water vapor content. More recently, Ermida et al. (2020) developed an SMW-based algorithm for LST retrieval using the Google Earth Engine (GEE) platform and the Landsat satellite series [22]. The LST in this approach is computed using the Statistical Mono-Window (SMW) algorithm developed by the Climate Monitoring Satellite Application Facility (CM-SAF) for deriving LST climate data records from Meteosat First and Second Generation (MFG and MSG) sensors [23]. The algorithm used consistent calibration coefficients derived from a shared database across Landsat 5, 7, and 8, with input parameters—including atmospheric water vapor from NCEP/NCAR reanalysis and surface emissivity from the ASTER GEDv3 dataset—automatically sourced from the GEE catalog. Validation was conducted using in situ LST measurements from 12 ground stations representing different surface and climatic conditions, including stations from the Surface Radiation Budget Network (SURFRAD), the Karlsruhe Institute of Technology (KIT), and the Baseline Surface Radiation Network (BSRN), allowing an independent assessment of algorithm performance across sensors and regions. Validation against in situ LST from 12 ground stations showed high accuracy, with mean biases of 0.5 K, −0.1 K, and 0.2 K and overall RMSE values of 2.0 K, 2.1 K, and 2.1 K for Landsat 5, 7, and 8 respectively, confirming the algorithm’s reliability and robustness. In addition to these advances, a recent study by Xu et al. (2024) [24] introduced a novel transfer-learning (TL) neural network for retrieving LST directly from Landsat top-of-atmosphere (TOA) reflective and emissive data, eliminating the need for explicit land surface emissivity inputs. The proposed framework was first pretrained using an extensive set of radiative transfer model (RTM) simulations that spanned a wide range of atmospheric and surface conditions and subsequently fine-tuned using real satellite observations and in situ LST measurements. The validation utilized a decade of Landsat-8 acquisitions together with ground-based observations from 241 stations across diverse climate zones and land-cover types, including sites from SURFRAD, BSRN, FLUXNET, and the AmeriFlux network. When benchmarked against conventional approaches, the TL model demonstrated substantial improvements, reducing RMSE by 0.46 K relative to machine-learning models trained solely on real data, and by 0.84 K and 0.57 K compared to the single-channel and split-window algorithms, respectively. These results highlight the value of integrating simulated and observational data, as well as the contribution of shortwave TOA reflectance in implicitly capturing emissivity-related information, yielding a robust and transferable LST retrieval approach now publicly available through Google Earth Engine [24].
The release of Landsat Collection 2, Level-2 product (C2L2) on 28 March 2018, represented a significant advancement in Landsat data processing. NASA and USGS introduced an operational algorithm for LST retrieval developed by [25]. This algorithm relies on three main steps: atmospheric correction using water vapor content from NCEP atmospheric reanalysis data, surface emissivity estimation based on the ASTER Global Emissivity Dataset (GED) with temporal adjustments using Landsat-derived Normalized Difference Vegetation Index (NDVI) and Normalized Difference Snow Index (NDSI). The algorithm has shown promising results, with an RMSE of approximately 2.2–2.3 K when validated against Landsat 5–7 measurements using over 1000 Landsat scenes and ground-based measurements from the surface radiation budget network (SURFRAD) stations operated by the National Oceanic and Atmospheric Administration (NOAA) [25].
Although the LST products distributed by the USGS for Landsat 5 and Landsat 7 Collection 2 Level-2 (C2L2) datasets have undergone validation assessments [25], a comparable evaluation of the operational Landsat-8 C2L2 LST product against SURFRAD observations or other in situ measurements has not yet been comprehensively conducted. This lack of independent justification signifies an important gap in the current literature. While previous investigations have assessed earlier Landsat-derived LST products and developed alternative retrieval methodologies [17,20,21,22], the operational Landsat-8 C2L2 LST product released by USGS in 2018 has not been systematically evaluated using a long-term network of ground-based observations spanning diverse climatic environments. The present study addresses this gap through three principal contributions. First, it provides the first independent and comprehensive accuracy assessment of the operational Landsat-8 C2L2 LST product using observations from the SURFRAD network over the 2023–2025 period. Second, it investigates the influence of seasonal variability, atmospheric water vapor conditions (derived from collocated MODIS MCD19A2 observations), surface temperature magnitude, and site-specific topographic and surface heterogeneity on retrieval performance, thereby extending beyond the aggregate accuracy metrics commonly reported in earlier studies. Third, it establishes a practical reliability framework that enables users to identify environmental conditions under which the product exhibits optimal or reduced performance. By combining operational product validation, process-based error characterization, and user-oriented reliability guidance, this work provides a meaningful advancement beyond previous algorithm-development and simulation-based investigations. In this regard, SURFRAD offers an exceptionally robust platform for satellite-derived LST validation. SURFRAD stations provide highly accurate measurements of surface radiative fluxes and atmospheric parameters across a geographically diverse network encompassing multiple climatic regions of the United States [26,27]. The network continuously monitors both upward and downward broadband solar and thermal infrared irradiance using rigorously calibrated instrumentation and standardized quality-control procedures, making it a widely recognized benchmark for the validation of satellite-based land surface temperature products [17].
Accordingly, this study conducts a comprehensive evaluation of the land surface temperature product provided by USGS within the Landsat-8 C2L2 product using observations from seven SURFRAD stations. It performs detailed statistical comparisons between satellite-derived and in situ measurements. The results provide valuable insights into the accuracy and reliability of land surface temperature data available in the Landsat-8 C2L2 product, demonstrating its suitability for diverse applications including climate analysis, precision agriculture, urban heat monitoring, and hydrological modeling, where precise thermal data are essential for decision-making.
2. Materials and Methods
2.1. Landsat-8 Collection 2 Level-2 Data
Landsat-8 C2L2 data is produced using physics-based specialized algorithms to extract land surface information. This processing level includes two main types of products: surface reflectance derived from the operational land imager sensor data, and LST derived from Band 10 of the thermal infrared sensor [28,29,30].
LST data was obtained from Landsat 8 satellite using the Google Earth Engine platform, utilizing the dataset (LANDSAT/LC08/C02/T1_L2). The Landsat-8 satellite captures images of the same path and row every 16 days due to its sun-synchronous orbit, which ensures complete coverage of the Earth’s surface within this period. However, it is possible to obtain data at shorter temporal intervals due to the overlap of paths and rows, particularly in mid- to high-latitude regions such as the United States [31].
The surface temperature product is generated using the Single Channel Algorithm, jointly developed by the Rochester Institute of Technology and NASA’s Jet Propulsion Laboratory. The algorithm relies on several key inputs, including top-of-atmosphere reflectance and thermal radiance measurements from Landsat-8’s Band 10, global thermal emissivity data from ASTER GED, NDVI derived from ASTER data, and atmospheric data (air temperature and specific humidity) from the GEOS-5 FP-IT model [21,25].
The Land Surface Temperature product suite includes several essential auxiliary bands that provide comprehensive information about the thermal characteristics and quality of the measurements. The ST_TRAD band represents the thermal radiance emitted from the Earth’s surface, measured in W/(m2 sr μm). The ST_URAD band captures the upwelling radiance traveling from the surface toward the sensor, measured in W/(m2 sr μm), while the ST_DRAD band records the downwelling radiance from the atmosphere toward the Earth’s surface, measured in W/(m2 sr μm). The ST_ATRAN band quantifies atmospheric transmittance, which indicates how much thermal radiation can pass through the atmosphere. The ST_EMIS band provides emissivity values estimated from ASTER GED data, which represent the surface’s ability to emit thermal radiation. The USGS uses this emissivity database to derive LST after adjusting it according to NDVI values derived from Landsat-8 OLI. Additionally, the ST_EMSD band contains the emissivity standard deviation, offering uncertainty information about the emissivity estimates. The ST_QA band serves as a surface temperature uncertainty estimation layer. Finally, the ST_CDIST band measures the pixel distance to the nearest cloud in kilometers, helping identify potential cloud contamination effects on temperature retrievals [25,32,33,34,35,36].
2.2. SURFRAD Ground Stations
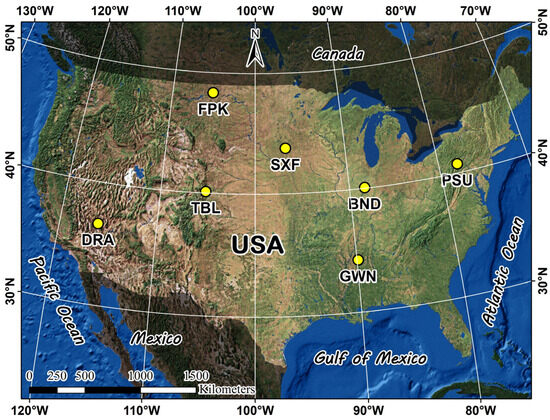
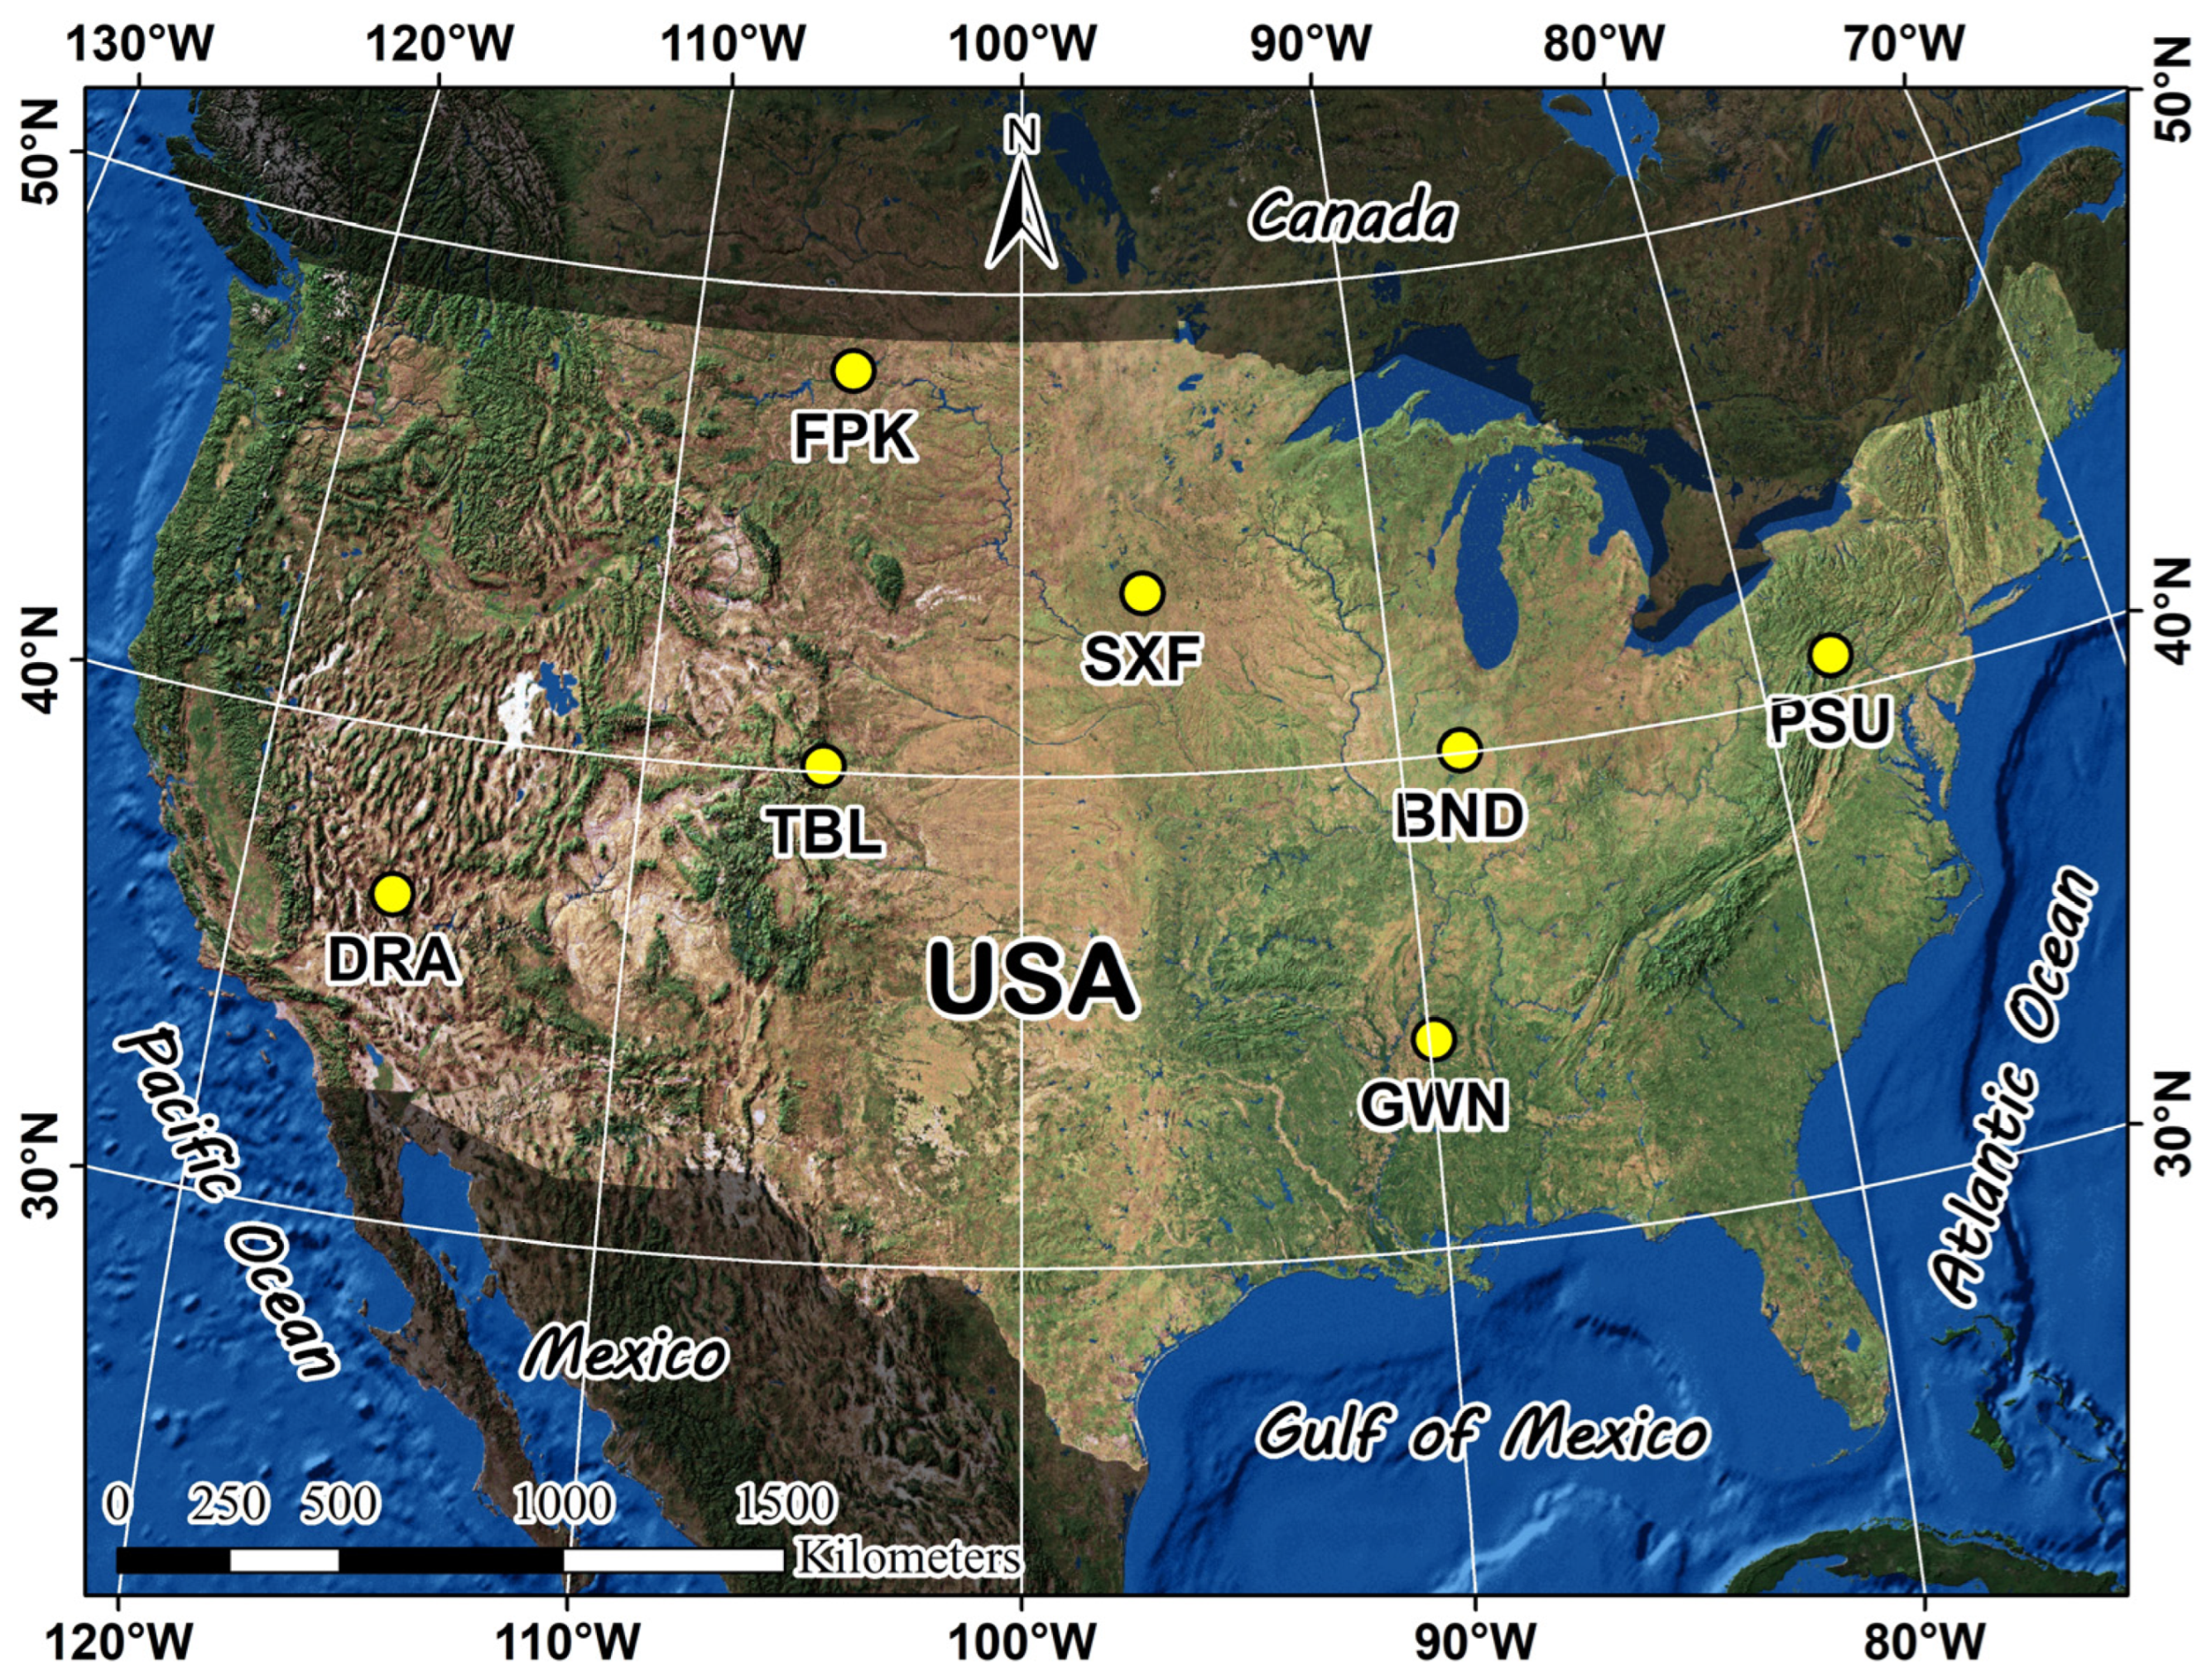
This study utilized seven SURFRAD stations operated by NOAA. Among the eight currently active SURFRAD stations, seven were retained for the present validation in order to keep the network well distributed geographically across the major climatic and physiographic regimes of the contiguous United States, while ensuring a sufficient number of Landsat-8 overpass-matched observations at each retained site. The final set of seven stations therefore spans coastal humid (GWN), continental humid (BND, PSU, SXF), continental cold (FPK), high-elevation grassland (TBL), and arid (DRA) environments, providing a balanced sampling of the surface and atmospheric conditions encountered by Landsat-8 over the United States. Ground data was obtained from the official SURFRAD website (https://gml.noaa.gov/grad/surfrad/sitepage.html (accessed on 12 July 2025)) [26], with 382 ground measurements used where Landsat-8 image capture times matched ground station measurements at the minute level. These stations cover a wide geographical range across the United States (Figure 1), extending from the PSU station in Pennsylvania (77.93085° W) in the east to the DRA station in Nevada (116.01947° W) in the west, and from the FPK station in Montana (48.30783° N) in the north to the GWN station in Mississippi (34.2547° N) in the south (Table 1). The selected sites exhibit variation in elevation, ranging from 98 m above sea level at Goodwin Creek station in Mississippi to 1689 m at the Table Mountain station in Colorado. These stations have long-term records, with the earliest (BND in Illinois) operational since April 1994 and the most recent (SXF in South Dakota) since June 2003 [26].
Figure 1.
Locations of SURFRAD network stations used in the United States of America.
Table 1.
Locations and characteristics of SURFRAD network stations used in the study.
SURFRAD stations can conduct precise and continuous measurements of a wide range of radiative and climatic variables at a 1 min temporal resolution. Key measurements include components of solar and broadband infrared radiation in both downwelling and upwelling directions, providing a comprehensive understanding of the surface radiation balance. The stations also measure direct and diffuse solar radiation, photosynthetically active radiation (important for vegetation studies), ultraviolet-B radiation, spectral solar radiation, and various climatic parameters. The locations of these stations were carefully selected by experts from NOAA, universities, and NASA, ensuring homogeneity in terrain and vegetation cover, making them ideal for validating satellite data. All data are uploaded, quality-controlled, and processed into daily files, and are made available to researchers and the public in near real-time at no cost, making them a valuable resource for climate and environmental studies [26,37].
2.3. Processing and Analysis Methodology
2.3.1. Landsat-8 Satellite Data Extraction
A series of processing steps were applied to the Landsat Collection 2 Level-2 land surface temperature (LST) product. First, the quality assessment mask (QA_PIXEL) was used to remove cloud-contaminated and cloud-shadow-affected pixels. Duplicate LST observations from Landsat 8 acquired on the same day, hour, and minute were identified and removed to avoid redundant measurements. The thermal band (ST_B10) was then selected, and surface temperature values were retrieved by applying the official conversion coefficients provided with the product (scale factor = 0.00341802 and offset = 149), followed by conversion from Kelvin to Celsius by subtracting 273.15 [38].
The analysis covers the period from 1 January 2023 to 10 December 2025. LST values were extracted from the 30 m spatial resolution pixels corresponding to the locations of the seven SURFRAD stations. After quality filtering, observations flagged as invalid by the QA mask were excluded, and records with missing ground measurements at SURFRAD stations were subsequently removed. The final dataset was exported as a CSV file containing the station name, satellite identifier, acquisition date and time (year, month, day, hour, minute, and second), day of year, and surface temperature values.
Table 2 summarizes the total number of retrieved observations, the number of accepted and rejected records based on quality filtering, and the final number of valid LST–SURFRAD matchups for each station and year.
Table 2.
Statistics Total, Accepted, Excluded, and Missing Land Surface Temperature Observations from Landsat-8 and SURFRAD Station.
2.3.2. Land Surface Temperature Calculation from SURFRAD Stations
Land surface temperature (Ts) was derived from the radiometric data of the SURFRAD network stations using the following Equation (1) [39]:
where F↑ and F↓ represent the upwelling and downwelling thermal infrared (3–50 μm) irradiance measured at the time of Landsat-8 overpass, σ is the Stefan-Boltzmann constant (σ = 5.6705 × 10⁻⁸ W m−2 K−4), and εb is the broadband emissivity. The broadband emissivity was derived from the two spectral emissivities (ε31, ε32) of the 1-day MODIS Land Surface Temperature and Emissivity product (MOD11A1) using the conversion Equation (2) [40]:
Some Landsat-8 measurements could not be used due to low-quality flags or missing ground station measurements. The data was organized and formatted to match the satellite data structure. Ground and space measurements were temporally matched at the minute level to ensure comparison accuracy.
2.3.3. Atmospheric Water Vapor Data from MODIS
To evaluate the influence of atmospheric moisture on LST retrieval performance, column water vapor (WV) information was acquired from the MODIS MCD19A2 Collection 6.1 product. This dataset provides atmospheric water vapor estimates at a spatial resolution of 1 km, generated using the Multi-Angle Implementation of Atmospheric Correction (MAIAC) algorithm [41].
For each SURFRAD station, water vapor observations were extracted by temporally collocating MODIS acquisitions with corresponding Landsat-8 overpasses within a ±2 h time window. The MODIS scene with the smallest temporal offset from the Landsat-8 acquisition was selected, and values from the Column WV layer were retrieved and converted to centimeters using the product scaling factor of 0.001. Among the 382 valid Landsat-8 observations, 106 were successfully paired with MODIS-derived water vapor measurements, yielding an average acquisition-time difference of approximately 11 min. This temporal collocation strategy minimizes atmospheric inconsistencies and ensures that the retrieved water vapor conditions are representative of those prevailing during the acquisition of Landsat thermal imagery.
The extracted water vapor values were then analyzed in relation to the absolute differences between satellite-derived and ground-measured LST to assess whether atmospheric water vapor content contributes to the observed systematic errors, particularly during summer months when water vapor concentrations are typically highest.
2.3.4. Statistical Analysis
Statistical analysis was performed using Google Colab environment with Python 3.11 and scientific computing libraries, including NumPy (v2.0.2), Pandas (v2.2.2), SciPy (v1.13.1), and Matplotlib (v3.10.0), to comprehensively evaluate the accuracy of Landsat-8 Collection 2 Level-2 land surface temperature product against ground measurements from SURFRAD stations. A comprehensive set of statistical indicators was calculated to assess measurement accuracy from multiple perspectives, capturing both the magnitude and direction of errors, as well as the strength of relationships between satellite-derived and ground-based measurements.
- Primary Accuracy Metrics:
Root Mean Square Error (RMSE)—Equation (3):
RMSE measures the average magnitude of errors between satellite-derived temperatures () and ground station measurements (), where represents the total number of data points. This metric gives higher weight to larger errors due to the squaring operation, making it particularly sensitive to outliers. Lower RMSE values indicate better agreement between datasets, with values approaching zero representing near-perfect accuracy.
Mean Absolute Difference (MAD)—Equation (4):
MAD computes the average of absolute differences between satellite and ground measurements, offering a straightforward and intuitive measure of deviation. Unlike RMSE, it treats all errors equally without amplifying the impact of large deviations, making it a more robust indicator when extreme values are present in the dataset.
Maximum Absolute Difference (MaxAD)—Equation (5):
MaxAD captures the worst-case deviation between the two datasets, identifying the largest single error observed across all measurements. This metric is crucial for understanding the upper limits of uncertainty and identifying potential outliers or problematic observations that may require further investigation.
Coefficient of Determination (R2)—Equation (6):
R2 indicates how well the satellite-derived temperatures explain the variability in ground station measurements, where represents the mean of ground station measurements. R2 ranges from 0 to 1, with values closer to 1 indicating a stronger linear relationship and better predictive capability of the satellite product.
Supplementary Statistical Indicators:
Mean Error (Bias)—Equation (7):
Unlike MAD, the Bias metric preserves the algebraic sign of differences, revealing systematic tendencies toward overestimation (positive bias) or underestimation (negative bias) in the satellite-derived temperatures. A bias value near zero indicates the absence of systematic directional error, while larger absolute values suggest consistent over- or under-prediction across the dataset.
Standard Deviation of Error—Equation (8):
This metric quantifies the variability or dispersion of errors around the mean bias, indicating the consistency and predictability of the satellite product’s performance. Lower standard deviation values suggest more uniform and predictable errors, while higher values indicate greater uncertainty and less consistent behavior across different conditions.
Willmott Index of Agreement (d)—Equation (9):
The Willmott index is a standardized measure of agreement between predicted and observed values, ranging from 0 to 1, where 1 indicates perfect agreement. Unlike R2, the Willmott index is more sensitive to differences in means and variances between the two datasets and provides a bounded measure that is easier to interpret across different studies.
- Percentile-Based Metrics:
Additional robust statistics were computed to provide a more complete picture of the error distribution. The Median Absolute Difference was calculated as a robust measure of central tendency that is less sensitive to extreme values than the mean. The 95th Percentile of Absolute Error was determined to establish the threshold below which 95% of all errors fall, effectively characterizing the typical range of accuracy while identifying the upper 5% of observations that exhibit exceptional deviations.
- Correlation Analysis:
Both Pearson’s correlation coefficient (r) and Spearman’s rank correlation coefficient (ρ) were computed to assess the strength and nature of relationships between satellite and ground measurements. Pearson’s r measures linear correlation and assumes normally distributed data, while Spearman’s ρ assesses monotonic relationships without distributional assumptions, making it more robust to outliers and non-linear patterns. All correlation coefficients were tested for statistical significance at the p < 0.001 level to ensure the reliability of observed relationships.
3. Results
3.1. Overall Performance Assessment of Landsat-8 C2L2 Surface Temperature Product
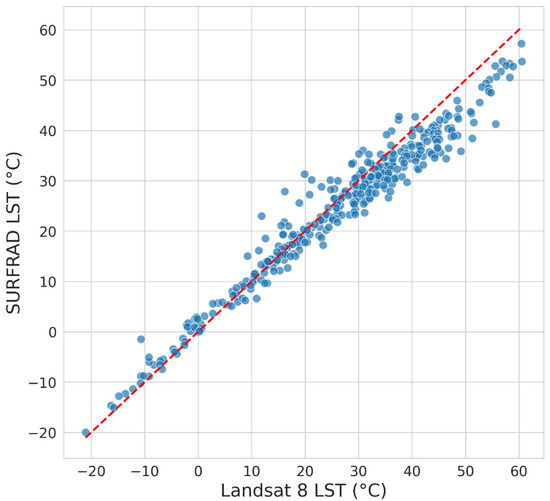
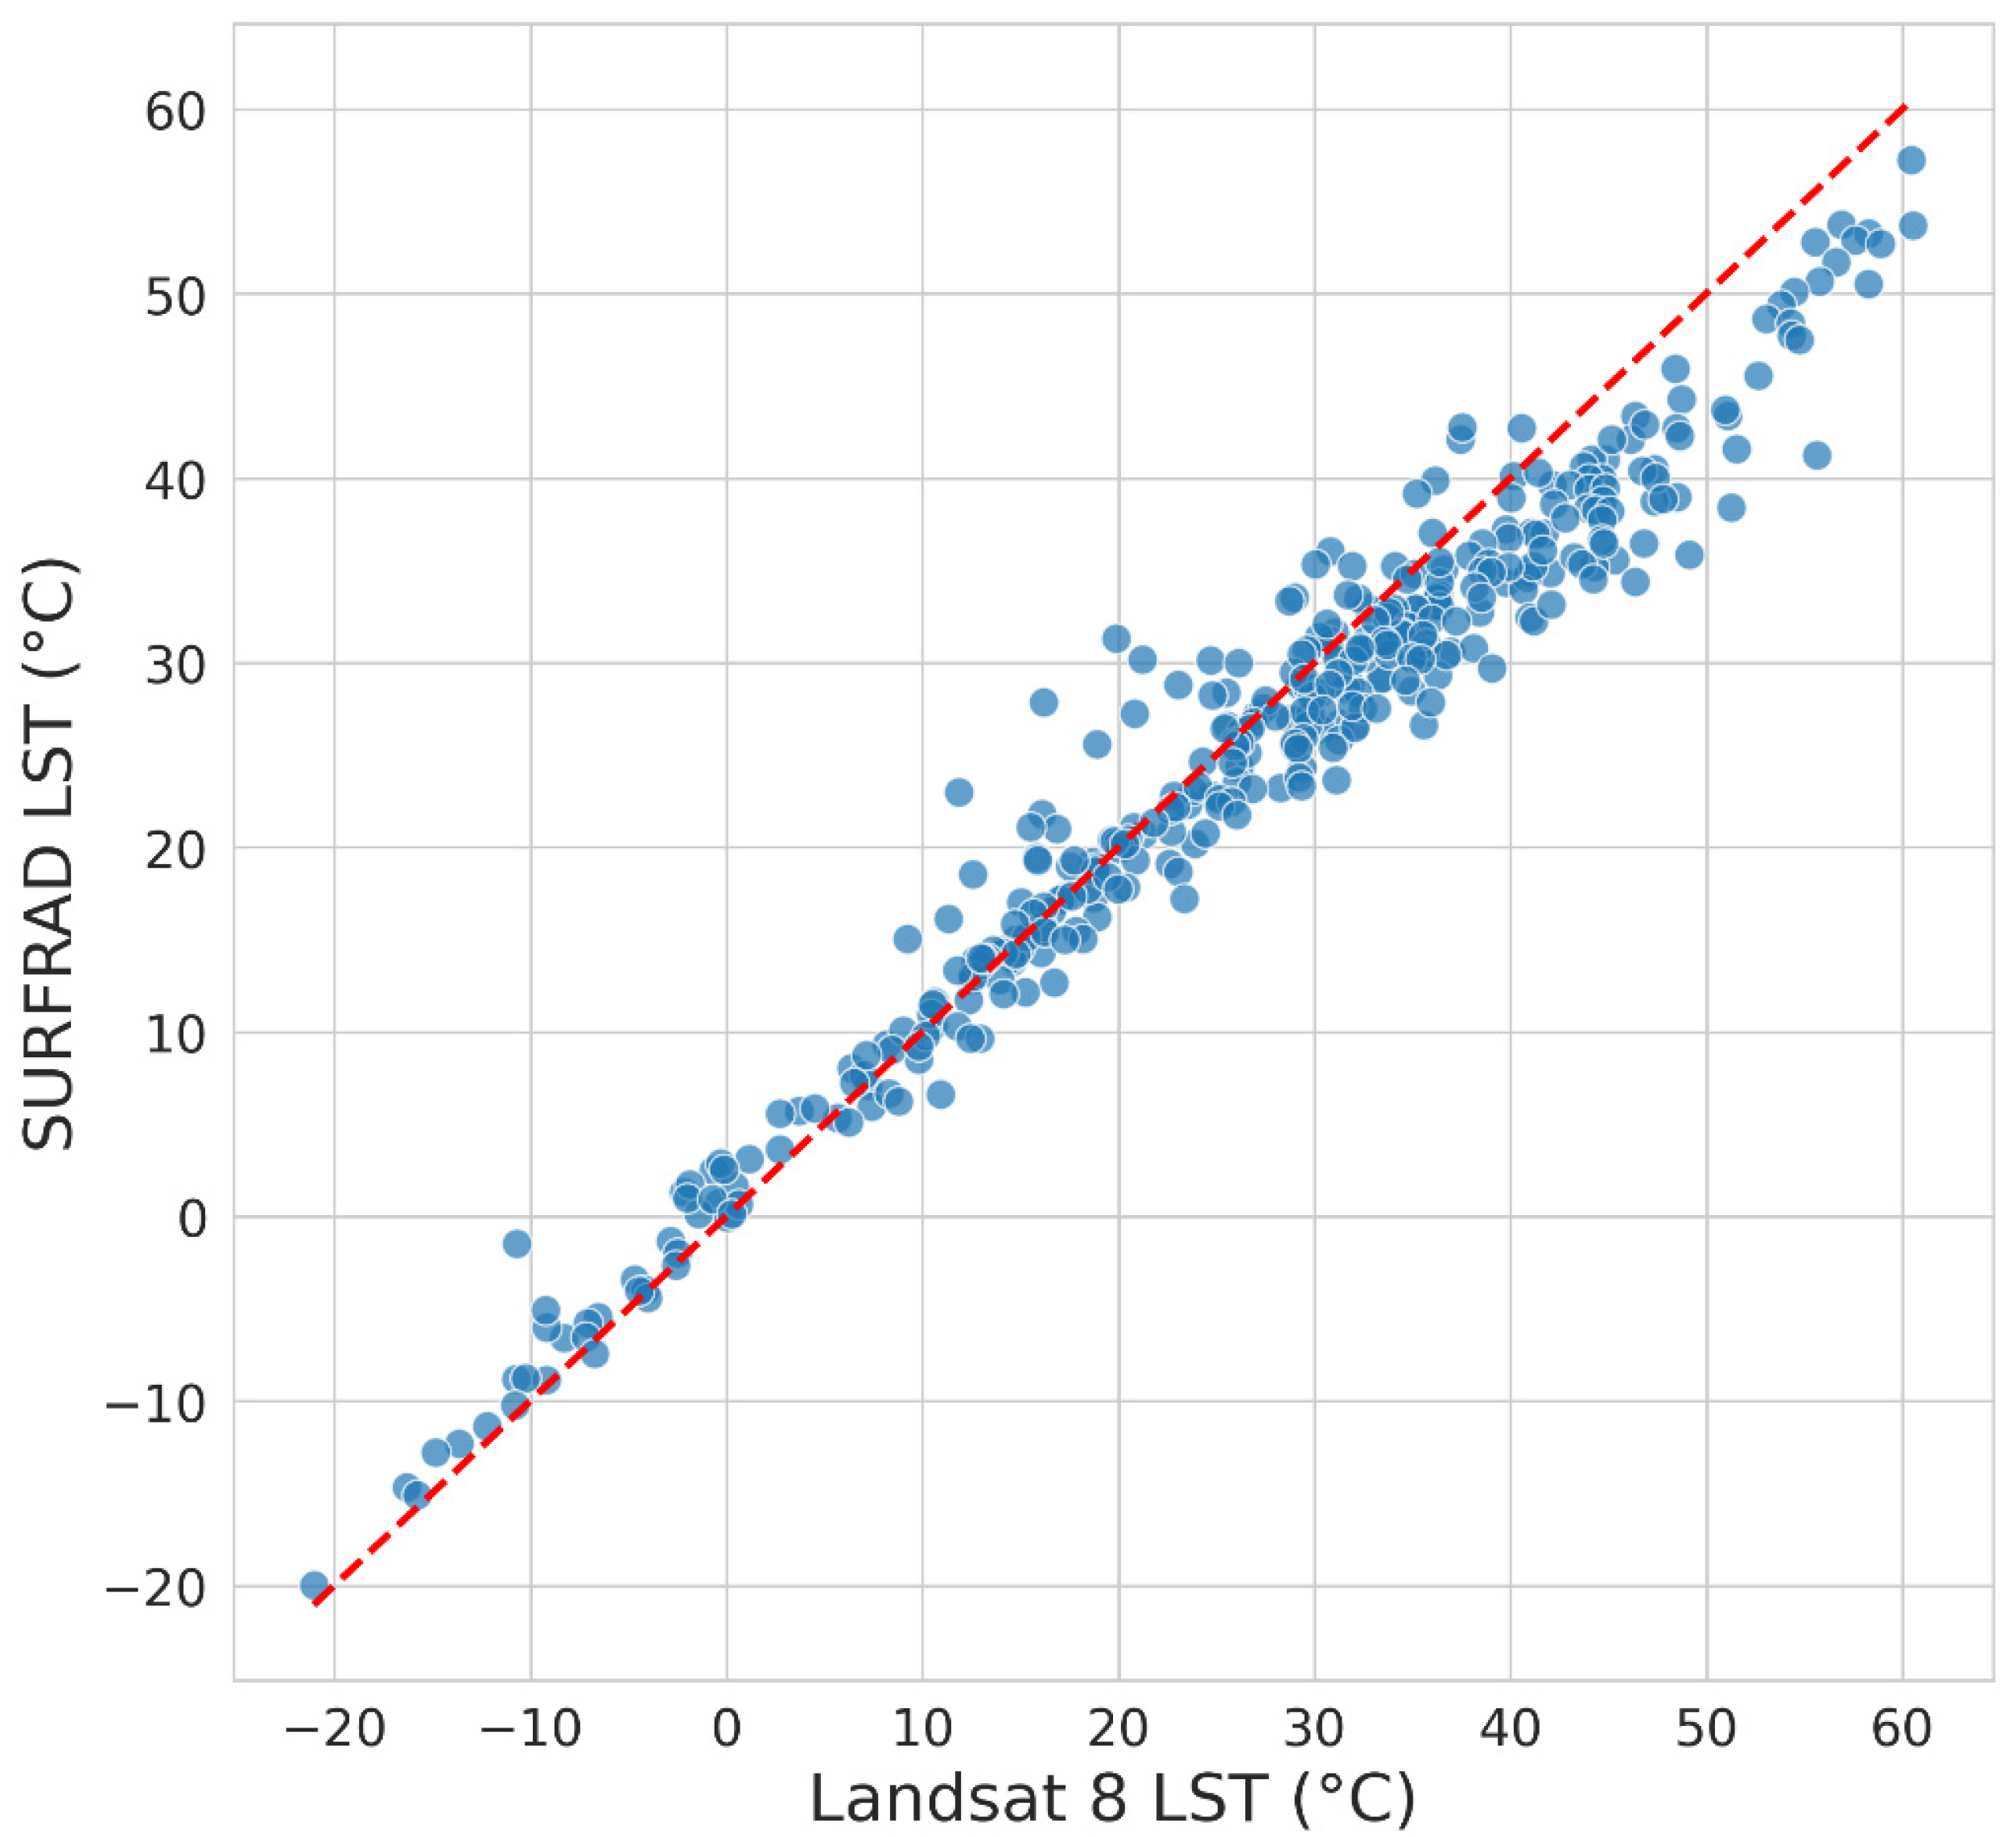
The evaluation of the land surface temperature product extracted from Landsat-8 Collection 2 Level-2 (C2L2) data against ground measurements from SURFRAD stations yielded a coefficient of determination (R2) of 0.91. As illustrated in Figure 2, the Pearson linear correlation coefficient reached 0.98 and the Spearman rank correlation coefficient reached 0.97, both statistically significant at p < 0.001, confirming a very strong relationship between satellite-derived and ground-measured temperatures across the full temperature range examined.
Figure 2.
Scatter plot of the relationship between Landsat-8 surface temperatures and ground measurements from SURFRAD stations with correlation coefficients (Pearson r = 0.98; Spearman ρ = 0.97; R2 = 0.91; p < 0.001).
The RMSE for the complete dataset reached 4.20 °C, while the MAD recorded a lower value of 3.19 °C, indicating that most errors are concentrated within a moderate range. The maximum absolute difference reached 14.39 °C, representing the largest single-observation deviation in the dataset, and the median absolute difference was 2.57 °C.
Analysis of systematic bias revealed a positive mean error of 1.75 °C, indicating a general tendency of the Landsat-8 C2L2 product to overestimate surface temperatures relative to ground measurements. The standard deviation of error reached 3.82 °C, the 95th percentile of absolute error was 8.88 °C, and the Willmott agreement index (d) reached 0.98.
3.2. Accuracy Assessment by Error Categories and Distribution Across Stations
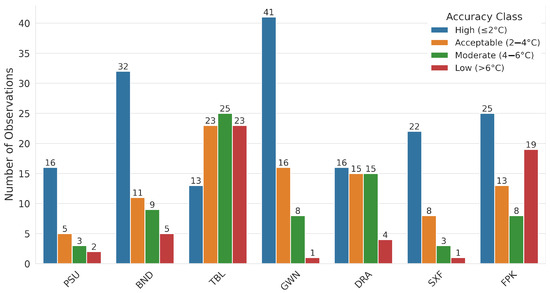
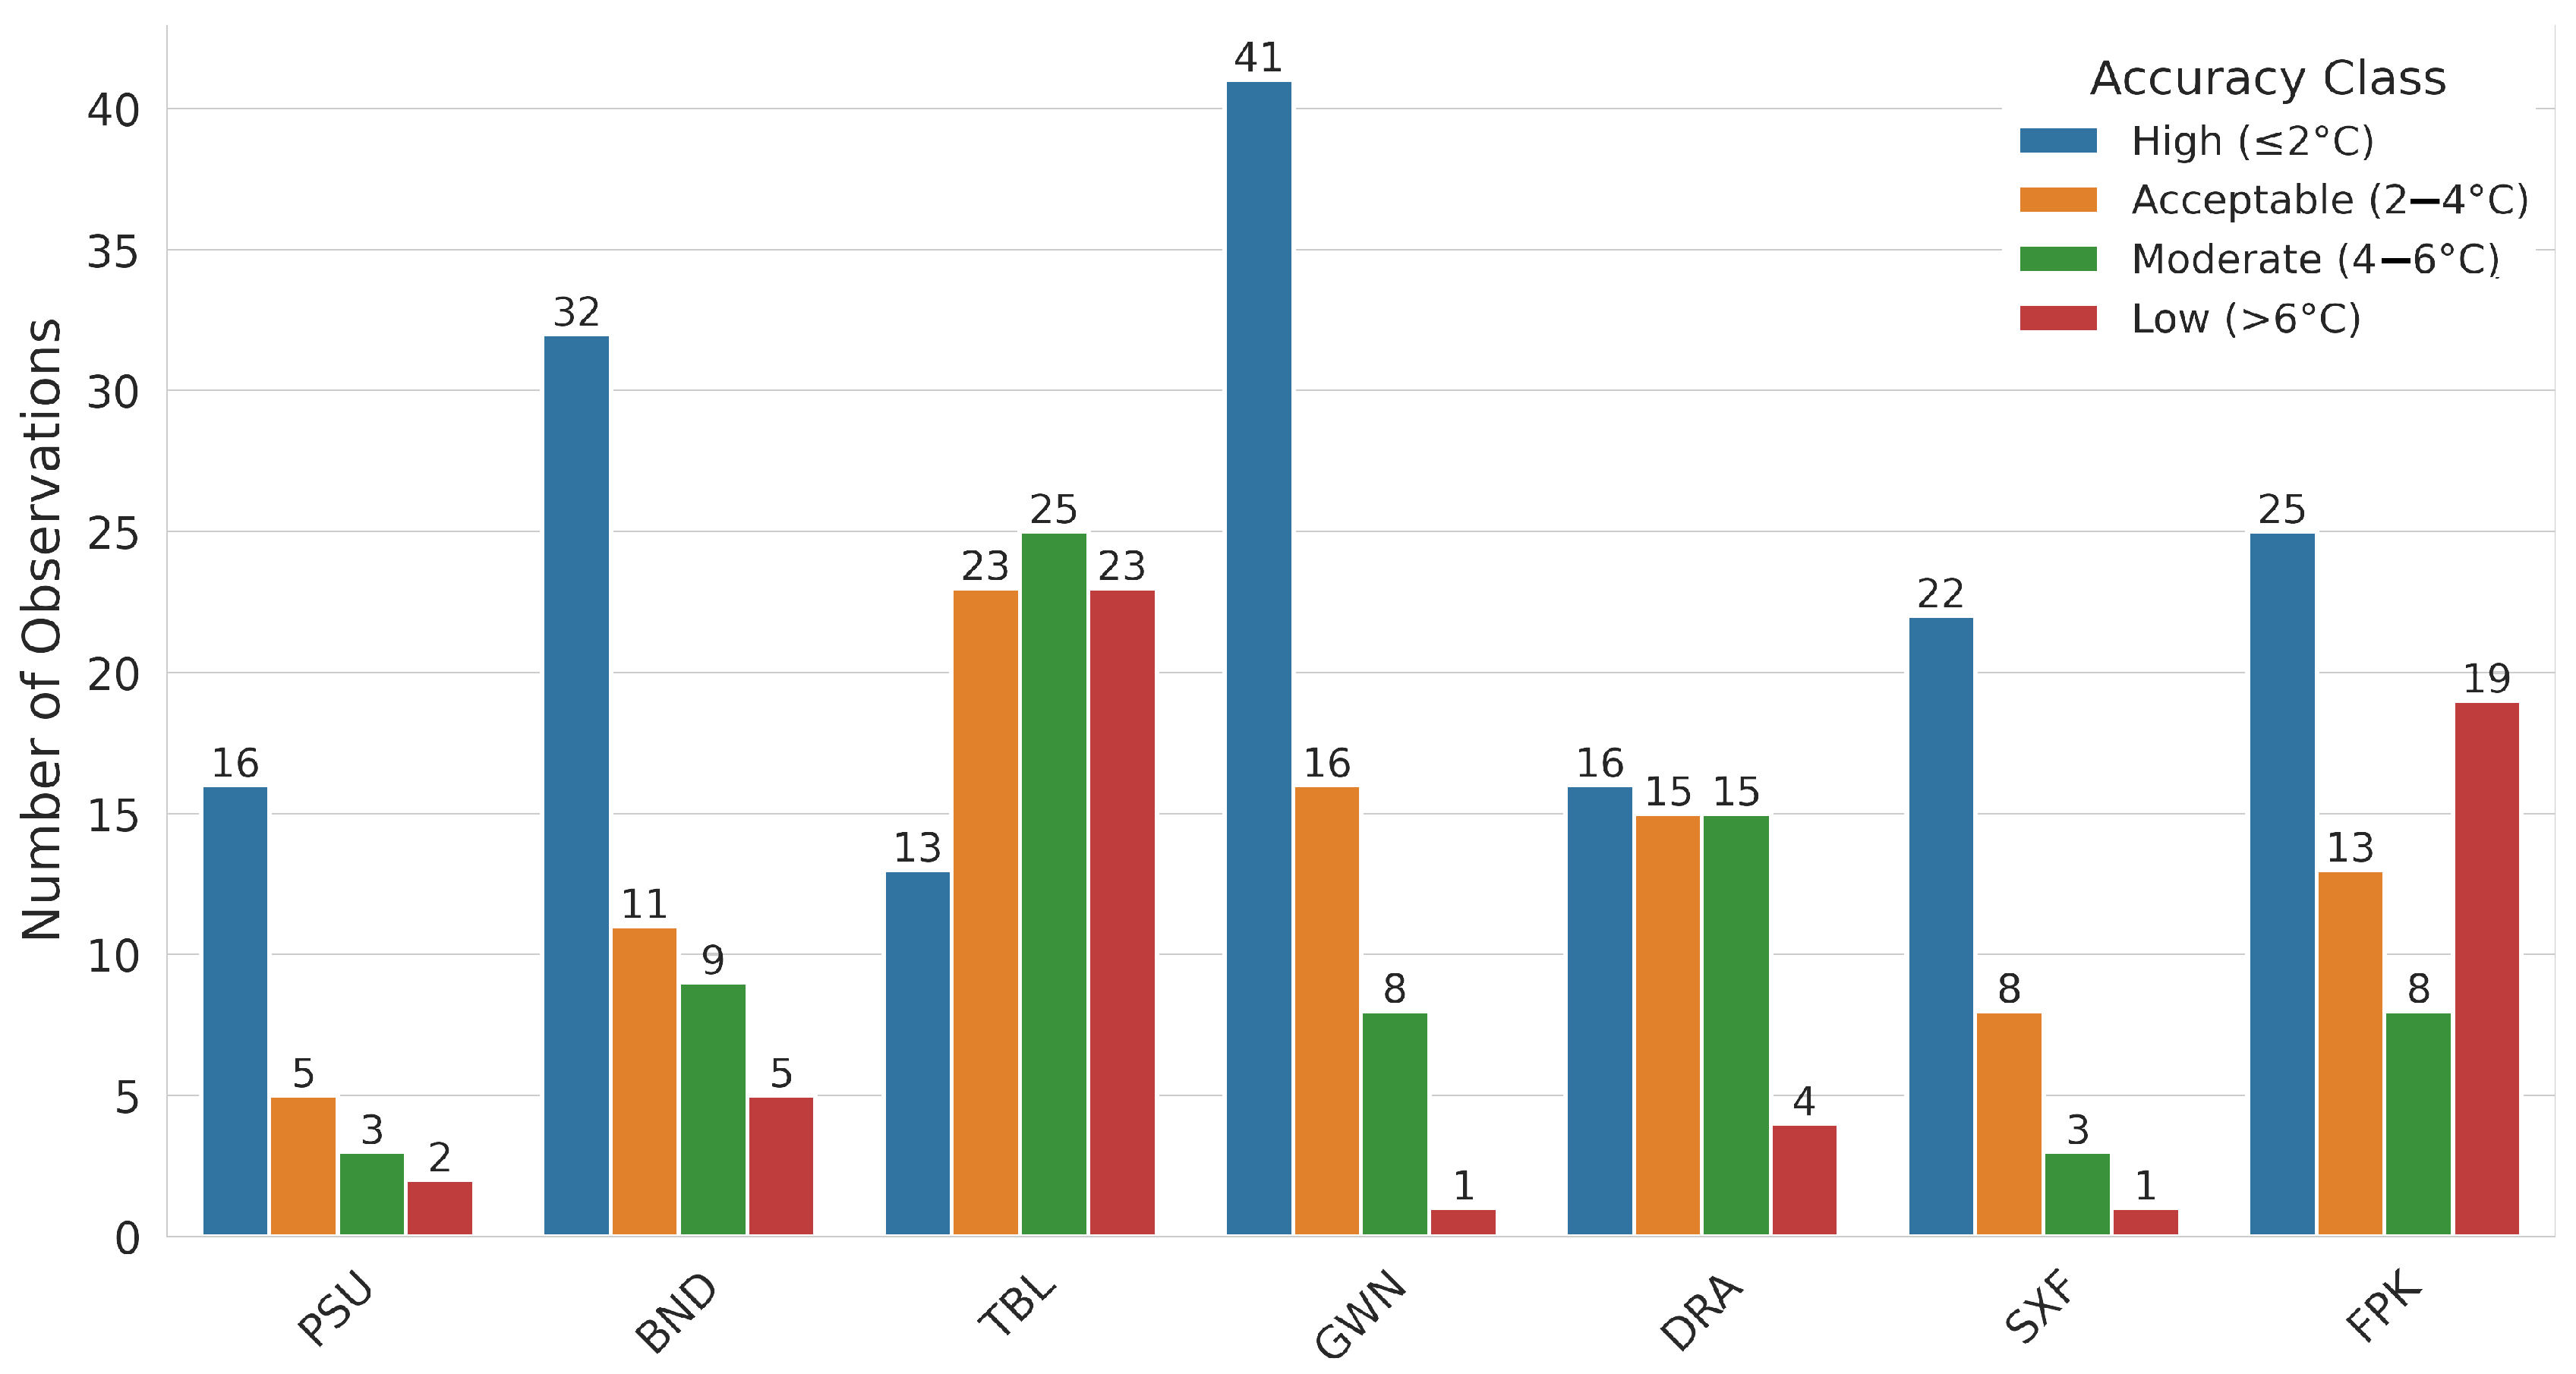
Analysis of the 382 measurements classified according to the accuracy categories shown in Figure 3 revealed the following distribution: 165 measurements (42.9%) achieved high accuracy with absolute error ≤ ±2 °C; 91 measurements (23.6%) recorded acceptable accuracy (2–4 °C); 71 measurements (18.4%) fell within the moderate accuracy category (4–6 °C); and 55 measurements (14.3%) were classified as low accuracy (>6 °C). In total, approximately 66.5% of measurements achieved high or acceptable accuracy.
Figure 3.
Distribution of accuracy categories for Landsat-8 Level-2 LST measurements across the seven SURFRAD stations.
Spatial analysis across the seven stations revealed clear variation in performance. GWN station in Mississippi recorded the highest count of high-accuracy measurements (41 out of 66 observations), followed by BND station in Illinois (32/57) and TBL station in Colorado (13/84 despite having the largest dataset). SXF station in South Dakota achieved 22 high-accuracy measurements out of 34 observations, while FPK station in Montana recorded 25 out of 65, and PSU and DRA stations each recorded 16 high-accuracy measurements from 26 and 50 observations respectively.
In the acceptable accuracy category, TBL station led with 23 measurements, followed by GWN (16), DRA (15), FPK (13), and BND (11), while SXF and PSU recorded the lowest counts at 8 and 5 respectively. In the moderate accuracy category, TBL again led with 25 measurements, followed by DRA (15), BND (9), GWN and FPK (8 each), and SXF and PSU (3 each). In the low accuracy category, TBL recorded the highest number of cases (23), followed by FPK (19), BND (5), DRA (4), PSU (2), and GWN and SXF (1 each).
3.3. Performance Assessment by Seasonal Periods
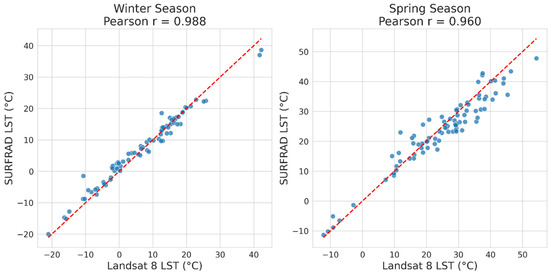
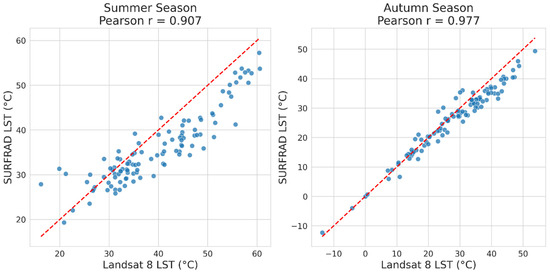
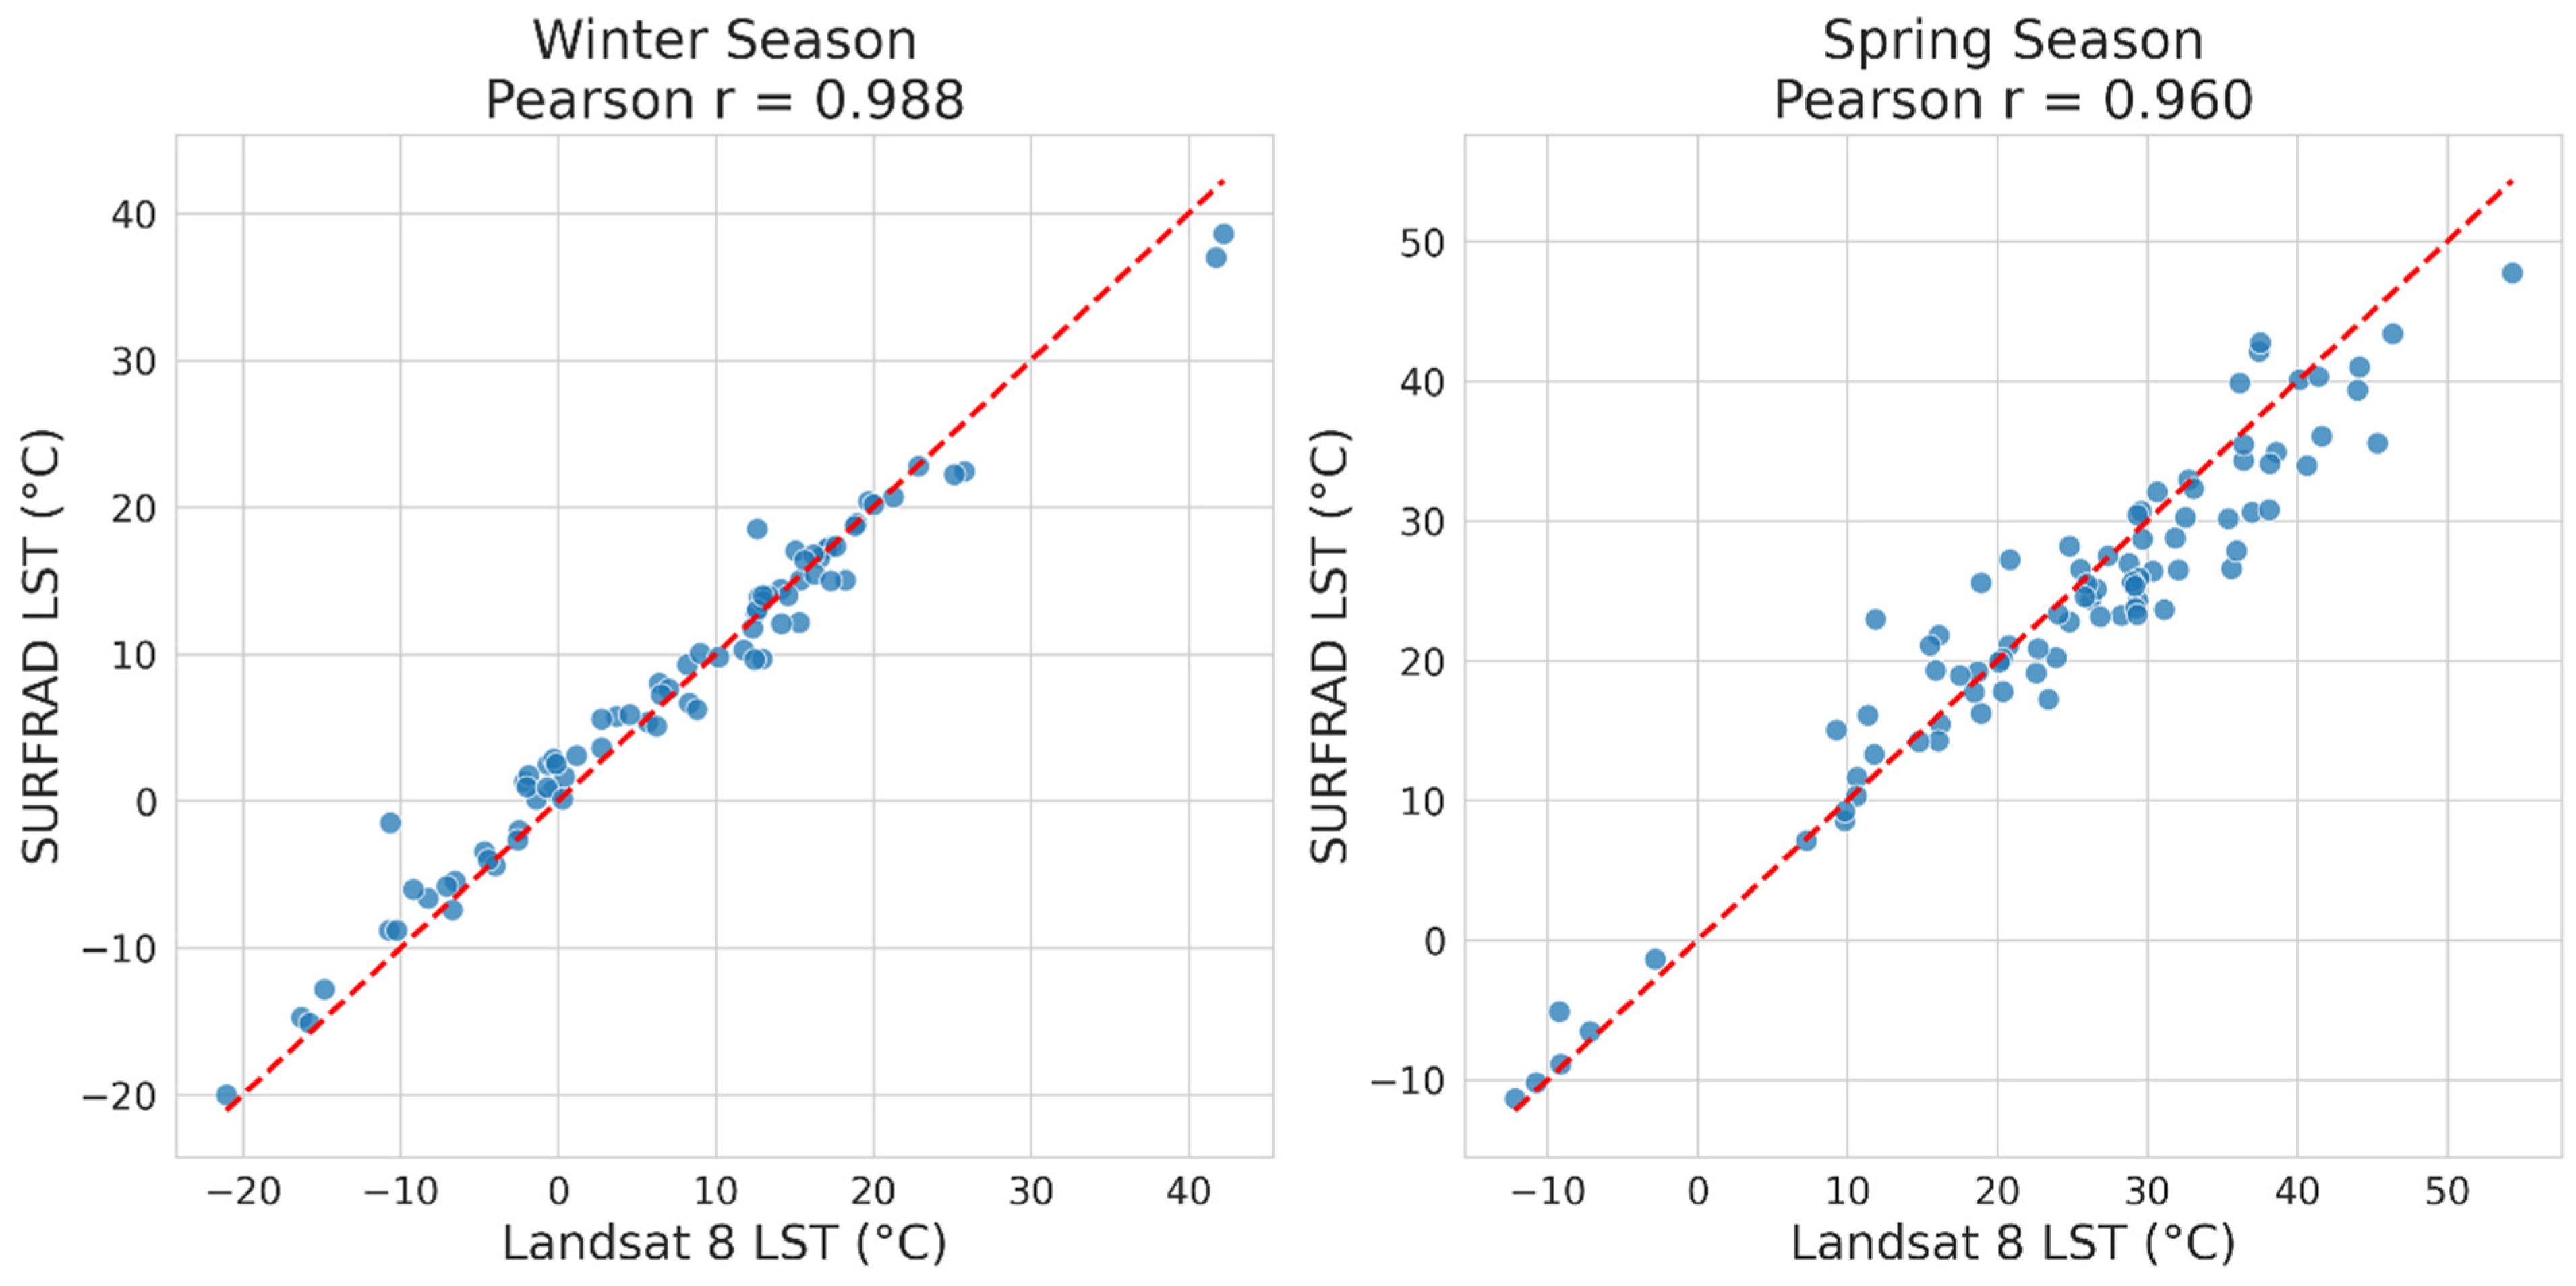
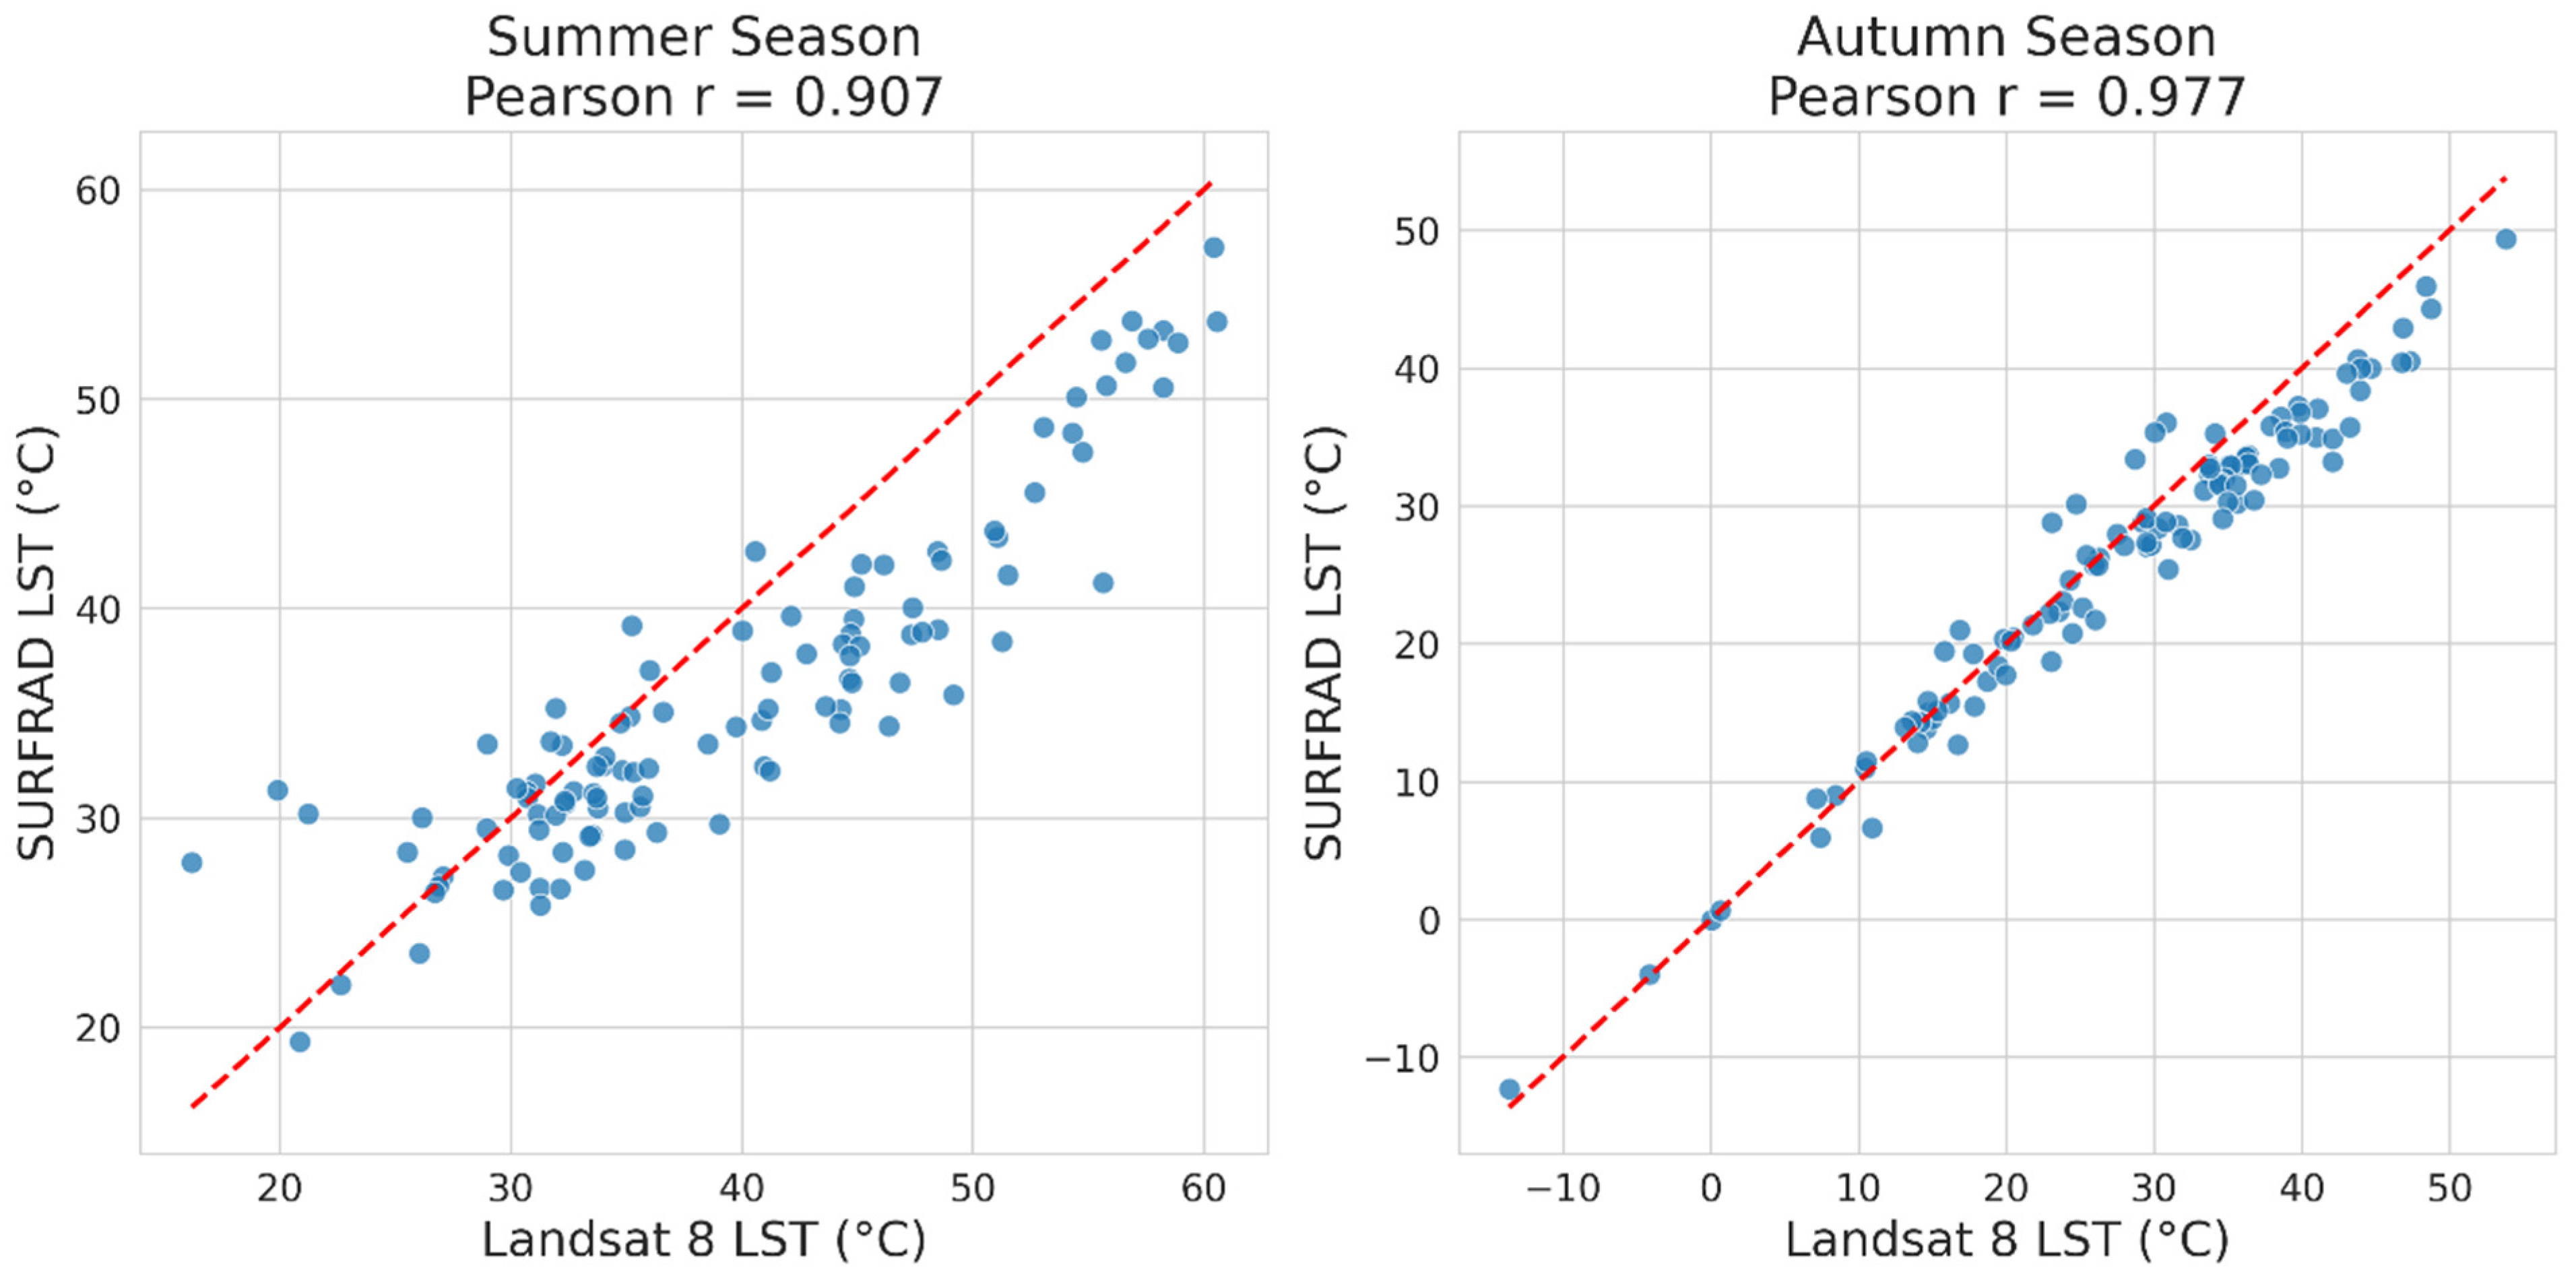
Figure 4 illustrates the seasonal analysis of Landsat-8 C2L2 product performance across the four seasons. Winter achieved the best overall performance with the lowest RMSE of 2.174 °C (n = 79), a Pearson correlation coefficient of 0.988, MAD of 1.581 °C, maximum absolute difference of 9.184 °C, and R2 of 0.960. Fall ranked second with RMSE of 3.396 °C (n = 108), Pearson r = 0.977, MAD of 2.720 °C, maximum absolute difference of 8.896 °C, and R2 of 0.904. Spring occupied third position with RMSE of 4.042 °C (n = 86), Pearson r = 0.960, MAD of 3.149 °C, maximum absolute difference of 11.135 °C, and R2 of 0.885.
Figure 4.
Seasonal scatter plots of the relationship between Landsat-8 C2L2 temperatures and ground measurements.
Summer recorded the weakest performance among all seasons, with an RMSE of 5.838 °C (n = 109)—more than double the winter value—Pearson r of 0.907, MAD of 4.536 °C, and R2 of 0.449. Summer also recorded the maximum absolute difference in the entire study, reaching 14.388 °C. RMSE values across the four seasons follow a clear gradient increasing from winter through fall, spring, and summer.
3.4. Performance Assessment by Temperature Ranges
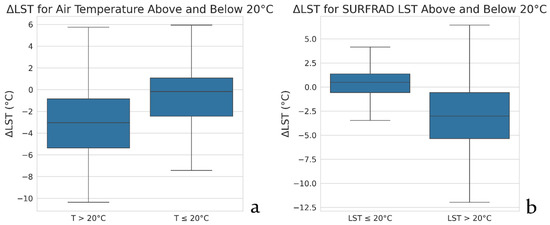
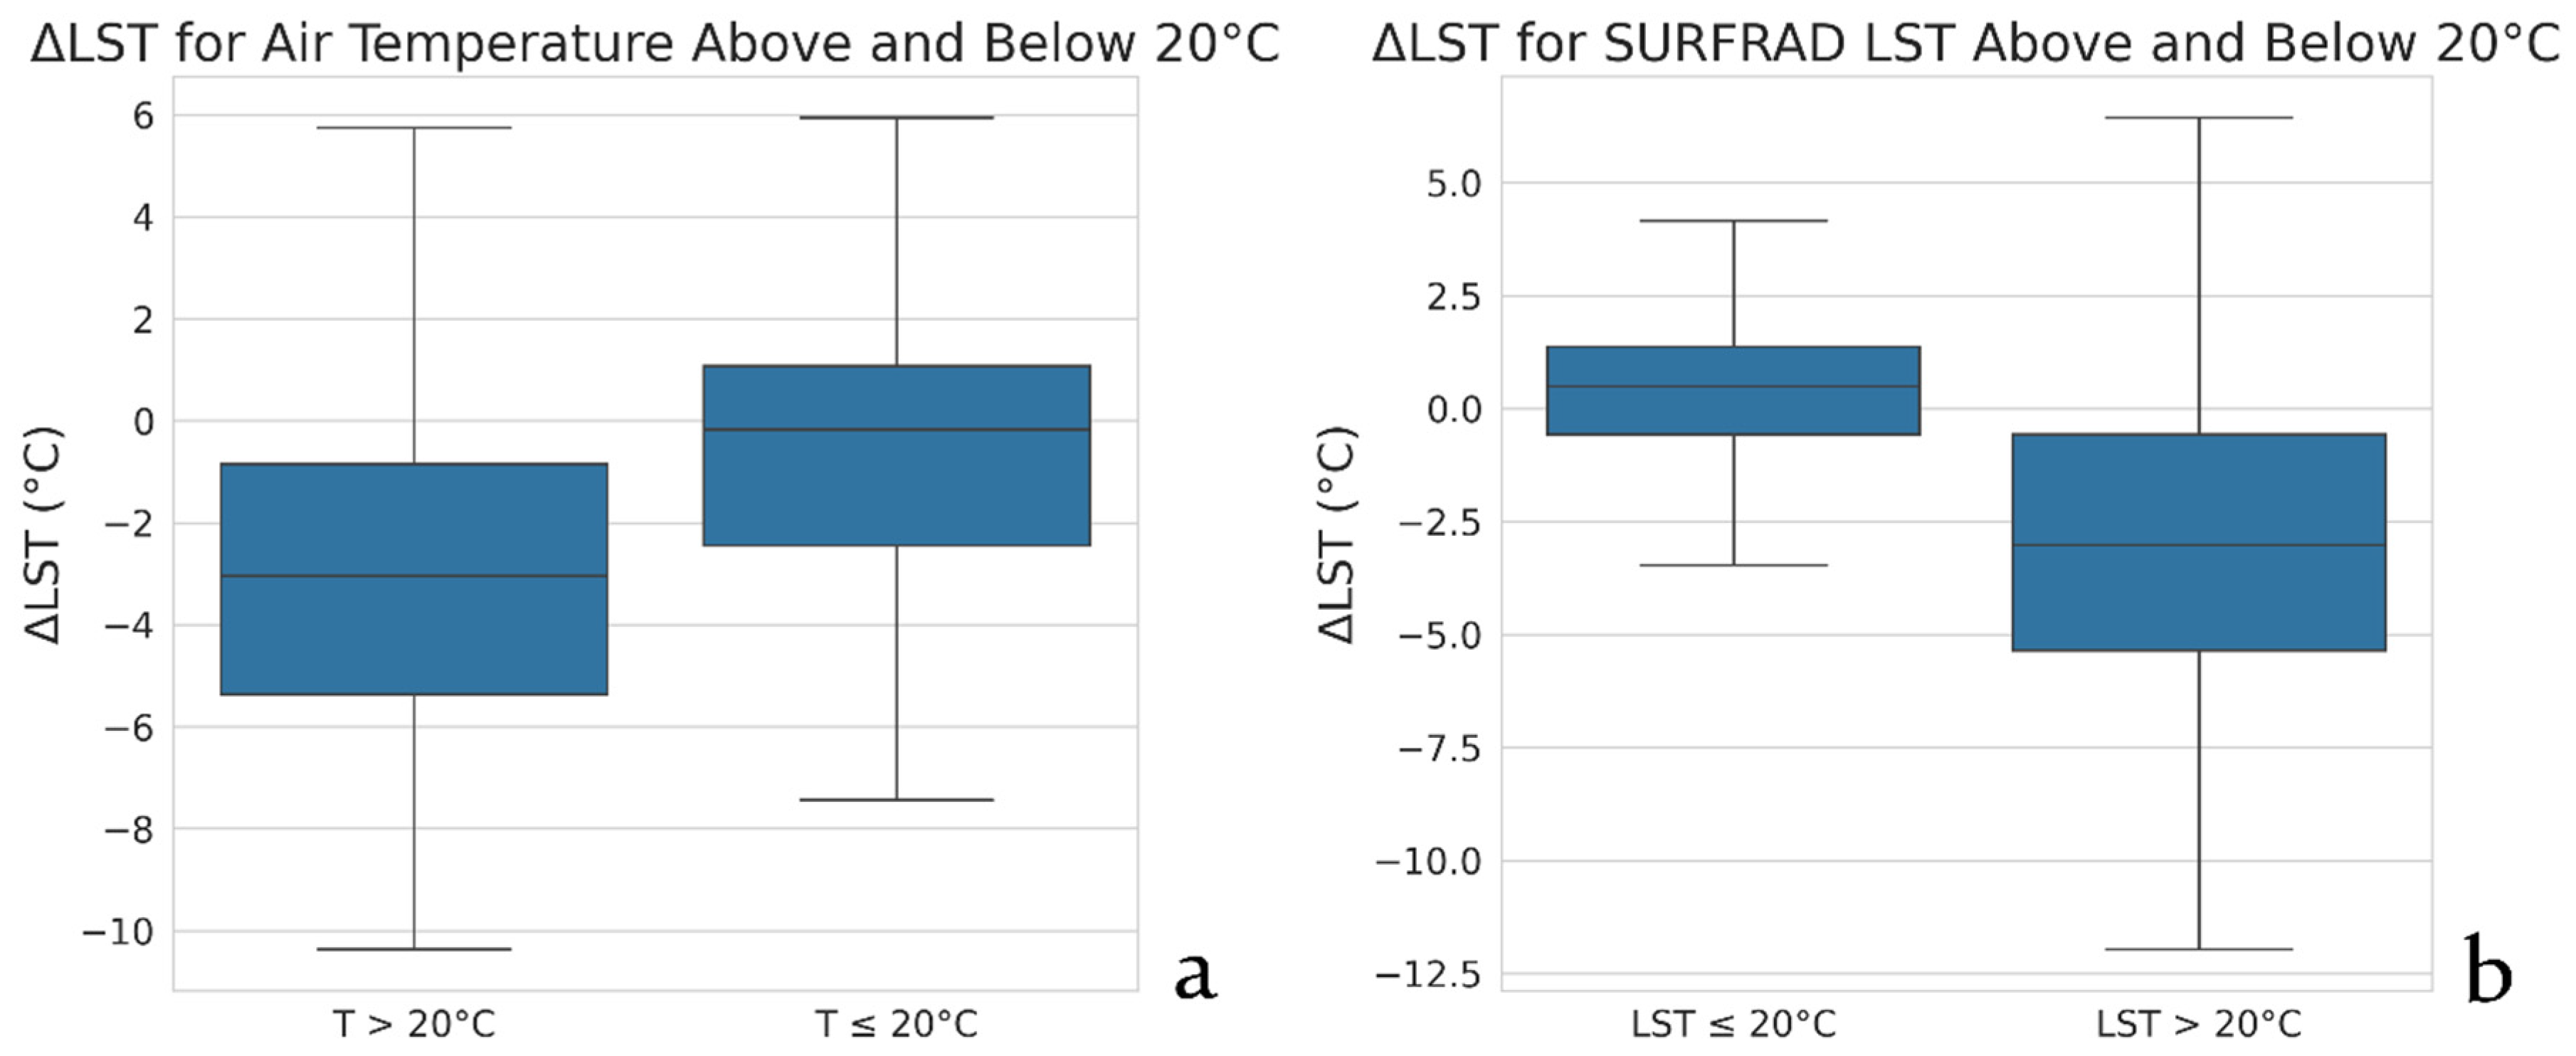
Figure 5 presents the distribution of differences between Landsat-8 and SURFRAD ground measurements classified by air temperature and land surface temperature ranges. For air temperatures ≤ 20 °C, the statistical median was close to zero or slightly positive, with an interquartile range of approximately −2 to +1 °C and outliers extending from approximately −7 to +6 °C. For air temperatures > 20 °C, the median shifted to approximately −3 °C, the interquartile range widened to −5 to 0 °C, and outliers reached approximately −10 °C at the lower limit and +6 °C at the upper limit.
Figure 5.
Box plot showing the distribution of differences between space-based and ground measurements according to air (a)/surface (b) temperature ranges extracted from SURFRAD stations.
When classified by land surface temperature, measurements with LST ≤ 20 °C showed a narrower interquartile range of −0.5 to +1.5 °C, outliers from approximately −3.5 to +4 °C, and a median close to zero. For LST > 20 °C, the median remained at approximately −3 °C while outliers became more dispersed, reaching approximately −12 °C at the lower limit and exceeding +6 °C at the upper limit. Across both classification approaches, high-temperature ranges consistently exhibited increased absolute differences, wider scatter, and pronounced negative bias compared to low-temperature ranges.
3.5. Analysis of Difference Trends Between Space-Based and Ground Measurements
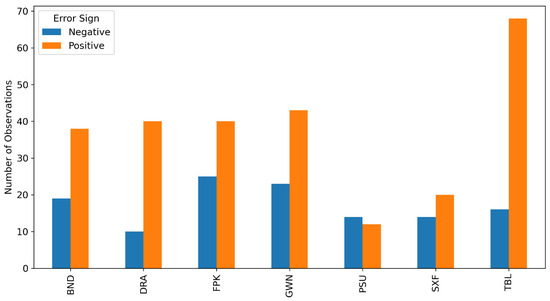
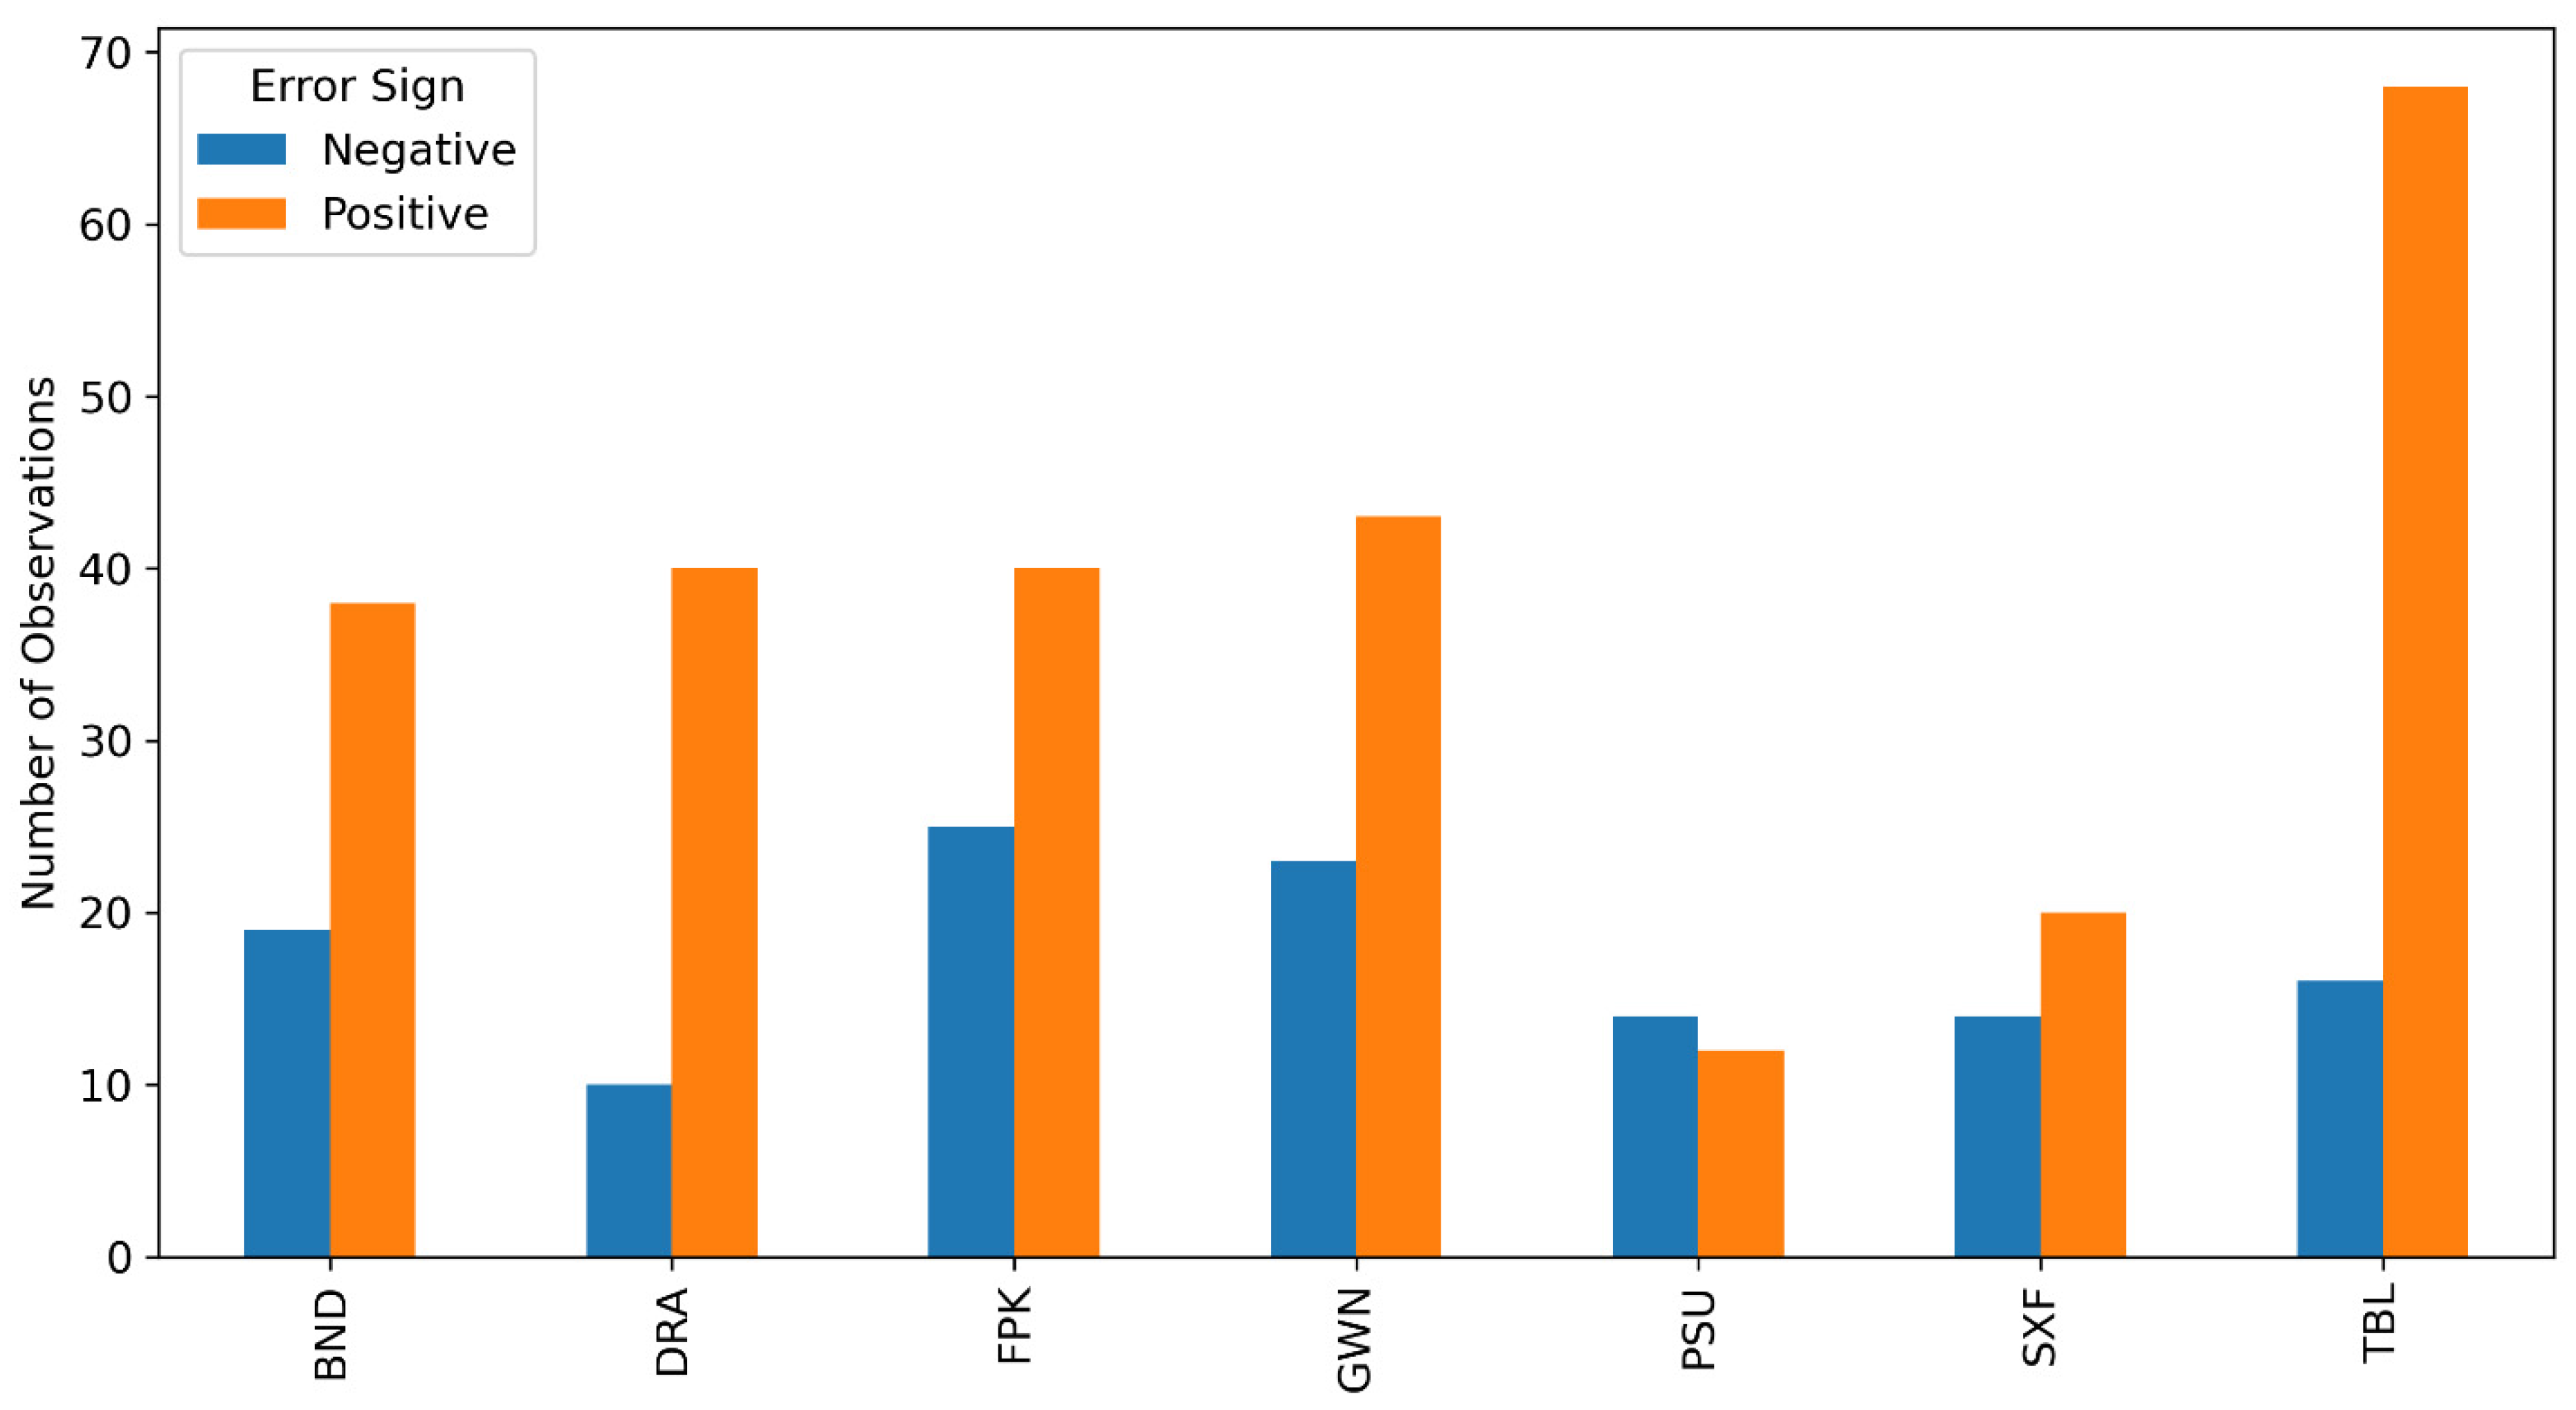
Figure 6 presents the distribution of positive and negative differences between Landsat-8 measurements and SURFRAD ground measurements across all stations. Out of 382 valid measurements, 261 (68.3%) recorded positive differences where Landsat-8 values were higher than ground measurements, while 121 (31.7%) recorded negative differences.
Figure 6.
Distribution of difference trends (positive and negative) between Landsat-8 measurements and ground measurements across the seven stations.
TBL station in Colorado showed the most pronounced overestimation pattern, with 27 positive cases versus only 5 negative cases (84.4% overestimation). GWN station followed with 19 positive versus 7 negative cases, then DRA and FPK stations each with 12 positive and 6 negative cases, and BND station with 11 positive versus 6 negative cases. SXF station recorded a more balanced distribution with 8 positive versus 4 negative cases. PSU station in Pennsylvania was the only station where underestimation predominated, recording 8 negative cases versus only 4 positive cases.
3.6. Performance Evaluation by Ground Stations
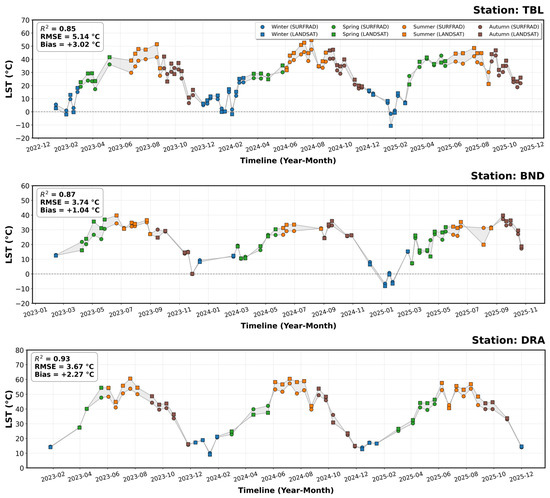
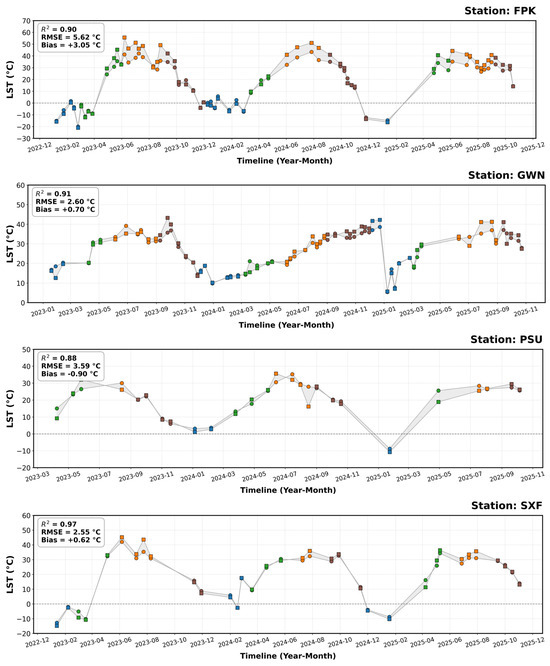
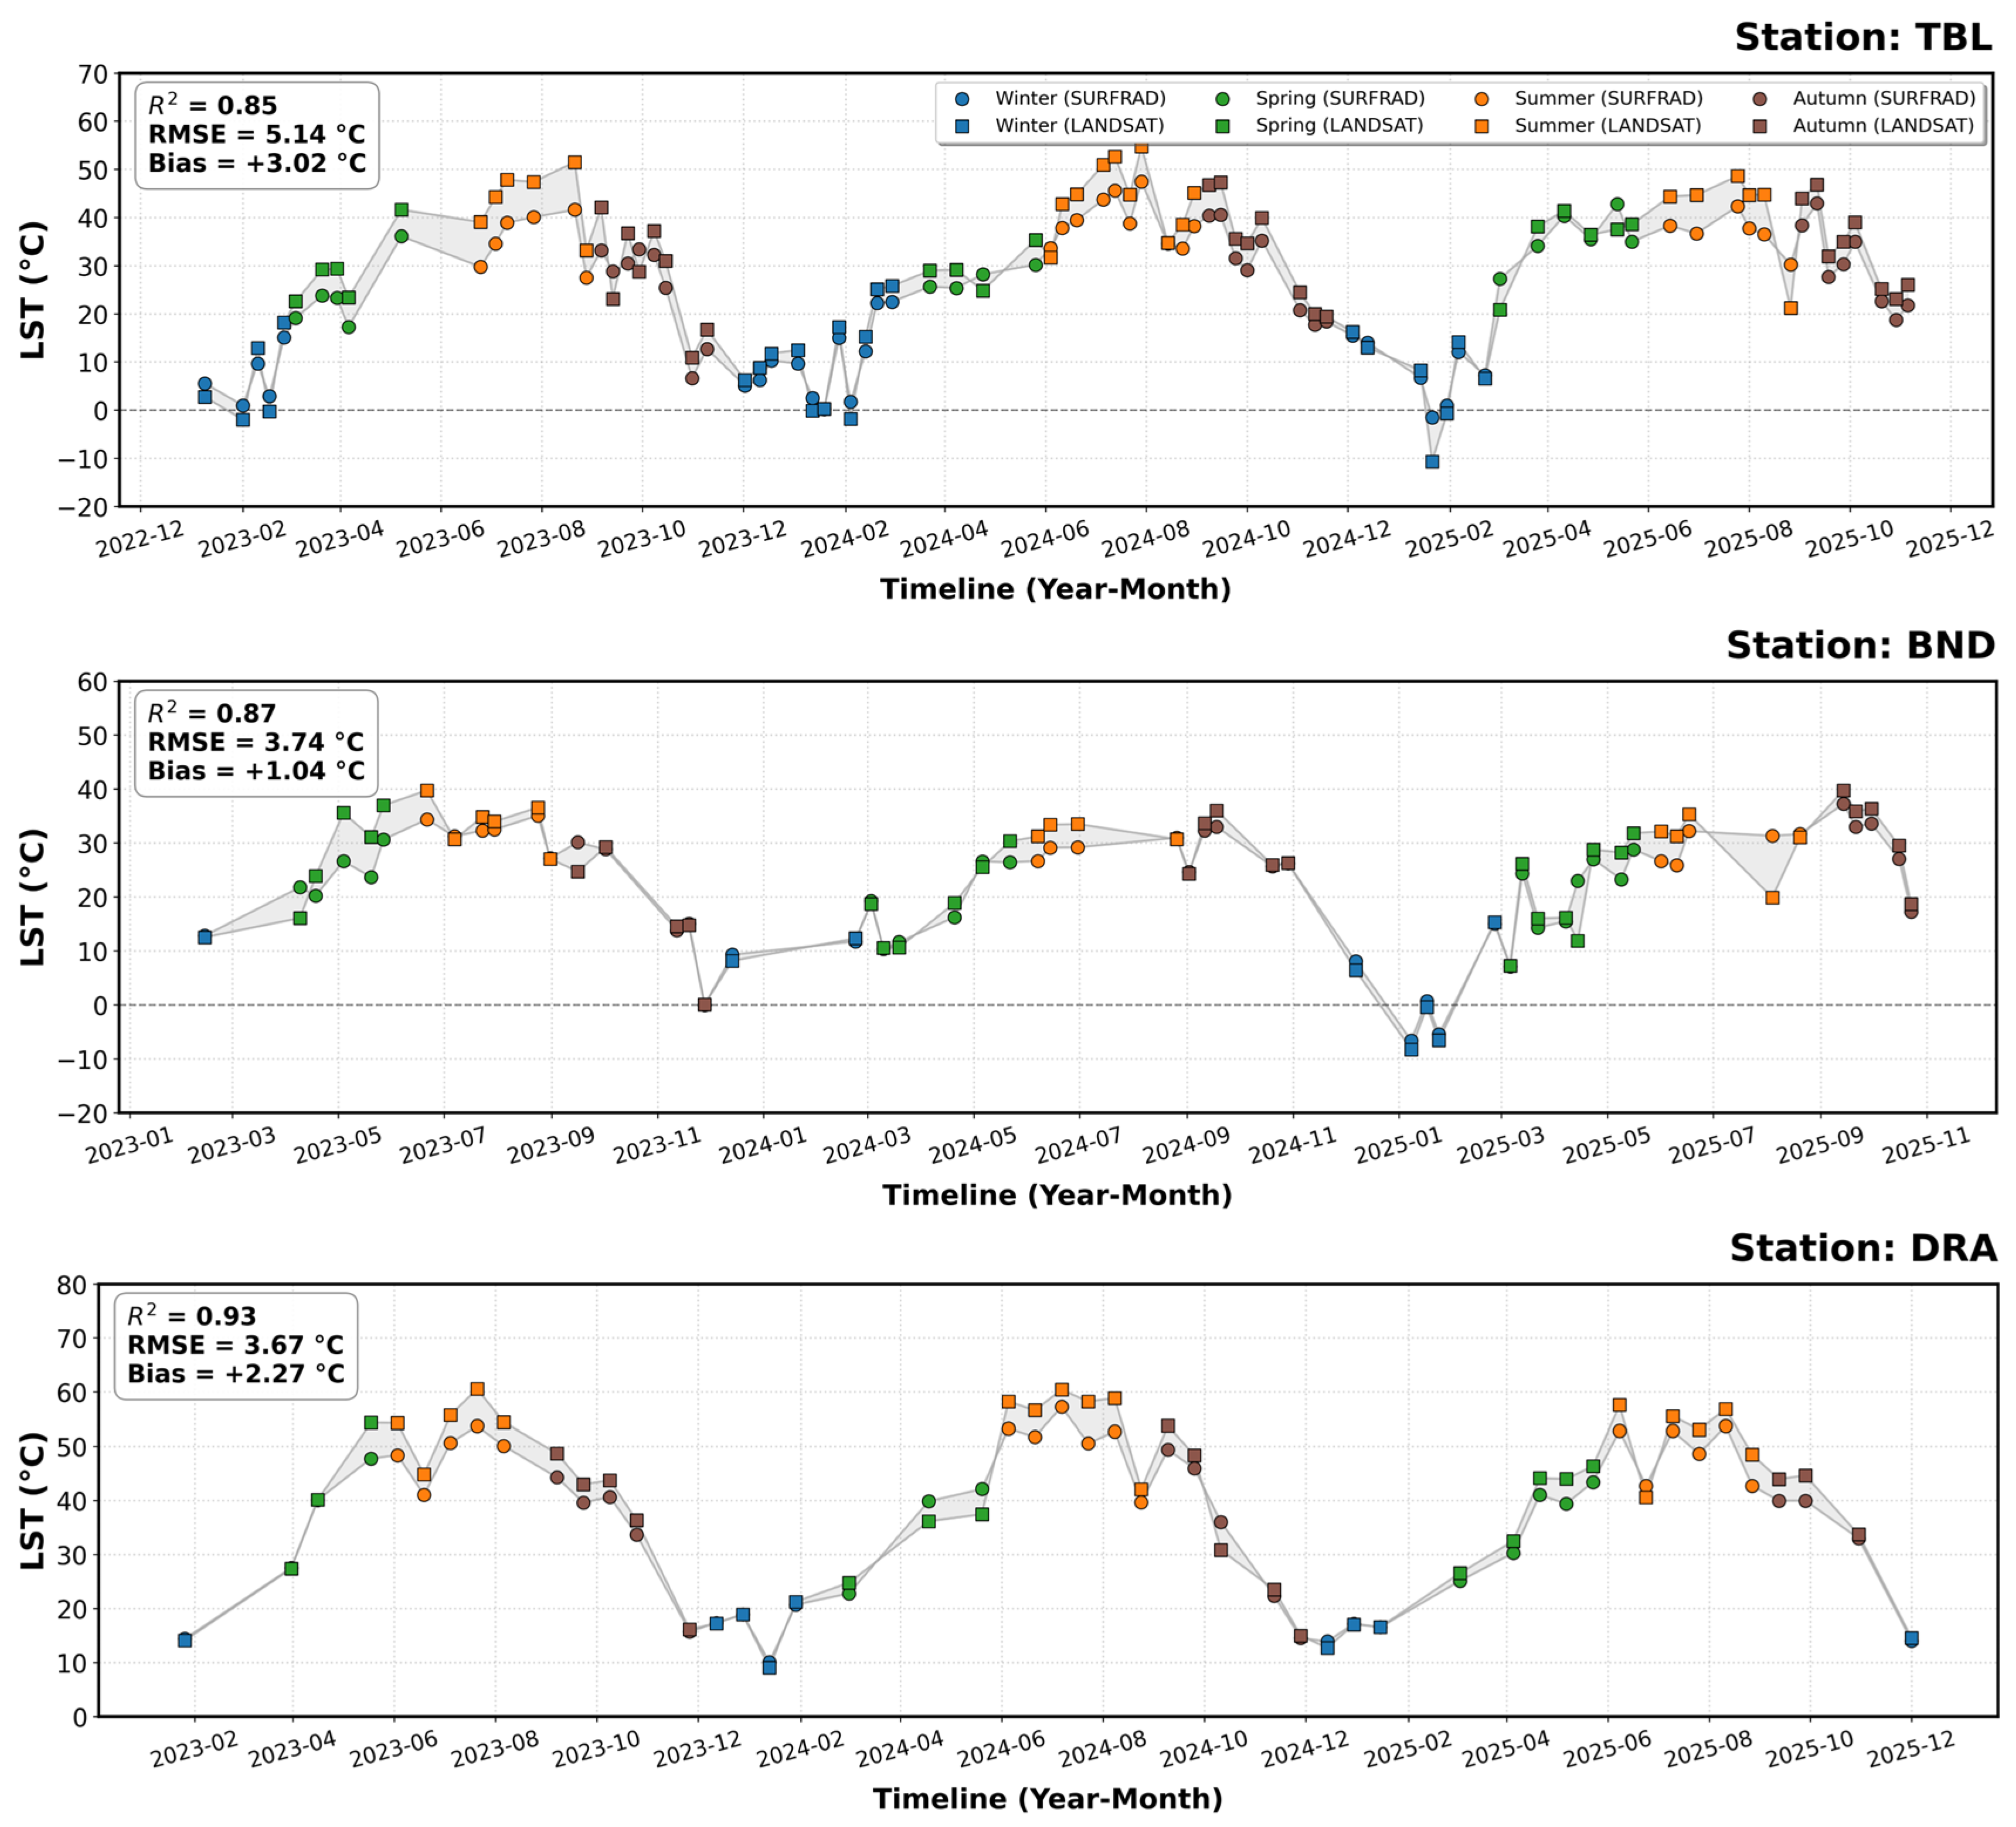
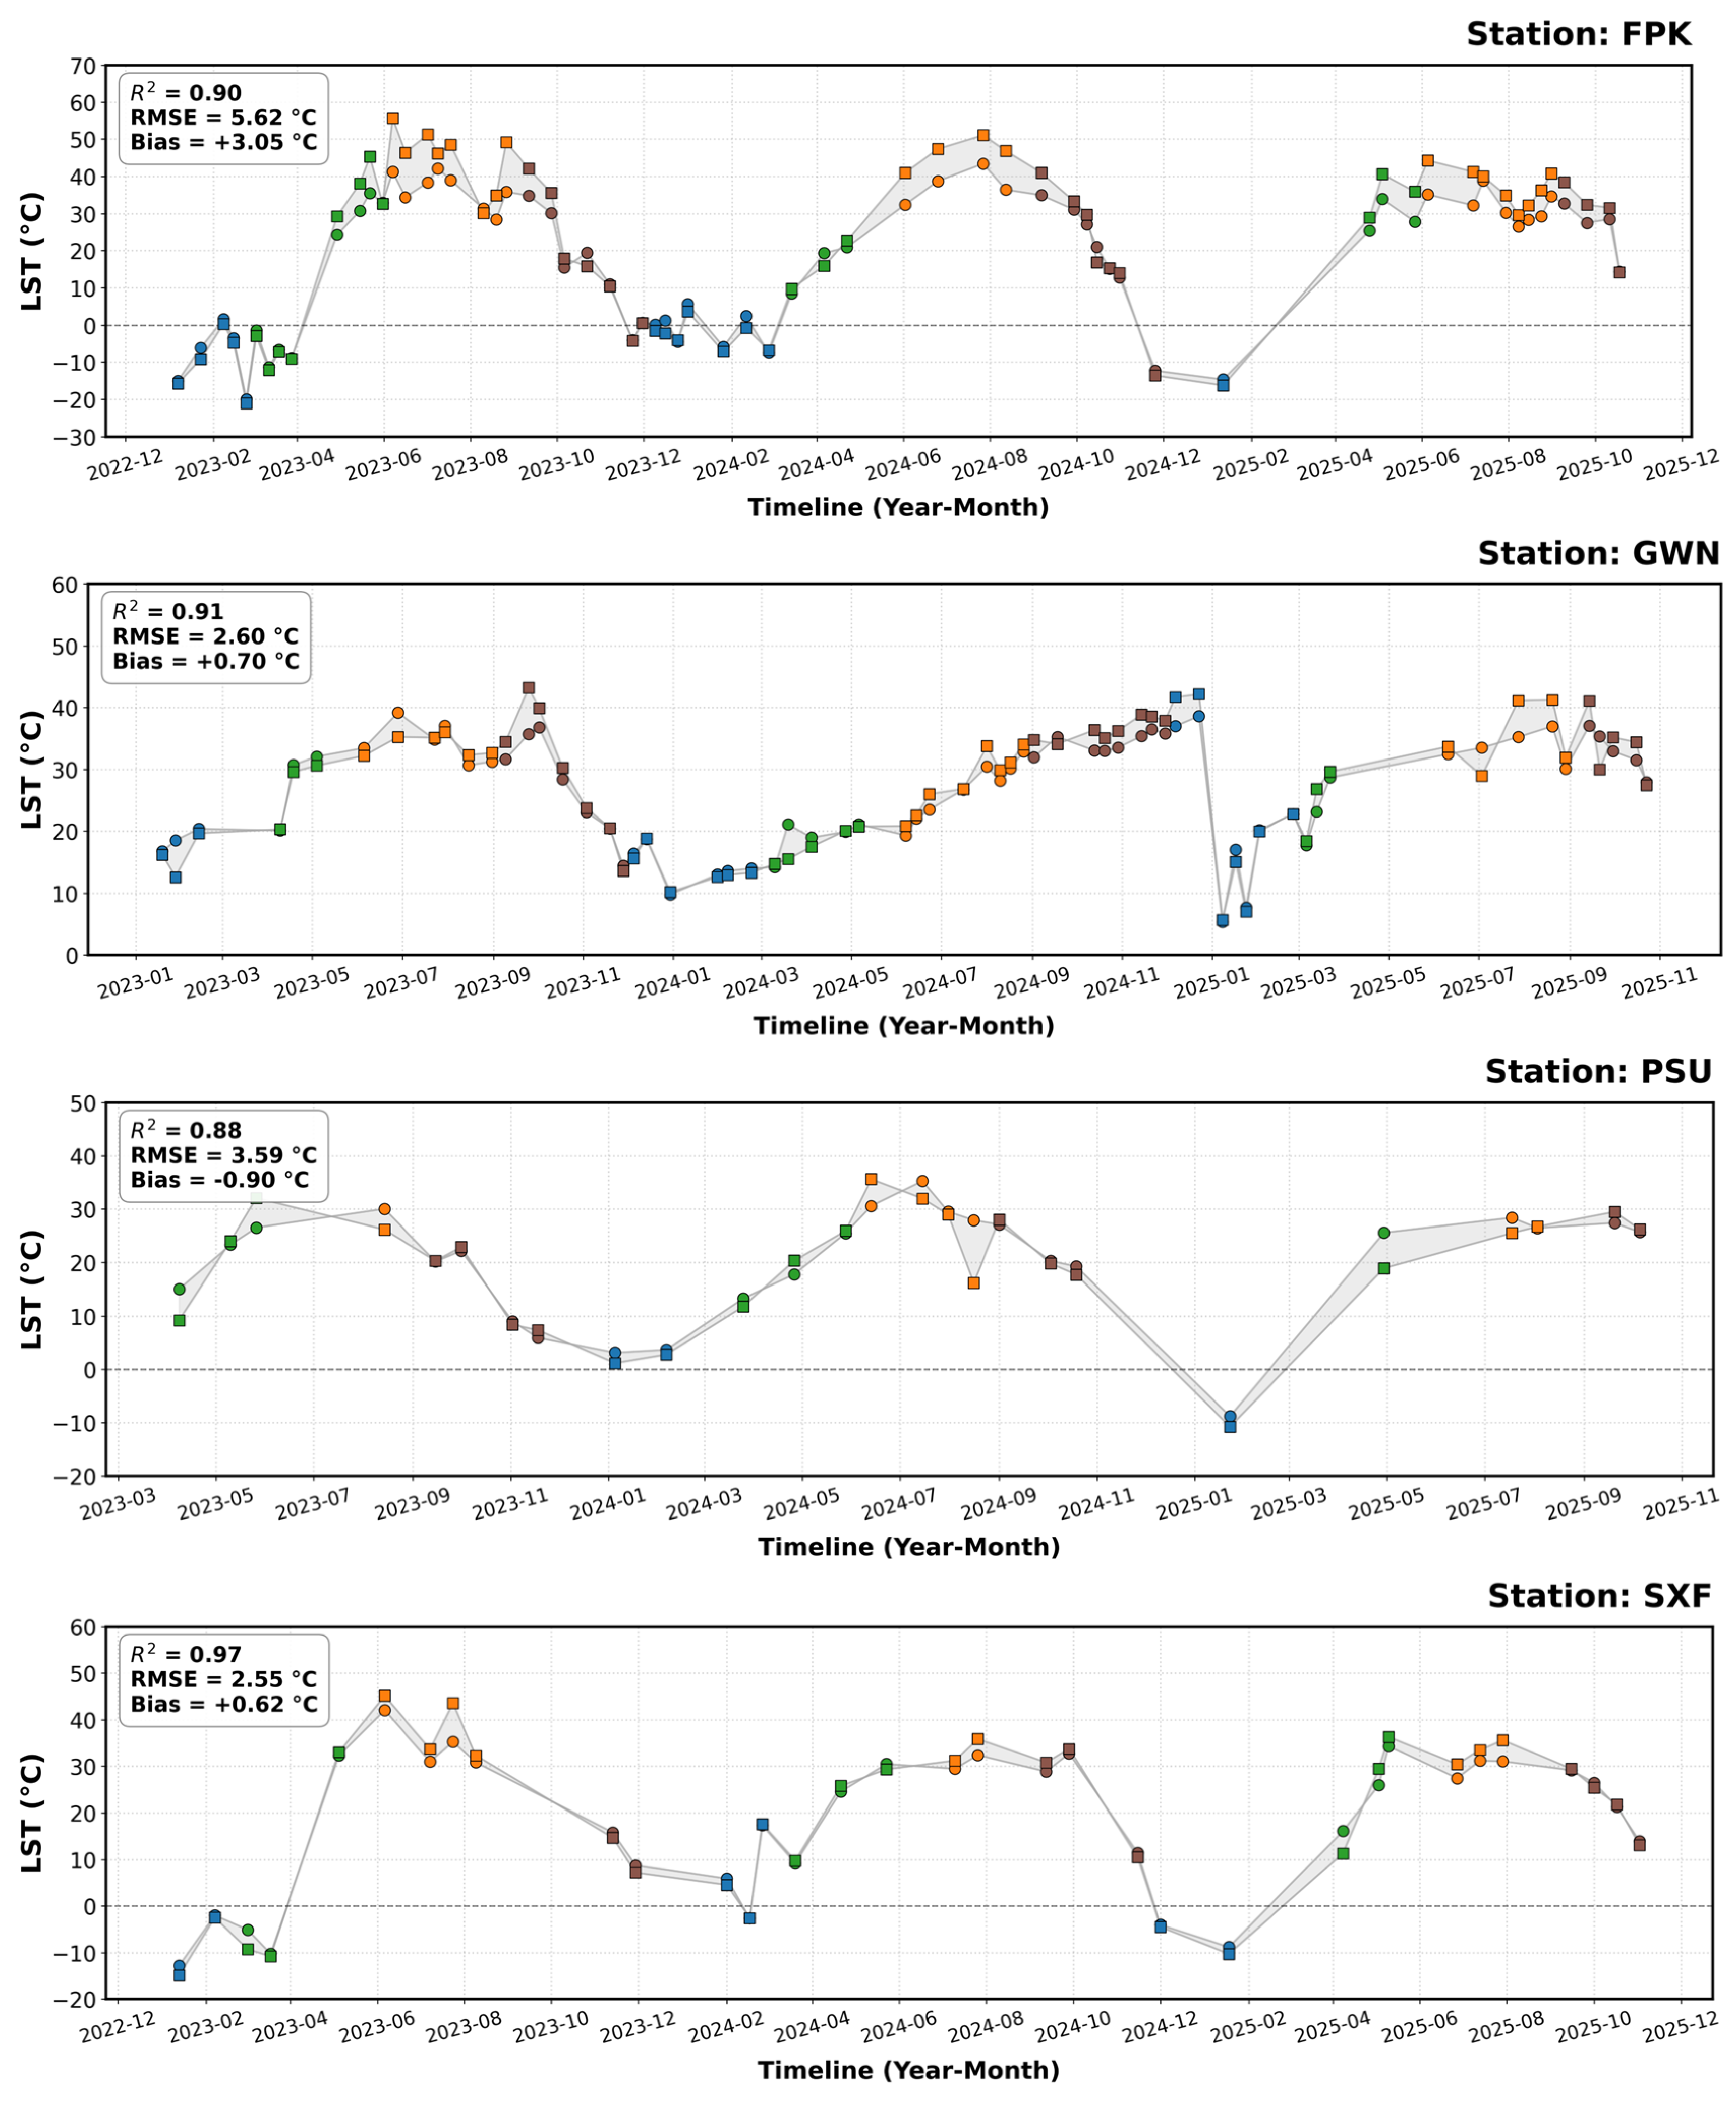
Table 3 presents the statistical indicators of Landsat-8 C2L2 LST accuracy for each of the seven SURFRAD validation stations. Figure 7 provides a visual comparison of satellite-derived and in situ surface temperatures at each station, incorporating seasonal variability. Overall retrieval accuracy across stations ranged from approximately 85% to 97%. Positive bias was evident at nearly all stations; PSU station was the only exception, exhibiting a negative bias of approximately −0.9 °C.
Table 3.
Statistical indicators of LST product accuracy from Landsat-8 C2L2 for each station.
Figure 7.
Visual comparison of LST product performance extracted from Landsat-8 Level 2 across the seven SURFRAD stations.
GWN station in Mississippi demonstrated the highest overall performance based on 66 observations, recording RMSE of 2.599 °C, MAD of 1.950 °C, maximum absolute deviation of 7.535 °C, and R2 of 0.908. SXF station in South Dakota ranked second with RMSE of 2.554 °C (n = 34), MAD of 1.920 °C, maximum absolute difference of 8.302 °C, and the highest R2 among all stations at 0.972. PSU station in Pennsylvania recorded RMSE of 3.586 °C (n = 26), MAD of 2.462 °C, maximum absolute difference of 11.687 °C, and R2 of 0.878. DRA station in Nevada recorded RMSE of 3.674 °C (n = 50), MAD of 3.021 °C, maximum absolute difference of 7.696 °C, and R2 of 0.928. BND station in Illinois recorded RMSE of 3.738 °C (n = 57), MAD of 2.631 °C, maximum absolute difference of 11.449 °C, and R2 of 0.870.
TBL station in Colorado (elevation: 1689 m asl) recorded the highest RMSE of 5.136 °C (n = 84), MAD of 4.547 °C, maximum absolute difference of 9.914 °C, and the lowest R2 of 0.847. FPK station in Montana recorded RMSE of 5.616 °C (n = 65), MAD of 4.241 °C, the highest maximum absolute difference in the entire study at 14.388 °C, and R2 of 0.901.
3.7. Performance Evaluation by Land Surface Temperature Ranges
Table 4 presents the statistical indicators of Landsat-8 C2L2 accuracy across six land surface temperature ranges. In the lowest thermal range (LST < 0 °C), 26 measurements recorded RMSE of 2.322 °C, MAD of 1.473 °C, standard deviation of 1.831 °C, and absolute errors from 0.060 to 9.184 °C. In the range 0–10 °C, 35 measurements achieved the best performance with RMSE of 2.054 °C, MAD of 1.716 °C, standard deviation of 1.144 °C, and absolute errors from 0.026 to 4.286 °C. In the range 10 to <20 °C, 65 measurements recorded RMSE of 2.123 °C, MAD of 1.496 °C (the lowest among all ranges), standard deviation of 1.518 °C, and absolute errors from 0.004 to 6.128 °C. All three thermal ranges below 20 °C achieved RMSE values below 2.5 °C.
Table 4.
Statistical indicators of LST product accuracy from Landsat-8 C2L2 by land surface temperature ranges.
A notable decline in accuracy was observed in the 20 to <30 °C range, where 94 measurements recorded RMSE of 4.029 °C, MAD of 3.063 °C, standard deviation of 2.631 °C, and absolute errors from 0.017 to 11.687 °C. The 30 to <40 °C range (n = 122, largest group) recorded RMSE of 5.224 °C, MAD of 4.326 °C, standard deviation of 2.941 °C, and absolute errors from 0.185 to 13.267 °C. The hottest range (LST ≥ 40 °C) recorded the worst performance with RMSE of 5.707 °C, MAD of 5.136 °C, standard deviation of 2.521 °C, and absolute errors from 0.040 to 14.388 °C. RMSE values approximately doubled from cold ranges (LST < 20 °C) to the warm range (20–30 °C), and doubled again in hot ranges (> 30 °C).
3.8. Relationship Between LST Errors and Atmospheric Water Vapor
A subset of 106 Landsat-8 observations (27.5% of the total dataset) was successfully matched with MODIS MCD19A2 atmospheric water vapor measurements within a ±2 h temporal window, with an average temporal difference of 11 min between acquisitions. Table 5 presents the Pearson correlation coefficients between atmospheric water vapor content and absolute LST retrieval errors for each station.
Table 5.
Correlation between atmospheric water vapor and absolute LST errors by station.
Strong positive correlations were observed at FPK (r = 0.783, R2 = 0.613, n = 19) and DRA (r = 0.750, R2 = 0.563, n = 15). Moderate positive correlations were found at SXF (r = 0.548, R2 = 0.300, n = 9), TBL (r = 0.490, R2 = 0.240, n = 24), and GWN (r = 0.346, R2 = 0.120, n = 19). BND showed virtually no correlation (r = 0.042, R2 = 0.002, n = 17), while PSU exhibited a weak negative correlation (r = −0.171, R2 = 0.029, n = 3), the latter based on a very limited sample.
4. Discussion
The Landsat-8 C2L2 surface temperature product, generated using the single-channel algorithm of [25] and validated here against seven SURFRAD stations, demonstrated strong overall agreement with ground measurements (R2 = 0.91, d = 0.98, r = 0.98). Nevertheless, the RMSE of 4.20 °C and the systematic positive mean bias of 1.75 °C indicate recurring limitations that warrant detailed examination. The following discussion contextualizes these findings within the framework of seasonal variability, temperature-dependent performance, atmospheric water vapor effects, and station-specific characteristics.
4.1. Seasonal Performance and Atmospheric Water Vapor
The seasonal analysis revealed a clear and systematic pattern of performance variation. Winter achieved the best performance (RMSE = 2.174 °C, r = 0.988), while summer recorded the weakest (RMSE = 5.838 °C, r = 0.907), representing an approximately 2.7-fold increase in retrieval error between the two seasons. This pattern reflects a clear inverse relationship between ambient thermal conditions and retrieval accuracy. Consistent seasonal degradation patterns have been documented across multiple Landsat-based LST validation studies [22,42], and are primarily attributed to the marked increase in atmospheric water vapor content during summer months. As reviewed by Li et al. (2013), accurate knowledge of vertical profiles of atmospheric water vapor is critical for thermal infrared atmospheric correction, and single-channel algorithms provide poor results under high water vapor conditions [9]. This is further supported by Jiménez-Muñoz et al. (2014), who demonstrated that errors in the estimated water vapor content represent the most significant source of uncertainty in single-channel LST retrieval [43].
The water vapor analysis conducted in Section 3.8 provides direct mechanistic evidence for these seasonal patterns. Strong positive correlations between atmospheric water vapor content and LST errors at FPK (r = 0.783, R2 = 0.613) and DRA (r = 0.750, R2 = 0.563) confirm that elevated atmospheric moisture substantially degrades retrieval accuracy at these locations. Atmospheric water vapor increases substantially during summer due to enhanced evaporation and transpiration, leading to greater attenuation of thermal radiation emitted from the Earth’s surface and increasing the difficulty of applying accurate atmospheric corrections using NCEP/GEOS-5 reanalysis profiles [25,44]. The strong water vapor-error relationships at high-elevation stations (FPK, TBL) and the arid DRA site are particularly instructive. At these locations, the vertical stratification of water vapor creates discrepancies between reanalysis estimates and actual column content, compounding errors in atmospheric correction [44].
The summer period is also characterized by rapid vegetation cover dynamics, with plant canopy structure, biomass, and moisture content changing on short temporal scales. These changes lead to significant variation in surface emissivity that may not be accurately captured by the ASTER GED temporal adjustment procedure [45]. The ASTER GEDv3 dataset represents average emissivity from 2000 to 2008 and requires adjustment to the time of Landsat overpass using NDVI-based vegetation and snow cover corrections [25,45]. However, this NDVI-based adjustment has documented limitations, particularly at mixed-cover pixels where emissivity uncertainty can reach 1–2% [45], with corresponding LST errors that are largest during the growing season when vegetation dynamics are most pronounced. Conversely, winter conditions reduce both atmospheric moisture and emissivity variability, rendering ASTER GED-derived values more representative of actual surface conditions and producing more reliable atmospheric corrections.
4.2. Temperature-Dependent Performance and Systematic Bias
The temperature range analysis demonstrated a clear and systematic relationship between surface temperature level and retrieval accuracy. Performance was high in cold and moderate thermal ranges (LST < 20 °C, RMSE 2.0–2.3 °C) and deteriorated progressively with rising temperatures, reaching its lowest level in the hottest range (LST ≥ 40 °C, RMSE 5.707 °C). This increasing performance degradation under high thermal conditions is consistent with the known sensitivity of single-channel algorithms to input parameter errors [9,43], where simplifying assumptions in the radiative transfer model become progressively less valid as surface temperatures rise. The temperature-dependent degradation is mechanistically linked to the water vapor effects documented in Section 3.8, as high surface temperatures frequently coincide with elevated atmospheric moisture content, particularly during summer, creating compounded uncertainties in both atmospheric correction and emissivity estimation [9,42].
The overall positive mean bias of 1.75 °C reflects a systematic tendency of the Landsat-8 C2L2 product to overestimate surface temperatures, as further evidenced by the predominance of positive differences in 261 out of 382 measurements (68.3%). Two principal causes merit consideration. First, underestimation of actual atmospheric water vapor content in the NCEP/GEOS-5-based correction leads to insufficient compensation for atmospheric attenuation, producing overestimated surface temperatures [25,44]. Second, a systematic downward bias in emissivity values derived from ASTER GED, particularly at vegetated sites where LSE is treated as invariant with increasing NDVI [42,43], produces overestimated surface temperatures through the inverse relationship between emissivity and retrieved LST [9,42]. The PSU station was the only exception to the general overestimation pattern, exhibiting a slight negative bias of approximately −0.9 °C.
4.3. Station-Level Performance and Spatial Variability
Spatial variation in product performance across the seven SURFRAD stations reflects the influence of site-specific characteristics, including elevation, land cover homogeneity, and topographic complexity, on retrieval accuracy. This pattern is consistent with the general finding that LST validation is most reliable at homogeneous, isothermal sites, while heterogeneous landscapes introduce scale mismatch errors between point-scale ground measurements and satellite-scale retrievals [9,46].
The notably poor performance at TBL station in Colorado (RMSE = 5.136 °C, R2 = 0.847) and FPK station in Montana (RMSE = 5.616 °C) represents a consistent pattern confirmed by multiple independent validation studies [22,34,42]. At FPK, Ermida et al. (2020) attributed a positive bias of 1.8 K for Landsat-8 to overestimation of surface temperatures exceeding 300 K, identifying possible emissivity underestimation during the warm season as the likely cause [22]. This is fully consistent with the hypothesis that ASTER GED-based emissivity values, temporally adjusted using NDVI, may fail to capture rapid changes in vegetation cover during summer at this station [25,45]. The strong water vapor-error correlation at FPK (r = 0.783, R2 = 0.613) indicates that both emissivity uncertainties and atmospheric correction challenges compound to produce the largest errors at this station, particularly during warm periods when water vapor content and surface temperatures are simultaneously elevated [22,44].
At TBL station, Ermida et al. (2020) identified severe spatial variation in surface temperatures around the station, reaching approximately 10 K, as a major source of large biases, attributable to distinct differences in soil type and vegetation cover at small spatial scales, compounded by the station’s elevated location (1689 m asl) with rolling terrain and varying slopes [22]. The present study corroborates these findings. TBL recorded the highest MAD (4.547 °C) and lowest R2 (0.847) among all stations. The moderate water vapor-error correlation at TBL (r = 0.490) suggests that atmospheric effects contribute to, but do not fully explain, the poor performance, confirming that surface heterogeneity remains the dominant error source, consistent with Duan et al. (2021) and Wang et al. (2020) [36,42]. At high elevations, atmospheric conditions exhibit greater instability and more rapid fluctuations in humidity, temperature, and aerosol content [44], all of which increase uncertainty in the atmospheric correction parameters.
Conversely, GWN station in Mississippi achieved the highest overall performance (RMSE = 2.599 °C, R2 = 0.908). This result is attributable to the station’s relatively homogeneous grassland cover, flat terrain, and low elevation (98 m asl), which collectively satisfy the conditions identified by Ma et al. (2021) as most favorable for accurate satellite-based LST validation [46]. SXF station achieved the highest R2 of all stations (0.972), reflecting the stable measurement environment of its flat, homogeneous setting. DRA station in Nevada achieved good performance (RMSE = 3.674 °C, R2 = 0.928) in its desert environment, though the strong water vapor correlation (r = 0.750) identifies atmospheric moisture as an important uncertainty source at this site when conditions depart from the typical arid baseline [11,44]. Overall, these results indicate that the Landsat-8 C2L2 product performs reliably at low-elevation homogeneous sites and in cold to moderate thermal regimes, but requires caution when applied in contexts involving high surface temperatures, complex terrain, elevated atmospheric moisture, or the rapid surface dynamics characteristic of the summer season [9,11].
5. Conclusions
This study conducts a comprehensive evaluation of the land surface temperature product provided by USGS within the Landsat-8 Collection 2 Level-2 product using 382 satellite-ground observation pairs from seven SURFRAD stations spanning January 2023 to December 2025. The product demonstrates strong overall accuracy with an RMSE of 4.20 °C and a coefficient of determination (R2) of 0.91. The high Pearson correlation coefficient (r = 0.98) and Willmott index (d = 0.98) confirm robust agreement between satellite-derived and ground-based temperatures across diverse geographical and environmental conditions.
However, the results reveal systematic patterns in product performance that warrant consideration in operational applications. A positive bias of 1.749 °C indicates a consistent tendency toward overestimation of surface temperatures. Performance varies substantially across seasons, with winter achieving exceptional accuracy (RMSE = 2.174 °C) while summer shows significantly reduced performance (RMSE = 5.838 °C). Analysis of 106 successfully matched Landsat-8 and MODIS water vapor observations (with an average temporal difference of 11 min) revealed that atmospheric water vapor content plays a significant role in these seasonal accuracy variations, with strong positive correlations between moisture and LST errors observed at FPK (r = 0.783) and DRA (r = 0.750), confirming that elevated atmospheric moisture during summer substantially degrades retrieval accuracy, particularly at high-elevation and arid stations. Temperature-dependent analysis demonstrates that accuracy deteriorates systematically as surface temperatures increase, with RMSE values approximately doubling when transitioning from cold ranges (below 20 °C) to warm ranges (20–30 °C), and doubling again in hot conditions (above 40 °C).
Spatial analysis reveals notable differences among stations, with GWN and SXF achieving the best performance (RMSE < 2.6 °C), while TBL and FPK stations at higher elevations recorded larger errors (RMSE > 5.1 °C). The spatial variation in water vapor-error correlations is particularly instructive: strong relationships at high-elevation and complex terrain sites (FPK, TBL, DRA) indicate that atmospheric correction challenges compound with topographic and surface heterogeneity effects, while the negligible correlation at homogeneous low-elevation sites (BND: r = 0.042) suggests that emissivity estimation dominates the error budget in more favorable environments. These variations reflect the influence of local topographic complexity, spatial heterogeneity in surface characteristics, and atmospheric conditions on algorithm performance.
Despite these limitations, the Landsat-8 Collection 2 Level-2 (C2L2) LST product exhibits adequate accuracy for numerous environmental applications, including climate assessment, urban heat island investigations, agricultural drought and water-stress monitoring, and hydrological modeling. Its utility remains particularly strong when the documented seasonal and temperature-dependent uncertainties are appropriately considered during interpretation. The analysis of atmospheric water vapor effects provides important insights into potential avenues for product enhancement. Specifically, incorporating higher-temporal-resolution atmospheric moisture datasets, improving emissivity characterization during rapidly changing surface conditions, and implementing temperature-sensitive calibration procedures may further enhance retrieval accuracy, particularly during summer periods and in environmentally complex settings. Additional improvements in emissivity estimation, atmospheric correction under elevated water vapor conditions, and algorithm refinement for heterogeneous terrain could further increase product reliability across diverse environmental contexts. Such developments would strengthen confidence in the application of this 30 m thermal dataset for environmental monitoring, resource management, and decision-support activities.
Nevertheless, some findings presented in this study are based on relatively limited subsets of observations. Although the overall validation framework utilized 382 valid Landsat-8/SURFRAD matchup pairs, the atmospheric water vapor assessment relied on only 106 collocated MODIS observations. Furthermore, several site-specific analyses—particularly those associated with the PSU station (n = 26 overall and n = 3 within the water-vapor subset)—are constrained by small sample sizes. Consequently, station-level statistics and site-specific water vapor relationships should be interpreted as preliminary indicators rather than definitive conclusions and warrant verification through extended observational records and additional ground-based reference networks. In contrast, the broader conclusions regarding the overall performance of the C2L2 LST product, the deterioration in accuracy during summer conditions, and the systematic reduction in retrieval accuracy at higher surface temperatures are supported by substantially larger sample sizes and are therefore considered robust and reliable.
Author Contributions
Conceptualization, A.A.A. (Almustafa AbdElkader Ayek), M.A.L. and N.I.; methodology, A.A.A. (Almustafa AbdElkader Ayek), M.A.L. and Y.M.Y.; software, A.A.A. (Almustafa AbdElkader Ayek), M.A.L., A.A.A. (Afnan Abdullah Alturki) and M.A.A.; validation, A.A.A. (Afnan Abdullah Alturki), Y.M.Y. and M.A.A.; formal analysis, M.A.L., N.I. and M.A.A.; investigation, N.I. and A.A.A. (Afnan Abdullah Alturki); resources, Y.M.Y. and M.A.A.; data curation, A.A.A. (Almustafa AbdElkader Ayek) and M.A.L.; writing—original draft preparation, A.A.A. (Almustafa AbdElkader Ayek), M.A.L., N.I. and Y.M.Y.; writing—review and editing, M.A.L., N.I., A.A.A. (Afnan Abdullah Alturki) and M.A.A.; visualization, M.A.L., A.A.A. (Afnan Abdullah Alturki) and M.A.A.; supervision, M.A.L. and Y.M.Y.; project administration, A.A.A. (Afnan Abdullah Alturki) and Y.M.Y.; funding acquisition, A.A.A. (Afnan Abdullah Alturki) and Y.M.Y. All authors have read and agreed to the published version of the manuscript.
Funding
This research was funded by the Princess Nourah bint Abdulrahman University Researchers Supporting Project number (PNURSP2026R960), Princess Nourah bint Abdulrahman University, Riyadh, Saudi Arabia.
Institutional Review Board Statement
Not applicable.
Informed Consent Statement
Not applicable.
Data Availability Statement
The datasets generated during and/or analyzed during the current study are available from the corresponding author upon reasonable request.
Acknowledgments
The authors extend their appreciation to the Princess Nourah bint Abdulrahman University Researchers Supporting Project number (PNURSP2026R960), Princess Nourah bint Abdulrahman University, Riyadh, Saudi Arabia.
Conflicts of Interest
The authors declare no conflicts of interest.
References
- Gaonkar, V.P.; Nadaf, F.M.; Kapale, V. Decoding urban heat: A decadal analysis (1991-2021) of land surface temperature and thermal comfort dynamics in Coastal Taluka of Bardez, Goa, India. Disaster Adv. 2024, 18, 1–17. [Google Scholar] [CrossRef]
- Panigrahi, M.; Sharma, A. Urban growth dynamics and its influence on land surface temperature in Bhubaneswar metropolitan city: A 1990–2021 analysis. Discov. Appl. Sci. 2025, 7, 118. [Google Scholar] [CrossRef]
- Anderson, M.C.; Hain, C.; Wardlow, B.; Pimstein, A.; Mecikalski, J.R.; Kustas, W.P. Evaluation of drought indices based on thermal remote sensing of evapotranspiration over the Continental United States. J. Clim. 2011, 24, 2025–2044. [Google Scholar] [CrossRef]
- Chen, J.; Shi, X.; Shi, Y.; Delina, L.L. Assessing heat vulnerability risk of Jinan and Guangzhou’s older populations based on multisource remote sensing data. Build. Environ. 2025, 271, 112622. [Google Scholar] [CrossRef]
- Clinton, N.; Gong, P. MODIS detected surface urban heat islands and sinks: Global locations and controls. Remote Sens. Environ. 2013, 134, 294–304. [Google Scholar] [CrossRef]
- Colombi, G.; Vineis, P. Editorial: The relationship between health and environment under the lens of climate change: Insights for policy makers. Front. Public Health 2025, 13, 1548553. [Google Scholar] [CrossRef] [PubMed]
- Djebbour, M.; Sbai, A. Urban island modeling for semi-arid cities: The case of the city of Oujda. E3S Web Conf. 2025, 607, 04005. [Google Scholar] [CrossRef]
- Li, Y.; Zhao, H.; Li, K.; Zeng, J.; Lan, Q.; Han, Q.; Wu, Y.; Qian, Y. A nonlinear hybrid algorithm for retrieving land surface temperatures from chinese atmospheric environment monitoring satellite thermal infrared data. IEEE J. Sel. Top. Appl. Earth Obs. Remote Sens. 2025, 18, 4050–4059. [Google Scholar] [CrossRef]
- Li, Z.-L.; Tang, B.-H.; Wu, H.; Ren, H.; Yan, G.; Wan, Z.; Trigo, I.F.; Sobrino, J.A. Satellite-derived land surface temperature: Current status and perspectives. Remote Sens. Environ. 2013, 131, 14–37. [Google Scholar] [CrossRef]
- Weng, Q. Thermal infrared remote sensing for urban climate and environmental studies: Methods, applications, and trends. ISPRS J. Photogramm. Remote Sens. 2009, 64, 335–344. [Google Scholar] [CrossRef]
- Sekertekin, A.; Bonafoni, S. Land surface temperature retrieval from Landsat 5, 7, and 8 over rural areas: Assessment of different retrieval algorithms and emissivity models and toolbox implementation. Remote Sens. 2020, 12, 294. [Google Scholar] [CrossRef]
- U.S. Geological Survey. Landsat 8 (L8) Data Users Handbook (LSDS-1574, Version 5.0); U.S. Department of the Interior: Reston VA, USA, 2019. Available online: https://d9-wret.s3.us-west-2.amazonaws.com/assets/palladium/production/s3fs-public/atoms/files/LSDS-1574_L8_Data_Users_Handbook-v5.0.pdf (accessed on 24 August 2025).
- Meng, X.; Li, H.; Du, Y.; Liu, Q.; Zhu, J.; Sun, L. Retrieving land surface temperature from Landsat 8 TIRS data using RTTOV and ASTER GED. In Proceedings of the 2016 IEEE International Geoscience and Remote Sensing Symposium (IGARSS), Beijing, China, 10–15 July 2016; IEEE: Piscataway, NJ, USA, 2016; pp. 4302–4305. [Google Scholar] [CrossRef]
- Sayler, K. Landsat 8-9 Collection 2 Level 2 Science Product Guide; U.S. Geological Survey: Reston, VA, USA, 2024. Available online: https://www.usgs.gov/media/files/landsat-8-9-collection-2-level-2-science-product-guide (accessed on 22 June 2025).
- Gök, D.T.; Scherler, D.; Wulf, H. Land surface temperature trends derived from Landsat imagery in the Swiss Alps. Cryosphere 2024, 18, 5259–5276. [Google Scholar] [CrossRef]
- Sajib, M.Q.U.; Wang, T. Estimation of land surface temperature in an agricultural region of Bangladesh from Landsat 8: Intercomparison of four algorithms. Sensors 2020, 20, 1778. [Google Scholar] [CrossRef] [PubMed]
- Yu, X.; Guo, X.; Wu, Z. Land surface temperature retrieval from Landsat 8 TIRS—Comparison between radiative transfer equation-based method, split window algorithm and single channel method. Remote Sens. 2014, 6, 9829–9852. [Google Scholar] [CrossRef]
- Jiménez-Muñoz, J.C.; Cristobal, J.; Sobrino, J.A.; Soria, G.; Ninyerola, M.; Pons, X. Revision of the single-channel algorithm for land surface temperature retrieval from Landsat thermal-infrared data. IEEE Trans. Geosci. Remote Sens. 2009, 47, 339–349. [Google Scholar] [CrossRef] [PubMed]
- Ayek, A.A.E.; Zerouali, B. Comment on Yu et al. Land surface temperature retrieval from Landsat 8 TIRS—Comparison between radiative transfer equation-based method, split window algorithm and single channel method. Remote Sens. 2014, 6, 9829–9852. Remote Sens. 2024, 16, 2514. [Google Scholar] [CrossRef]
- Du, C.; Ren, H.; Qin, Q.; Meng, J.; Zhao, S. A practical split-window algorithm for estimating land surface temperature from Landsat 8 data. Remote Sens. 2015, 7, 647. [Google Scholar] [CrossRef]
- Cristóbal, J.; Jiménez-Muñoz, J.C.; Prakash, A.; Mattar, C.; Skoković, D.; Sobrino, J.A. An improved single-channel method to retrieve land surface temperature from the Landsat-8 thermal band. Remote Sens. 2018, 10, 431. [Google Scholar] [CrossRef]
- Ermida, S.L.; Soares, P.; Mantas, V.; Göttsche, F.-M.; Trigo, I.F. Google Earth Engine open-source code for land surface temperature estimation from the Landsat series. Remote Sens. 2020, 12, 1471. [Google Scholar] [CrossRef]
- Duguay-Tetzlaff, A.; Bento, V.A.; Göttsche, F.M.; Stöckli, R.; Martins, J.P.A.; Trigo, I.; Olesen, F.; Bojanowski, J.S.; Da Camara, C.; Kunz, H. Meteosat land surface temperature climate data record: Achievable accuracy and potential uncertainties. Remote Sens. 2015, 7, 13139–13156. [Google Scholar] [CrossRef]
- Xu, S.; Wang, D.; Liang, S.; Jia, A.; Li, R.; Wang, Z.; Liu, Y. A novel approach to estimate land surface temperature from Landsat top-of-atmosphere reflective and emissive data using transfer-learning neural network. Sci. Total Environ. 2024, 955, 176783. [Google Scholar] [CrossRef] [PubMed]
- Malakar, N.K.; Hulley, G.C.; Hook, S.J.; Laraby, K.; Cook, M.; Schott, J.R. An operational land surface temperature product for Landsat thermal data: Methodology and validation. IEEE Trans. Geosci. Remote Sens. 2018, 56, 5717–5735. [Google Scholar] [CrossRef]
- NOAA Earth System Research Laboratory. Surface Radiation Budget (SURFRAD) Network 1-Hour Observations; National Oceanic and Atmospheric Administration: Silver Spring, MD, USA, 1995. Available online: https://www.ncei.noaa.gov/ (accessed on 1 January 2025).
- Global Monitoring Laboratory. SURFRAD (Surface Radiation Budget) Network; National Oceanic and Atmospheric Administration (NOAA), U.S. Department of Commerce: Silver Spring, MD, USA, 1993. Available online: https://gml.noaa.gov/grad/surfrad/ (accessed on 30 June 2025).
- Dyba, K.; Ermida, S.; Ptak, M.; Piekarczyk, J.; Sojka, M. Evaluation of methods for estimating lake surface water temperature using Landsat 8. Remote Sens. 2022, 14, 3839. [Google Scholar] [CrossRef]
- Galve, J.M.; Sánchez, J.M.; García-Santos, V.; González-Piqueras, J.; Calera, A.; Villodre, J. Assessment of land surface temperature estimates from Landsat 8-TIRS in a high-contrast semiarid agroecosystem. Algorithms Intercomparison. Remote Sens. 2022, 14, 1843. [Google Scholar] [CrossRef]
- Pinto, C.T.; Jing, X.; Leigh, L. Evaluation analysis of Landsat level-1 and level-2 data products using in situ measurements. Remote Sens. 2020, 12, 2597. [Google Scholar] [CrossRef]
- Rahimi, E.; Jung, C. Evaluating the applicability of Landsat 8 data for global time series analysis. Front. Remote Sens. 2024, 5, 1492534. [Google Scholar] [CrossRef]
- Gerace, A.; Kleynhans, T.; Eon, R.; Montanaro, M. Towards an operational, split window-derived surface temperature product for the thermal infrared sensors onboard Landsat 8 and 9. Remote Sens. 2020, 12, 224. [Google Scholar] [CrossRef]
- Hulley, G.C.; Ghent, D.; Göttsche, F.M.; Guillevic, P.C.; Mildrexler, D.J.; Coll, C. Land surface temperature. In Taking the Temperature of the Earth; Hulley, G.C., Ghent, D., Eds.; Elsevier: Amsterdam, The Netherlands, 2019; pp. 57–127. [Google Scholar] [CrossRef]
- Liu, W.; Shi, J.; Liang, S.; Zhou, S.; Cheng, J. Simultaneous retrieval of land surface temperature and emissivity from the FengYun-4A advanced geosynchronous radiation imager. Int. J. Digit. Earth 2022, 15, 198–225. [Google Scholar] [CrossRef]
- Ren, H.; Liu, R.; Qin, Q.; Fan, W.; Yu, L.; Du, C. Mapping finer-resolution land surface emissivity using Landsat images in China. J. Geophys. Res. Atmos. 2017, 122, 6764–6781. [Google Scholar] [CrossRef]
- Wang, M.; Zhang, Z.; Hu, T.; Wang, G.; He, G.; Zhang, Z.; Li, H.; Wu, Z.; Liu, X. An efficient framework for producing Landsat-based land surface temperature data using Google Earth Engine. IEEE J. Sel. Top. Appl. Earth Obs. Remote Sens. 2020, 13, 4689–4701. [Google Scholar] [CrossRef]
- National Oceanic and Atmospheric Administration (NOAA). GRAD (Global Radiation, Aerosols and Clouds); National Oceanic and Atmospheric Administration (NOAA), U.S. Department of Commerce: Silver Spring, MD, USA, 2025. Available online: https://gml.noaa.gov/grad/index.html (accessed on 30 June 2025).
- U.S. Geological Survey. Landsat Collection 2 Surface Temperature; U.S. Geological Survey: Reston, VA, USA, 2025. Available online: https://www.usgs.gov/landsat-missions/landsat-collection-2-surface-temperature (accessed on 30 June 2025).
- Wang, K.; Liang, S. Evaluation of ASTER and MODIS land surface temperature and emissivity products using long-term surface longwave radiation observations at SURFRAD sites. Remote Sens. Environ. 2009, 113, 1556–1565. [Google Scholar] [CrossRef]
- Wang, K.; Wan, Z.; Wang, P.; Sparrow, M.; Liu, J.; Zhou, X.; Haginoya, S. Estimation of surface long wave radiation and broadband emissivity using Moderate Resolution Imaging Spectroradiometer (MODIS) land surface temperature/emissivity products. J. Geophys. Res. Atmos. 2005, 110, D11109. [Google Scholar] [CrossRef]
- Lyapustin, A.; Wang, Y.; Korkin, S.; Huang, D. MODIS Collection 6 MAIAC algorithm. Atmos. Meas. Tech. 2018, 11, 5741–5765. [Google Scholar] [CrossRef]
- Duan, S.B.; Li, Z.L.; Zhao, W.; Wu, P.; Huang, C.; Han, X.J.; Gao, M.; Leng, P.; Shang, G. Validation of Landsat land surface temperature product in the conterminous United States using in situ measurements from SURFRAD, ARM, and NDBC sites. Int. J. Digit. Earth 2021, 14, 640–660. [Google Scholar] [CrossRef]
- Jiménez-Muñoz, J.C.; Sobrino, J.A.; Skokovic, D.; Mattar, C.; Cristóbal, J. Land surface temperature retrieval methods from Landsat-8 thermal infrared sensor data. IEEE Geosci. Remote Sens. Lett. 2014, 11, 1840–1843. [Google Scholar] [CrossRef]
- Meng, X.; Cheng, J. Evaluating eight global reanalysis products for atmospheric correction of thermal infrared sensor: Application to Landsat 8 TIRS10 data. Remote Sens. 2018, 10, 474. [Google Scholar] [CrossRef]
- Hulley, G.C.; Hook, S.J.; Abbott, E.; Malakar, N.; Islam, T.; Abrams, M. The ASTER Global Emissivity Dataset (ASTER GED): Mapping Earth’s emissivity at 100 meter spatial scale. Geophys. Res. Lett. 2015, 42, 7966–7976. [Google Scholar] [CrossRef]
- Ma, J.; Zhou, J.; Liu, S.; Göttsche, F.-M.; Zhang, X.; Wang, S.; Li, M. Continuous evaluation of the spatial representativeness of land surface temperature validation sites. Remote Sens. Environ. 2021, 265, 112669. [Google Scholar] [CrossRef]

Disclaimer/Publisher’s Note: The statements, opinions and data contained in all publications are solely those of the individual author(s) and contributor(s) and not of MDPI and/or the editor(s). MDPI and/or the editor(s) disclaim responsibility for any injury to people or property resulting from any ideas, methods, instructions or products referred to in the content. |
© 2026 by the authors. Licensee MDPI, Basel, Switzerland. This article is an open access article distributed under the terms and conditions of the Creative Commons Attribution (CC BY) license.