


Abstract
Climate projections indicate significant changes in temperature patterns and other meteorological parameters under different climate change scenarios, with temperature receiving special attention due to its influence on thermal conditions and human discomfort. This study examines the relationship between diurnal temperature range (DTR) and thermal discomfort in the five largest cities of Greece during summer. Thermal discomfort is assessed using Thom’s discomfort index (DI), where values ≥ 21 indicate the onset of thermal discomfort, focusing on thermal conditions at the upper (DIh) and lower (DIc) boundaries of daily variability. The analysis uses multiple CMIP6 projections for the reference period (1981–2010) and the near future (2031–2060) under the SSP2-4.5 and SSP5-8.5, representing intermediate and high greenhouse gas forcing pathways, respectively. The study aims to investigate associations between DTR and DI-based thermal discomfort. DTR is projected to increase in most cities in the near future relative to the reference period. This reflects a regional specific response that differs from the global tendency reported in the literature for minimum air temperatures (Tmin) to increase faster than maximum air temperatures (Tmax). Effect size analysis of DTR indicates generally small effects in Thessaloniki, medium to large effects in Larissa depending on the scenario, and large effects in Heraklion, Athens and Patra. Projected differences in DTR are consistent with the asymmetrical response of air temperature, specifically to the higher increase rate in Tmax than in Tmin in most cities. DI-based thermal discomfort shows a clear contrast between upper (DIh) and lower (DIc) boundaries of daily variability, reflected in higher discomfort classes for DIh and lower classes for DIc. Higher DTR values are associated with higher DIh-based thermal discomfort, while the corresponding association between DTR and DIc is weak or absent. The positive association observed for the DIh-based conditions is largely governed by the shared contribution of Tmax to both DTR and the discomfort index, whereas the absent or weak association for DIc-based conditions may reflect the weaker association between DTR and Tmin as well as the relatively smaller variability of Tmin.
1. Introduction
Recent assessments by the World Meteorological Organization [1] and the Intergovernmental Panel on Climate Change [2] highlight that human-caused climate change is already affecting various weather and climate extremes. Among these, changes in temperature patterns have received special attention, as they influence thermal conditions and contribute to human thermal discomfort. Specifically, the Mediterranean region is identified in the IPCC Sixth Assessment Report (AR6) as a ‘climate change hotspot’, with projected increases in temperature extremes and heat-related impacts [3].
One of the key indicators used to assess temperature variability is the diurnal temperature range (DTR), defined as the difference between daily maximum and daily minimum air temperatures. Several studies, based on both observations and climate model simulations, have reported changes in DTR over time, with either decreases or increases associated with asymmetric trends in minimum and maximum air temperatures (e.g., [4,5,6,7,8,9,10]). Beyond its climatological significance, DTR has also been investigated with respect to human health impacts (e.g., [11,12,13,14]). High DTR and elevated nighttime temperatures may reduce physiological recovery from daytime heat exposure and increase heat-related stress [15,16,17]. Considering the impacts of abnormally hot weather on human well-being and thermal comfort, other studies have examined the response of DTR under such conditions, with findings suggesting higher DTR during heat extremes compared to normal summer days [18,19]. It is worth noting that, in principle, DTR reflects the magnitude of daily temperature variation rather than absolute temperature levels. As a result, the same DTR value can correspond to different temperature levels. Therefore, DTR is not a direct indicator for representing absolute thermal conditions or perceived thermal stress.
In contrast, various bioclimatic indices have been developed to assess discomfort levels and thermal comfort conditions by combining environmental variables [20]. Many studies utilizing bioclimatic indices along with observational or reanalysis data have highlighted the deterioration of thermal comfort conditions over recent decades across various regions worldwide (e.g., [21,22,23]). In addition, other studies using projected climate data have investigated expected changes in heat stress and comfort levels in the future climate under different scenarios (e.g., [24,25,26,27,28]).
Although DTR and bioclimatic indices describing thermal discomfort have been extensively used separately, the combined analysis of their relationship under current and future climatic conditions has received limited attention, especially in the climate-sensitive Eastern Mediterranean region [29,30]. Furthermore, most previous studies have primarily focused on mean thermal conditions, while comparatively less attention has been given to the diurnal cycle of thermal discomfort and its relationship with DTR. Understanding how DTR could be associated with thermal discomfort levels and how related variables interact might provide valuable insights into their behavior under current and future climatic conditions. In addition, by leveraging the latest generation of CMIP6 climate data, statistically downscaled for the cities under consideration, higher-resolution insight into grid-cell-scale thermal conditions can be provided.
Considering the above, in this study, statistically downscaled CMIP6 data derived from three General Circulation Models (GCMs) were used to assess projected changes in diurnal temperature range and thermal discomfort in summer over five major cities in Greece, located in the Eastern Mediterranean. The analysis focused on the near-future period (2031–2060) under the SSP2-4.5 and SSP5-8.5 scenarios, while the period 1981–2010 was used as a reference for comparison. Potential physiological or societal adaptation to future warming conditions was not accounted for in the present analysis. Thermal discomfort was assessed using a bioclimatic index based on daily air temperature and humidity extremes, serving as an approximate thermal discomfort indicator for the warmest and coolest parts of the day. Thom’s discomfort index (DI) was selected due to its simplicity, limited meteorological input requirements, and widespread application in studies using climate model data, where variables such as radiation and wind are not always consistently available. Apart from the separate investigation of climate change impacts on the distributions of DTR and thermal discomfort indicators, the analysis also examines associations between them and their possible changes in the near future. Additional analysis was carried out to investigate associations between DTR, thermal discomfort indicators and their associated climate variables. The structure of the study is as follows. Section 2 describes the data, models and indices used, as well as the statistical methods applied. Section 3 presents the results, including projected changes in DTR distribution, variations in DI-based thermal discomfort categories, the association between DTR and thermal discomfort indicators, and the associations among the analyzed variables. Finally, Section 4 discusses the results in the context of a changing climate, and Section 5 summarizes the main conclusions.
2. Materials and Methods
This study leverages daily data derived from the latest-generation CMIP6 (Coupled Model Intercomparison Project phase 6) climate projections that incorporate the Shared Socioeconomic Pathway (SSP) scenarios. Three General Circulation Models (GCMs) of the CMIP6 framework were used, namely the EC-Earth3-Veg [31], the MIROC6 [32] and the MPI-ESM1-2-HR [33] (Table 1). The projections of these models involving the climate variables of daily maximum and minimum near-surface air temperature and relative humidity were statistically downscaled (~9 km), focusing on the five largest cities of Greece (Athens, Thessaloniki, Patra, Heraklion, Larissa), located in the Eastern Mediterranean. The predefined city reference coordinates used in the analysis were Athens (23.71° E, 37.97° N), Thessaloniki (22.94° E, 40.65° N), Larissa (22.41° E, 39.63° N), Patra (21.74° E, 38.23° N) and Heraklion (25.13° E, 35.32° N). These locations fall within or are very close to the corresponding urban areas and were used to extract the nearest land grid point from the statistically downscaled dataset. The extracted values therefore describe grid-cell-scale thermal conditions around central city reference locations, rather than intra-urban or neighborhood-scale thermal conditions.
Table 1.
The General Circulation Models used in this study.
To further describe the selected cities, Table 2 summarizes their Köppen–Geiger climate classification and the average population density, which is based on the Urban Centre Database (UCDB, R2024A) of the European Commission [34]. Athens, Patra, Thessaloniki, and Heraklion are coastal cities, while Larissa is inland. In terms of climatic conditions, Athens, Patra, and Heraklion have a hot-summer Mediterranean climate (Csa) with hot and dry summers, whereas Thessaloniki has a cold semi-arid climate (BSk). Larissa lies in a transitional zone between Csa and BSk and is located in one of the largest plains in Greece, which favors high summer air temperatures.
Table 2.
Köppen–Geiger climate classification and population density of the selected Greek cities.
To perform the statistical downscaling of climate variables, the high-resolution ERA5-Land reanalysis dataset was used [35] as the reference dataset following the methodology of Varotsos et al. [36]. The bias adjustment was carried out using Empirical Quantile Mapping (EQM), in which the empirical distribution of each CMIP6 variable over the reference period was adjusted to match the corresponding ERA5-Land distribution. The derived correction functions were then applied to the future simulations under the scenarios considered. The same EQM-based framework was applied to daily maximum and minimum near-surface air temperature and to the relative humidity variables. Two future SSP scenarios were considered, namely the SSP2-4.5 and the SSP5-8.5. The former scenario is considered as a medium pathway of future greenhouse gas emissions, assuming that socioeconomic development is consistent with the climate protection measures [37]. Conversely, the latter scenario portrays a future with high energy demands and a fossil fuel-based economy [37]. The period 1981–2010 is used as a reference for comparison with future projections for the period 2031–2060. The future period was chosen to emphasize both the projected changes and the potential vulnerability of the selected cities in the near future. Although GCM projections are available up to 2100, the present study focuses on near-term climate change impacts that are more relevant for adaptation planning.
In order to assess the variation in air temperature over a 24 h period, the index of diurnal temperature range (DTR, in °C) was calculated. The DTR is defined as the difference between the maximum and the minimum near-surface air temperatures over a calendar day.
DTR = Tmax − Tmin,
Thermal discomfort was assessed using the discomfort index of Thom (DI). This index, which was originally proposed by Thom [38], considers the combined effect of air temperature (T, °C) and air humidity (expressed as relative humidity, RH, in %) to express the degree of thermal discomfort.
DI = T − 0.55 × (1 − 0.01 × RH) × (T − 14.5),
The DI is classified into six categories representing increasing levels of thermal discomfort (Table 3). Since DI has been developed for warm conditions, all calculations were seasonally restricted to the summer months (June, July, August).
Table 3.
Classification of Thom’s discomfort index (DI) [38].
The selection of DI, among a number of indices with different rationale and sophistication presented in the scientific literature, was based on its simplicity, since DI relies on two direct basic measurements of environmental variables, making it easy to implement. In addition, the DI is highly correlated with the wet bulb globe temperature (WBGT) index, which has been adopted by international authorities and as an ISO standard [39,40].
The DI calculations were divided into two components, with each component referring to the part of the day on which the maximum and minimum air temperatures occur, representing approximate thermal and humidity extremes during two characteristic periods of the diurnal cycle. Taking into consideration the inverse relationship between air temperature and relative humidity [41], especially in the study region, the maximum air temperature was combined with the minimum relative humidity, while the minimum air temperature was combined with the maximum relative humidity, for the calculations of DIh and DIc components, respectively. The DIh component indicates thermal discomfort conditions associated with the hottest and generally driest part of the day. In contrast, the DIc component indicates thermal discomfort conditions associated with the coolest and generally most humid part of the day. Although Tmax and RHmin (as well as Tmin and RHmax) may not always occur simultaneously, especially in coastal cities influenced by local circulations, these combinations were used to represent characteristic hot/dry and cool/humid conditions of the diurnal cycle at the daily scale. Therefore, DIh and DIc should be interpreted as approximate thermal discomfort indicators based on daily temperature and humidity extremes.
DIh = f(Tmax, RHmin),
DIc = f(Tmin, RHmax),
The calculations of DTR and DI were based on the statistically downscaled and bias-adjusted climate variables (Tmax, Tmin, RHmax, RHmin) from each of the three GCMs, rather than from raw GCM output. For the descriptive, distributional and relationship-based analyses of DTR, DI, and the associated climate variables, the daily summer values from the three GCMs were combined within each period and scenario in order to represent the variability and distributional characteristics of the data, while also accounting for the uncertainties among the different GCMs. Thus, for each period and scenario, the analyses were based on the combined daily values derived from all three GCMs rather than on presenting the calculated indices and the associated climate variables for each model separately. However, for the statistical significance analysis of DTR changes presented in Table 4, annual summer ensemble values were used as the statistical unit in order to avoid pseudo-replication associated with combined daily samples, temporal autocorrelation and partial dependence between GCM simulations. Specifically, annual summer mean DTR values were calculated for each GCM separately and subsequently averaged across the three GCMs for each year, resulting in 30 annual ensemble values per period and scenario. Similarly, annual summer median DTR values were computed for each GCM separately and then averaged across the three GCMs for each year.
Table 4.
Changes in the mean and median DTR between the near future (NF, 2031–2060) under both scenarios (SSP2-4.5, SSP5-8.5) and the reference period (RP, 1981–2010) in summer, based on annual summer ensemble values, along with the corresponding statistics of Welch’s test and the Mann–Whitney U test and the effect size. The asterisk denotes a statistically significant difference at the 95% confidence level.
The statistical significance of the difference in DTR distributions in terms of the means between the near future (2031–2060) and the reference period (1981–2010) was assessed by applying Welch’s t-test, a method that does not require equal variances and can also be performed for unequal sample sizes [42]. In addition, the difference in DTR distributions with respect to the central tendency between the two periods was assessed by computing the Mann–Whitney U test, a method that does not require the variables to satisfy any distribution curve [43]. In order to determine the magnitude of the DTR difference between the two periods, the Mann–Whitney U test effect size was applied, since statistical significance does not always refer to an effect with a high impact, especially for large samples. Specifically, values of effect size (rMW) below 0.3 denote a small effect, values between 0.3 and 0.5 denote a medium effect, and values above 0.5 denote a large effect. Finally, the ordinary least squares (OLS) regression and Pearson’s correlation were used to quantify the strength, direction, and sensitivity of the relationships between the analyzed variables, including DTR, DIh, DIc, Tmax, Tmin, RHmax and RHmin, in order to better interpret the observed associations between DTR and the discomfort index components. A 95% confidence level was used as a reference threshold for reporting statistical test results.
3. Results
3.1. Changes in Diurnal Temperature Range Distribution
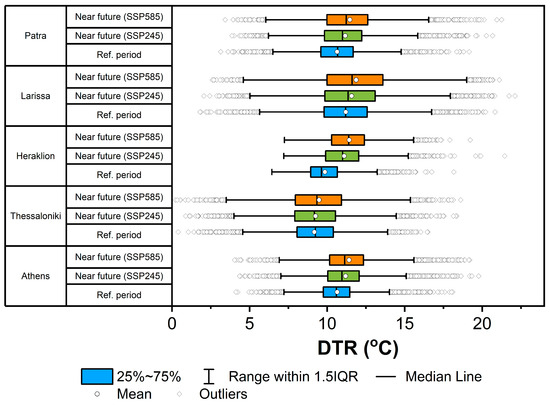
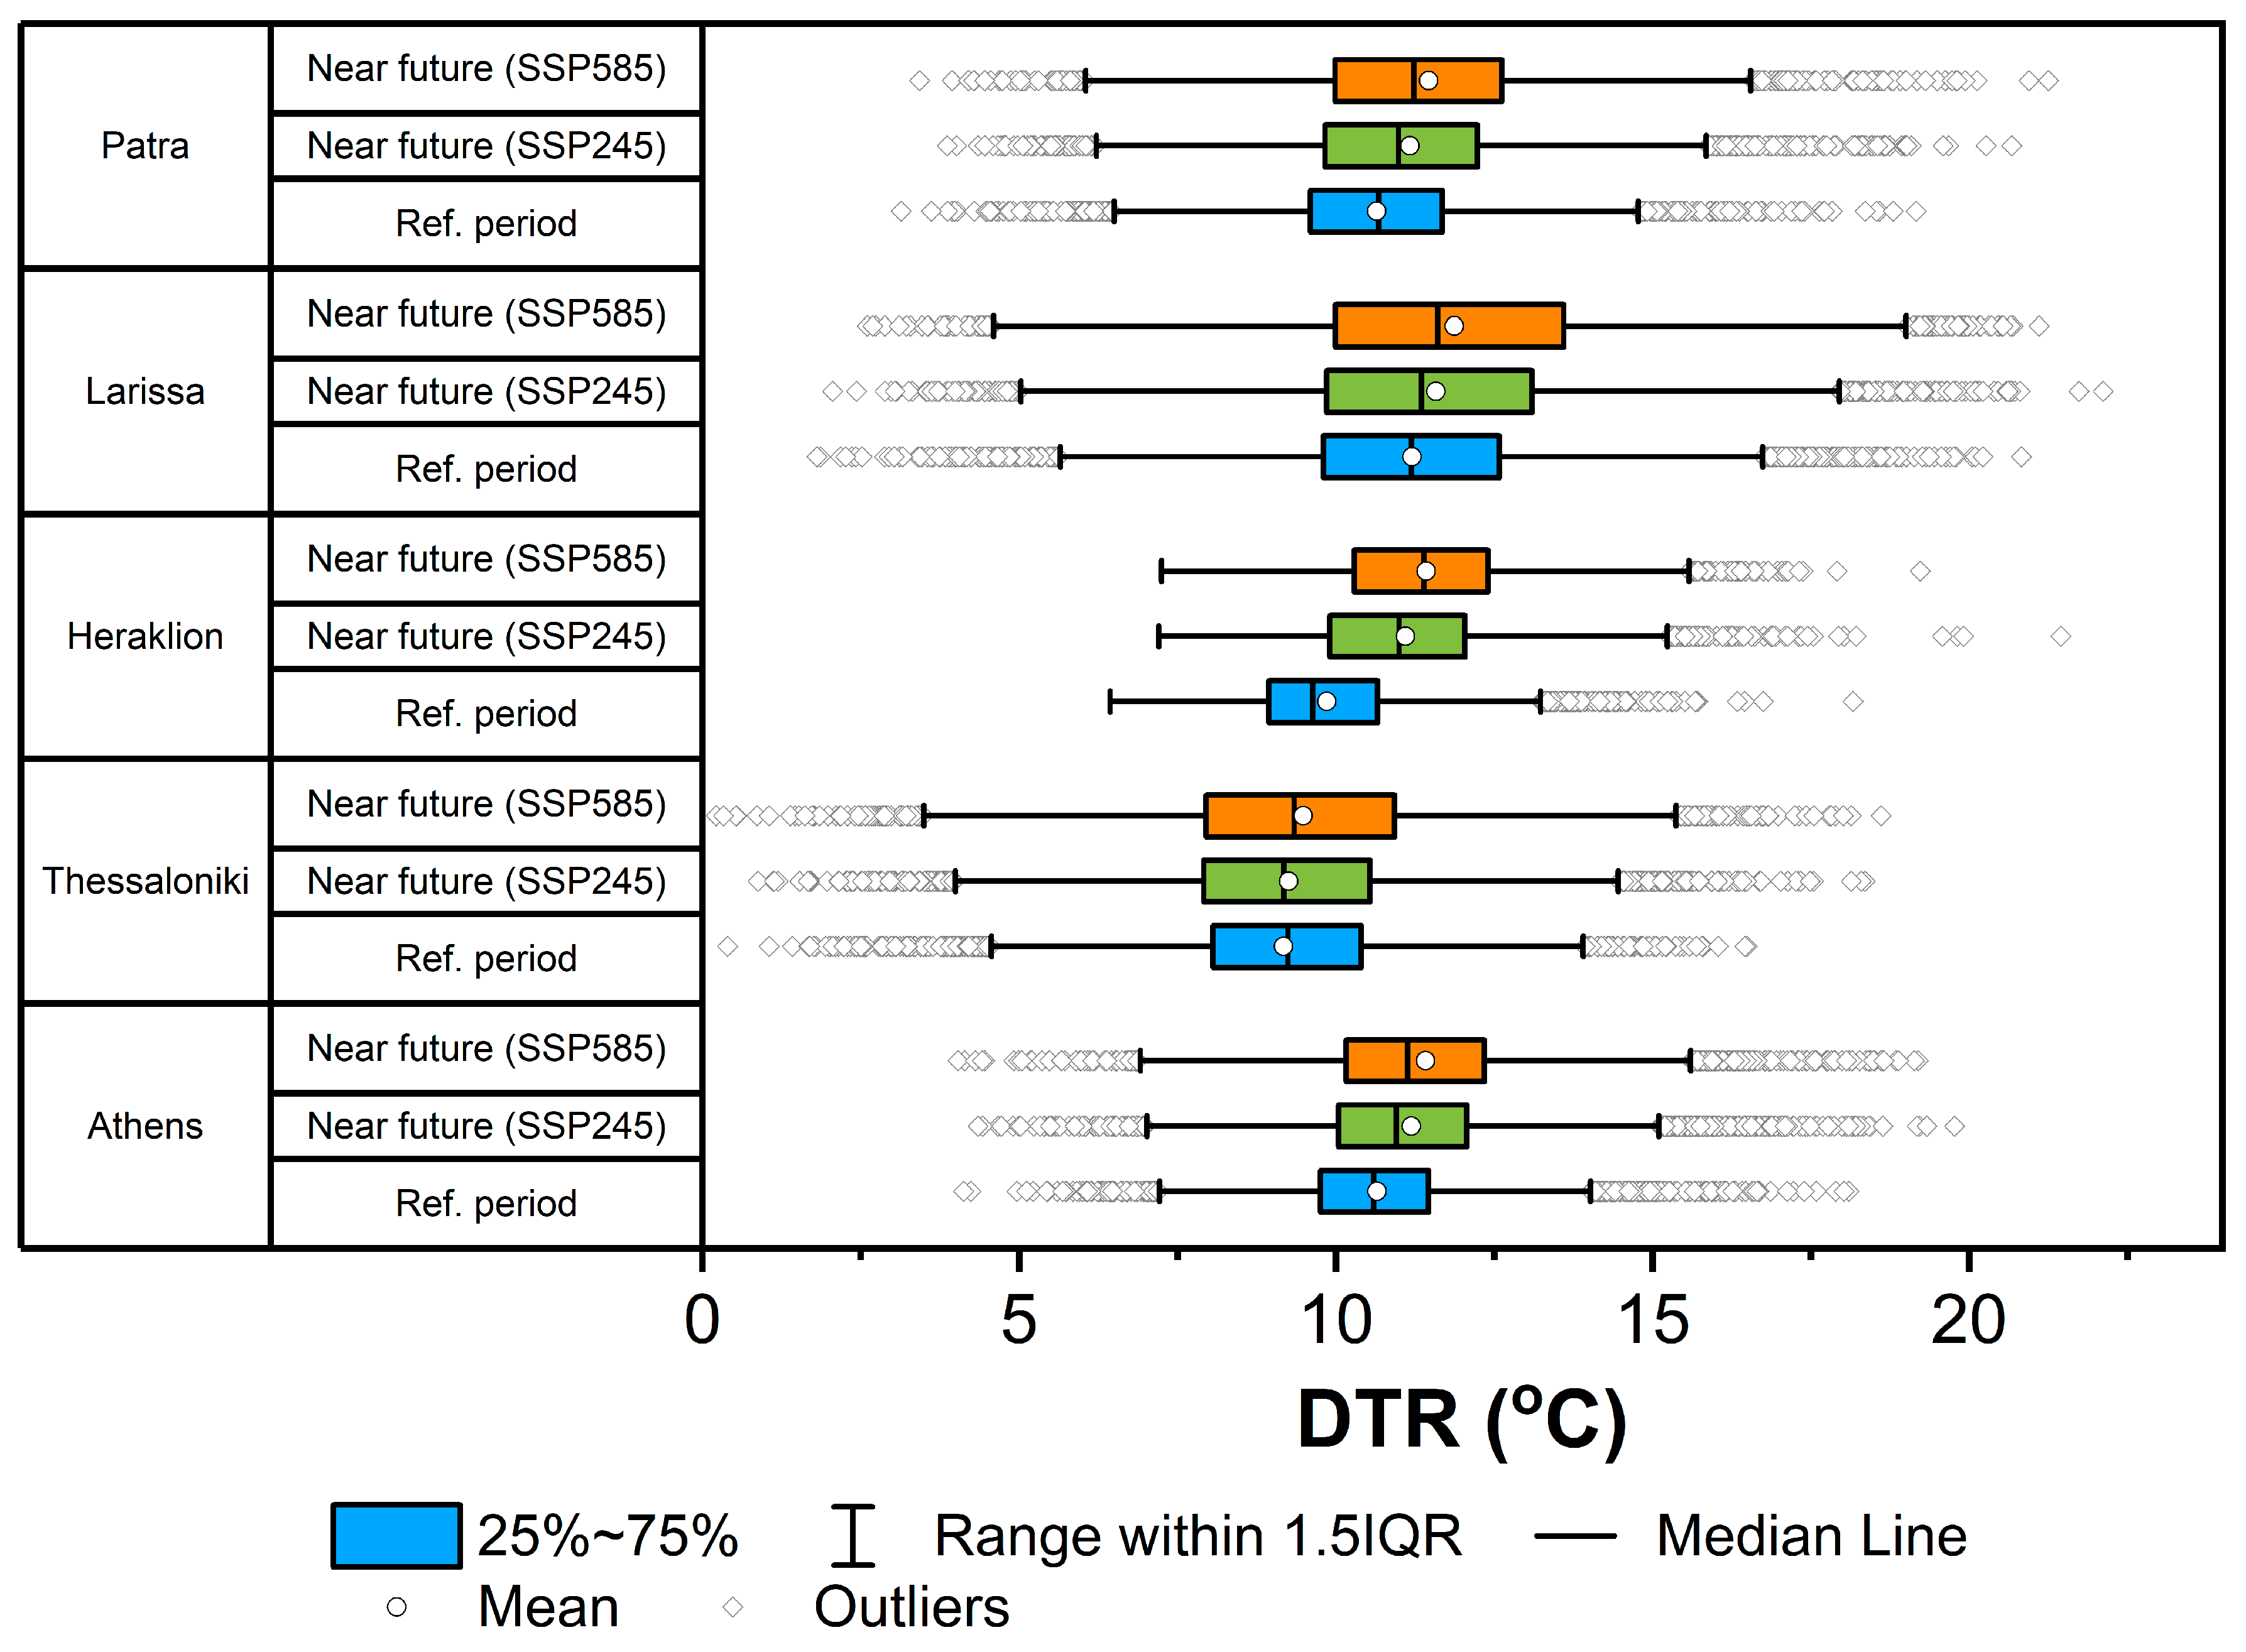
In Figure 1, box-and-whisker plots are used to quantitatively inspect the DTR distributions in summer for the reference period (1981–2010) and for the near future (2031–2060) according to both scenarios (SSP2-4.5, SSP5-8.5). The box-and-whiskers plots and the descriptive statistics discussed below are based on daily summer DTR values in order to illustrate the full distributional characteristics of DTR. In contrast, the statistical significance analysis presented in Table 4 was performed using annual ensemble values to avoid pseudo-replication associated with combined daily samples from multiple GCMs. Further details regarding the statistical approach are provided in the Materials and Methods Section. In the reference period, both the mean and the median DTR were between 9.2 °C (Thessaloniki) and 11.2 °C (Larissa), indicating a maximum difference in mean DTR of 2.0 °C among the cities (Figure 1). The lowest interquartile range (1.7 °C), as a measure of the spread of the data, is noted in Athens and Heraklion, while the highest (2.8 °C) is observed in Larissa. In the near future, the DTR distribution shifts to higher values in most cities, although the magnitude of these shifts varies between cities and scenarios. The increase in mean DTRs was between 0.1 °C (Thessaloniki) and 1.2 °C (Heraklion) for the SSP2-4.5 scenario, and from 0.3 °C (Thessaloniki) to 1.6 °C (Heraklion) for the SSP5-8.5 scenario. According to Welch’s t-test, differences in mean DTR between the near future and the reference period are identified in all cities except Thessaloniki under the SSP2-4.5 scenario (Table 4). Regarding the median DTR, the projected increase is slightly lower (by 0.2 °C) than the increases in the mean, except for Heraklion, where the opposite is noted (1.4 °C for SSP2-4.5, 1.8 °C for SSP5-8.5), and Thessaloniki, where the differences are marginal (Figure 1). The Mann–Whitney U test indicates differences in the DTR distribution with respect to the central tendency between the near future and the reference period in all cities except Thessaloniki under both scenarios (Table 4). In an effort to further clarify the magnitude of the projected differences, the effect size (rMW) was calculated, indicating large effects in Heraklion, Athens and Patra under both scenarios. Larissa shows a medium effect under SSP2-4.5 and a large effect under SSP5-8.5, whereas Thessaloniki shows only small effects, consistent with the comparatively modest projected DTR changes in this city.
Figure 1.
Box-and-whisker plots of the daily summer DTR distribution for the reference period (1981–2010) and the near future (2031–2060) under both scenarios (SSP2-4.5, SSP5-8.5) for the selected cities in the Eastern Mediterranean. Inside each box, the white circle and the vertical line denote the mean and the median value, respectively. The whiskers’ range is 1.5 times the interquartile range and the gray circles denote outliers.
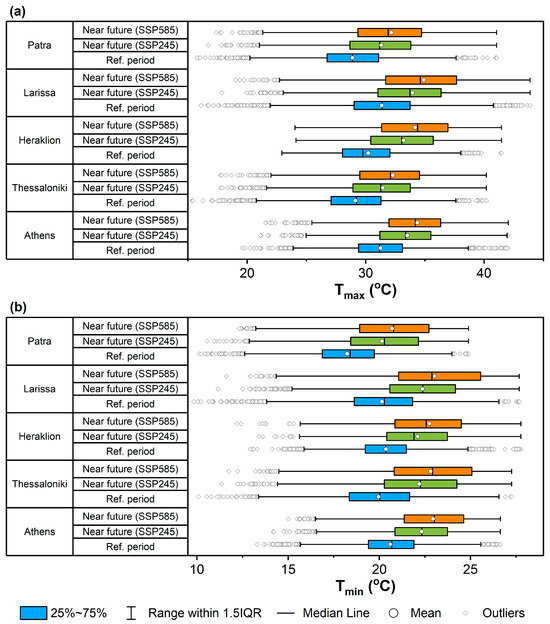
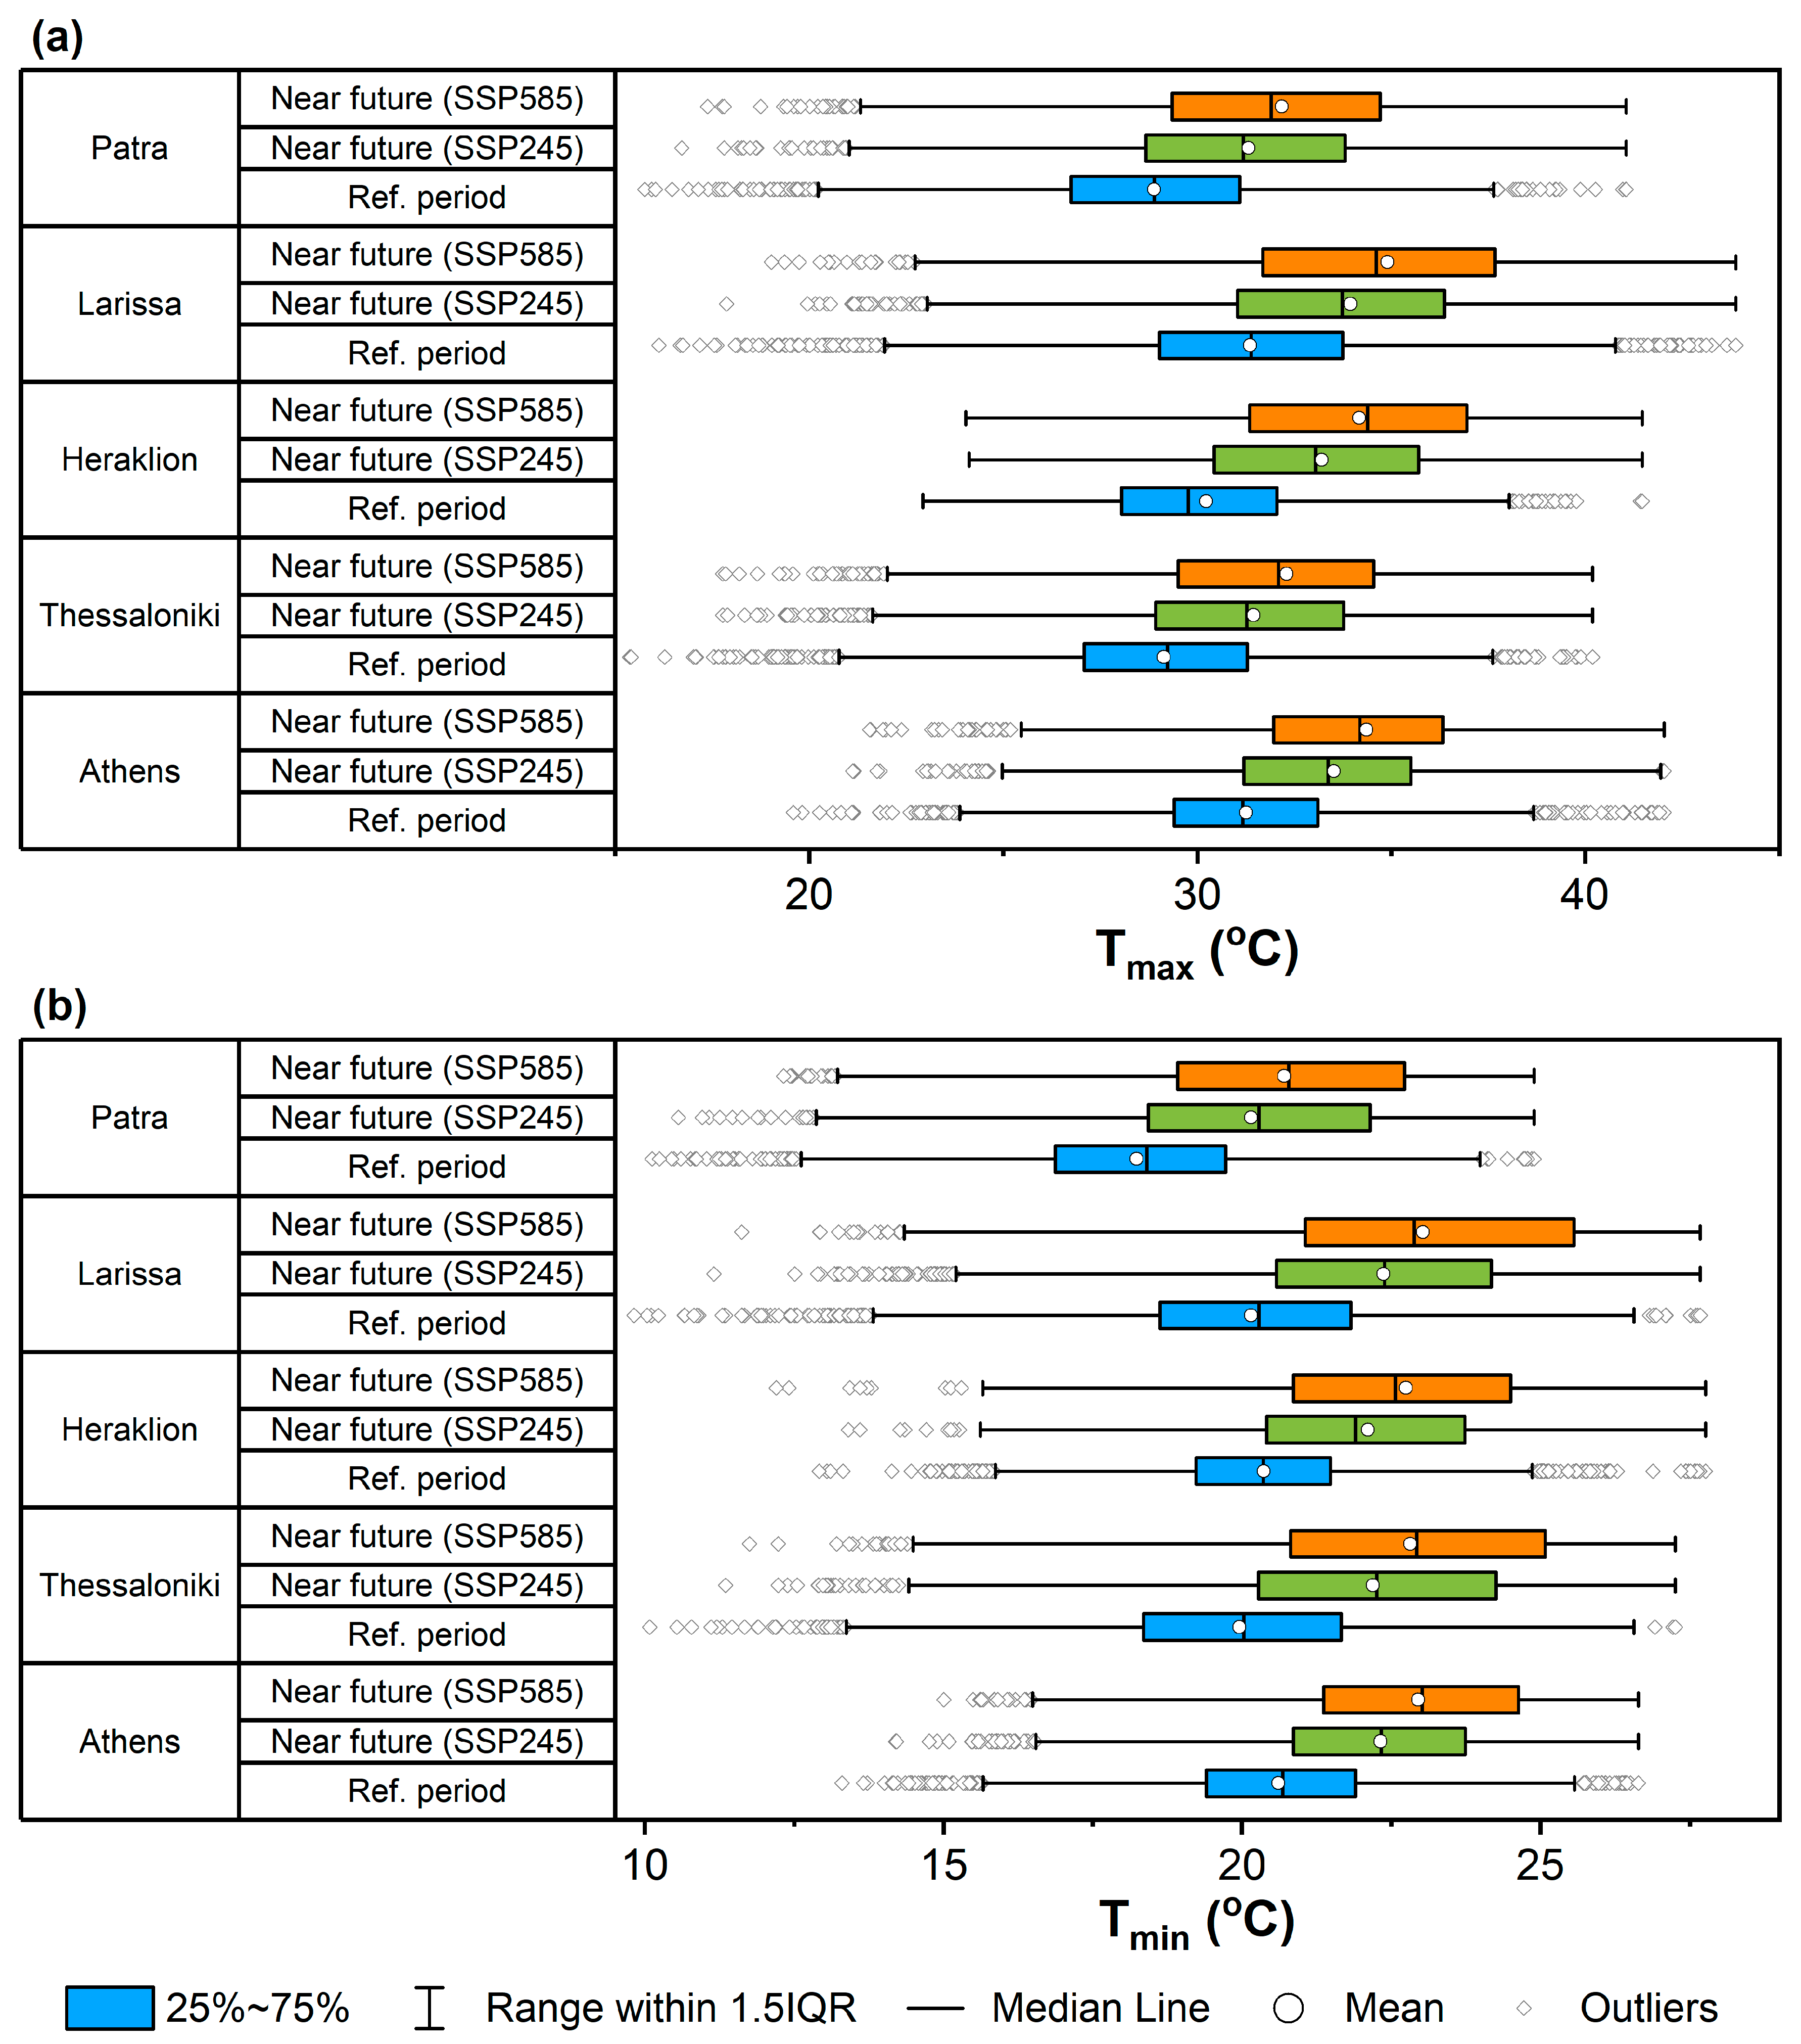
The projected differences in the daily summer DTR distribution between the reference period and the near future are consistent with the asymmetrical response of air temperature, and specifically with the higher increase rate in maximum air temperature than in minimum air temperature in most cities (Figure 2). In particular, the increase in mean Tmax ranges between 2.3 °C (Athens, Thessaloniki) and 3.0 °C (Heraklion) for the SSP2-4.5 scenario, and from 3.1 (Athens) to 4.0 °C (Heraklion) for the SSP5-8.5 scenario. Although Tmin is projected to increase in the near future, the magnitude of this increase is lower than that of Tmax, with mean Tmin increases ranging from 1.7 °C (Athens, Heraklion) to 2.2 °C (Thessaloniki, Larissa) for the SSP2-4.5 scenario, and between 2.3 °C (Athens) and 2.9 °C (Thessaloniki, Larissa) for the SSP5-8.5 scenario. When the magnitude of the Tmin increase in the near future closely follows the magnitude of the Tmax increase, as in Thessaloniki, the DTR differences between the near future and the reference period are less pronounced. Conversely, the greater the difference between the two rates of increase, the greater the difference in DTR, as in Heraklion.
Figure 2.
Box-and-whisker plots of the daily summer (a) Tmax distribution and (b) Tmin distribution for the reference period (1981–2010) and the near future (2031–2060) under both scenarios (SSP2-4.5, SSP5-8.5) for the selected cities in the Eastern Mediterranean. Inside each box, the white circle and the vertical line denote the mean and the median value, respectively. The whiskers’ range is 1.5 times the interquartile range and the gray circles denote outliers.
3.2. Frequency of DI-Based Thermal Discomfort Classes and Projected Changes
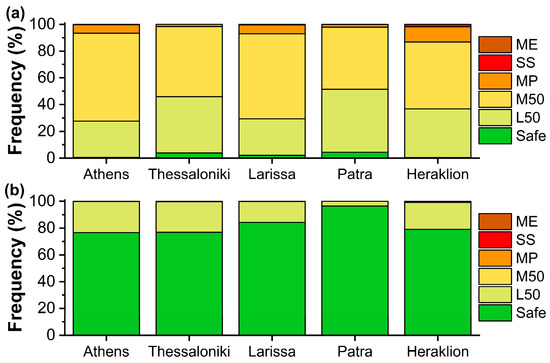
Figure 3 illustrates the frequency distribution of thermal discomfort classes according to the DIh (Figure 3a) and DIc (Figure 3b) components in summer over the reference period (1981–2010) for the selected cities. The discomfort levels of the DIh component indicate that the M50 class dominates, followed by the L50 class (Figure 3a). In particular, the M50 class occurs in a percentage of summer days ranging from 47% (Patra) to 66% (Athens, Larissa). At the same time, the L50 class occurs in a percentage of summer days that range between 27% (Athens, Larissa) and 47% (Patra). The Safe class is observed at low frequencies in all cities (<5%). Of the upper-DI classes, only the MP class shows relatively high frequencies in Heraklion (11%), Athens (6%) and Larissa (6%).
Figure 3.
Frequency distribution of thermal discomfort classes for the two DI components, (a) DIh and (b) DIc, in summer over the reference period (1981–2010) for the selected cities in the Eastern Mediterranean.
Regarding the DIc component, the Safe class dominates with frequencies higher than 77% depending on the city (Figure 3b). However, it should be noted that for approximately 20% of summer days, the L50 class occurs in Athens, Thessaloniki and Heraklion.
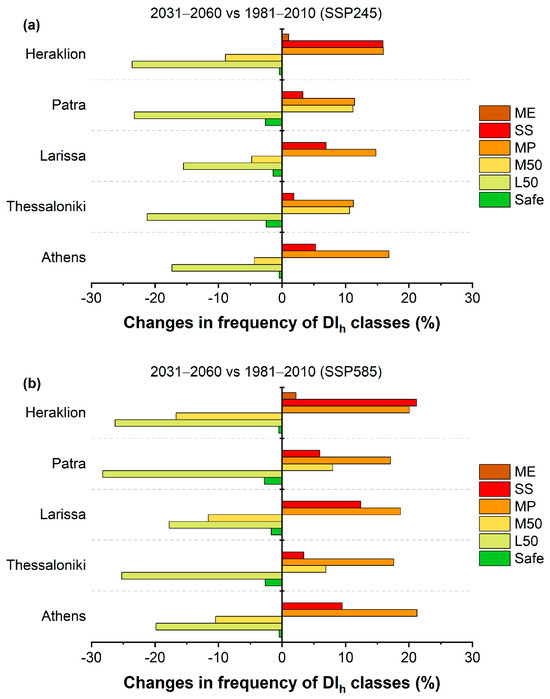
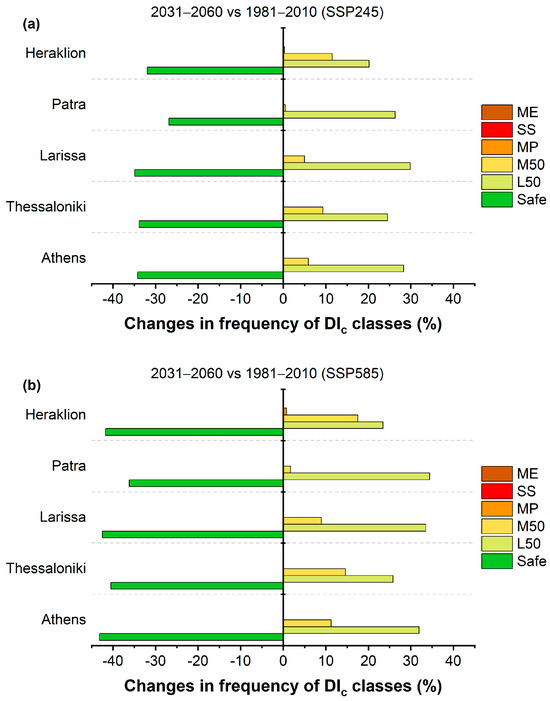
The changes in the distribution of DI-based thermal discomfort classes in the near future (2031–2060) compared to the reference period (1981–2010) are depicted in Figure 4 and Figure 5 for the DIh and DIc components, respectively. Regarding the DIh component, a decrease in the frequency of Safe and L50 classes is projected in the near future, with the reduction percentage for the L50 class estimated to range between −15% (Larissa) and −24% (Patra, Heraklion) for the SSP2-4.5, and up to −28% (Patra) for the SSP5-8.5.
Figure 4.
Changes (%) in DIh class frequencies in the near future (2031–2060) compared to the reference period (1981–2010) for the scenarios (a) SSP2-4.5 and (b) SSP5-8.5 in summer for the selected cities in the Eastern Mediterranean.
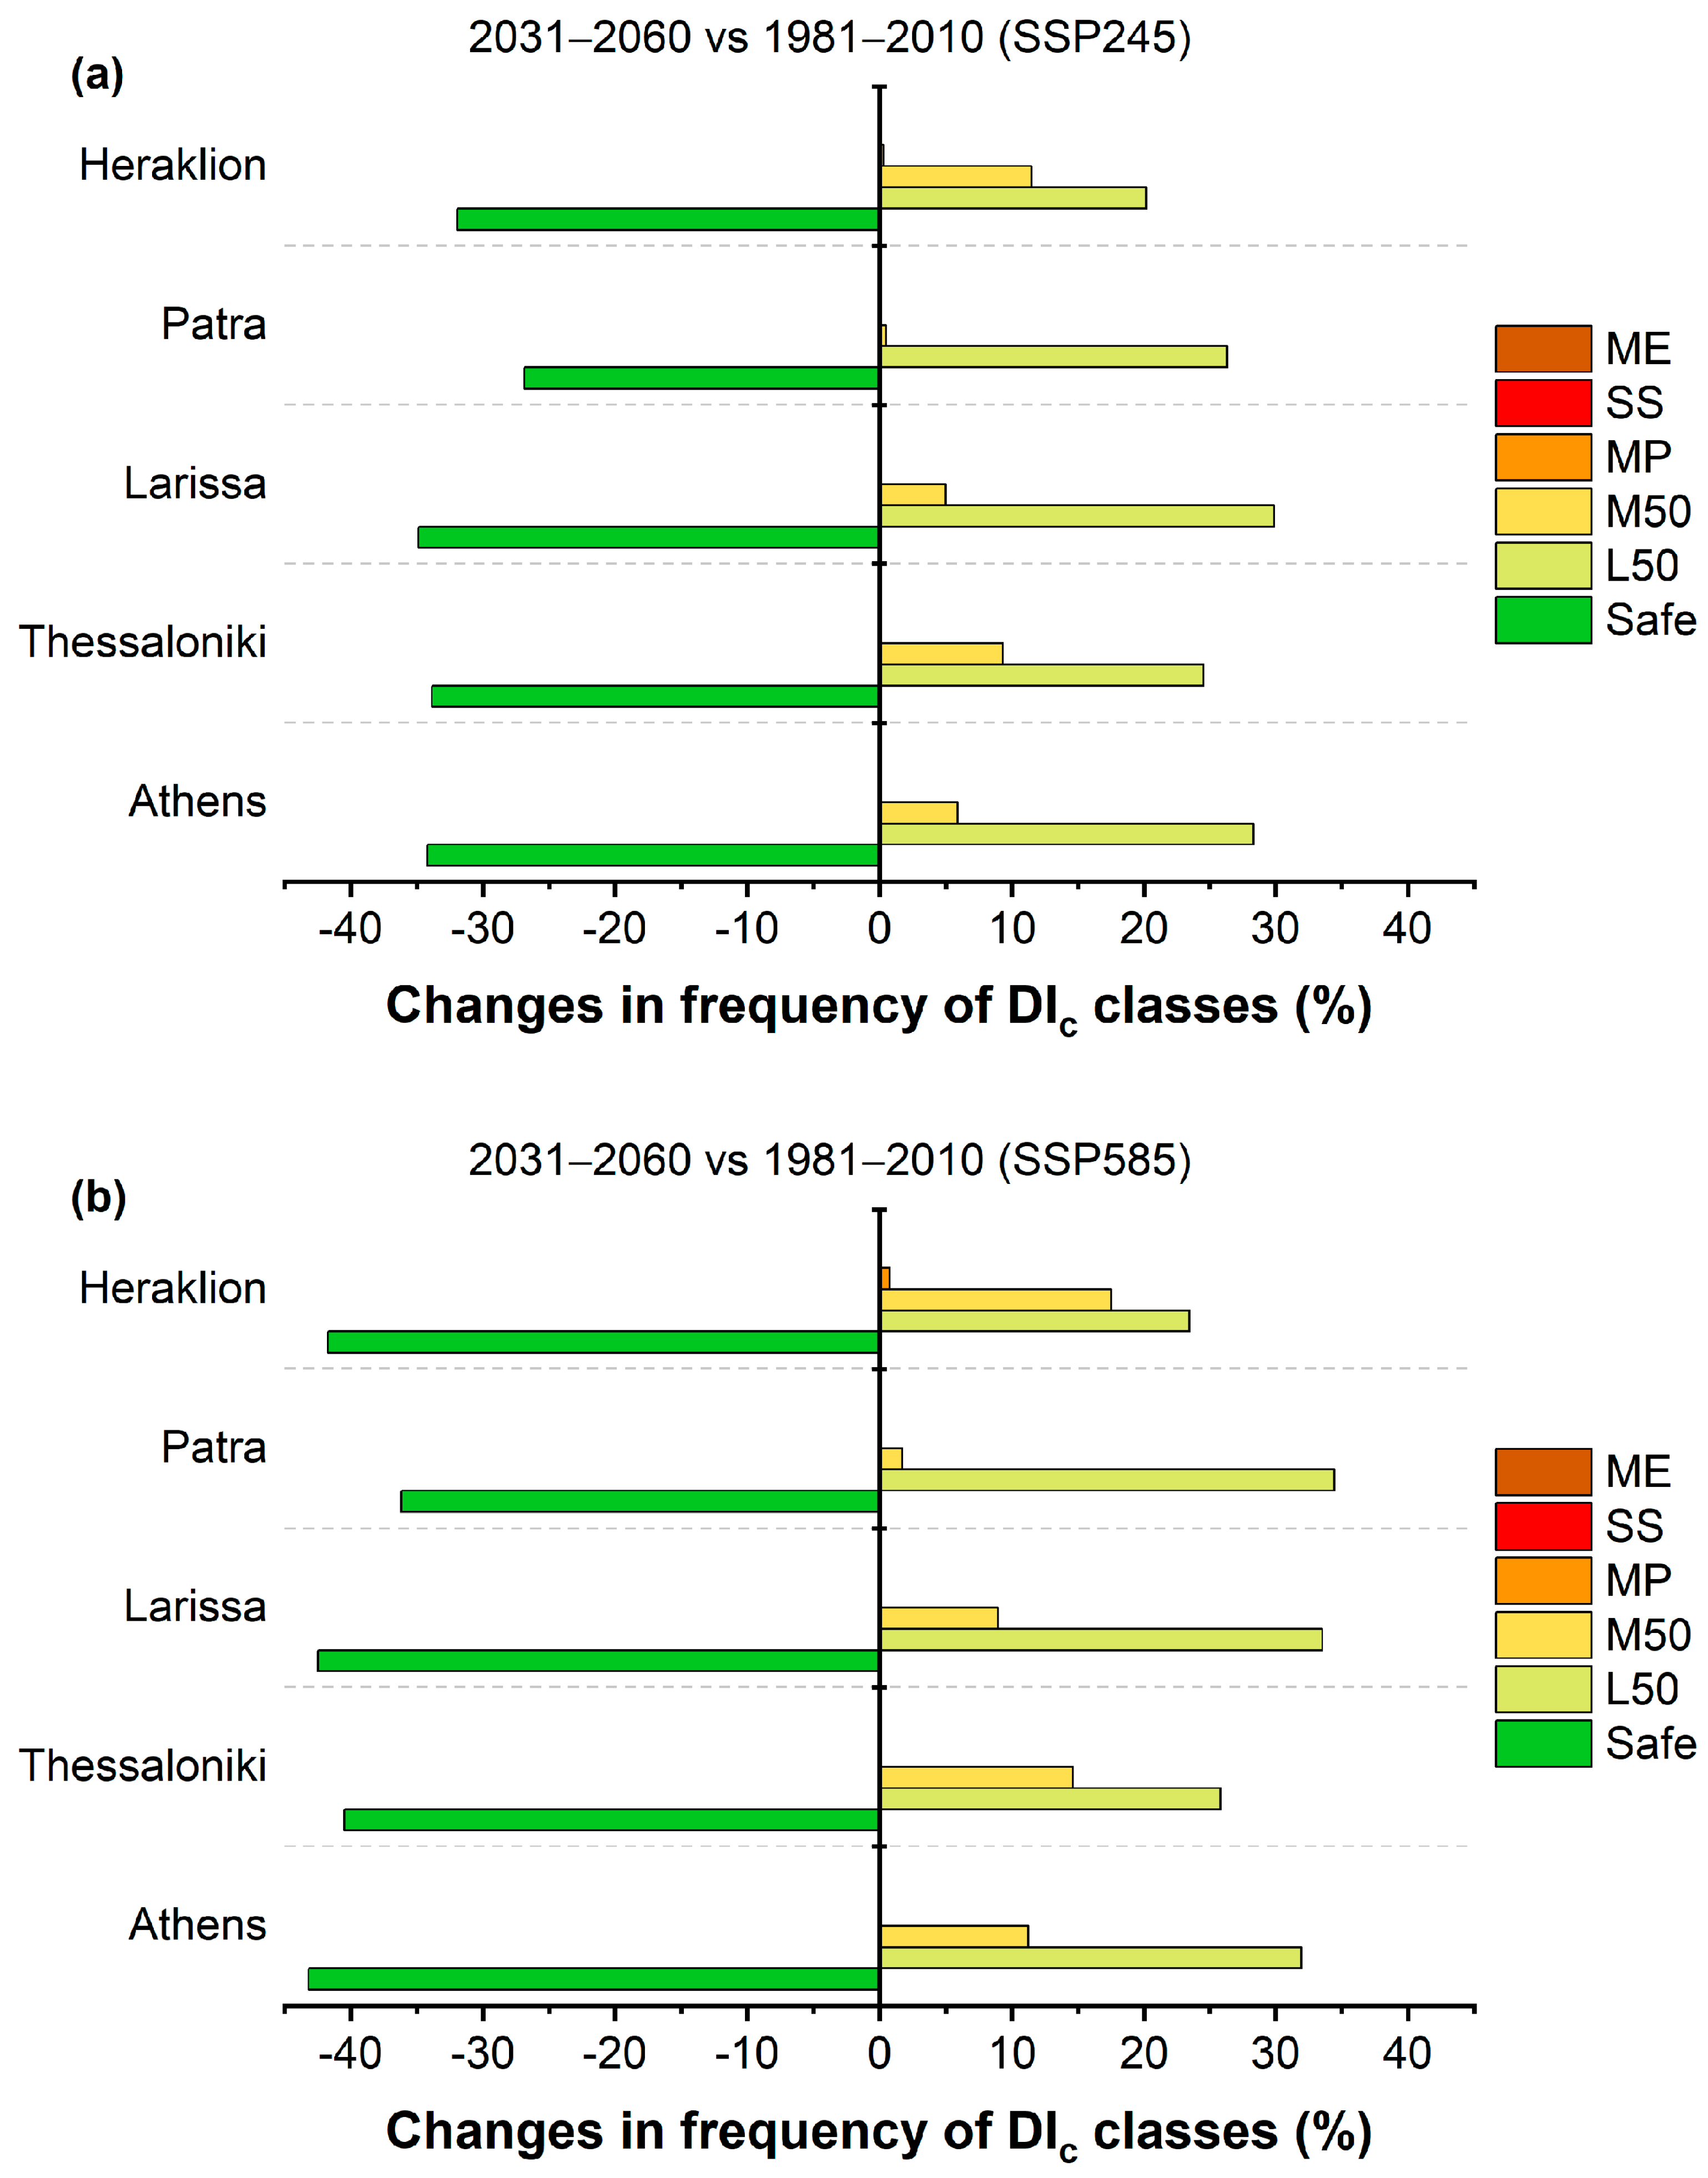
Figure 5.
Changes (%) in DIc class frequencies in the near future (2031–2060) compared to the reference period (1981–2010) for the scenarios (a) SSP2-4.5 and (b) SSP5-8.5 in summer for the selected cities in the Eastern Mediterranean.
Conversely, the frequency of summer days in higher DI classes (MP and SS) is projected to increase in all cities in the near future. The largest changes for the MP class seem to occur in Athens (+17% for the SSP2-4.5, +21% for the SSP5-8.5) and Heraklion (+16% for the SSP2-4.5, +20% for the SSP5-8.5), while the smallest changes are expected in Patra and Thessaloniki (up to 11% for the SSP2-4.5, up to 17% for the SSP5-8.5). The largest changes for the SS class are projected in Heraklion (+16% for the SSP2-4.5, +21% for the SSP5-8.5), followed by the modest changes in Larissa and Athens (up to +7% for the SSP2-4.5, up to 12% for the SSP5-8.5), whereas the smallest changes appear in Thessaloniki and Patra (up to 3% for the SSP2-4.5, up to 6% for the SSP5-8.5). Heraklion on the island of Crete is the only city among those studied where days classified as ME are projected in the near future, albeit at a marginal frequency in both scenarios, corresponding to up to 2 days.
Regarding the DIc component, a decrease in the frequency of days classified as Safe is projected, with the reduction percentage ranging between −26% (Patra) and −34% (Athens, Larissa) for the SSP2-4.5, and from −36% (Patra) to −43% (Athens) for the SSP5-8.5 (Figure 5). The projected decrease in the frequency of days in the Safe class is accompanied by an increase in the frequency of days primarily in the L50 class (up to +29% for the SSP2-4.5, up to +34% for the SSP5-8.5) and, to a lesser extent, in the M50 class (up to +11% for the SSP2-4.5, up to +17% for the SSP5-8.5).
3.3. Association Between Diurnal Temperature Range and DI-Based Thermal Discomfort Indicators
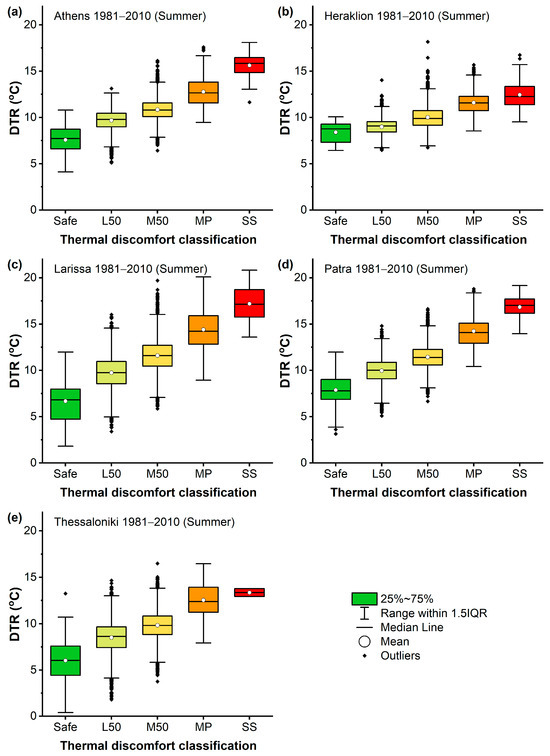
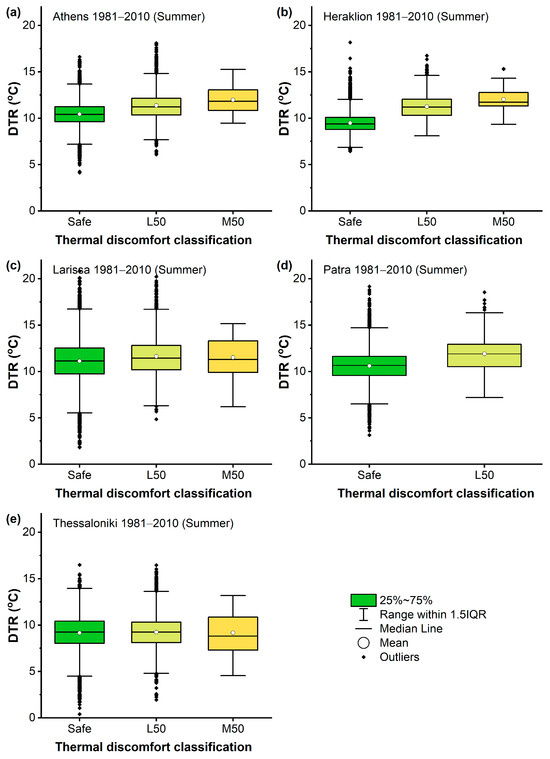
While the analysis so far has focused on the separate investigation of DTR and DI-based conditions, examining how DTR varies across different DI classes may provide additional insight into the association among variables. Therefore, we combined DTR with DI-based conditions at the two extreme points of the day, represented by the DIh and DIc components. Figure 6 shows the DTR distribution across DIh classes in summer over the reference period (1981–2010) for each city.
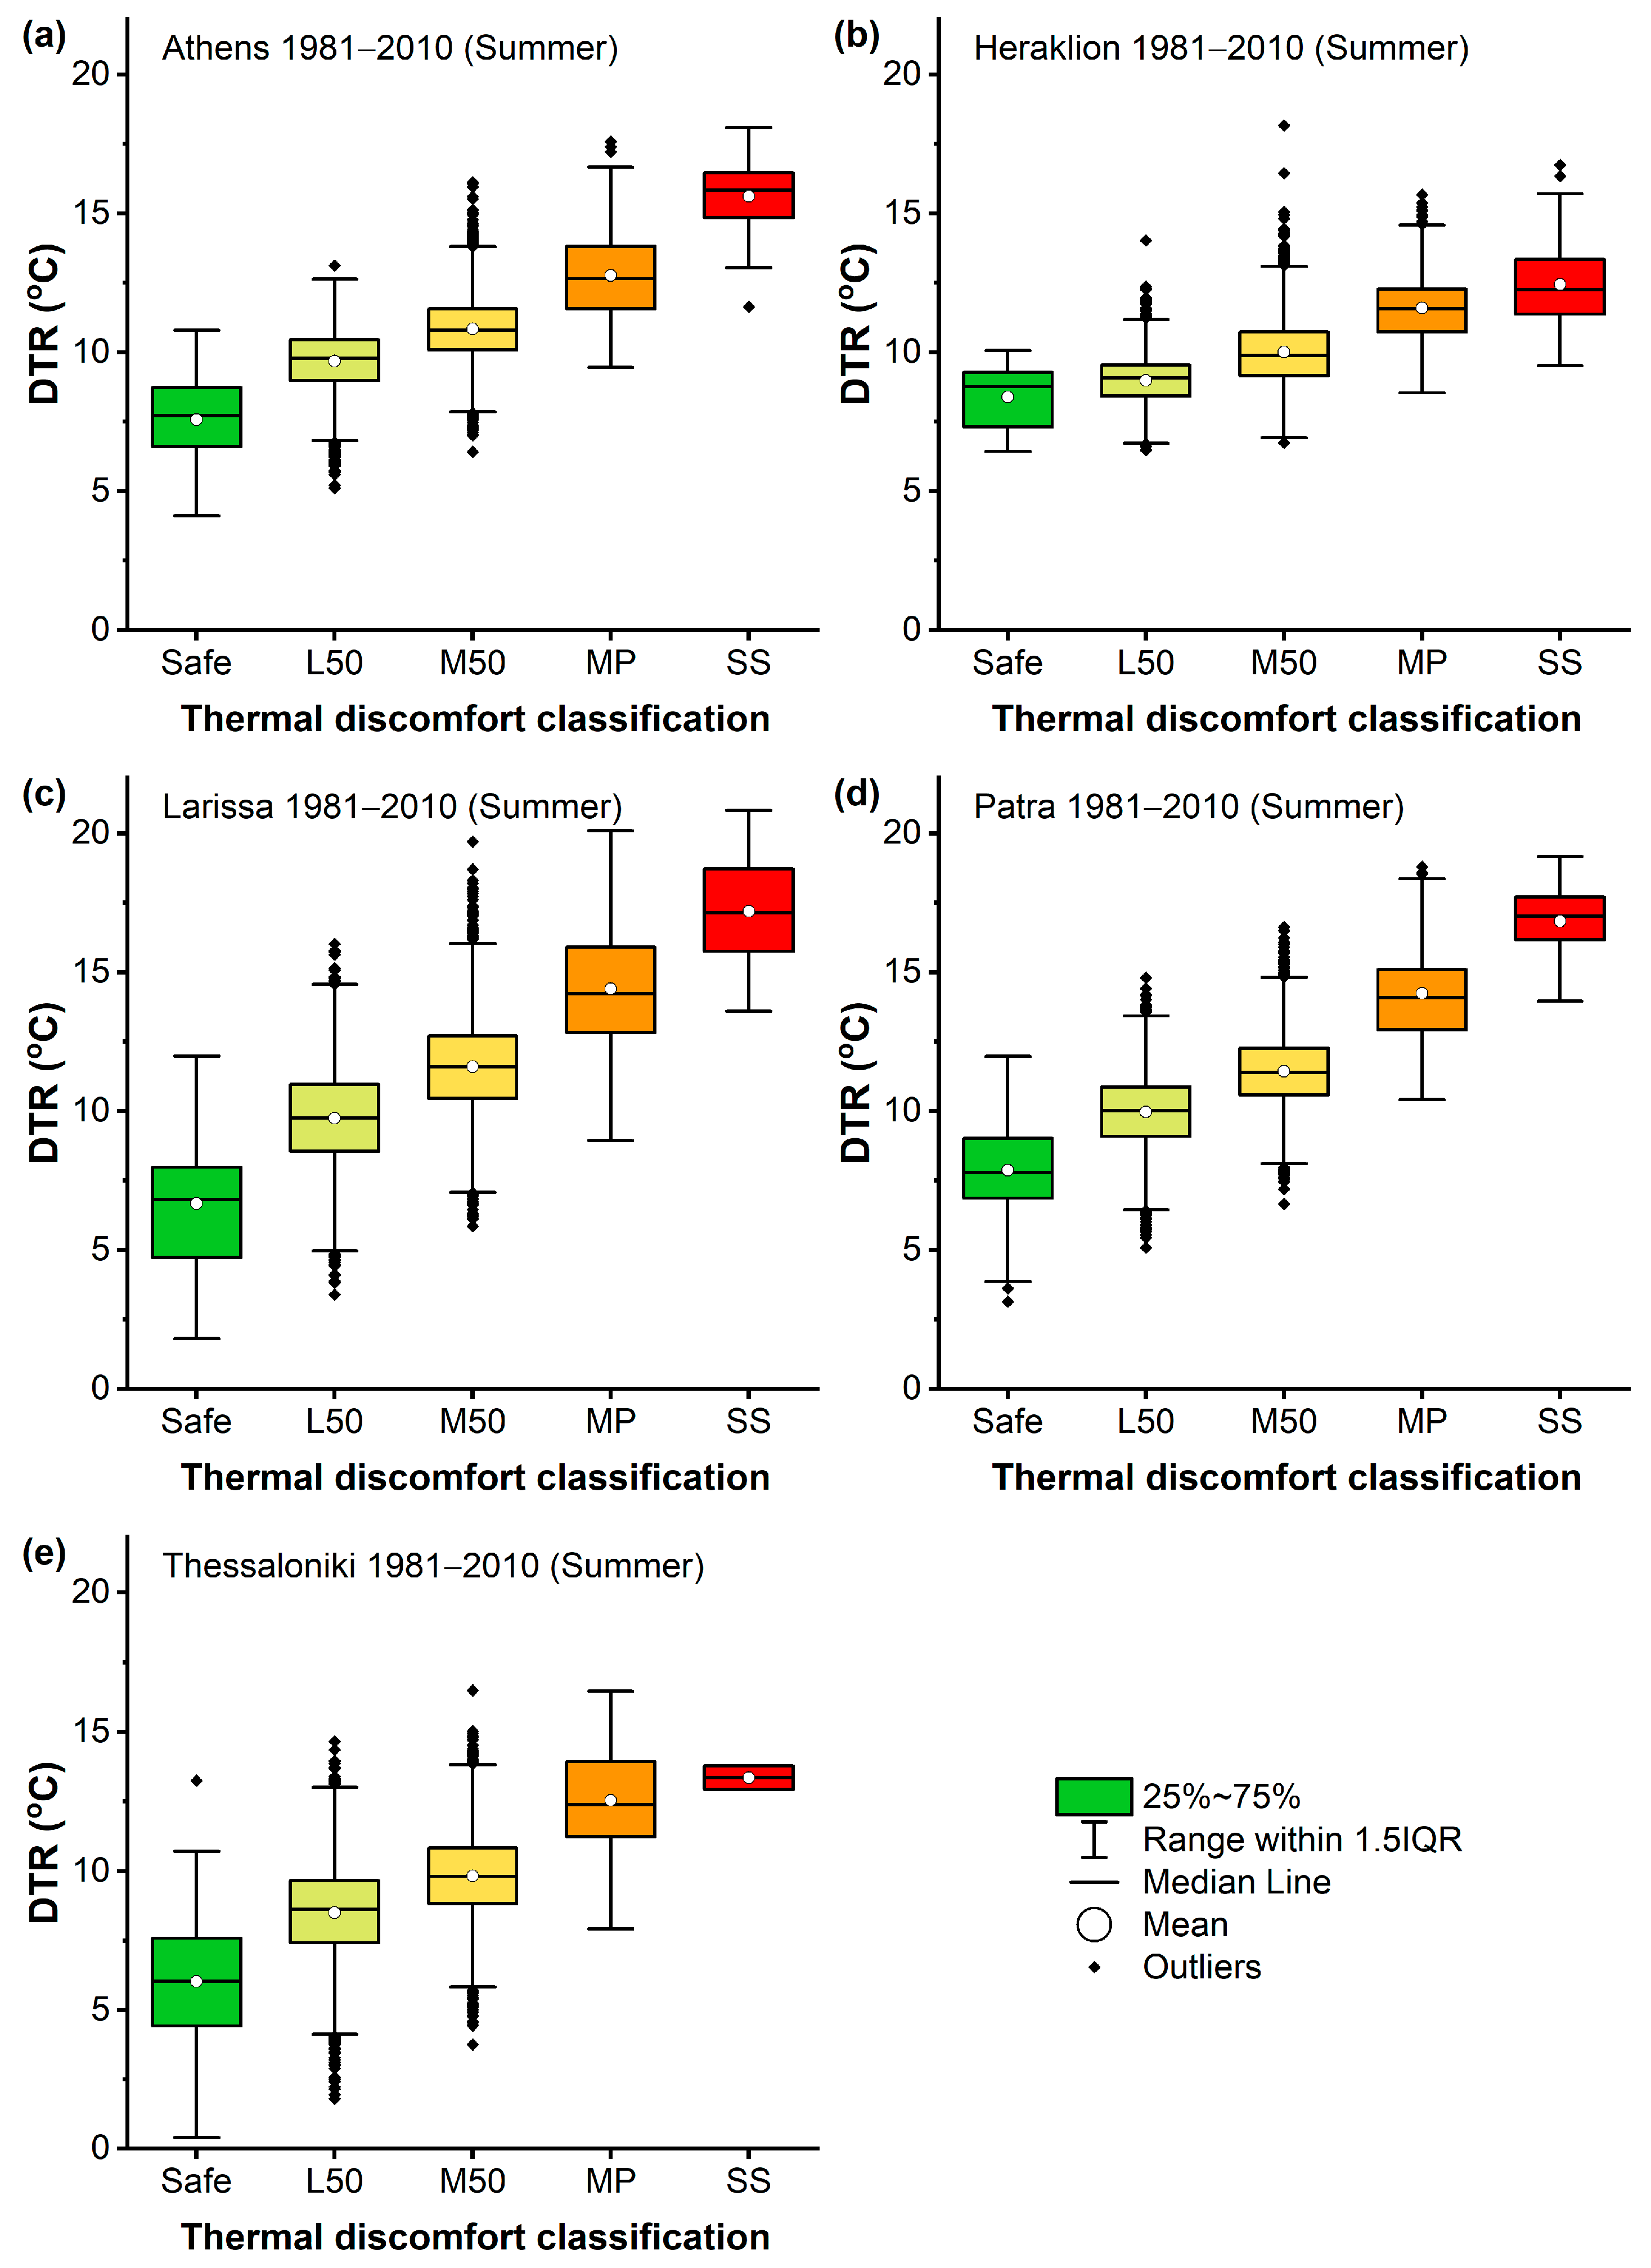
Figure 6.
Distribution of DTR across DIh thermal discomfort classes in summer over the reference period (1981–2010) for the selected cities (a–e) in the Eastern Mediterranean.
As shown in Figure 6, DTR increases across higher DIh classes. For example, in Athens and Larissa, days classified as SS have an average DTR of 15.6 °C and 17.2 °C, compared to 7.6 °C and 6.7 °C for those classified as Safe, respectively. Among the studied cities, Heraklion exhibits the weakest association between DTR and discomfort classes. Nevertheless, days classified as SS have, on average, a DTR of 4.0 °C higher than days characterized as Safe. DTR generally increases with higher DIh classification levels, showing larger values for the upper classes. For example, the average increase in DTR between SS and Safe ranges from 4.0 °C (Heraklion) to 10.5 °C (Larissa), while between MP and Safe it ranges from 3.2 °C (Heraklion) to 7.7 °C (Larissa). The smallest average increase in DTR is observed between L50 and Safe, ranging from 0.6 °C (Heraklion) to 3.1 °C (Larissa).
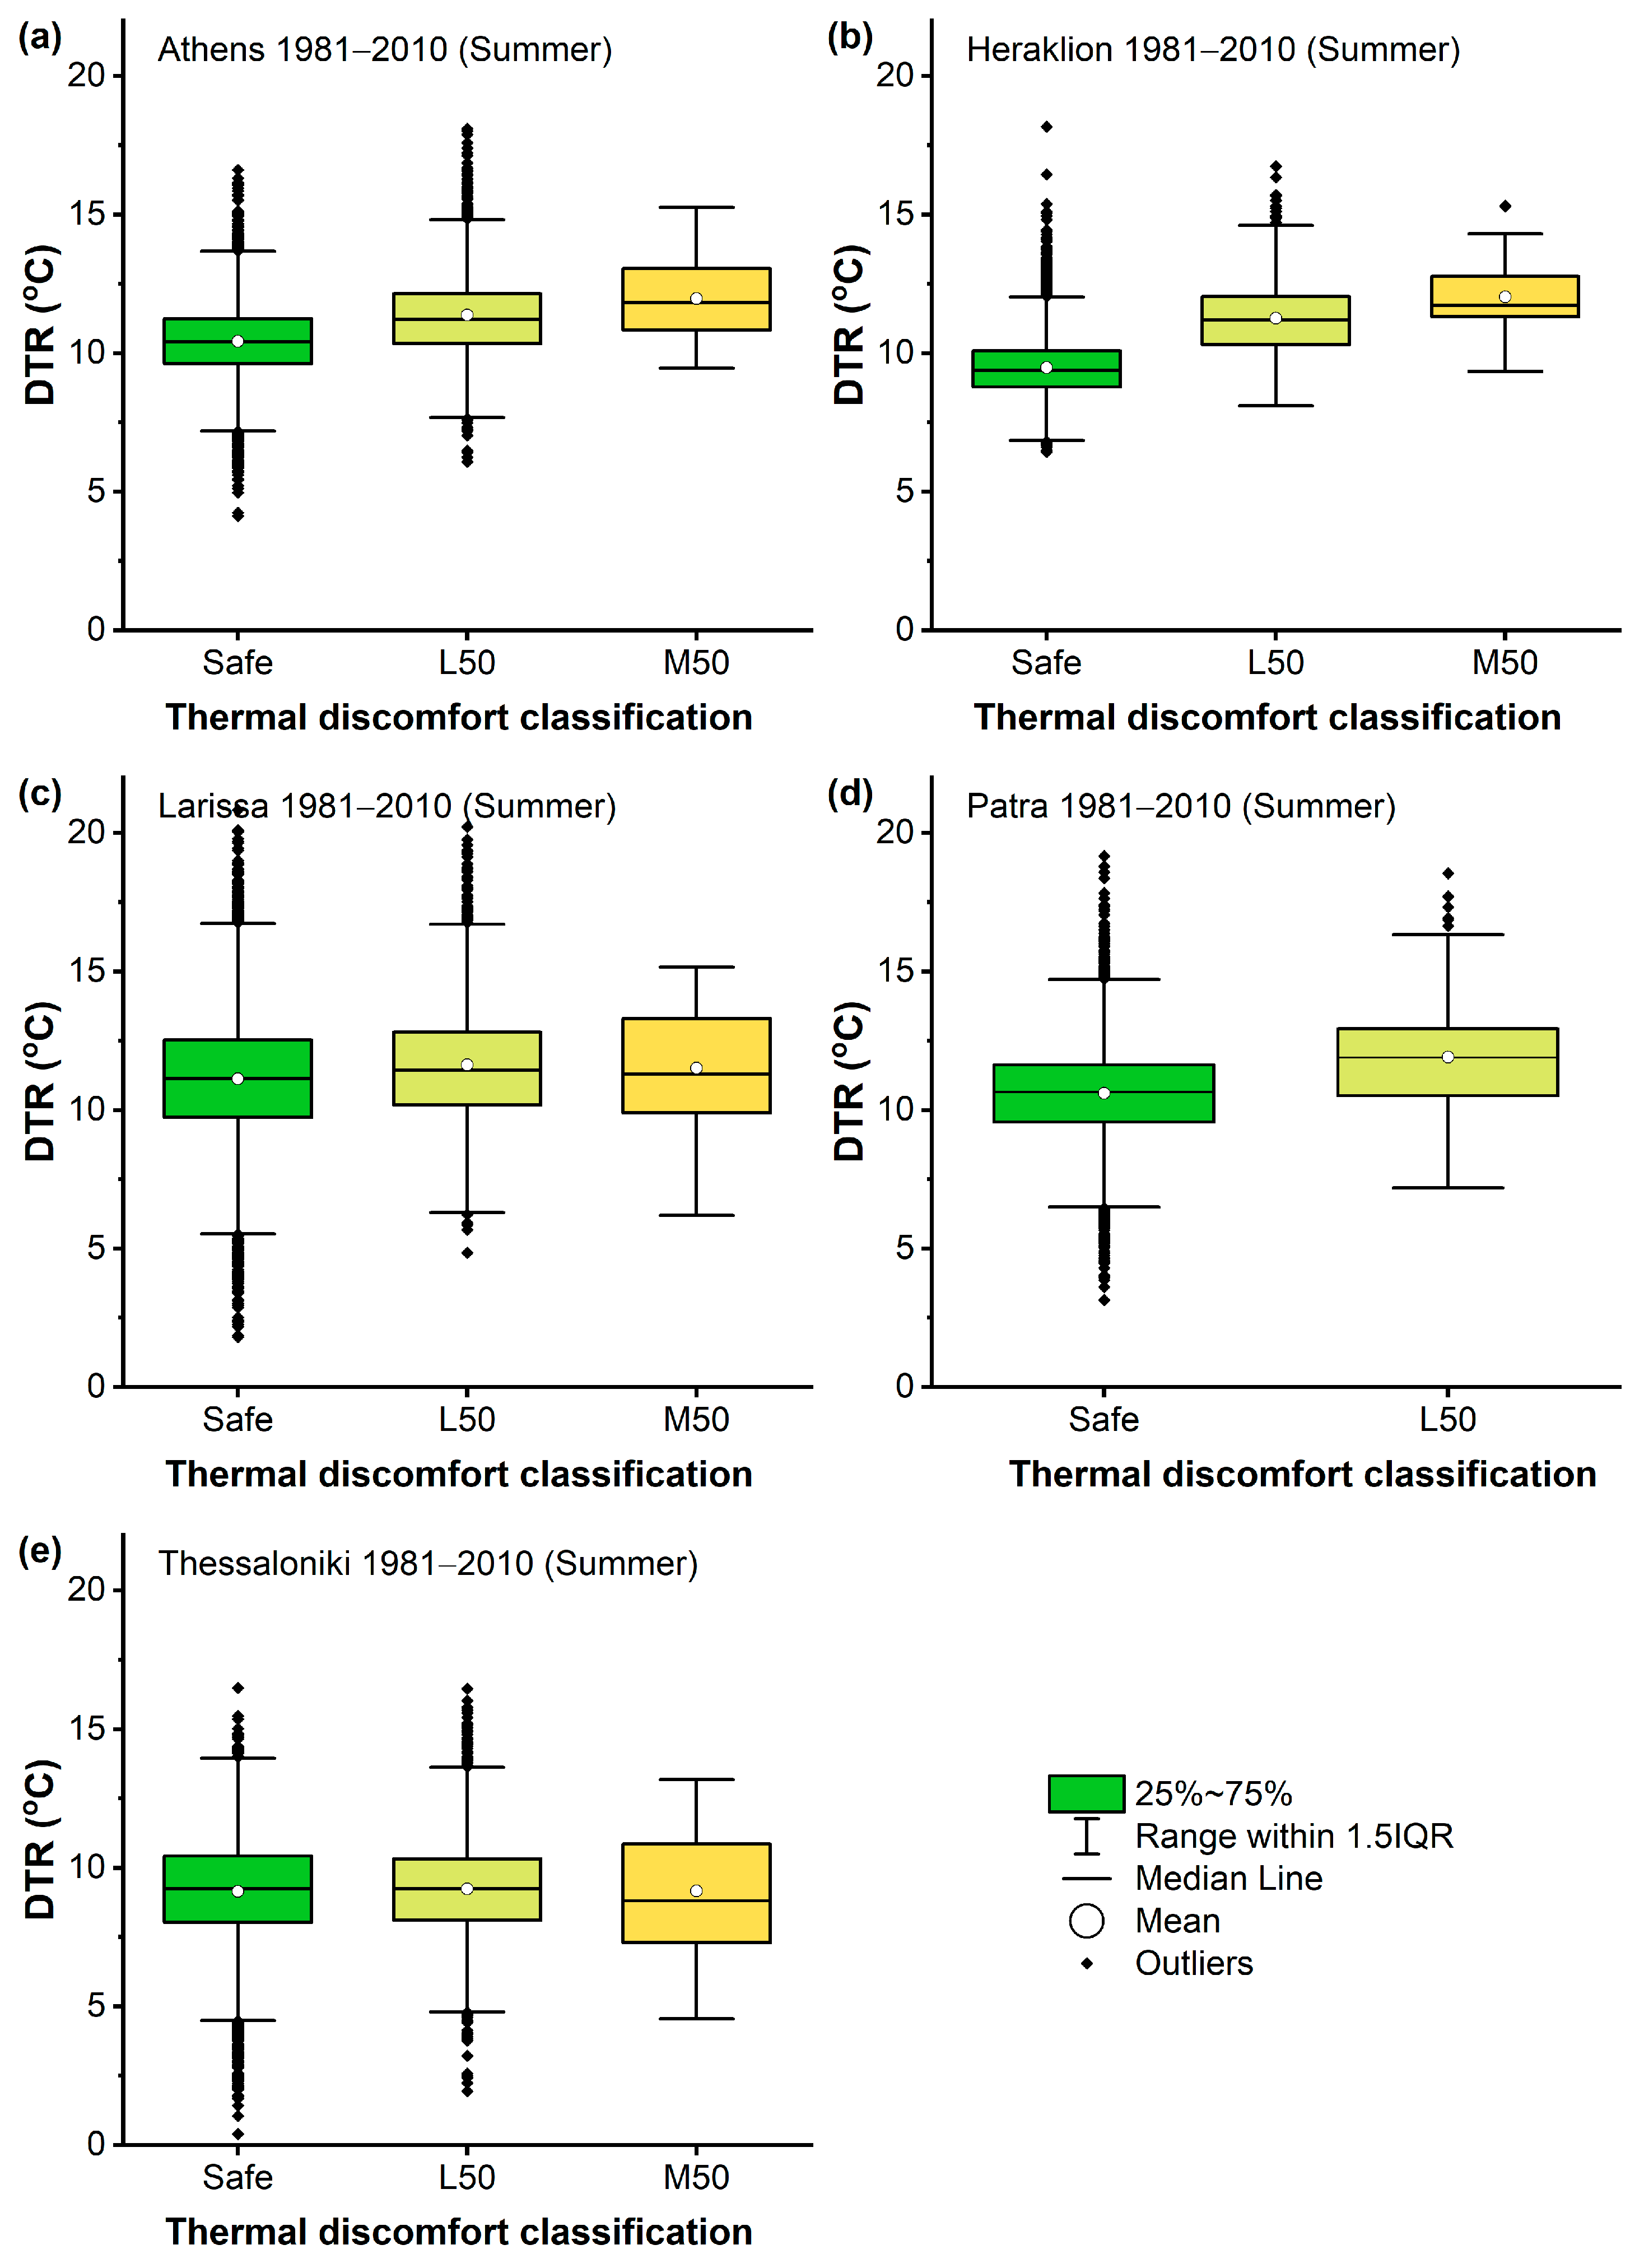
Figure 7 shows the DTR distribution across DIc classes in summer over the reference period (1981–2010) for each city.
Figure 7.
Distribution of DTR across DIc thermal discomfort classes in summer over the reference period (1981–2010) for the selected cities (a–e) in the Eastern Mediterranean.
In contrast to previous findings, Figure 7 suggests an absence or minimal association between DTR and DIc classes. Heraklion is the only city in which DIc classes generally correspond to slightly higher DTR values. In particular, days classified as M50 and L50 show average DTR values of 12.0 °C and 11.3 °C, respectively, compared to 9.5 °C for days classified as Safe.
3.4. Associations Between DTR, DI-Based Thermal Discomfort Indicators, and Temperature and Humidity Variables
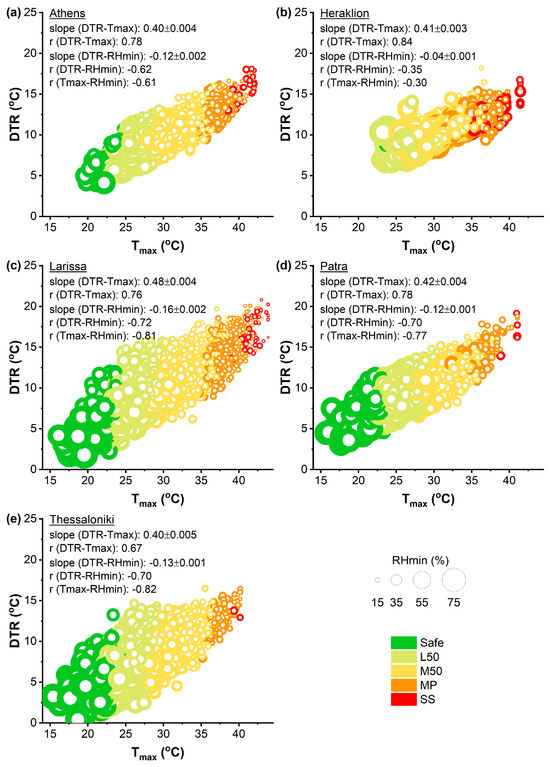
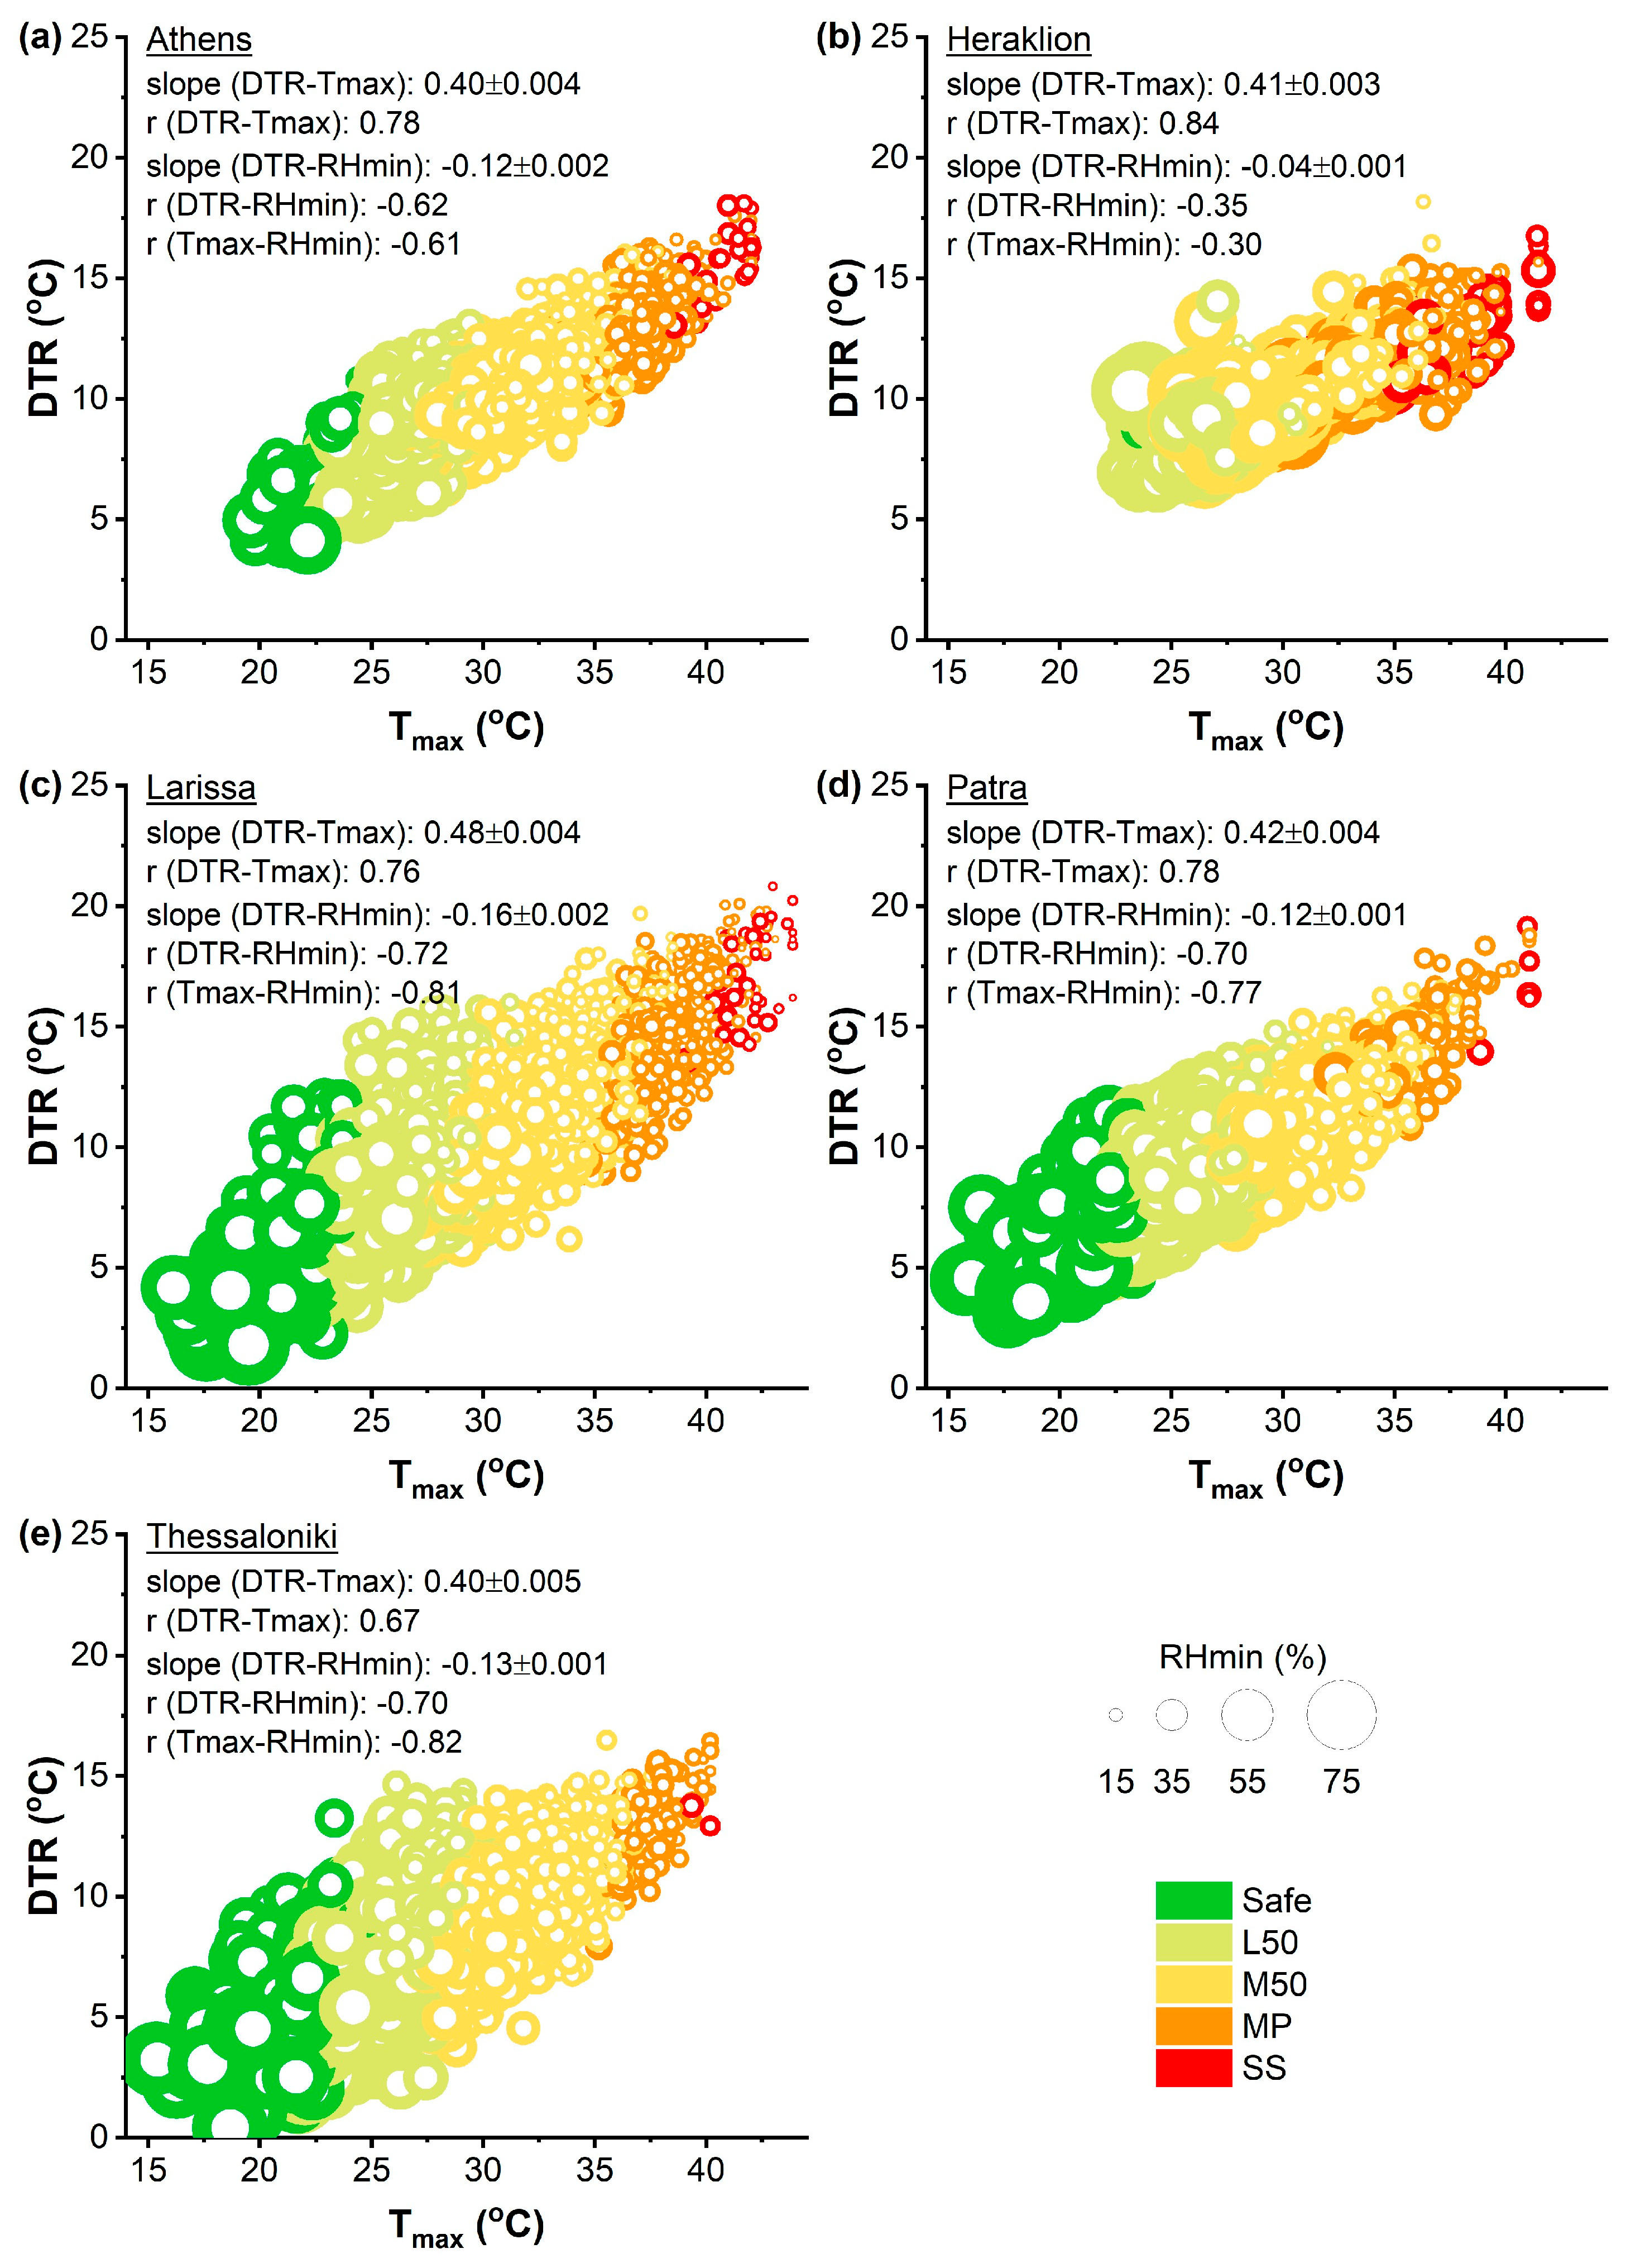
In an effort to clarify the observed association between DTR and DI-based thermal discomfort indicators (DIh and DIc), we created Figure 8 and Figure 9, integrating all variables to further investigate this association. Since DTR and the DI components share common temperature variables (Tmax for DIh and Tmin for DIc), part of the observed associations may reflect this dependence. A positive association between DTR and Tmax is observed across all five cities, with regression slopes ranging from 0.40 to 0.48 (Figure 8). Specifically, the slopes (± standard deviations) are 0.40 ± 0.004 (Athens), 0.41 ± 0.003 (Heraklion), 0.48 ± 0.004 (Larissa), 0.42 ± 0.004 (Patra), and 0.40 ± 0.005 (Thessaloniki) (p < 0.05). Pearson’s correlation coefficients further indicate this positive association between DTR and Tmax, with values ranging from 0.67 (Thessaloniki) to 0.84 (Heraklion) (p < 0.05). Conversely, DTR exhibits a negative association with RHmin (p < 0.05). RHmin is included in the calculation of the DIh component, although it is not part of the computation of DTR. However, the slope for Heraklion is notably smaller (−0.04 ± 0.001), indicating a weaker inverse association compared to other cities, where slopes range from −0.12 (Athens) to −0.16 (Larissa). This is further supported by Pearson’s correlation coefficients, with a weaker negative correlation in Heraklion (−0.35) and stronger negative correlations in the other cities (ranging from −0.62 in Athens to −0.72 in Larissa) (p < 0.05). The observed negative association between DTR and RHmin is consistent with the positive association between DTR and Tmax and the negative association between Tmax and RHmin. The latter association is apparent in all cities, with Pearson’s r ranging from −0.61 to −0.82 (p < 0.05), although it is comparatively weaker in Heraklion (−0.30).
Figure 8.
Scatterplot of DTR versus Tmax during summer over the reference period (1981–2010) for the selected cities (a–e) in the Eastern Mediterranean. Circle size represents RHmin, while circle color indicates DIh thermal discomfort classes. Slopes and Pearson’s correlation coefficients (r) for the associations between DTR, Tmax, and RHmin are shown for each city.
Figure 9.
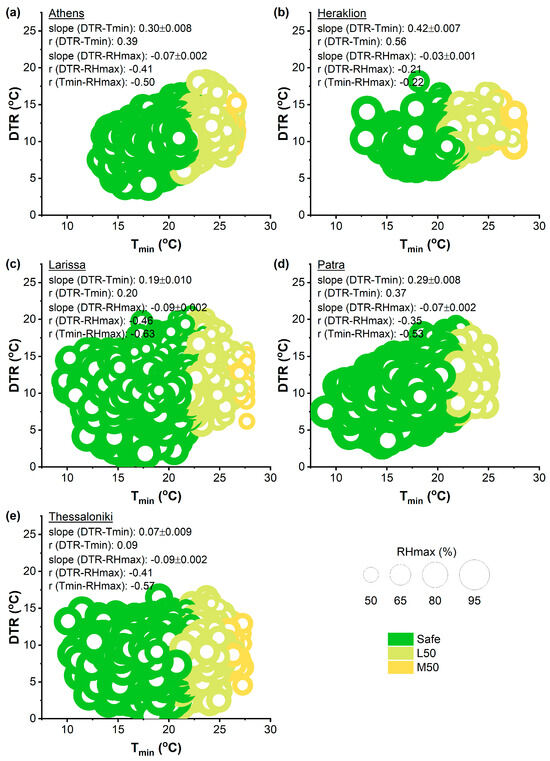
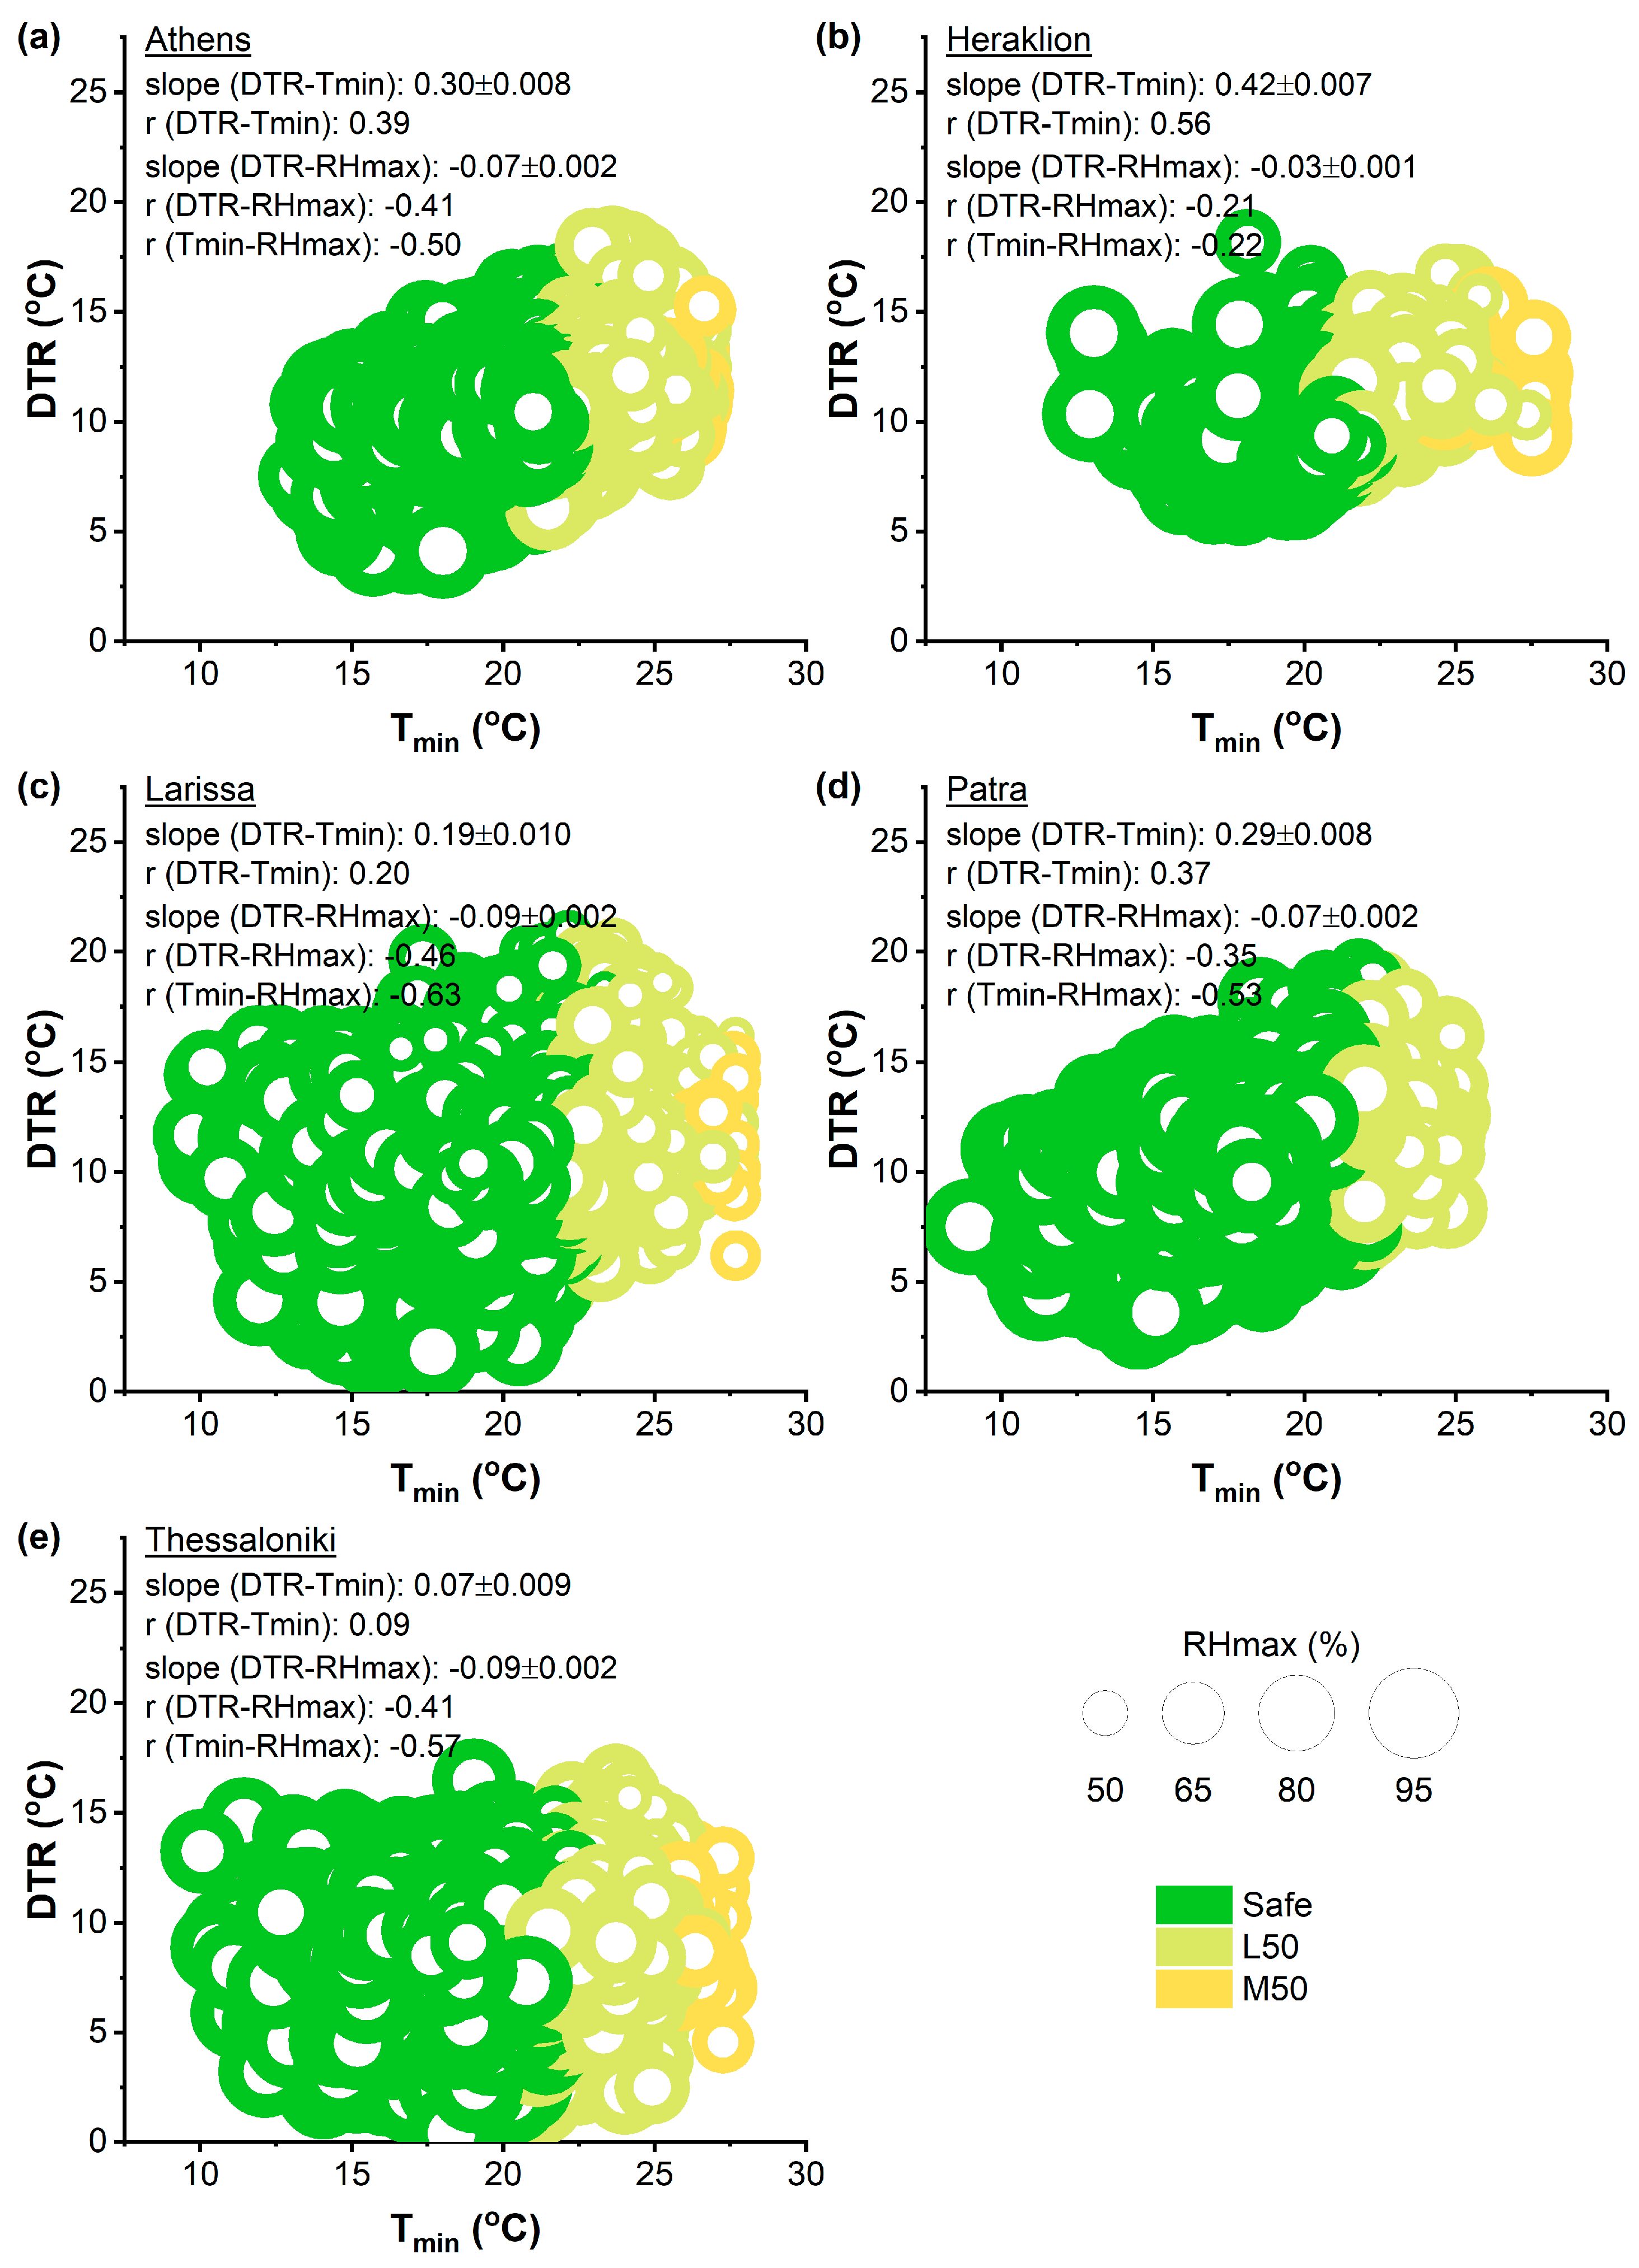
Scatterplot of DTR versus Tmin during summer over the reference period (1981–2010) for the selected cities (a–e) in the Eastern Mediterranean. Circle size represents RHmax, while circle color indicates DIc thermal discomfort classes. Slopes and Pearson’s correlation coefficients (r) for the associations between DTR, Tmin, and RHmax are shown for each city.
It is also important to examine which variable (T or RH) has a greater influence on the DI. Therefore, a sensitivity analysis of the DI was conducted, producing a family of curves as a function of T (with RH held constant) and as a function of RH (with T held constant). It is found that, across a range of RH levels (10–90%), the DI increases as T rises. A similar pattern is observed with respect to RH across a range of T levels (20–45 °C). However, T has a consistently greater impact on the DI than RH, whether RH is held constant or T is held constant. Although the slopes vary, this relationship holds across the full range of values considered. Nevertheless, the impact of RH on the DI becomes more pronounced as T increases.
In Figure 9, positive associations are observed between DTR and Tmin across all five cities (p < 0.05), although these associations are generally considerably weaker than those previously noted with Tmax. This pattern is most evident in Thessaloniki, where both the slope and Pearson’s correlation coefficient are very weak (0.07 ± 0.009 and 0.09, respectively). An exception is observed in Heraklion, where the slopes for Tmin and Tmax are almost equal (0.42 ± 0.007 and 0.41, respectively), although Pearson’s correlation coefficient for Tmin has weakened to 0.56. The remaining cities also show reduced slopes between DTR and Tmin, with values of 0.30 ± 0.008 in Athens, 0.19 ± 0.010 in Larissa, and 0.29 ± 0.008 in Patra, while the corresponding Pearson correlation coefficients are 0.39, 0.20 and 0.37, respectively. Conversely, a negative association is observed between DTR and RHmax. RHmax is included in the calculation of the DIc component, although it is not part of the computation of DTR. However, this negative association is considerably weaker compared to the association between DTR and RHmin observed for the DIh component, with notably small slopes ranging from −0.03 to −0.09 and reduced Pearson’s correlation coefficients ranging from −0.21 to −0.46. It should also be noted that the association between Tmin and RHmax, while less pronounced than between Tmax and RHmin, still shows moderate to strong correlations, with Pearson’s r ranging from −0.50 to −0.63, except in Heraklion, where the association is comparatively weaker (−0.22).
3.5. Association Between Diurnal Temperature Range and DI-Based Thermal Discomfort Indicators in the Future Climate
While the previous analysis focused on the association between DTR and DI-based thermal discomfort indicators during the reference period (1981–2010), this section investigates changes in this association in the near future (2031–2060) under the SSP2-4.5 and SSP5-8.5 scenarios. Figure 10 and Figure 11 present the DTR distribution across thermal discomfort classes based on the DIh and the DIc components, respectively, in summer over the near-future period (2031–2060) across the five cities.
Figure 10.
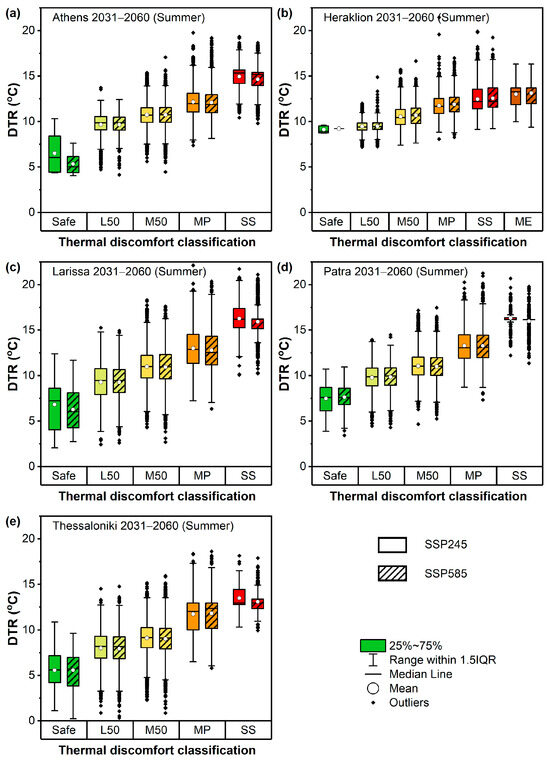
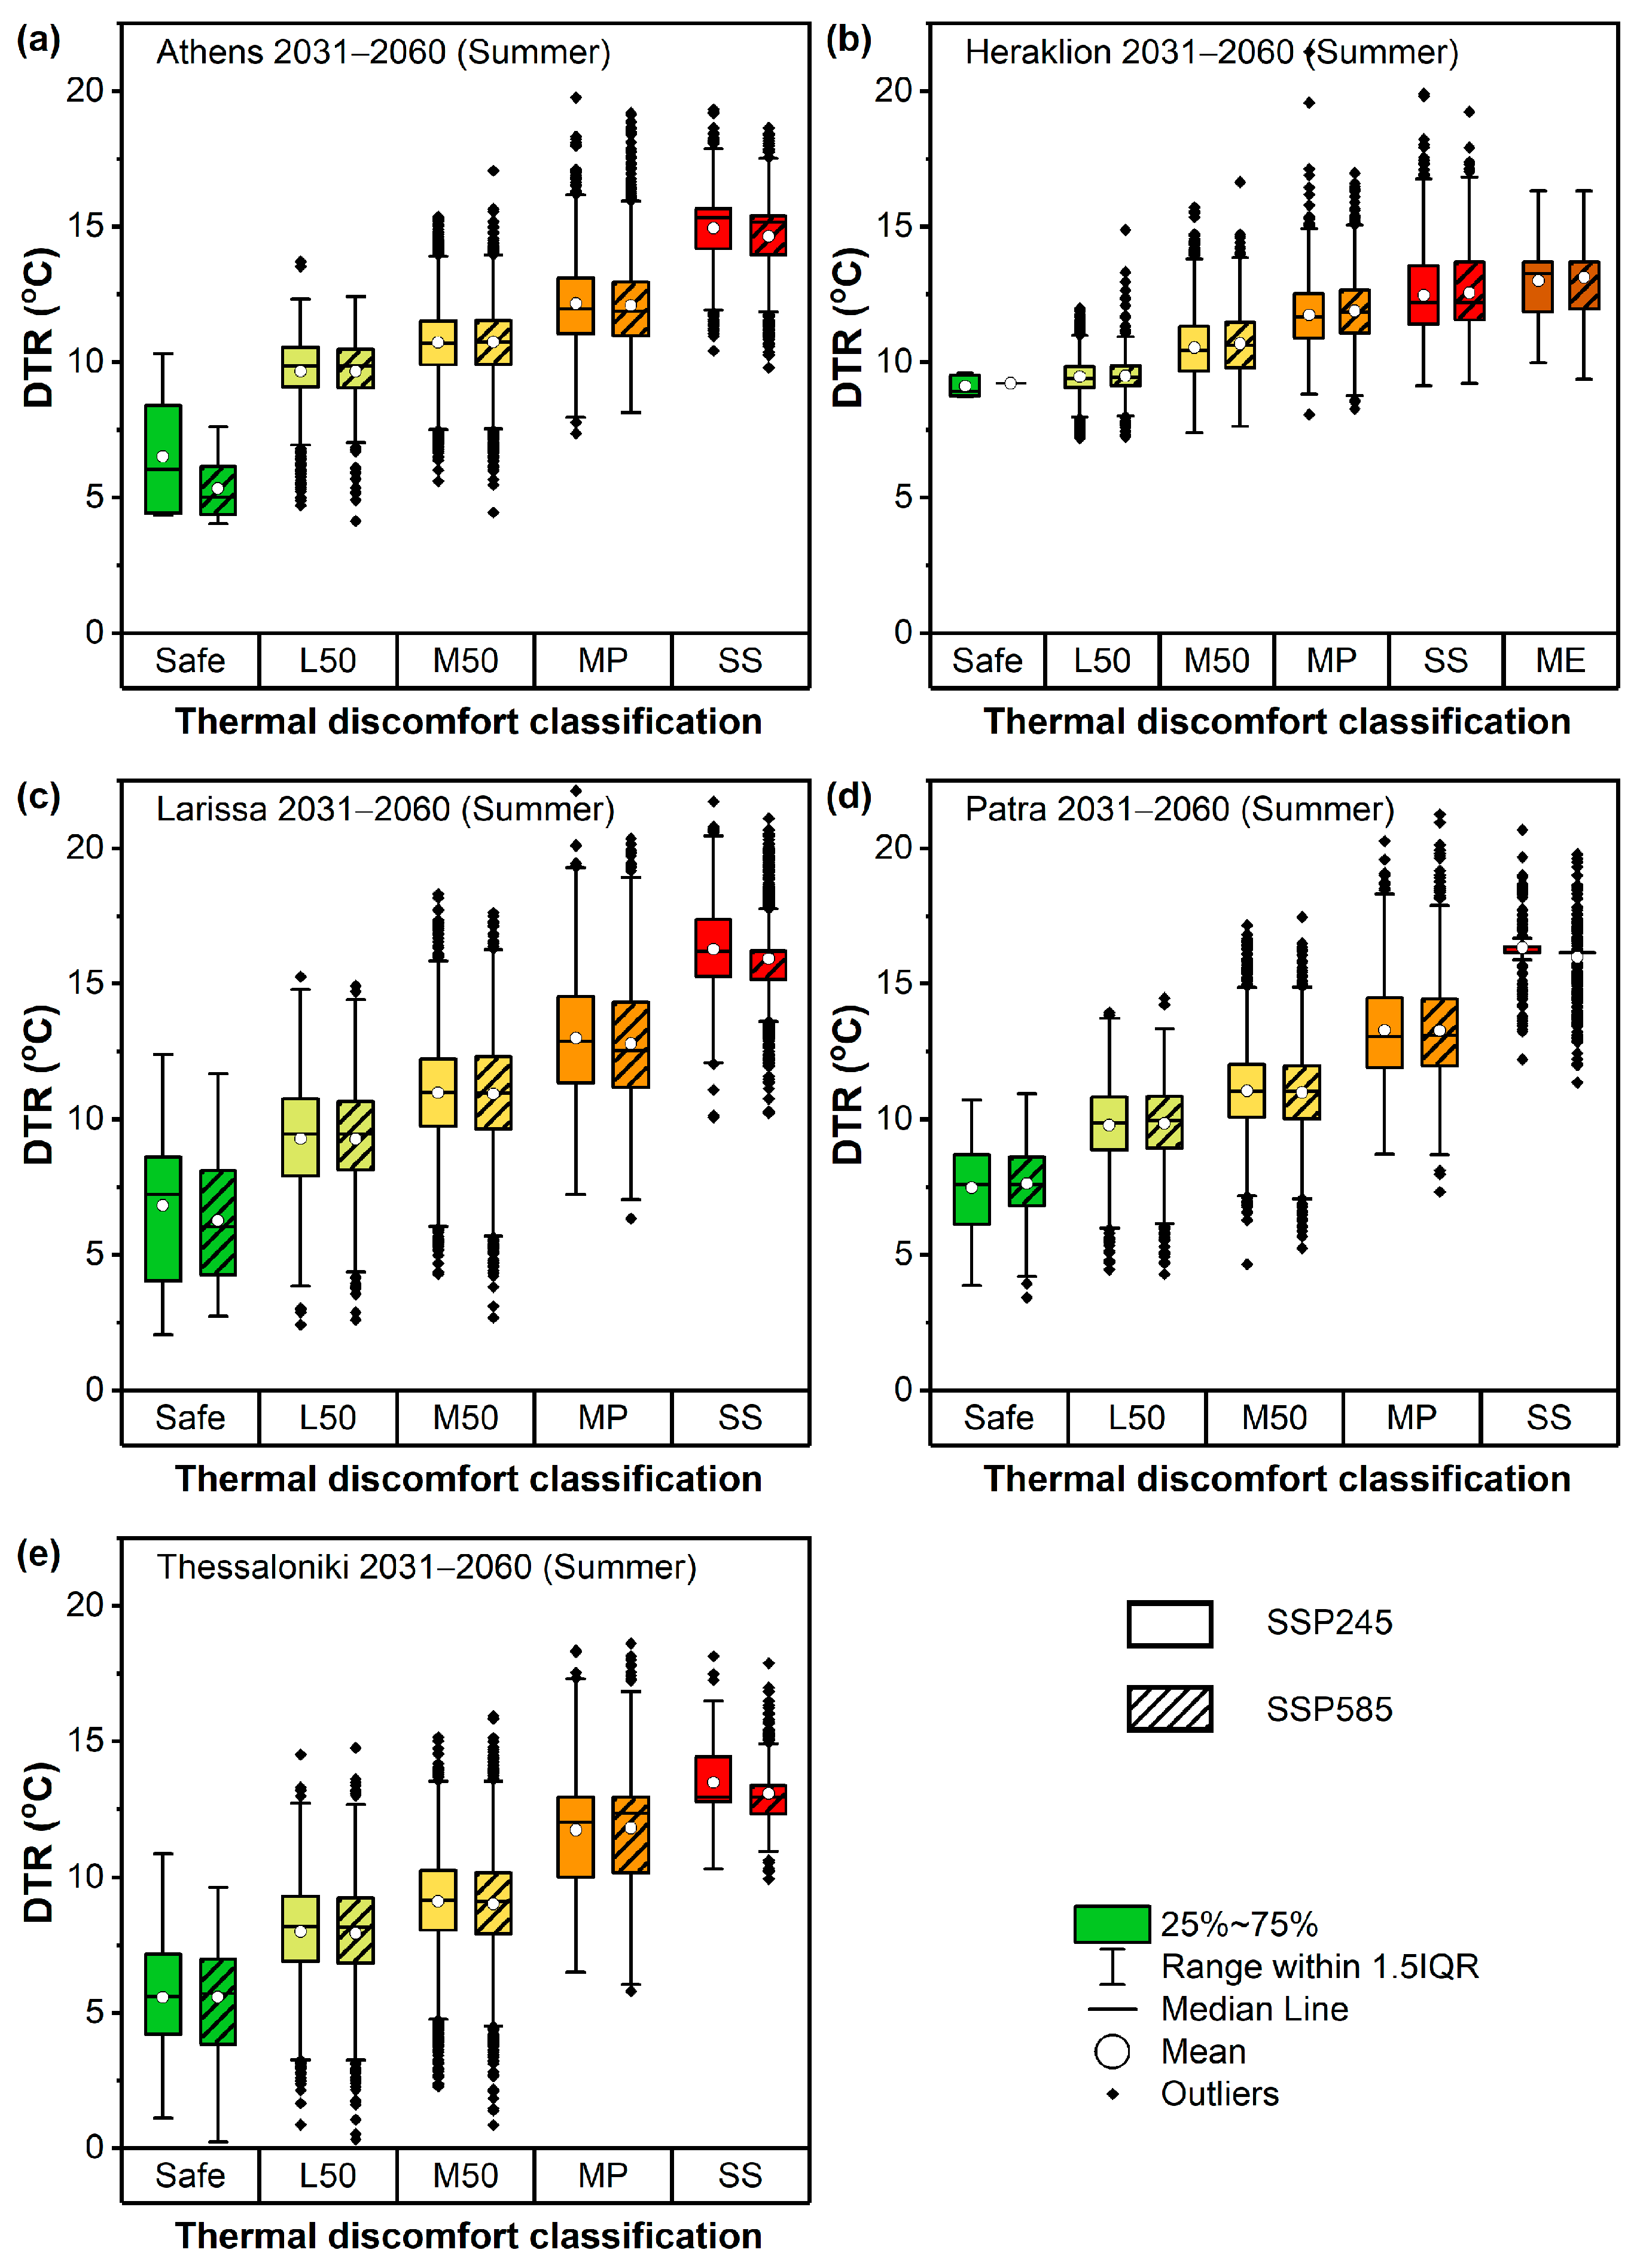
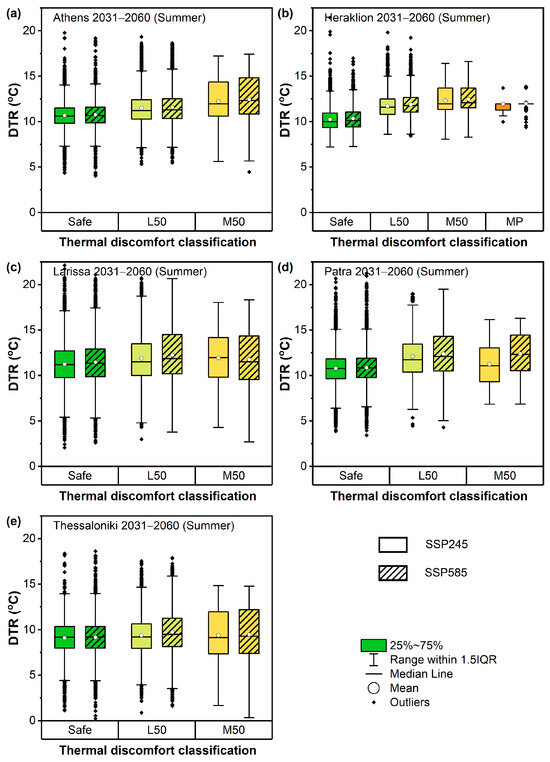
Distribution of DTR across DIh thermal discomfort classes in summer over the near future (2031–2060) under both scenarios (SSP2-4.5, SSP5-8.5) for the selected cities (a–e) in the Eastern Mediterranean.
Figure 11.
Distribution of DTR across DIc thermal discomfort classes in summer over the near future (2031–2060) under both scenarios (SSP2-4.5, SSP5-8.5) for the selected cities (a–e) in the Eastern Mediterranean.
As shown in Figure 10, higher DTR values continue to be associated with higher DIh thermal discomfort classes across all cities under both scenarios, consistent with the association observed during the reference period. For instance, in Athens under SSP2-4.5, the mean DTR of days classified as L50 increases from 9.7 °C to 14.9 °C for days classified as SS, while under SSP5-8.5 it reaches 14.6 °C. A similar pattern is noted in Patra, where mean DTR increases from 7.5 °C in the Safe class to 16.3 °C in the SS class under SSP2-4.5, and from 7.6 °C (Safe) to 16.0 °C (SS) under SSP5-8.5. Across all cities, DTR values in the higher discomfort classes (MP, SS) are consistently higher under both scenarios compared to those in the lower discomfort classes (Safe, L50), although quantitative differences exist between scenarios and cities. For example, the average increase in DTR between SS and L50 ranges from 3.5 °C (Heraklion) to 7.0 °C (Larissa) under SSP2-4.5, and from 3.6 °C (Heraklion) to 6.7 °C (Larissa) under SSP5-8.5. Among the studied cities, Heraklion shows the smallest increase in DTR between discomfort classes, reflecting the weaker association already observed during the reference period. In general, the rates of DTR increase between discomfort classes per city remain comparable to those noted in the reference period. Nevertheless, the mean DTR values mainly associated with higher discomfort classes (MP and SS) are projected to be slightly lower in most cities in the near future compared to the reference period, except in Heraklion.
Based on the DIc component, the mean DTR shows comparable values across discomfort classes during the near-future period (2031–2060) under both scenarios, suggesting a weak or absent association (Figure 11), consistent with that observed during the reference period (1981–2010). A slight increase in DTR across higher DIc thermal discomfort classes is observed in Heraklion and Athens. For instance, in Athens, days classified as M50 and L50 show average DTR values of 12.2 °C (12.5 °C) and 11.5 °C (11.6 °C), respectively, compared to 10.7 °C (10.8 °C) for days classified as Safe under SSP2-4.5 (SSP5-8.5).
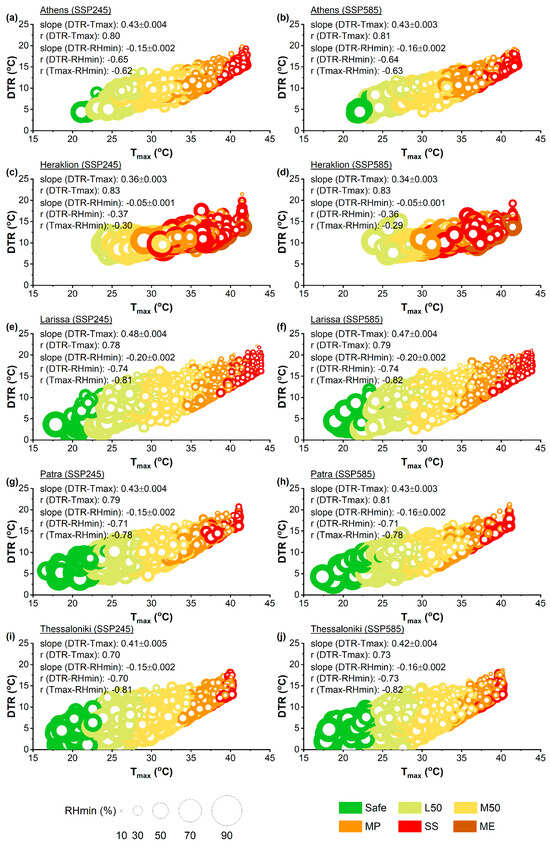
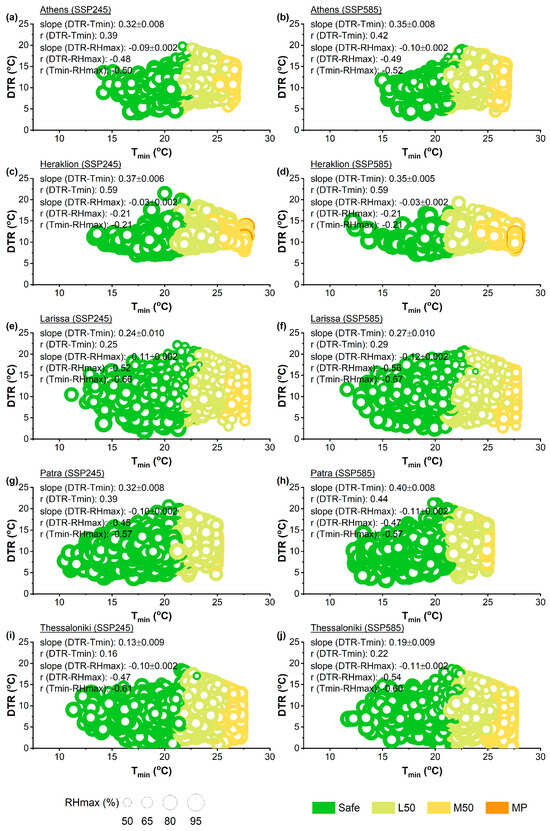
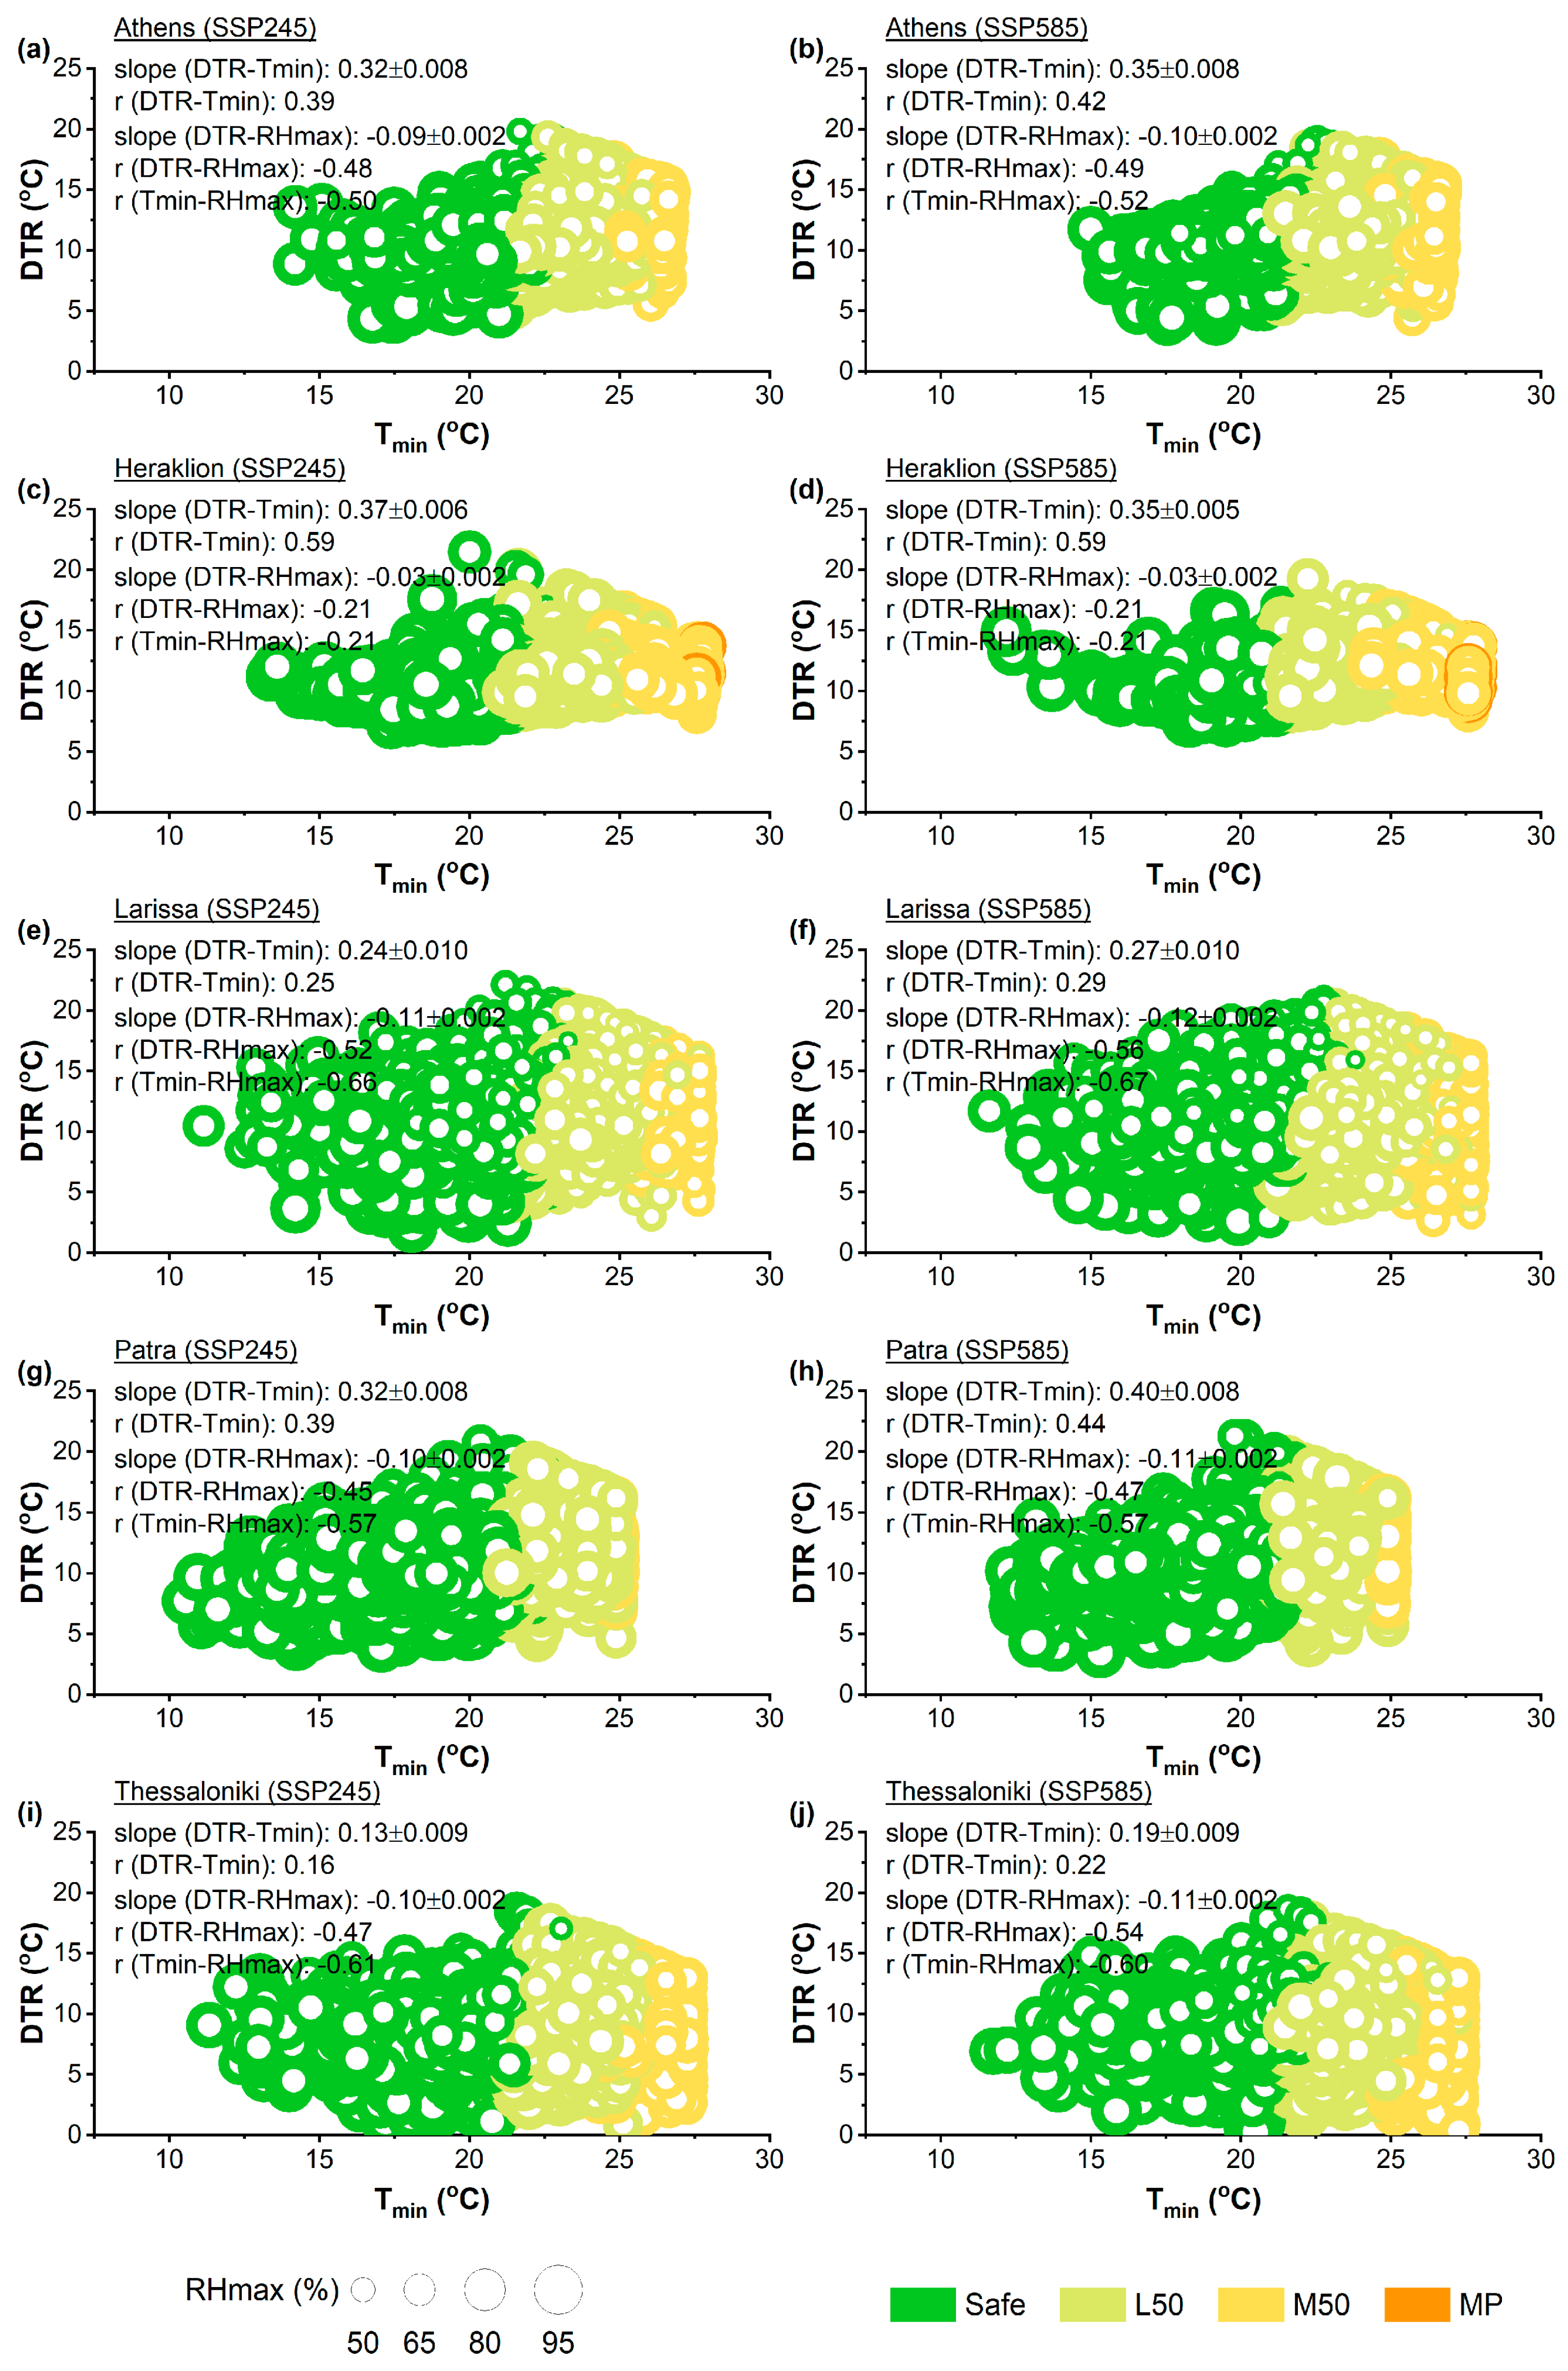
The scatter plots integrating all associated variables of DTR and the DIh and DIc components for the near future (2031–2060) under both scenarios are presented in Figure 12 and Figure 13, respectively. The regression analysis between DTR and Tmax reveals strong positive associations in all cities in the future, with similar or slightly larger slopes, especially under SSP5-8.5, compared to the reference period (Figure 12).
Figure 12.
Scatterplot of DTR versus Tmax during summer over the near-future period (2031–2060) under SSP2-4.5 (a,c,e,g,i) and SSP5-8.5 (b,d,f,h,j) for the selected cities in the Eastern Mediterranean. Circle size represents RHmin, while circle color indicates DIh thermal discomfort classes. Slopes and Pearson’s correlation coefficients (r) for the associations between DTR, Tmax, and RHmin are shown for each city.
Figure 13.
Scatterplot of DTR versus Tmin during summer over the near-future period (2031–2060) under SSP2-4.5 (a,c,e,g,i) and SSP5-8.5 (b,d,f,h,j) for the selected cities in the Eastern Mediterranean. Circle size represents RHmax, while circle color indicates DIc thermal discomfort classes. Slopes and Pearson’s correlation coefficients (r) for the associations between DTR, Tmin, and RHmax are shown for each city.
In particular, the slopes and standard deviations under SSP2-4.5 (SSP5-8.5) are 0.43 ± 0.004 (0.43 ± 0.003) in Athens, 0.36 ± 0.003 (0.34 ± 0.003) in Heraklion, 0.48 ± 0.004 (0.47 ± 0.004) in Larissa, 0.43 ± 0.004 (0.43 ± 0.003) in Patra, and 0.41 ± 0.005 (0.42 ± 0.004) in Thessaloniki (p < 0.05) (Figure 12). Pearson’s correlation coefficients remain high, further indicating this positive association, with values ranging from 0.70 (Thessaloniki) to 0.83 (Heraklion) under SSP2-4.5, and from 0.73 (Thessaloniki) to 0.83 (Heraklion) under SSP5-8.5. At the same time, the negative association between DTR and RHmin, which is used in the calculation of the DIh component, is still observed in the near future, with slopes slightly steeper than in the reference period. Slopes range from −0.15 (Athens, Patra, Thessaloniki) to −0.20 (Larissa) under SSP2-4.5 and from −0.16 (Athens, Patra, Thessaloniki) to −0.20 (Larissa) under SSP5-8.5, except in Heraklion, where the inverse association remains weak (−0.05), as in the reference period. The corresponding Pearson correlation coefficients are slightly stronger than in the reference period, ranging from −0.64 to −0.74 under both scenarios, except in Heraklion, where the coefficient, although slightly stronger, remains weak (−0.37). The negative association between Tmax and RHmin remains strong in most cities in the future and weak in Heraklion, with Pearson’s correlation coefficients similar to those in the reference period.
The associations between DTR and Tmin across all five cities are positive but considerably weaker than those previously noted with Tmax in the near future under both scenarios (Figure 13). Nevertheless, both the slope and the Pearson’s correlation coefficient appear to be slightly higher compared to the reference period, indicating a weak strengthening of the positive association between DTR and Tmin in most cities in the near future. The association between DTR and RHmax remains negative in the near future, similar to the reference period, although both the slope and the Pearson’s correlation coefficient appear to decrease slightly, indicating a slight strengthening of the negative association in the near future under both scenarios. However, this negative association between DTR and RHmax for the DIc component still remains considerably weaker compared to the association between DTR and RHmin observed for the DIh component in the near future. Finally, the association between Tmin and RHmax remains negative in the near future, although the Pearson correlation coefficients in most cities decrease slightly compared to the reference period, indicating a modestly stronger negative association. Nevertheless, the association between Tmin and RHmax remains less pronounced than between Tmax and RHmin in the near future.
4. Discussion
This study examined how climate change may affect DTR and thermal discomfort, calculated using the discomfort index of Thom, in the five largest cities of Greece, located in the Eastern Mediterranean, and investigated the associations between these indicators. The analysis focused on summer months, when high temperatures are most pronounced, and used multiple climate CMIP6 projections to assess patterns during the reference period (1981–2010) and under future scenarios.
In the near future (2031–2060), DTR distributions are projected to shift towards higher values across most cities, although the magnitude of these shifts varies between cities and scenarios. Effect size analysis of DTR indicates generally small effects in Thessaloniki, medium to large effects in Larissa depending on the scenario, and large effects in Heraklion, Athens and Patra. The projected differences in DTR distribution between the reference period and the near future are likely related to the asymmetrical response of air temperature, and specifically to the higher increase rate in Tmax than in Tmin in most cities. When the magnitude of the Tmin increase in the near future closely follows the magnitude of the Tmax increase, as in Thessaloniki, the DTR differences between the near future and the reference period are less pronounced. Conversely, larger differences between the rates of increase in Tmax and Tmin are associated with larger DTR changes, as in Heraklion. In accordance with the aforementioned findings, previous studies based on projections have also shown an increase in future DTR during the summer season in the Mediterranean coastal regions [44,45,46], mainly connected to the drier climate and the lower cloud fraction in future conditions [45,46].
The analysis of the upper (DIh) and lower (DIc) boundaries of daily thermal conditions reveals a clear diurnal contrast in DI-based thermal discomfort during the reference period (1981–2010). DIh-based results are characterized by higher thermal discomfort classes, while lower classes are less frequent, indicating a strong presence of hot conditions across all cities. In contrast, DIc-based results are generally associated with lower thermal discomfort classes, although a proportion of summer days still exhibit thermal discomfort in certain cities. This contrast highlights the importance of considering diurnal extremes instead of using daily averages, given that only daily data are available. In the future climate (2031–2060), there is a clear shift towards higher DI classes during both DIh and DIc conditions, which is more pronounced under the SSP5-8.5 than under the SSP2-4.5. For DIh-based conditions, the frequency of lower DI classes is projected to decrease, with a corresponding increase in higher classes. For DIc-based conditions, the frequency of the safe class is projected to decrease in all cities, with larger reductions under SSP5-8.5 (36–43%) than under SSP2-4.5 (26–35%). The class corresponding to low thermal discomfort is projected to show the largest increase (SSP5-8.5: 23–34%, SSP2-4.5: 20–30%). The classes foreseen to be affected and the magnitude of the changes vary across the cities and depend on the prevailing discomfort conditions in the reference period due to the local climate, as well as on the projected changes in air temperature and humidity. These findings suggest a worsening of thermal comfort conditions at both the upper (DIh) and lower (DIc) boundaries of daily thermal conditions, highlighting the potential need for adaptation measures in the selected cities. The projected changes in DIc-based conditions may also reduce nighttime cooling potential, particularly in densely populated cities. Overall, these changes may have broader implications for summer thermal conditions, suggesting the need for appropriate planning strategies. Increased thermal discomfort in the future climate has also been reported in previous studies at the global scale (e.g., [25]), the regional scale (e.g., [26,28,47]) and the city scale (e.g., [24,27,48]).
Although DTR represents the daily temperature range, we compared it with thermal discomfort assessed at the upper (DIh) and lower (DIc) boundaries of daily thermal conditions for the reference period (1981–2010). This approach allows the examination of diurnal associations, showing that higher DTR values are observed on days with higher DIh-based thermal discomfort, while the association is weak or absent for DIc-based conditions. This positive association between DTR and DIh is largely governed by the shared dependence of both indices on Tmax. Since Tmax is included in both formulations, part of this association reflects statistical overlap rather than an independent association. In contrast, the absent or weak pattern between DTR and DIc likely reflects the weaker association between DTR and Tmin as well as the relatively smaller variability of Tmin. The aforementioned patterns are consistent across all studied cities, which are located in a region with a Mediterranean climate, although slight differences between cities are apparent, likely reflecting local climatic conditions. Consequently, these associations may vary in regions with different climatic conditions, particularly where humidity is high and plays a dominant role. In coastal cities, sea breeze circulations may also influence local air temperature and humidity conditions, which could partly contribute to variability in the observed association between DTR and thermal discomfort; however, this process was not explicitly considered in this study.
Compared to the reference period (1981–2010), the association between DTR and thermal discomfort at the upper (DIh) and lower (DIc) boundaries of daily thermal conditions still persists in the near future (2031–2060) under both scenarios. However, for the DIh-based conditions, DTR values, especially in the high discomfort classes, are slightly lower than those observed in the reference period for the same classes, indicating a weaker DTR contrast between the upper classes of the DI in the future. This differentiation is probably related to the projected increase in Tmax and decrease in relative humidity in the near future. In addition, air temperature has a consistently greater impact on the DI than relative humidity, and the projected increase in Tmax in the future makes its dominance even greater. Therefore, the projected increase in Tmax is expected to lead to higher DI values and, consequently, to an increased frequency of high discomfort classes. Although DTR is expected to increase in the near future due to the higher increase rate in Tmax than in Tmin, the slightly lower DTR observed within the upper discomfort classes for the DIh-based conditions reflects the changes in the distribution of extreme hot days. Days with high DIh-based discomfort in the future tend to occur under hotter conditions with warmer nights (higher Tmin), which is associated with reduced DTR on these high-discomfort days. In addition, lower relative humidity in the future shifts thermal discomfort towards more hot and dry conditions, allowing days with moderate DTR to move into the upper discomfort classes. In contrast, the association between DTR and DIc-based thermal discomfort remains weak or absent in the near future, consistent with the reference period.
The projected changes in thermal discomfort and DTR may have broader implications for adaptation strategies. Measures such as green roofs, increased vegetation, and cool materials and surfaces can contribute to reducing thermal discomfort [49].
Although this study provides valuable insights into climate change impacts on DTR and thermal discomfort, a few limitations and constraints should be noted. The discomfort index of Thom used in this study does not take into account the impact of wind and solar radiation on thermal comfort. In addition, it is not clear if the observed associations between DTR and the discomfort index of Thom would still exist using another index, especially those that include more environmental variables to assess thermal discomfort. Furthermore, the use of Tmax–RHmin and Tmin–RHmax combinations for DI calculations may not always reflect exact temporal co-occurrence of these variables, particularly in coastal cities affected by local atmospheric circulations. Although relative humidity was statistically downscaled and bias-adjusted, near-surface humidity remains more uncertain than air temperature in climate model projections, especially at the urban scale where impervious surfaces and boundary-layer processes may influence moisture conditions. While the selected grid point is located within each city, the CMIP6 downscaled data may not fully capture local-scale effects such as the Urban Heat Island (UHI). Therefore, the DI results should be interpreted as grid-cell-scale thermal discomfort estimates rather than as detailed intra-urban comfort conditions. Finally, the observed associations may not hold in regions with a more humid climate.
Future work should consider the use of high-resolution Regional Climate Models (RCMs) to better represent the influence of urban topography and the UHI effect on local thermal conditions. It would also be interesting to examine the relationship between DTR and thermal discomfort using sub-daily data for the assessment of thermal discomfort, rather than focusing only on the upper and lower boundaries of daily thermal conditions.
5. Conclusions
This study investigated projected changes in diurnal temperature range (DTR) and thermal discomfort in five major Greek cities using climate CMIP6 projections. The results indicate an overall increase in DTR in the near future, with varying magnitudes across cities depending on climatic conditions. Thermal discomfort, assessed at the upper (DIh) and lower (DIc) boundaries of daily thermal conditions, is also projected to increase, particularly under SSP5-8.5. The analysis further indicates a positive association between DTR and DIh-based thermal discomfort, which is largely governed by their shared dependence on Tmax, while the association between DTR and DIc-based conditions appears weak or absent. Considering both DTR and thermal discomfort together may improve understanding of their associations and support future climate studies in Eastern Mediterranean cities.
Author Contributions
Conceptualization, G.K.; methodology, G.K.; validation, G.K. and K.V.V.; formal analysis, G.K. and K.V.V.; investigation, G.K. and K.V.V.; resources, C.G.; data curation, G.K. and K.V.V.; visualization, G.K.; writing—original draft preparation, G.K.; writing—review and editing, G.K., K.V.V. and C.G.; supervision, C.G. All authors have read and agreed to the published version of the manuscript.
Funding
This work was supported by the project “Support for upgrading the operation of the National Network for Climate Change (CLIMPACT)”, funded by the National Development Program 2021–2025 of the Ministry of Development-General Secretariat of Research and Innovation, Greece (2023ΝA11900001—Ν. 5201588).
Institutional Review Board Statement
Not applicable.
Informed Consent Statement
Not applicable.
Data Availability Statement
CMIP6 climate projections from the EC-Earth3-Veg, the MIROC6 and the MPI-ESM1-2-HR General Circulation Models used in this study are publicly available through the Earth System Grid Federation (ESGF) data portals (https://esgf-metagrid.cloud.dkrz.de/search) (accessed on 20 June 2024). The ERA5-Land used for statistical downscaling was obtained from the Copernicus Climate Change Service (C3S) Climate Data Store (https://cds.climate.copernicus.eu/datasets/reanalysis-era5-land?tab=overview) (accessed on 13 June 2024).
Acknowledgments
The authors acknowledge the Earth System Grid Federation (ESGF) and Copernicus Climate Change Service (C3S) for archiving and providing access to the CMIP6 data and the ERA5-Land reanalysis datasets, respectively. We also acknowledge support from the project “Support for upgrading the operation of the National Network for Climate Change (CLIMPACT)”.
Conflicts of Interest
The authors declare no conflicts of interest.
References
- World Meteorological Organization. State of the Global Climate 2024; WMO-No. 1368; WMO: Geneva, Switzerland, 2025; p. 42. [Google Scholar]
- Intergovernmental Panel on Climate Change. Climate Change 2023: Synthesis Report; IPCC: Geneva, Switzerland, 2023; pp. 35–115. [Google Scholar] [CrossRef]
- Ali, E.; Cramer, W.; Carnicer, J.; Georgopoulou, E.; Hilmi, N.J.M.; Le Cozannet, G.; Lionello, P. Cross-Chapter Paper 4: Mediterranean Region. In Climate Change 2022: Impacts, Adaptation and Vulnerability. Contribution of Working Group II to the Sixth Assessment Report of the Intergovernmental Panel on Climate Change; Pörtner, H.-O., Roberts, D.C., Tignor, M., Poloczanska, E.S., Mintenbeck, K., Alegría, A., Craig, M., Langsdorf, S., Löschke, S., Möller, V., et al., Eds.; Cambridge University Press: Cambridge, UK, 2022; pp. 2233–2272. [Google Scholar] [CrossRef]
- Thorne, P.W.; Menne, M.J.; Williams, C.N.; Rennie, J.J.; Lawrimore, J.H.; Vose, R.S.; Peterson, T.C.; Durre, I.; Davy, R.; Esau, I.; et al. Reassessing Changes in Diurnal Temperature Range: A New Data Set and Characterization of Data Biases. J. Geophys. Res. Atmos. 2016, 121, 5115–5137. [Google Scholar] [CrossRef]
- Sun, X.; Ren, G.; You, Q.; Ren, Y.; Xu, W.; Xue, X.; Zhan, Y.; Zhang, S.; Zhang, P. Global Diurnal Temperature Range (DTR) Changes since 1901. Clim. Dyn. 2019, 52, 3343–3356. [Google Scholar] [CrossRef]
- Doan, Q.-V.; Chen, F.; Asano, Y.; Gu, Y.; Nishi, A.; Kusaka, H.; Niyogi, D. Causes for Asymmetric Warming of Sub-Diurnal Temperature Responding to Global Warming. Geophys. Res. Lett. 2022, 49, e2022GL100029. [Google Scholar] [CrossRef]
- Mall, R.K.; Chaturvedi, M.; Singh, N.; Bhatla, R.; Singh, R.S.; Gupta, A.; Niyogi, D. Evidence of Asymmetric Change in Diurnal Temperature Range in Recent Decades over Different Agro-Climatic Zones of India. Int. J. Climatol. 2021, 41, 2597–2610. [Google Scholar] [CrossRef]
- Jaagus, J.; Briede, A.; Rimkus, E.; Remm, K. Variability and Trends in Daily Minimum and Maximum Temperatures and in the Diurnal Temperature Range in Lithuania, Latvia and Estonia in 1951–2010. Theor. Appl. Climatol. 2014, 118, 57–68. [Google Scholar] [CrossRef]
- Zhou, L.; Dickinson, R.E.; Dirmeyer, P.; Dai, A.; Min, S.-K. Spatiotemporal Patterns of Changes in Maximum and Minimum Temperatures in Multi-Model Simulations. Geophys. Res. Lett. 2009, 36, L02702. [Google Scholar] [CrossRef]
- Kis, A.; Pongrácz, R. Changes of diurnal temperature range in different climatic regions in Europe between 1971 and 2024. Atmos. Res. 2026, 337, 108938. [Google Scholar] [CrossRef]
- Lee, W.; Kim, Y.; Sera, F.; Gasparrini, A.; Park, R.; Choi, H.M.; Prifti, K.; Bell, M.L.; Abrutzky, R.; Guo, Y.; et al. Projections of Excess Mortality Related to Diurnal Temperature Range under Climate Change Scenarios: A Multi-Country Modelling Study. Lancet Planet. Health 2020, 4, e512–e521. [Google Scholar] [CrossRef] [PubMed]
- Wang, Z.; Zhou, Y.; Luo, M.; Yang, H.; Xiao, S.; Huang, X.; Ou, Y.; Zhang, Y.; Duan, X.; Hu, W.; et al. Association of Diurnal Temperature Range with Daily Hospitalization for Exacerbation of Chronic Respiratory Diseases in 21 Cities, China. Respir. Res. 2020, 21, 251. [Google Scholar] [CrossRef] [PubMed]
- Davis, R.E.; Hondula, D.M.; Sharif, H. Examining the diurnal temperature range enigma: Why is human health related to the daily change in temperature? Int. J. Biometeorol. 2020, 64, 397–407. [Google Scholar] [CrossRef] [PubMed]
- Ngo, H.K.T.; Tri, T.T.C.; Thu, D.T.A.; Phung, D.; Dang, T.N.; Nguyen, K.D.; Nguyen, M.H.D.; Tin, H.C.; Thai, P.K. The impact of diurnal temperature range on the risk of hospitalizations in a low-income setting: The case of the Central Coast of Vietnam. Int. J. Biometeorol. 2025, 69, 487–497. [Google Scholar] [CrossRef] [PubMed]
- Chevance, G.; Minor, K.; Vielma, C.; Campi, E.; O’Callaghan-Gordo, C.; Basagaña, X.; Balester, J.; Bernard, P. A systematic review of ambient heat and sleep in a warming climate. Sleep Med. Rev. 2024, 75, 101915. [Google Scholar] [CrossRef] [PubMed]
- Cheng, J.; Xu, Z.; Zhu, R.; Wang, X.; Jin, L.; Song, J.; Su, H. Impact of diurnal temperature range on human health: A systematic review. Int. J. Biometeorol. 2014, 58, 2011–2024. [Google Scholar] [CrossRef] [PubMed]
- Davis, R.E.; Himmel, O.; Sims, P.K.; Fuhrmann, C.M. Mortality and diurnal temperature range in Virginia. Int. J. Biometeorol. 2025, 69, 725–738. [Google Scholar] [CrossRef] [PubMed]
- Kueh, M.-T.; Lin, C.-Y.; Chuang, Y.-J.; Sheng, Y.-F.; Chien, Y.-Y. Climate Variability of Heat Waves and Their Associated Diurnal Temperature Range Variations in Taiwan. Environ. Res. Lett. 2017, 12, 074017. [Google Scholar] [CrossRef]
- Katavoutas, G.; Founda, D.; Varotsos, K.V.; Giannakopoulos, C. Diurnal temperature range and its response to heat waves in 16 European cities—Current and future trends. Sustainability 2023, 15, 12715. [Google Scholar] [CrossRef]
- de Freitas, C.R.; Grigorieva, E.A. A comparison and appraisal of a comprehensive range of human thermal climate indices. Int. J. Biometeorol. 2017, 61, 487–512. [Google Scholar] [CrossRef] [PubMed]
- Antonescu, B.; Mărmureanu, L.; Vasilescu, J.; Marin, C.; Andrei, S.; Boldeanu, M.; Ene, D.; Ţilea, A. A 41-year bioclimatology of thermal stress in Europe. Int. J. Climatol. 2021, 41, 3934–3952. [Google Scholar] [CrossRef]
- Shin, J.Y.; Kang, M.; Kim, K.R. Outdoor thermal stress changes in South Korea: Increasing inter-annual variability induced by different trends of heat and cold stresses. Sci. Total Environ. 2022, 805, 150132. [Google Scholar] [CrossRef] [PubMed]
- Malinović-Milićević, S.; Micić, J.; Denda, S.; Stanojević, G.; Petrović, M.D.; Gajić, T. Intensification of thermal risk in a changing climate: Findings from prominent tourism destinations along the eastern Adriatic coast. Int. J. Biometeorol. 2025, 69, 157–175. [Google Scholar] [CrossRef] [PubMed]
- Molenaar, R.E.; Heusinkveld, B.G.; Steeneveld, G.J. Projection of rural and urban human thermal comfort in The Netherlands for 2050. Int. J. Climatol. 2016, 36, 1708–1723. [Google Scholar] [CrossRef]
- Matthews, T.K.; Wilby, R.L.; Murphy, C. Communicating the deadly consequences of global warming for human heat stress. Proc. Natl. Acad. Sci. USA 2017, 114, 3861–3866. [Google Scholar] [CrossRef] [PubMed]
- Fotso-Nguemo, T.C.; Vondou, D.A.; Diallo, I.; Diedhiou, A.; Weber, T.; Tanessong, R.S.; Nghonda, J.P.; Yepdo, Z.D. Potential impact of 1.5, 2 and 3 C global warming levels on heat and discomfort indices changes over Central Africa. Sci. Total Environ. 2022, 804, 150099. [Google Scholar] [CrossRef] [PubMed]
- Katavoutas, G.; Founda, D.; Varotsos, K.V.; Giannakopoulos, C. Climate change impacts on thermal stress in four climatically diverse European cities. Int. J. Biometeorol. 2022, 66, 2339–2355. [Google Scholar] [CrossRef] [PubMed]
- Pantavou, K.; Kotroni, V.; Lagouvardos, K.; Kyriakou, P. Future changes of bioclimate in Greece: Variations in thermal stress according to the Universal Thermal Climate Index (UTCI). Sci. Total Environ. 2025, 980, 179514. [Google Scholar] [CrossRef] [PubMed]
- Lionello, P.; Scarascia, L. The relation between climate change in the Mediterranean region and global warming. Reg. Environ. Change 2018, 18, 1481–1493. [Google Scholar] [CrossRef]
- Zittis, G.; Almazroui, M.; Alpert, P.; Ciais, P.; Cramer, W.; Dahdal, Y.; Fnais, M.; Francis, D.; Hadjinicolaou, P.; Howari, F.; et al. Climate change and weather extremes in the Eastern Mediterranean and Middle East. Rev. Geophys. 2022, 60, e2021RG000762. [Google Scholar] [CrossRef]
- Döscher, R.; Acosta, M.; Alessandri, A.; Anthoni, P.; Arsouze, T.; Bergman, T.; Bernardello, R.; Boussetta, S.; Caron, L.-P.; Carver, G.; et al. The EC-Earth3 Earth system model for the Coupled Model Intercomparison Project 6. Geosci. Model Dev. 2022, 15, 2973–3020. [Google Scholar] [CrossRef]
- Tatebe, H.; Watanabe, M. MIROC MIROC6 Model Output Prepared for CMIP6 CMIP; Earth System Grid Federation; World Data Center for Climate: Hamburg, Germany, 2018. [Google Scholar] [CrossRef]
- Gutjahr, O.; Putrasahan, D.; Lohmann, K.; Jungclaus, J.H.; von Storch, J.-S.; Brüggemann, N.; Haak, H.; Stössel, A. Max Planck Institute Earth System Model (MPI-ESM1.2) for the High-Resolution Model Intercomparison Project (HighResMIP). Geosci. Model Dev. 2019, 12, 3241–3281. [Google Scholar] [CrossRef]
- Pesaresi, M.; Schiavina, M.; Politis, P.; Freire, S.; Krasnodębska, K.; Uhl, J.H.; Carioli, A.; Corbane, C.; Dijkstra, L.; Florio, P.; et al. Advances on the Global Human Settlement Layer by joint assessment of Earth Observation and population survey data. Int. J. Digit. Earth 2024, 17, 2390454. [Google Scholar] [CrossRef]
- Muñoz-Sabater, J.; Dutra, E.; Agustí-Panareda, A.; Albergel, C.; Arduini, G.; Balsamo, G.; Boussetta, S.; Choulga, M.; Harrigan, S.; Hersbach, H.; et al. ERA5-Land: A state-of-the-art global reanalysis dataset for land applications. Earth Syst. Sci. Data 2021, 13, 4349–4383. [Google Scholar] [CrossRef]
- Varotsos, K.V.; Dandou, A.; Papangelis, G.; Roukounakis, N.; Kitsara, G.; Tombrou, M.; Giannakopoulos, C. Using a new local high resolution daily gridded dataset for Attica to statistically downscale climate projections. Clim. Dyn. 2023, 60, 2931–2956. [Google Scholar] [CrossRef]
- O’Neill, B.C.; Tebaldi, C.; van Vuuren, D.P.; Eyring, V.; Friedlingstein, P.; Hurtt, G.; Knutti, R.; Kriegler, E.; Lamarque, J.-F.; Lowe, J.; et al. The Scenario Model Intercomparison Project (ScenarioMIP) for CMIP6. Geosci. Model Dev. 2016, 9, 3461–3482. [Google Scholar] [CrossRef]
- Thom, E.C. The discomfort index. Weatherwise 1959, 12, 57–61. [Google Scholar] [CrossRef]
- Epstein, Y.; Moran, D.S. Thermal comfort and the heat stress indices. Ind. Health 2006, 44, 388–398. [Google Scholar] [CrossRef] [PubMed]
- ISO 7243; Ergonomics of the Thermal Environment—Assessment of Heat Stress Using the WBGT (Wet Bulb Globe Temperature) Index. 3rd ed. International Organization for Standardization (ISO): Geneva, Switzerland, 2017; p. 18.
- Davis, R.E.; McGregor, G.R.; Enfield, K.B. Humidity: A review and primer on atmospheric moisture and human health. Environ. Res. 2016, 144, 106–116. [Google Scholar] [CrossRef] [PubMed]
- Welch, B.L. The generalization of ‘STUDENT’S’ problem when several different population varlances are involved. Biometrika 1947, 34, 28–35. [Google Scholar] [CrossRef] [PubMed]
- Sullivan, M. Statistics: Informed Decisions Using Data, 5th ed.; Pearson: London, UK, 2018; p. 960. [Google Scholar]
- Wang, S.; Zhang, M.; Tang, J.; Yan, X.; Fu, C.; Wang, S. Interannual variability of diurnal temperature range in CMIP6 projections and the connection with large-scale circulation. Clim. Dyn. 2024, 62, 3927–3942. [Google Scholar] [CrossRef]
- Cattiaux, J.; Douville, H.; Schoetter, R.; Parey, S.; Yiou, P. Projected increase in diurnal and interdiurnal variations of European summer temperatures. Geophys. Res. Lett. 2015, 42, 899–907. [Google Scholar] [CrossRef]
- Lindvall, J.; Svensson, G. The diurnal temperature range in the CMIP5 models. Clim. Dyn. 2015, 44, 405–421. [Google Scholar] [CrossRef]
- Brecht, B.M.; Schädler, G.; Schipper, J.W. UTCI climatology and its future change in Germany—An RCM ensemble approach. Meteorol. Z. 2020, 29, 97–116. [Google Scholar] [CrossRef]
- Giannakopoulos, C.; Kostopoulou, E.; Varotsos, K.V.; Tziotziou, K.; Plitharas, A. An integrated assessment of climate change impacts for Greece in the near future. Reg. Environ. Change 2011, 11, 829–843. [Google Scholar] [CrossRef]
- Santamouris, M.; Yun, G.Y. Recent development and research priorities on cool and super cool materials to mitigate urban heat island. Renew. Energy 2020, 161, 792–807. [Google Scholar] [CrossRef]

Disclaimer/Publisher’s Note: The statements, opinions and data contained in all publications are solely those of the individual author(s) and contributor(s) and not of MDPI and/or the editor(s). MDPI and/or the editor(s) disclaim responsibility for any injury to people or property resulting from any ideas, methods, instructions or products referred to in the content. |
© 2026 by the authors. Licensee MDPI, Basel, Switzerland. This article is an open access article distributed under the terms and conditions of the Creative Commons Attribution (CC BY) license.