


Abstract
Very low frequency (VLF) radio waves propagating within the Earth–ionosphere waveguide are highly sensitive to changes in lower ionospheric conditions, which are reflected in the amplitude of received transmitter signals. During the solar terminator passage, rapid changes in ionospheric conductivity modify propagation conditions and produce characteristic VLF amplitude minima associated with modal interference and mode conversion processes. In this study, we investigate the spectral characteristics of VLF amplitude variability during the sunrise transition, which spans extended time intervals along long west–east propagation paths, using signals from the NPM-PIU and NPM-PLO paths recorded in Peru under solar minimum conditions (2008–2010). One-hour intervals centered on amplitude minima are analyzed using Complete Ensemble Empirical Mode Decomposition with Adaptive Noise (CEEMDAN) combined with the continuous wavelet transform. The analysis reveals recurrent wave-like fluctuations (WFs) with dominant periods between 2 and 6 min, whose amplitudes increase systematically within ±15 min around the amplitude minima. These fluctuations are better distinguished during the later-stage minima and exhibit enhanced occurrence during solstice months. The results indicate that the evolving modal structure of the waveguide during the sunrise transition may enhance the sensitivity of the VLF signals to small perturbations, enabling the detection of weak short-period ionospheric disturbances.
1. Introduction
Monitoring the sub-ionospheric propagation of very low frequency (VLF, 3–30 kHz) radio waves has become one of the most reliable and cost-effective techniques for investigating variability in the lower ionosphere. This region corresponds to the daytime D-region (∼60–75 km) and transitions toward the lower E-region (∼75–95 km) after sunset as the D-region plasma rapidly decays through recombination processes. VLF signals propagate within the Earth–ionosphere waveguide (EIWG), bounded by the Earth’s surface and the lower ionosphere. Due to their low attenuation (∼3 dB/Mm) and their ability to propagate over very long distances of several megameters, VLF signals can be continuously recorded with high stability, providing a sensitive diagnostic of electron density variations and effective reflection height changes in the lower ionosphere [1,2,3].
During daytime, the VLF propagation is particularly stable, resulting in well-defined amplitude and phase as received by ground stations. This characteristic has been widely used to study the lower ionospheric response to solar transients (e.g., [4,5]). In contrast, nighttime propagation conditions are typically more variable, partly associated with changes in the effective reflection height, caused by the rapid decrease in electron density at higher altitudes [6,7]. As a result, the nighttime VLF signals can become more sensitive to transient atmospheric and geophysical disturbances, including lightning-induced electron precipitation, transient luminous events, soft gamma-ray repeaters, and acoustic waves (e.g., [8,9,10,11,12]).
Particularly pronounced variability occurs during the sunrise and sunset transitions, when the solar terminator (ST) moves across the propagation path. During these periods, the VLF amplitude curves typically exhibit a sequence of pronounced periodic minima [13,14,15], which are commonly interpreted as a manifestation of interference between modal components arising from mode conversion at the solar terminator boundary, where ionospheric conditions change rapidly [13,14,16]. The number and timing of these minima depend on the length and orientation of the propagation path, with a larger number typically observed for west–east or east–west oriented paths.
The rapid changes in ionospheric conductivity and temperature driven by the solar terminator can generate atmospheric disturbances, including acoustic and gravity waves (AGWs) [17], which modify the electron density of the lower ionosphere and can produce measurable fluctuations in VLF amplitude and phase. Compared with other natural or anthropogenic sources, the solar terminator is a predictable, recurrent, and well-characterized source of atmospheric disturbances [17,18,19], making it an important natural setting for studying AGWs in the lower ionosphere. During sunrise, strong photoionization and rapid atmospheric heating occur, whereas sunset is characterized by relaxation processes associated with decreasing solar radiation flux. Consequently, the characteristic width of the sunrise transition region is typically smaller than that of the sunset region, making sunrise a more efficient generator of AGWs [17]. These disturbances have been observed in the upper ionosphere using techniques such as GPS-derived total electron content (TEC) [19], Doppler sounding [20], and incoherent scatter radar [21], and at lower ionospheric altitudes (below 90 km) through VLF amplitude fluctuations [22,23].
Although ST-induced AGWs have been previously reported in VLF observations, most studies have focused on time intervals surrounding the terminator passage, typically extending several tens of minutes before and after, rather than on the detailed spectral characterization of the sunrise transition itself. For long west–east propagation paths, the passage of the solar terminator occurs over an extended time interval, providing favorable conditions for resolving oscillations associated with the terminator passage. In addition, these paths exhibit a well-defined modal interference pattern characterized by pronounced amplitude minima, which can be used as well-defined temporal markers for spectral decomposition.
Therefore, in this work, we investigate the spectral characteristics of VLF amplitude variability during the sunrise transition under solar minimum conditions (2008–2010) along long west–east propagation paths, taking the amplitude minima as reference points for the analysis. The Complete Ensemble Empirical Mode Decomposition with Adaptive Noise (CEEMDAN) combined with wavelet analysis is applied to examine the temporal and spectral structure of the VLF signal and to identify short-period oscillatory components embedded within the large-scale terminator-related variations.
2. Data and Methodology
2.1. Narrowband VLF Amplitude Dataset
The narrowband VLF data used in this study were recorded and provided by the South America VLF Network (SAVNET) [24,25]. The analyzed dataset spans the solar minimum from 2008 to 2010, during which stable and nearly continuous amplitude recordings were available for the propagation paths considered in this study. SAVNET provides digital amplitude measurements with a temporal resolution of 1 s, which allows resolving short-period variability on time scales of a few minutes.
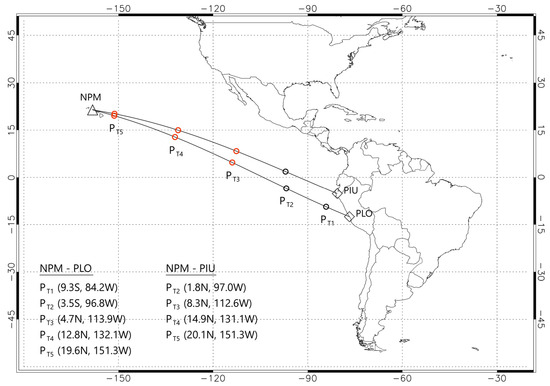
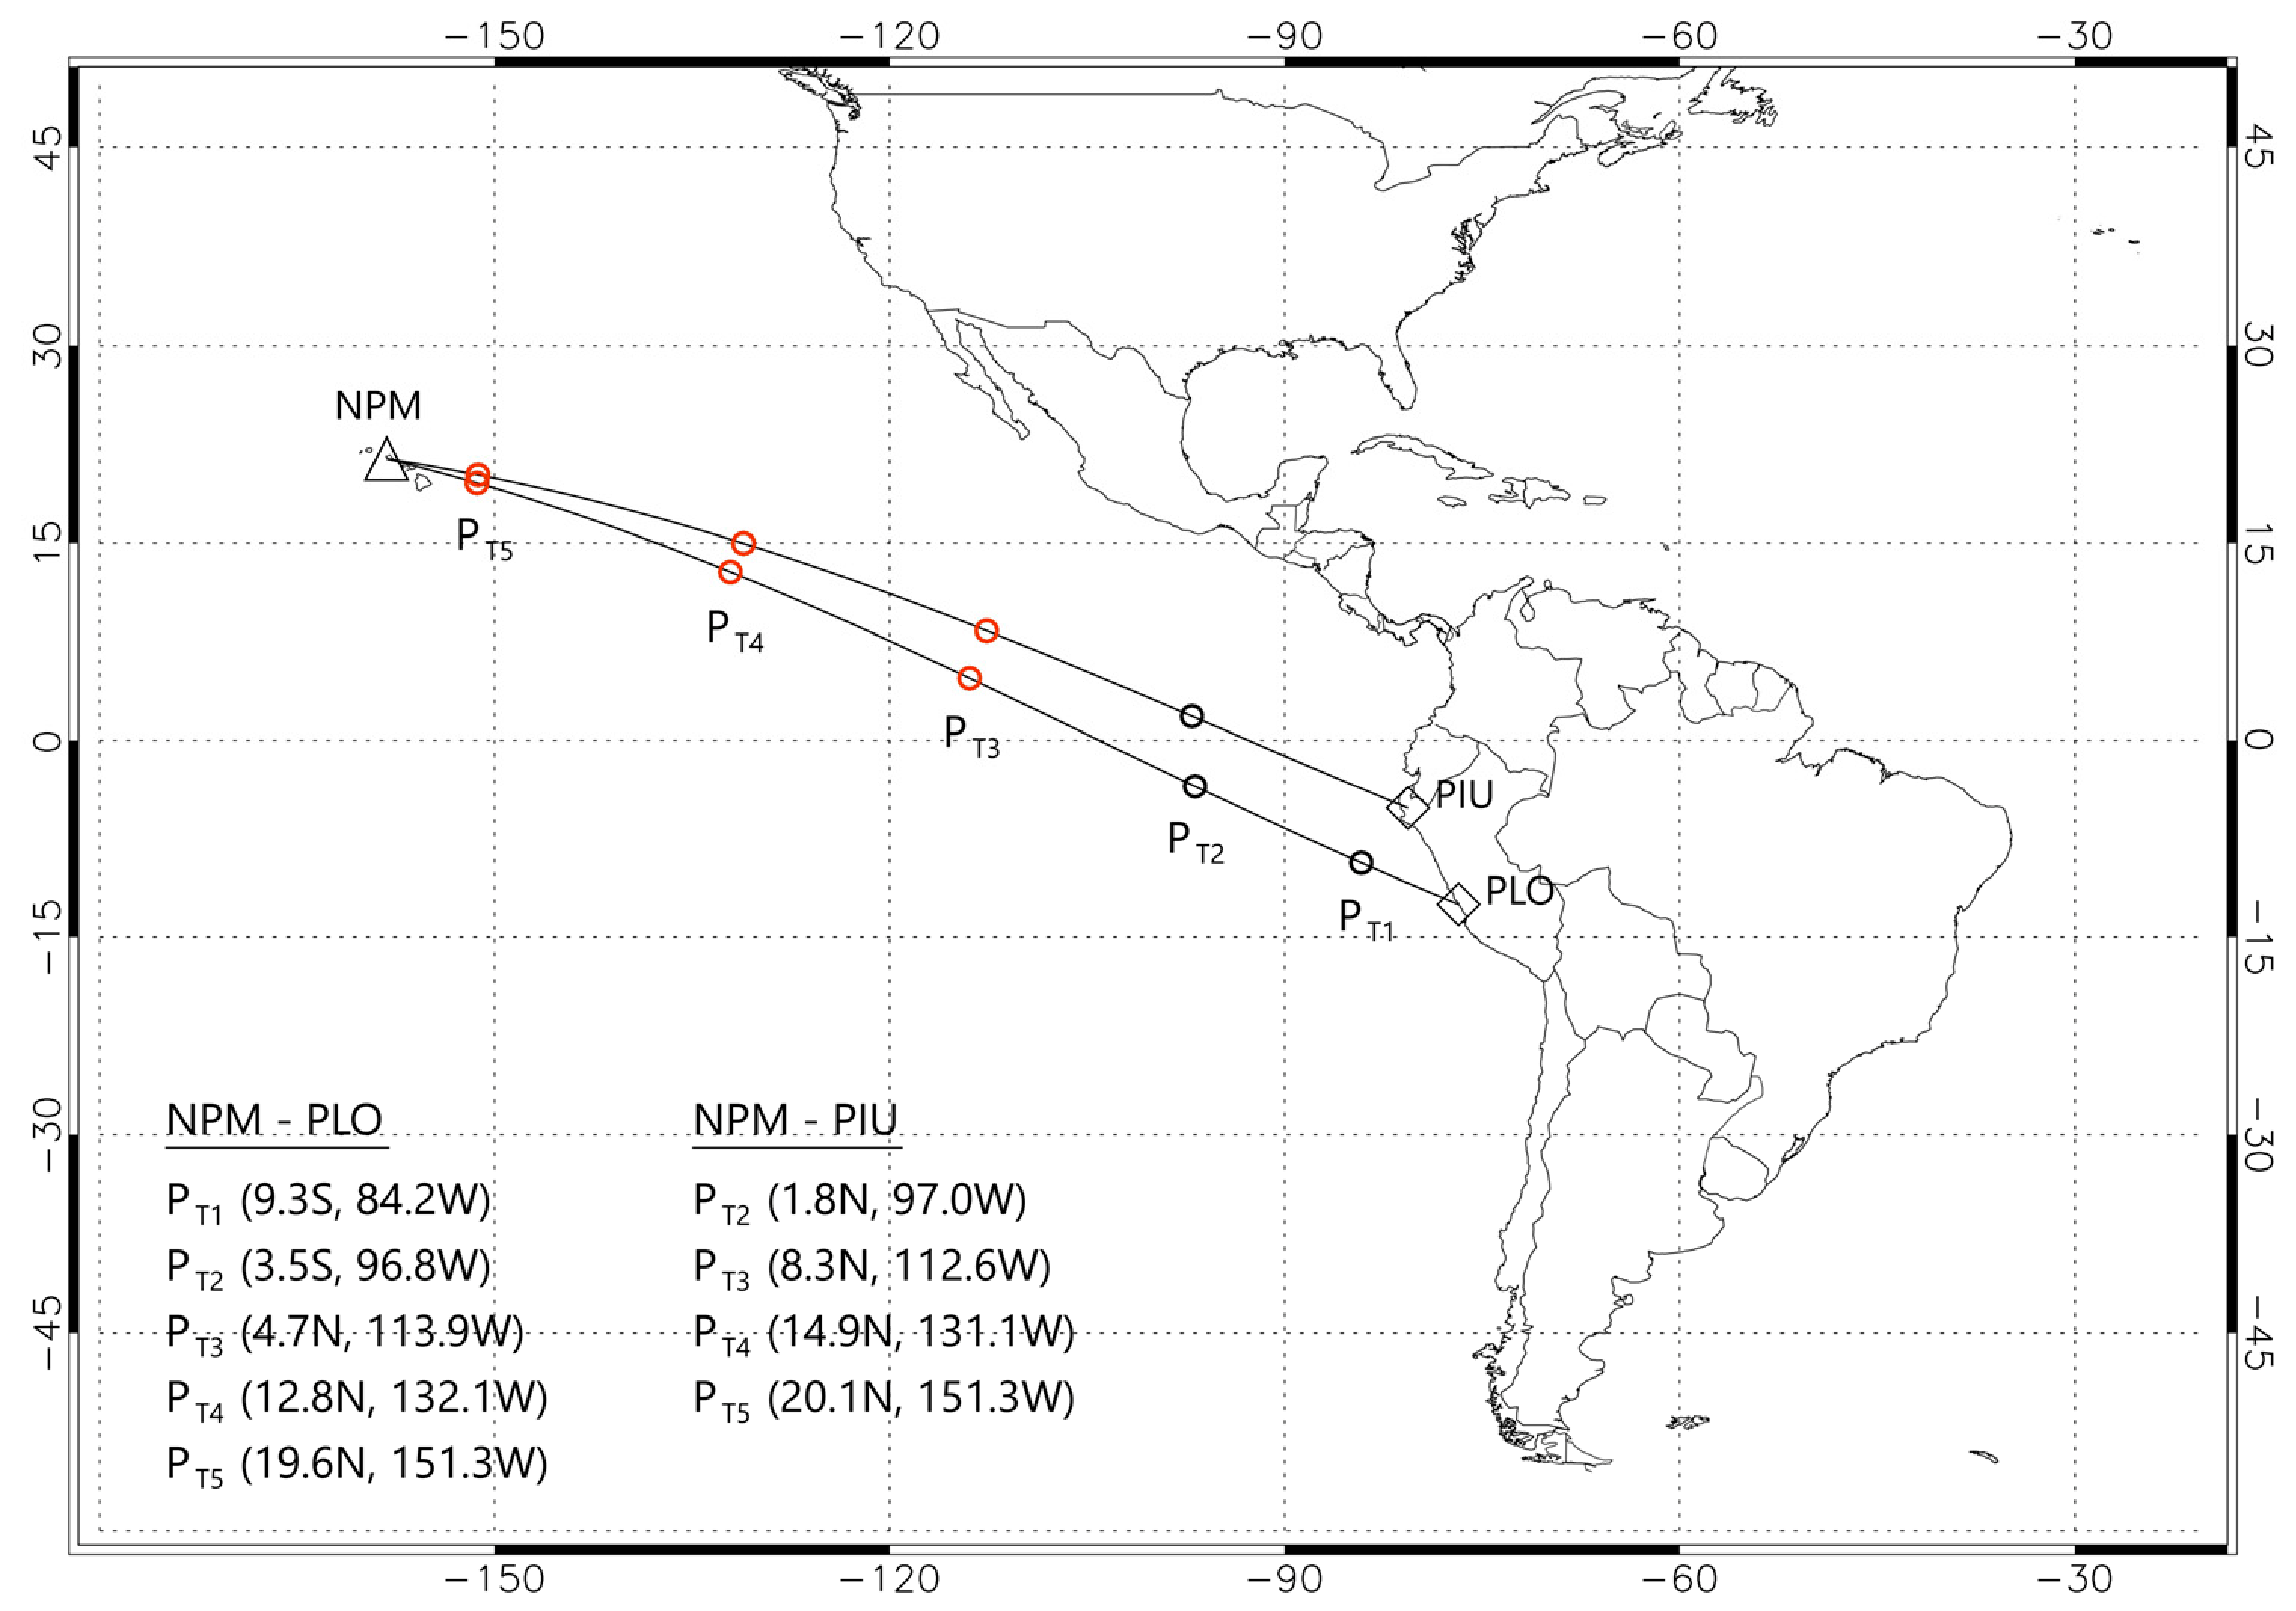
We analyze the paths between the NPM transmitter (Lualualei, HI, USA, 21.4 kHz) and the receivers located at Punta Lobos (PLO, Peru) and Piura (PIU, Peru), hereafter referred to as NPM-PLO and NPM-PIU, with lengths of approximately 9.64 Mm and 8.94 Mm, respectively. Figure 1 shows the locations of the VLF transmitters (triangle symbols) and receiver stations (diamond symbols), together with the corresponding propagation paths. Both paths lie at low latitudes and partially overlap, enabling nearly simultaneous observations under comparable geophysical and geomagnetic conditions, which supports a consistent comparative analysis.
Figure 1.
VLF propagation paths from transmitters NPM (triangle symbol) to PLO and PIU receiver stations (diamond symbols). The PTi points represent the mean geographical locations where minima amplitude occurs (see text).
To assess geomagnetic conditions, quiet conditions were defined as having Kp ≤ 3 (for the current and previous three intervals), Dst ≥ −30 nT, and F10.7 cm < 150 SFU. According to these criteria, the dataset includes both geomagnetically quiet and disturbed days. A sensitivity analysis was therefore performed by comparing results obtained with and without filtering disturbed days. No significant differences were found; consequently, all available days were included in the analysis in order to maximize statistical robustness.
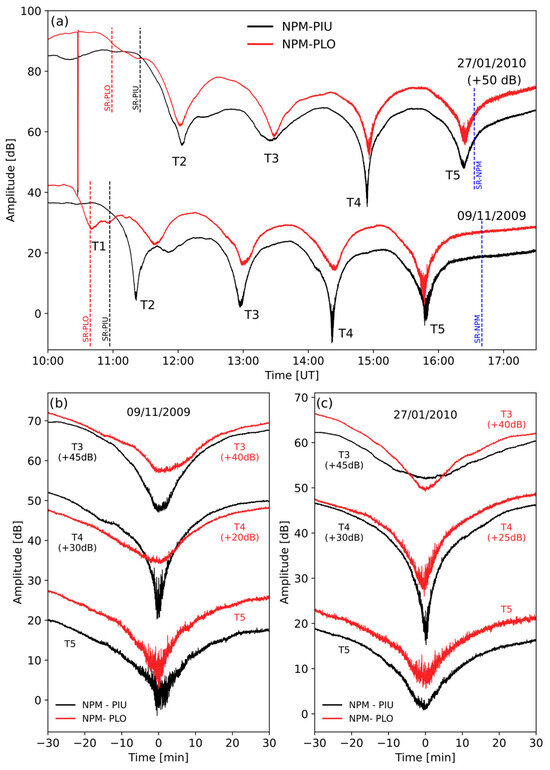
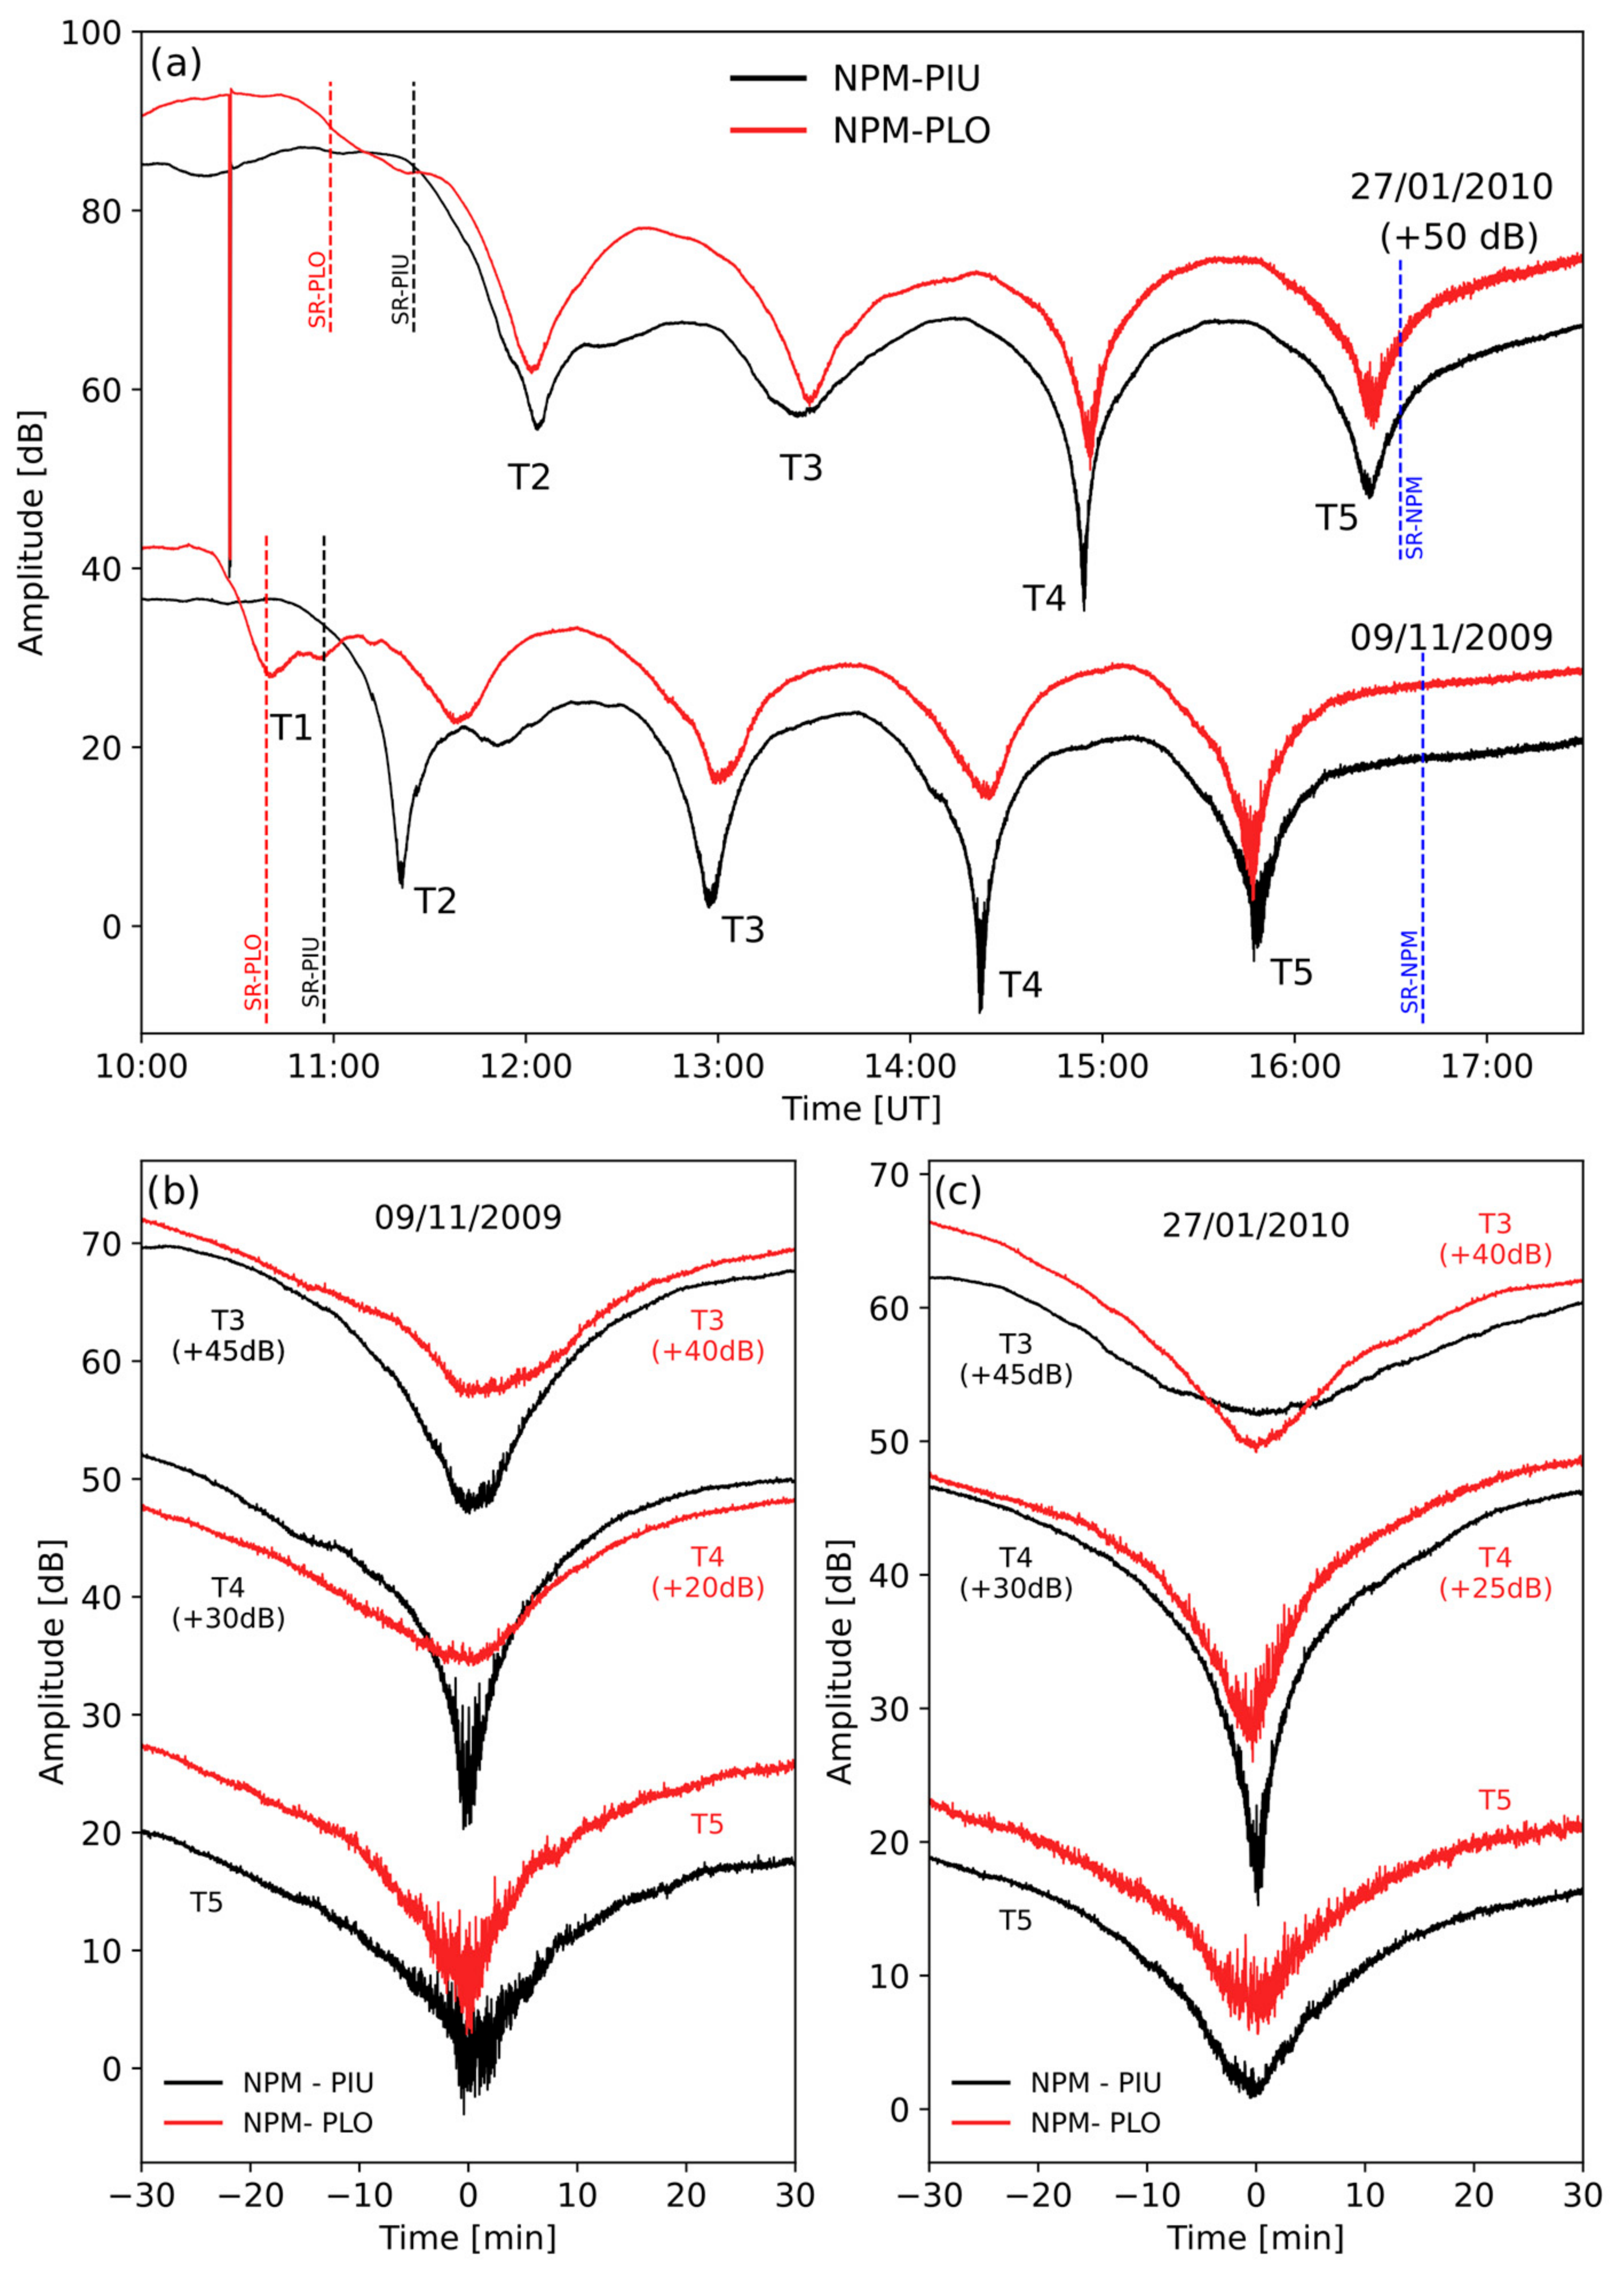
Figure 2 shows VLF amplitude recorded between 10:00 UT and 18:00 UT on 9 November 2009 and 27 January 2010 for the NPM-PIU (black curve) and NPM-PLO (red curve) paths. This time interval corresponds to the sunrise transition, defined here as the time required for the solar terminator to cross and fully illuminate the entire propagation path. The daily VLF amplitude curves exhibit the typical and well-defined modal interference pattern, characterized by a sequence of pronounced amplitude minima occurring as the solar terminator crosses specific locations along the propagation path, approximately corresponding to the local sunrise time at those locations. The mean geographical locations at which these sunrise amplitude minima are expected to occur were estimated following [15] and are labeled as PTi in Figure 1.
Figure 2.
(a) VLF amplitude recorded during the sunrise transition along the NPM-PIU (black curve) and NPM-PLO (red curve) propagation paths, showing typical amplitude minima whose occurrence times are labeled as T1–T5. The sunrise times (SR) at the receivers and transmitter are indicated by vertical black (PIU), red (PLO) and blue dashed lines, respectively. One-hour segments of amplitude recordings around the occurrence times T3–T5 for 9 November 2009 (b) and 27 January 2010 (c). Although the T4 minimum appears particularly pronounced in the examples shown, the relative depth of the T4 and T5 minima may vary from day to day.
The generation mechanism of these periodic amplitude minima is commonly interpreted as a consequence of modal interference and significant mode conversion processes occurring in the EIWG as the solar terminator crosses the propagation path [13,14]. For west–east propagation paths, the sunrise effect involves a non-negligible contribution from the nighttime second-order mode, which can reach the terminator region and be converted into a daytime first-order mode that subsequently propagates toward the receiver. For the NPM-PLO path, five amplitude minima are mostly identified (T1–T5), whereas four are observed along NPM-PIU. To enable direct comparison between both paths, the minima along NPM-PIU are labeled as T2–T5, corresponding to the later-stage minima identified along NPM-PLO, as indicated in Figure 2.
Previous studies have reported that the earliest sunrise minima are often weaker and less clearly defined than the subsequent ones. For instance, Ries [26] showed that the first two steps of the sunrise fading pattern are relatively weak and are frequently split into substeps for a long west–east propagation path, whereas the later steps are typically well defined. Similarly, Samanes et al. [15] found that the occurrence times of earliest minima exhibit larger temporal dispersion compared to the later ones. Consistent with these earlier findings, a comparison between the observed early and later minima indicates that the first minima (T1–T2) are generally less pronounced and less consistently identifiable than the later ones (T3–T5) for both NPM-PLO and NPM-PIU propagation paths. These observations suggest that the modal interference structure within the EIWG becomes progressively better defined as the solar terminator advances along the propagation path. Therefore, the analysis focuses on the signal variability around the later-stage minima (T3–T5), which are more clearly defined and reproducible, whereas the earlier minima (T1–T2) are more irregular and therefore less suitable for systematic spectral analysis.
Figure 2b,c presents enlarged one-hour views of the VLF amplitude variations around the minima T3, T4, and T5, using time windows centered on each minimum. For clarity, the amplitude curves corresponding to different minima are vertically offset. These minima are well-defined and consistently reproducible in the amplitude time series and, because the propagation paths are quasi-parallel over a portion of their trajectories, they are observed nearly simultaneously along both paths. An important feature of these intervals is the presence of short-period fluctuations in the vicinity of the amplitude minima, most clearly at T4 and T5, superimposed on the broader terminator-related minimum structure. This combination makes these intervals particularly suitable for investigating short-period oscillations. Therefore, the spectral analysis is performed over one-hour time intervals centered on each minimum, as shown in Figure 2b,c, enabling the identification of short-period oscillatory components embedded within the large-scale terminator-related variations. The analysis is focused on the sunrise transition, where conditions are expected to be more favorable for the generation of periodic atmospheric oscillations compared to sunset conditions [17,19].
2.2. Methodology
During the sunrise transition, the VLF amplitude time series is characterized by the superposition of large-amplitude, low-frequency variations associated with the solar terminator passage and smaller-amplitude, short-period fluctuations occurring on time scales of a few minutes, here referred to as wave-like fluctuations (WFs). These WFs represent quasi-periodic variations embedded within large-scale signals and exhibit nonstationary behavior that complicates the direct application of conventional spectral techniques such as Fourier analysis, which assume quasi-stationary signals. In particular, the dominant large-scale terminator-induced variation can mask weaker oscillatory components and introduce spectral leakage. Therefore, to isolate the short-period variability, the VLF amplitude signal is decomposed into its intrinsic temporal scales using the Complete Ensemble Empirical Mode Decomposition with Adaptive Noise (CEEMDAN) technique and it is combined with time-frequency analysis to examine the resulting oscillatory components.
CEEMDAN is a fully data-adaptive signal decomposition technique developed as an improvement of the original Empirical Mode Decomposition (EMD) proposed by [27]. Unlike Fourier-based or other decomposition methods that rely on predefined basis functions, CEEMDAN does not require any a priori assumptions about the signal structure, making it particularly suitable for the analysis of nonlinear and nonstationary geophysical time series. CEEMDAN decomposes a signal into a finite set of intrinsic mode functions (IMFs) together with a residual term, thereby separating the intrinsic temporal scales present in the data. One of the main limitations of classical EMD is the occurrence of mode mixing, whereby oscillations of different characteristic scales coexist within a single IMF or similar oscillatory components appear in multiple IMFs, leading to ambiguous physical interpretation. While the Ensemble Empirical Mode Decomposition (EEMD) [28] alleviates this problem through the addition of white noise, it may introduce reconstruction errors and lacks strict decomposition completeness. CEEMDAN overcomes these limitations by incorporating adaptive noise at each decomposition stage and ensuring ensemble consistency, resulting in improved spectral separation, reduced reconstruction error, and complete signal representation [29]. Therefore, CEEMDAN has been applied to a variety of geophysical and space-weather-related signals, particularly in situations where weak oscillatory components may be embedded within large-amplitude background variability (e.g., [30,31,32,33]).
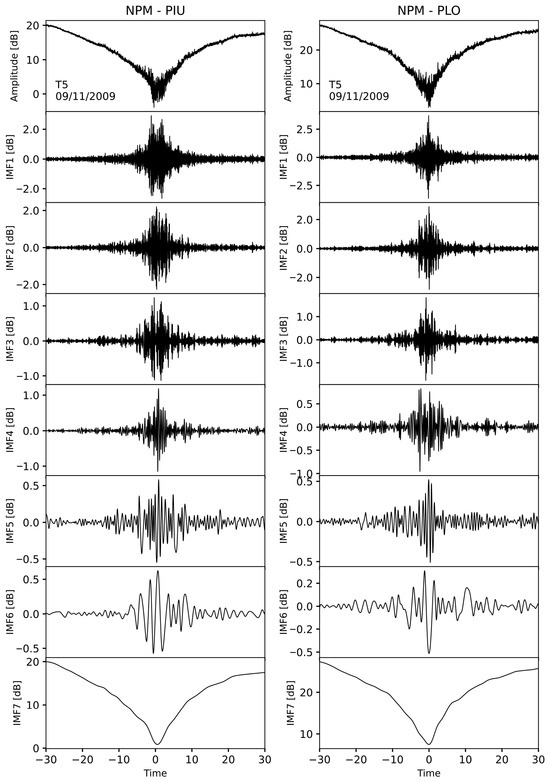
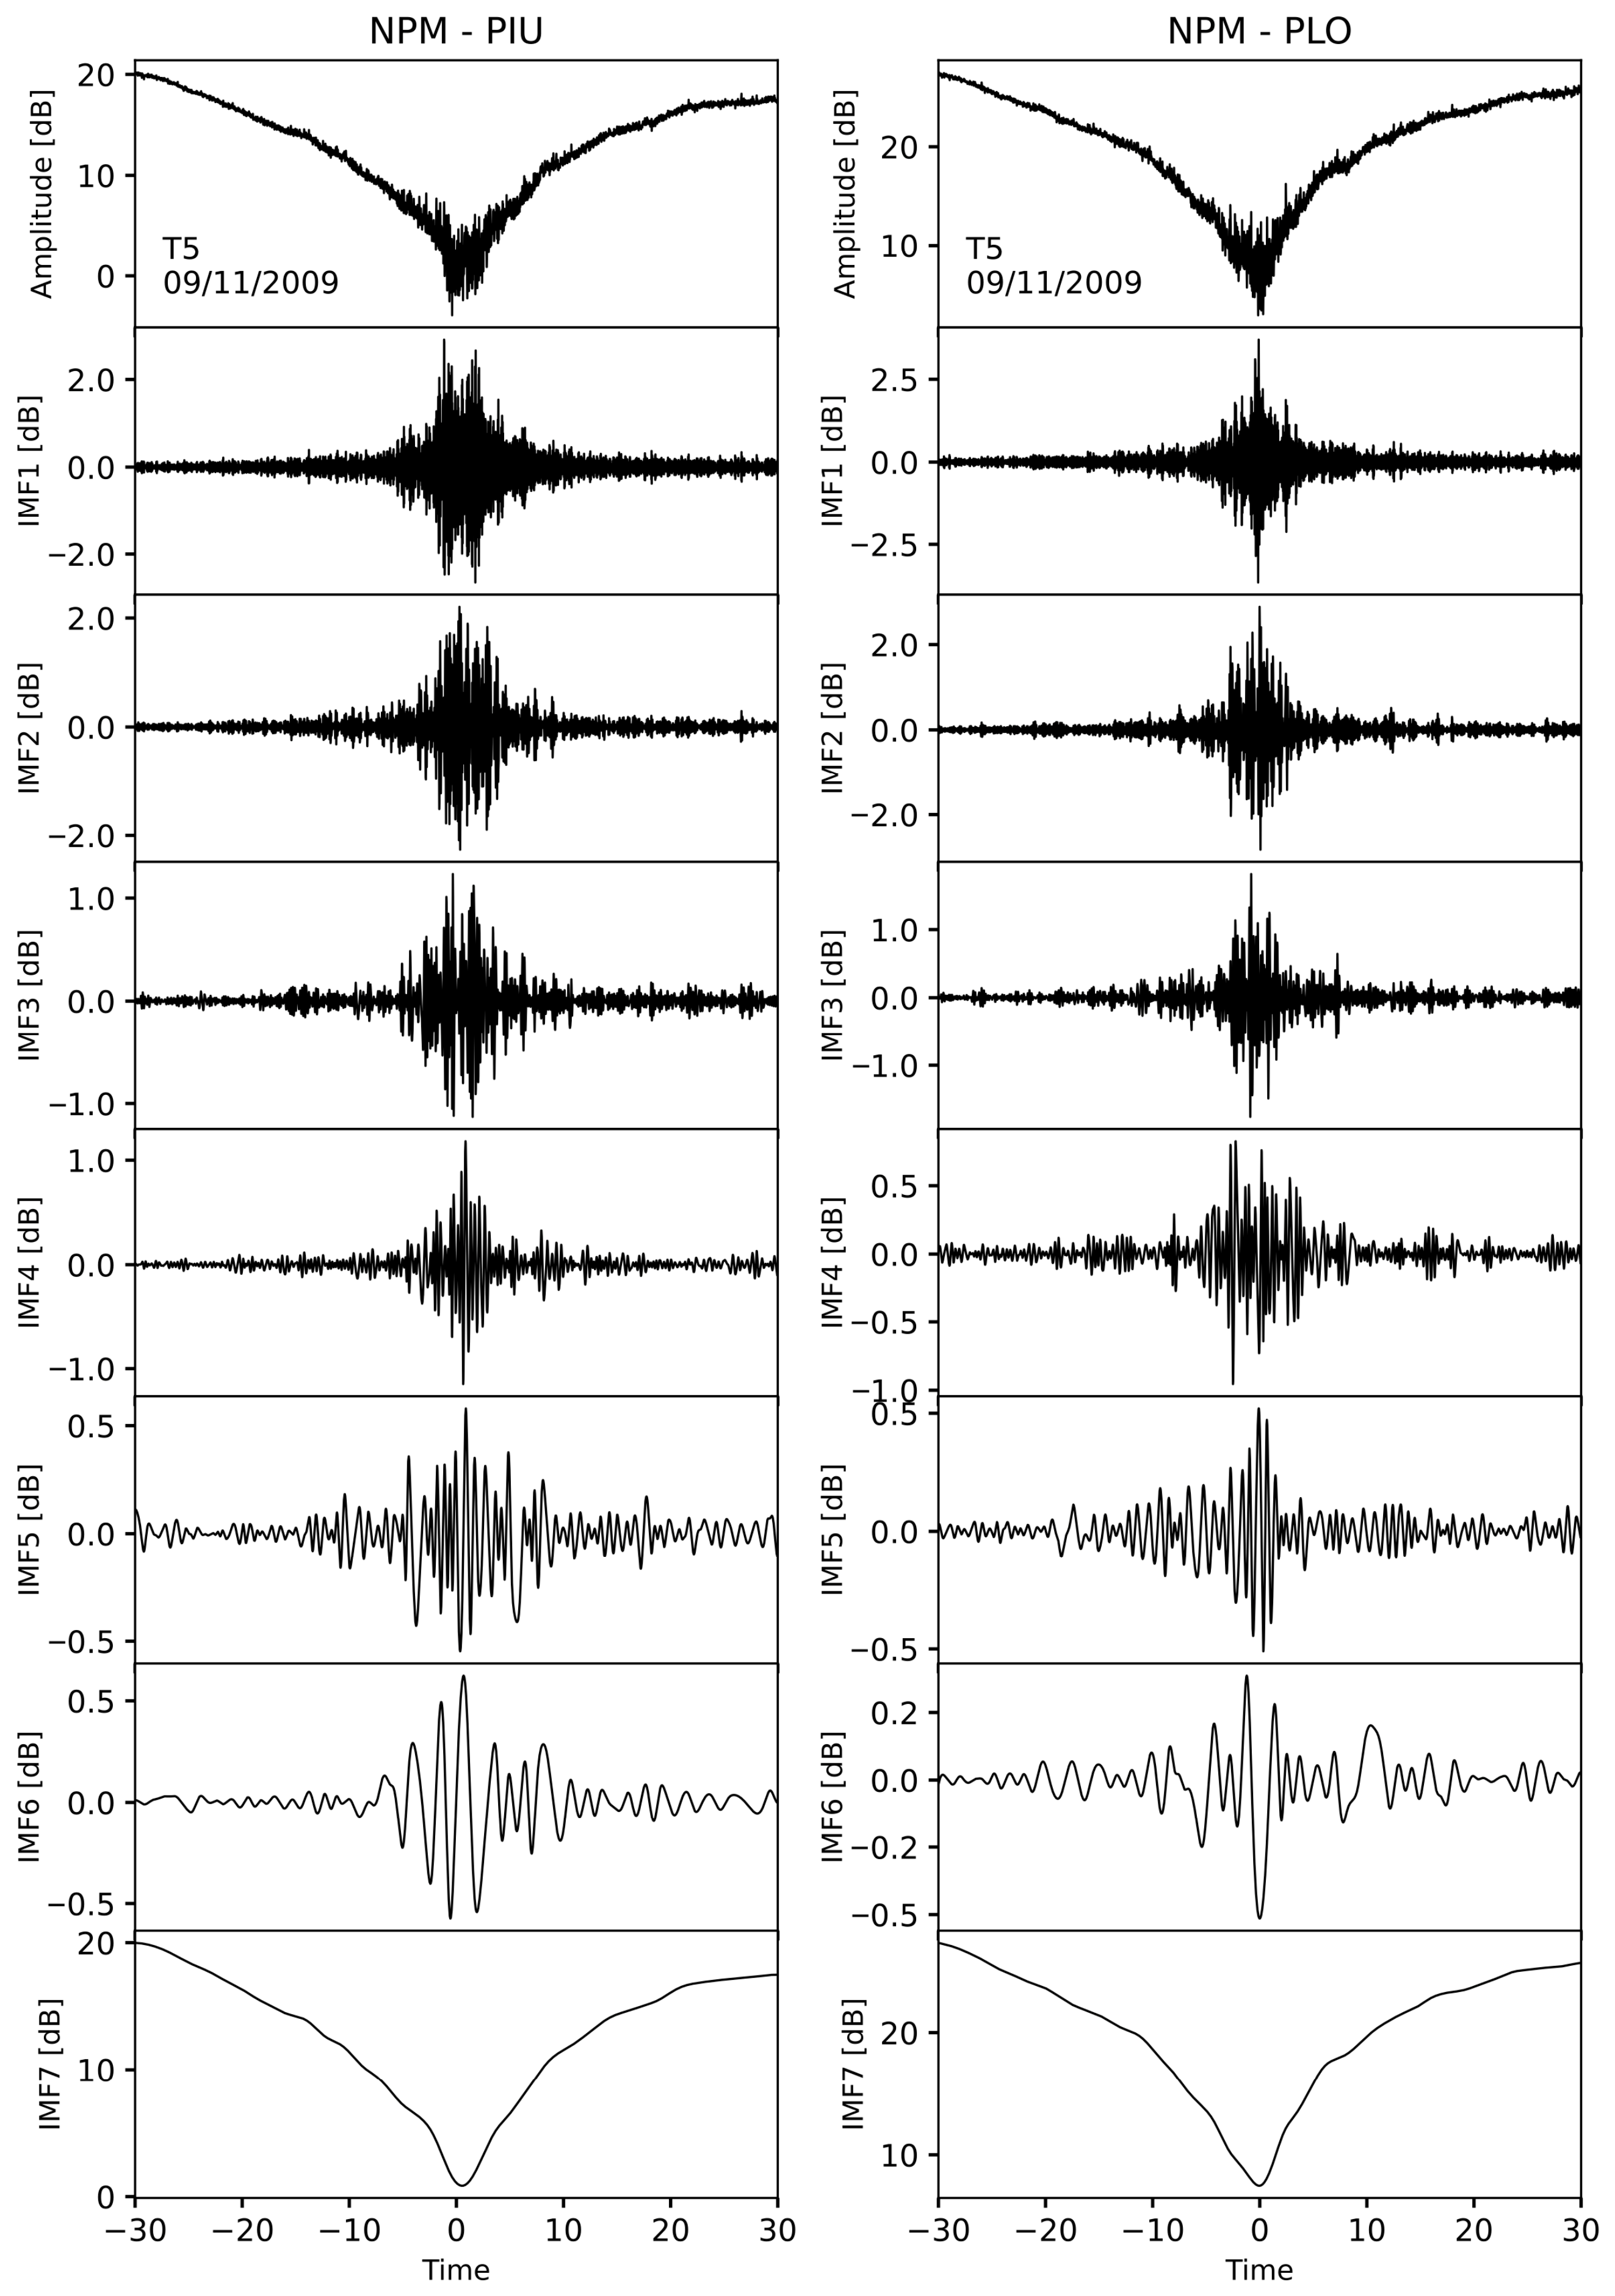
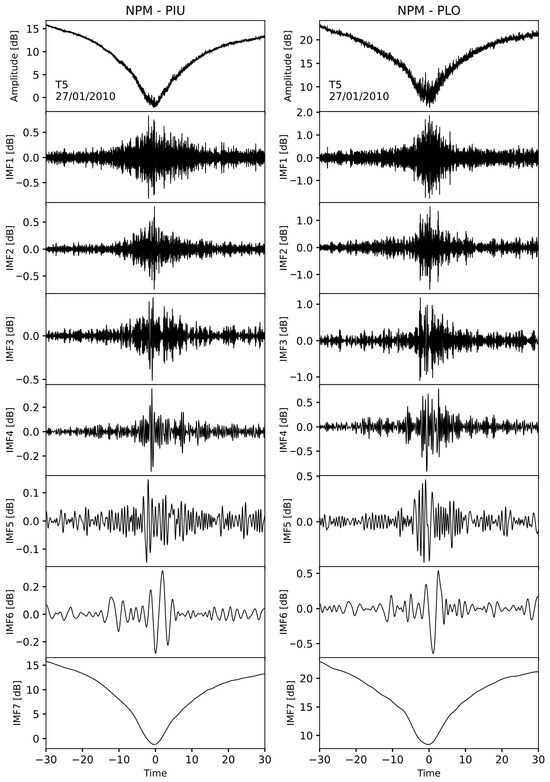
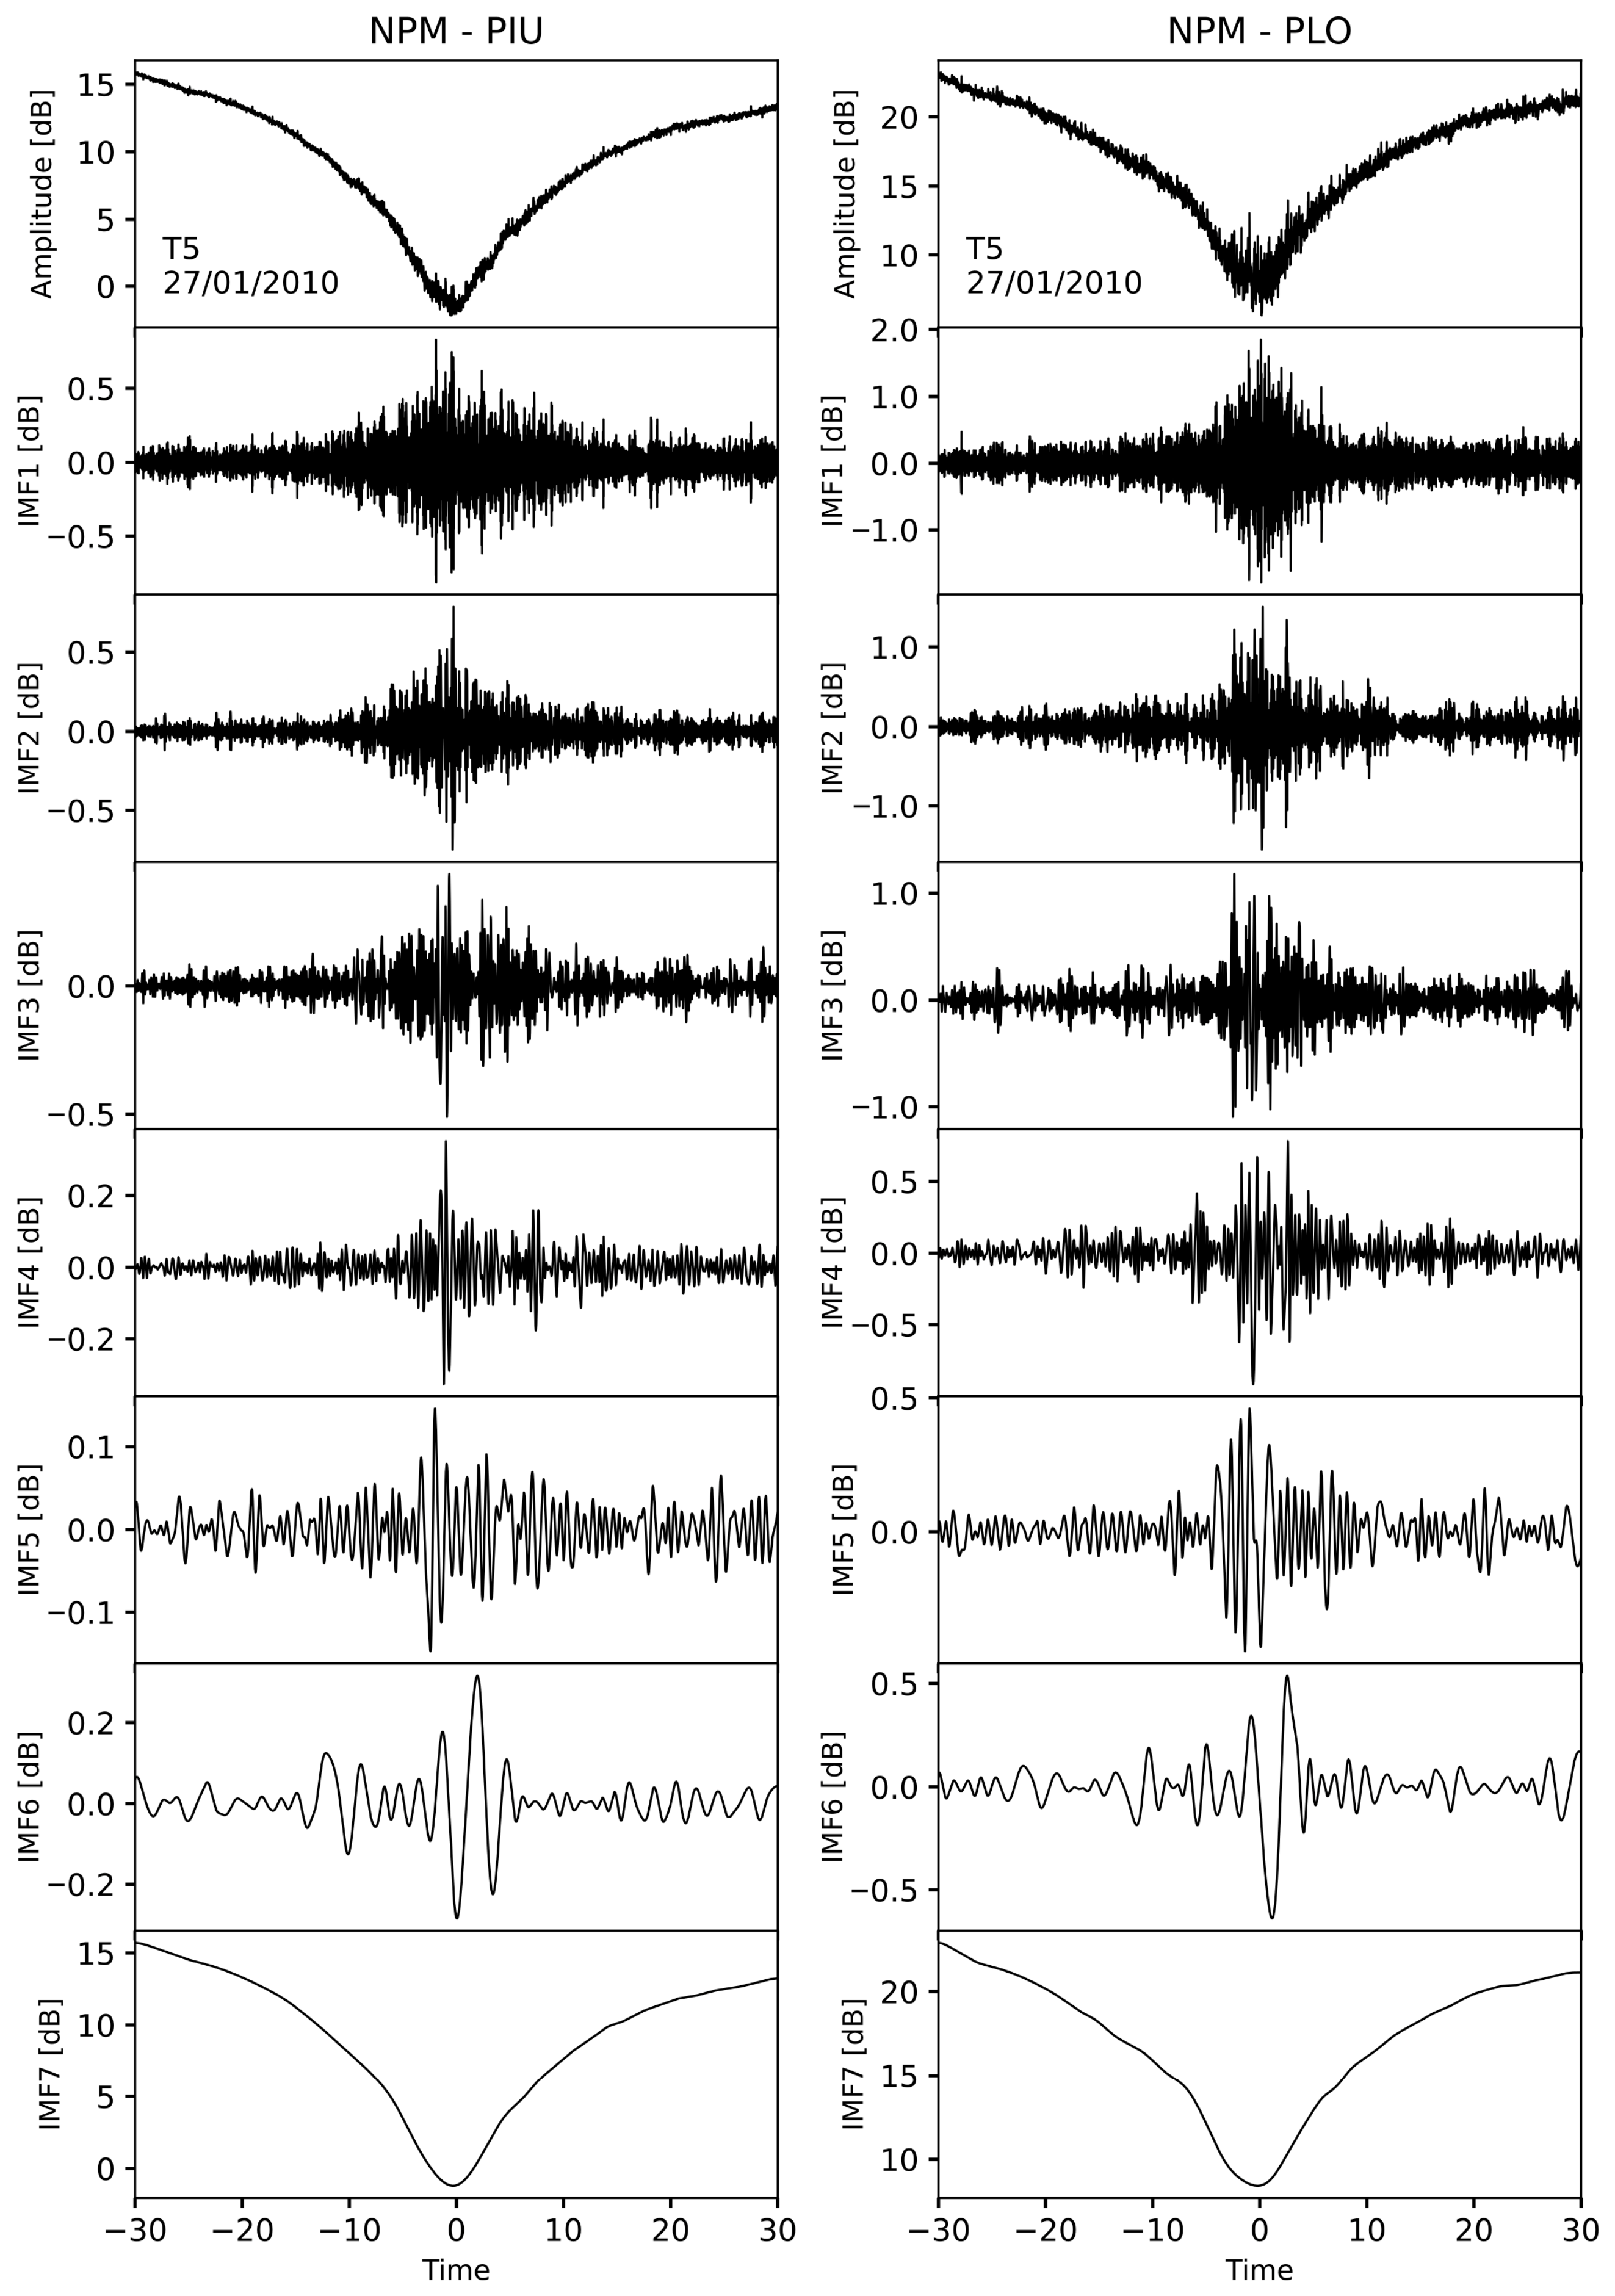
The CEEMDAN decompositions for the VLF amplitude around T5 (shown in Figure 2) for 9 November 2009 and 27 January 2010 are shown in Figure 3 and Figure 4, respectively. The decomposition yields a finite set of intrinsic mode functions (IMFs), ordered from high- to low-frequency components, each representing a distinct temporal scale of variability present in the signal. The lower-order IMFs (IMF1–IMF5) are dominated by high-frequency fluctuations, whereas the highest-order IMF7 reproduces the large-scale amplitude modulation associated with the minimum amplitude profile. Intermediate order IMF6 captures oscillatory features superimposed on the broader minimum structure.
Figure 3.
Intrinsic Mode Functions (IMFs) obtained by applying CEEMDAN on one-hour segment of VLF amplitude recorded around minimum T5 for 9 November 2009, and for NPM-PIU (left panels) and NPM-PLO (right panels).
Figure 4.
Same as Figure 3 for 27 January 2010.
For the dataset analyzed between 2008 and 2010, CEEMDAN typically decomposes the signal into seven IMFs, with an eighth IMF occasionally identified. A systematic inspection across all analyzed events shows that IMF1–IMF5 are dominated by periods shorter than ∼2 min, and they appear on most days. These components are therefore interpreted as primarily reflecting high-frequency variability, likely associated with instrumental effects or propagation-related noise. In contrast, IMF6 exhibits quasi-periodic oscillations with characteristic periods between approximately 2 and 6 min, consistent with short-period wave-like atmospheric disturbances previously reported in the lower ionosphere during sunrise (e.g., [22]). Therefore, our analysis focuses on the IMF6 (or IMF7 when present) that captures this temporal scale. The consistent identification of similar oscillatory components across independent propagation paths and over multiple days supports the physical significance of the extracted IMF component, reducing the likelihood that these features arise from decomposition artifacts.
The spectral characteristic of the selected IMF6 is determined using the Continuous Wavelet Transform (CWT), which provides a time-frequency representation suitable for capturing the temporal evolution of oscillatory features in nonstationary time series. The CWT method and the computational implementation used in this study follow the approach described in [34]. The statistical significance of the wavelet power spectrum is assessed at the 95% confidence level against a red-noise background spectrum. Edge effects associated with the finite length of the time series are identified using the cone of influence (COI), and regions outside the COI are not considered when computing the time-averaged wavelet power spectrum (Global Wavelet Power Spectrum, GWPS), which is used to identify the dominant periods present in the time series. To ensure a consistent comparison of spectral power across different periods, we apply the correction for the scale-dependent bias in the Wavelet Power Spectrum (WPS) proposed by [35].
3. Results and Discussion
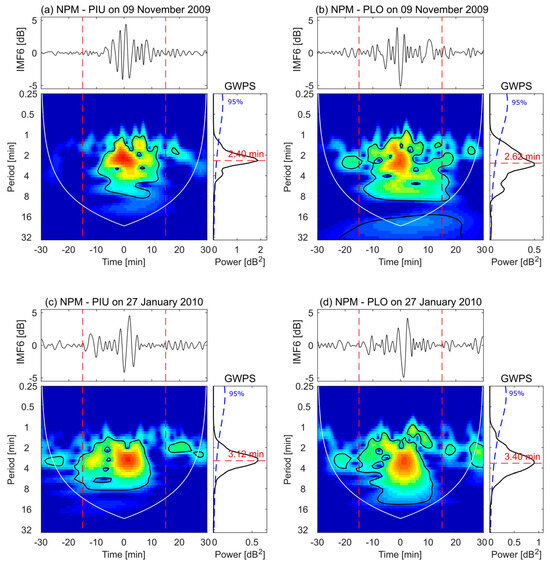
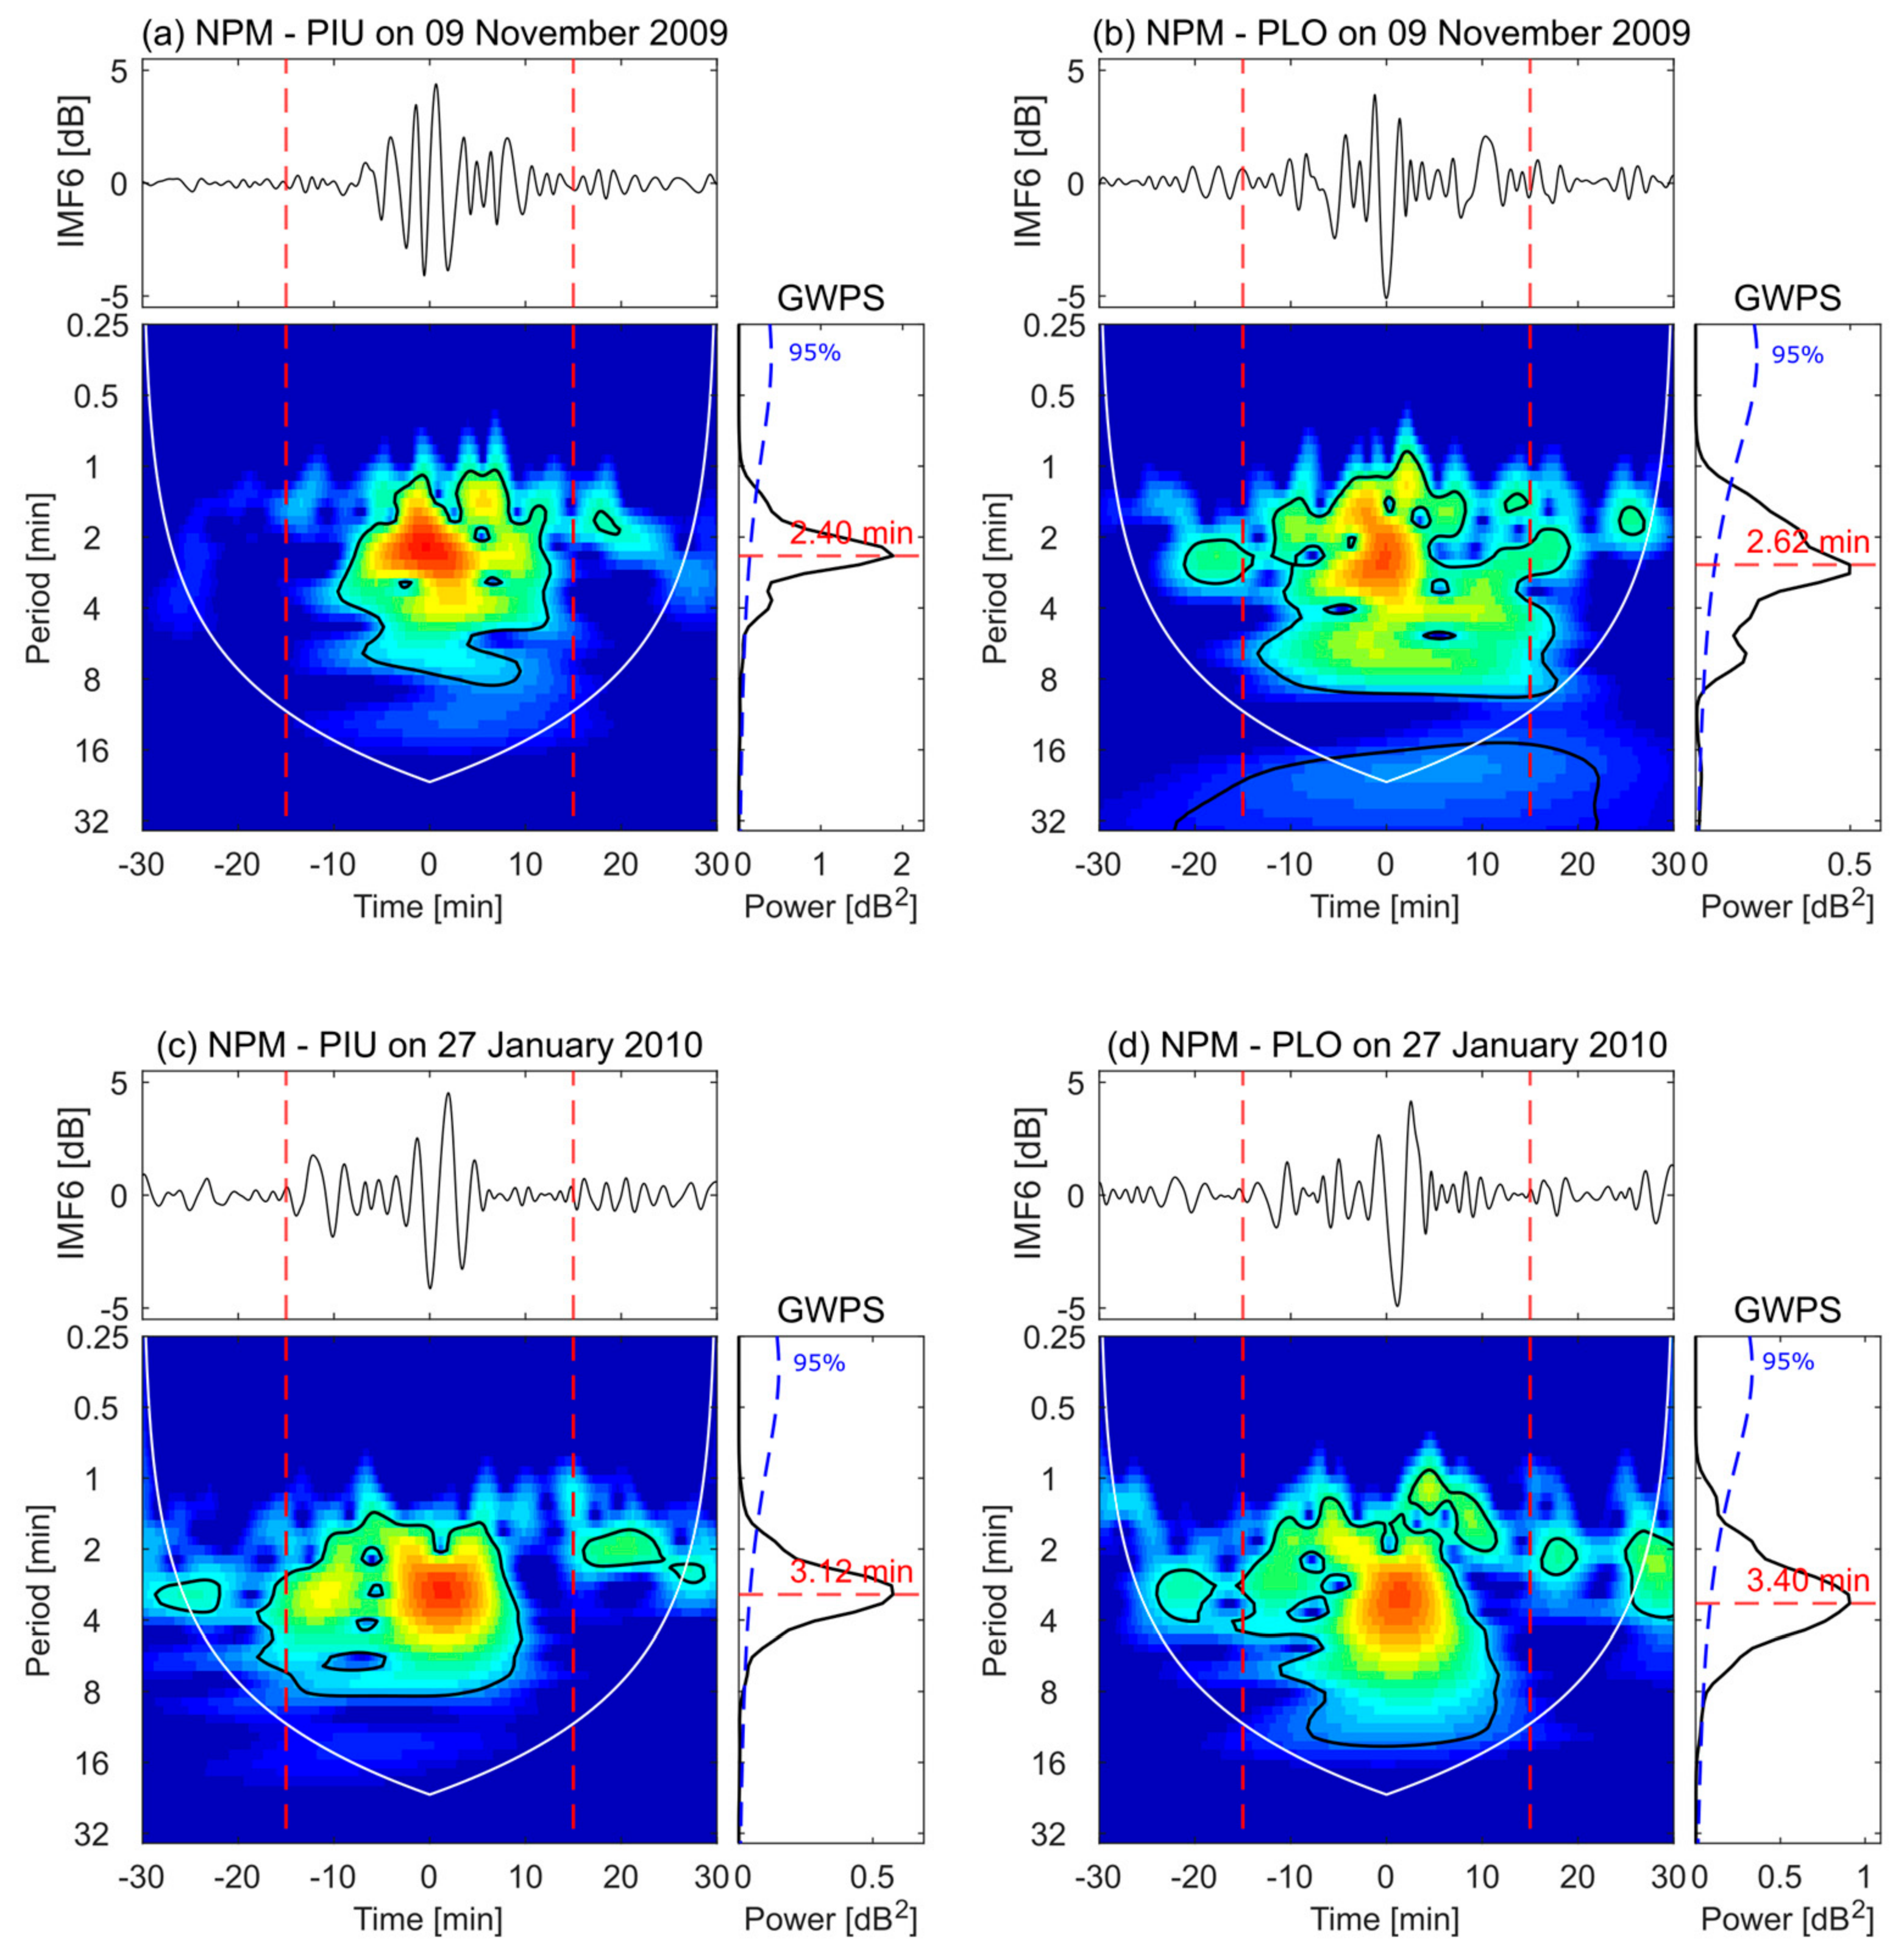
Figure 5 shows the spectral characteristics of IMF6 associated with the T5 minimum recorded on 9 November 2009 and 27 January 2010, for both propagation paths NPM-PIU and NPM-PLO. The upper panels display the IMF6 time series as previously shown in Figure 3 and Figure 4, while the lower panels present the corresponding wavelet power spectra. The Global Wavelet Power Spectrum (GWPS) is shown to the right of each panel.
Figure 5.
Spectral characteristics of IMF6 associated with the T5 sunrise minimum for 9 November 2009 (top panels) and 27 January 2010 (bottom panels) along the NPM-PIU and NPM-PLO propagation paths. The upper panels show the IMF6 time series. The lower panels display the corresponding continuous wavelet power spectra (CWT), with the Global Wavelet Power Spectrum (GWPS) shown to the right of each plot. Vertical dashed lines indicate the ±15 min interval around the minimum. The thick black contour in the CWT and the blue dashed line in the GWPS indicate the 95% confidence level.
Figure 5 shows that IMF6 exhibits pronounced wave-like fluctuations (WFs) in the vicinity of the amplitude minimum. Although these fluctuations are present throughout the entire one-hour window, their amplitudes increase systematically within approximately ±15 min around the minimum (delimited by the vertical dashed red lines), showing a clear contrast with the surrounding intervals where the oscillations are less organized and exhibit lower amplitudes. The dominant periods range between ∼2 and 4 min, with peak values of about 2.4–2.6 min on 09 November 2009 and about 3.1–3.4 min on 27 January 2010. For most of the analyzed days between 2008 and 2010, the dominant period of the selected IMF falls within the short-period range between approximately 2 and 6 min. These oscillations are consistently identified within the same IMF component (IMF6 or higher-order IMFs when present) across different days and propagation paths, indicating that they represent a stable feature of the signal rather than an artifact introduced by the decomposition method. These oscillatory features are most clearly resolved in the vicinity of the sunrise amplitude minima, suggesting that the VLF propagation conditions become particularly sensitive to small-scale perturbations during this stage. This enhanced sensitivity can be interpreted as a consequence of the evolving modal interference pattern, where slight variations in the effective reflection height may produce a stronger modulation of the received signal.
Previous studies have reported WFs in VLF signals associated with the passage of the solar terminator, suggesting that it may act as a source or triggering mechanism for atmospheric wave disturbances detectable in sub-ionospheric VLF propagation. For instance, Nina and Čadež [22] investigated VLF amplitude variations during sunrise and reported signatures consistent with AGWs in time intervals surrounding the amplitude minimum, typically spanning several tens of minutes before and after the terminator passage. They identified WFs with characteristic periods of approximately 60–100 s and 300–400 s, attributed to acoustic wave activity, while longer periods in the range of 700–900 s were associated with gravity waves. More recently, Cheremnykh et al. [23] investigated VLF amplitude fluctuations associated with the evening terminator and reported dominant oscillations with periods of about 15–20 min developing several hours after the terminator passage. Consistent with these previous findings, our results also reveal short-period WFs. However, in contrast to earlier studies that analyzed broader time intervals around the terminator passage, the oscillatory features identified here are most clearly resolved in the vicinity of the interference minima, where the modal structure within the EIWG is strongly developed, allowing short-period variability to be examined under well-defined propagation conditions.
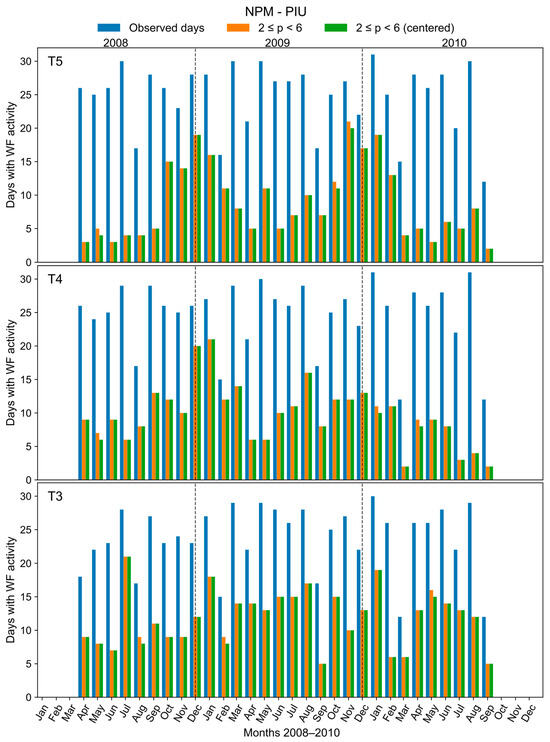
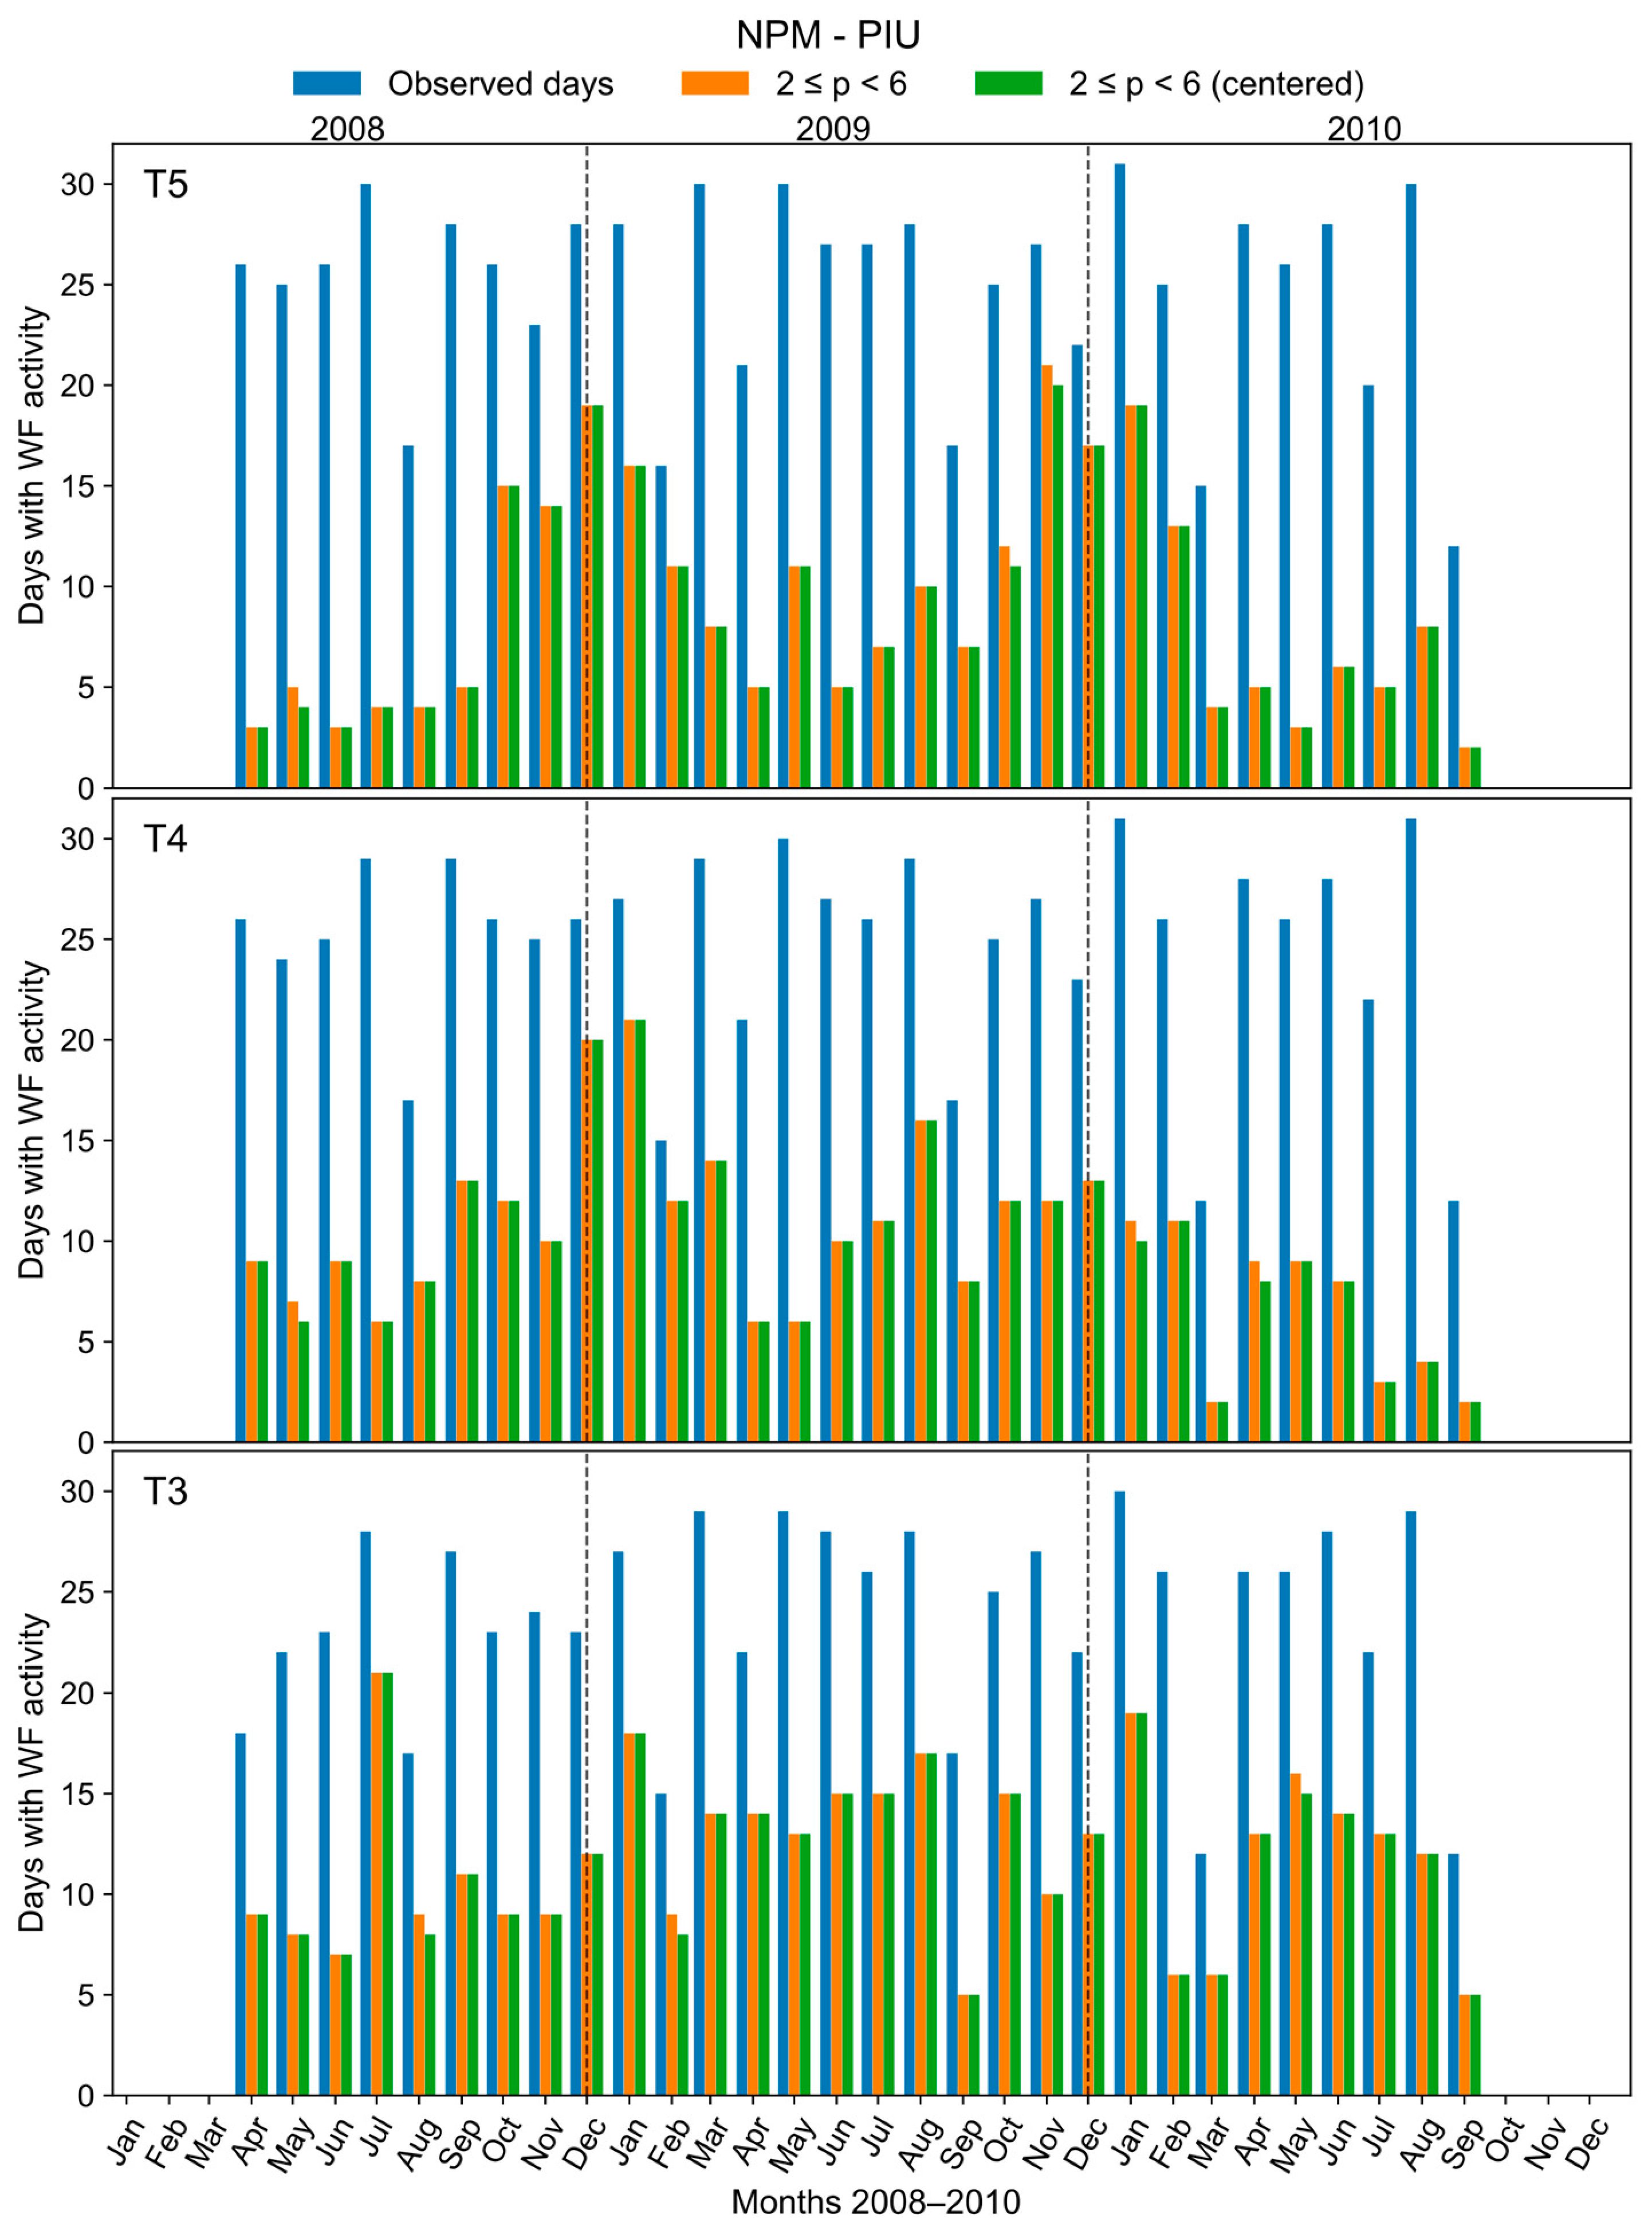
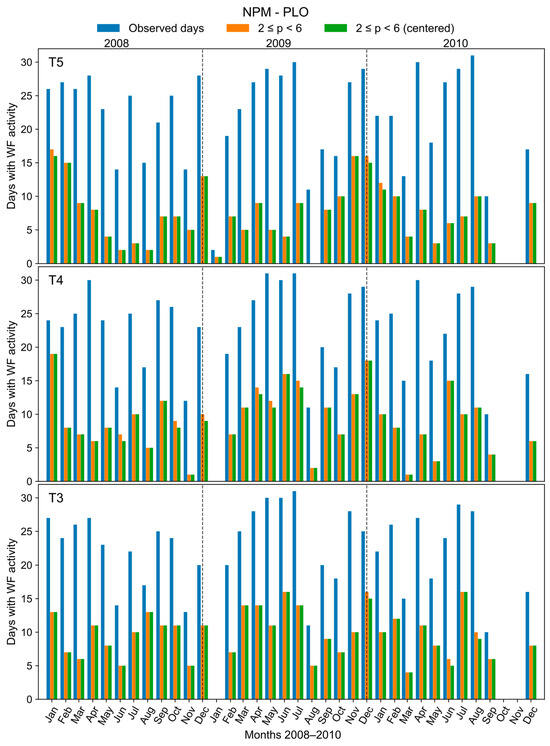
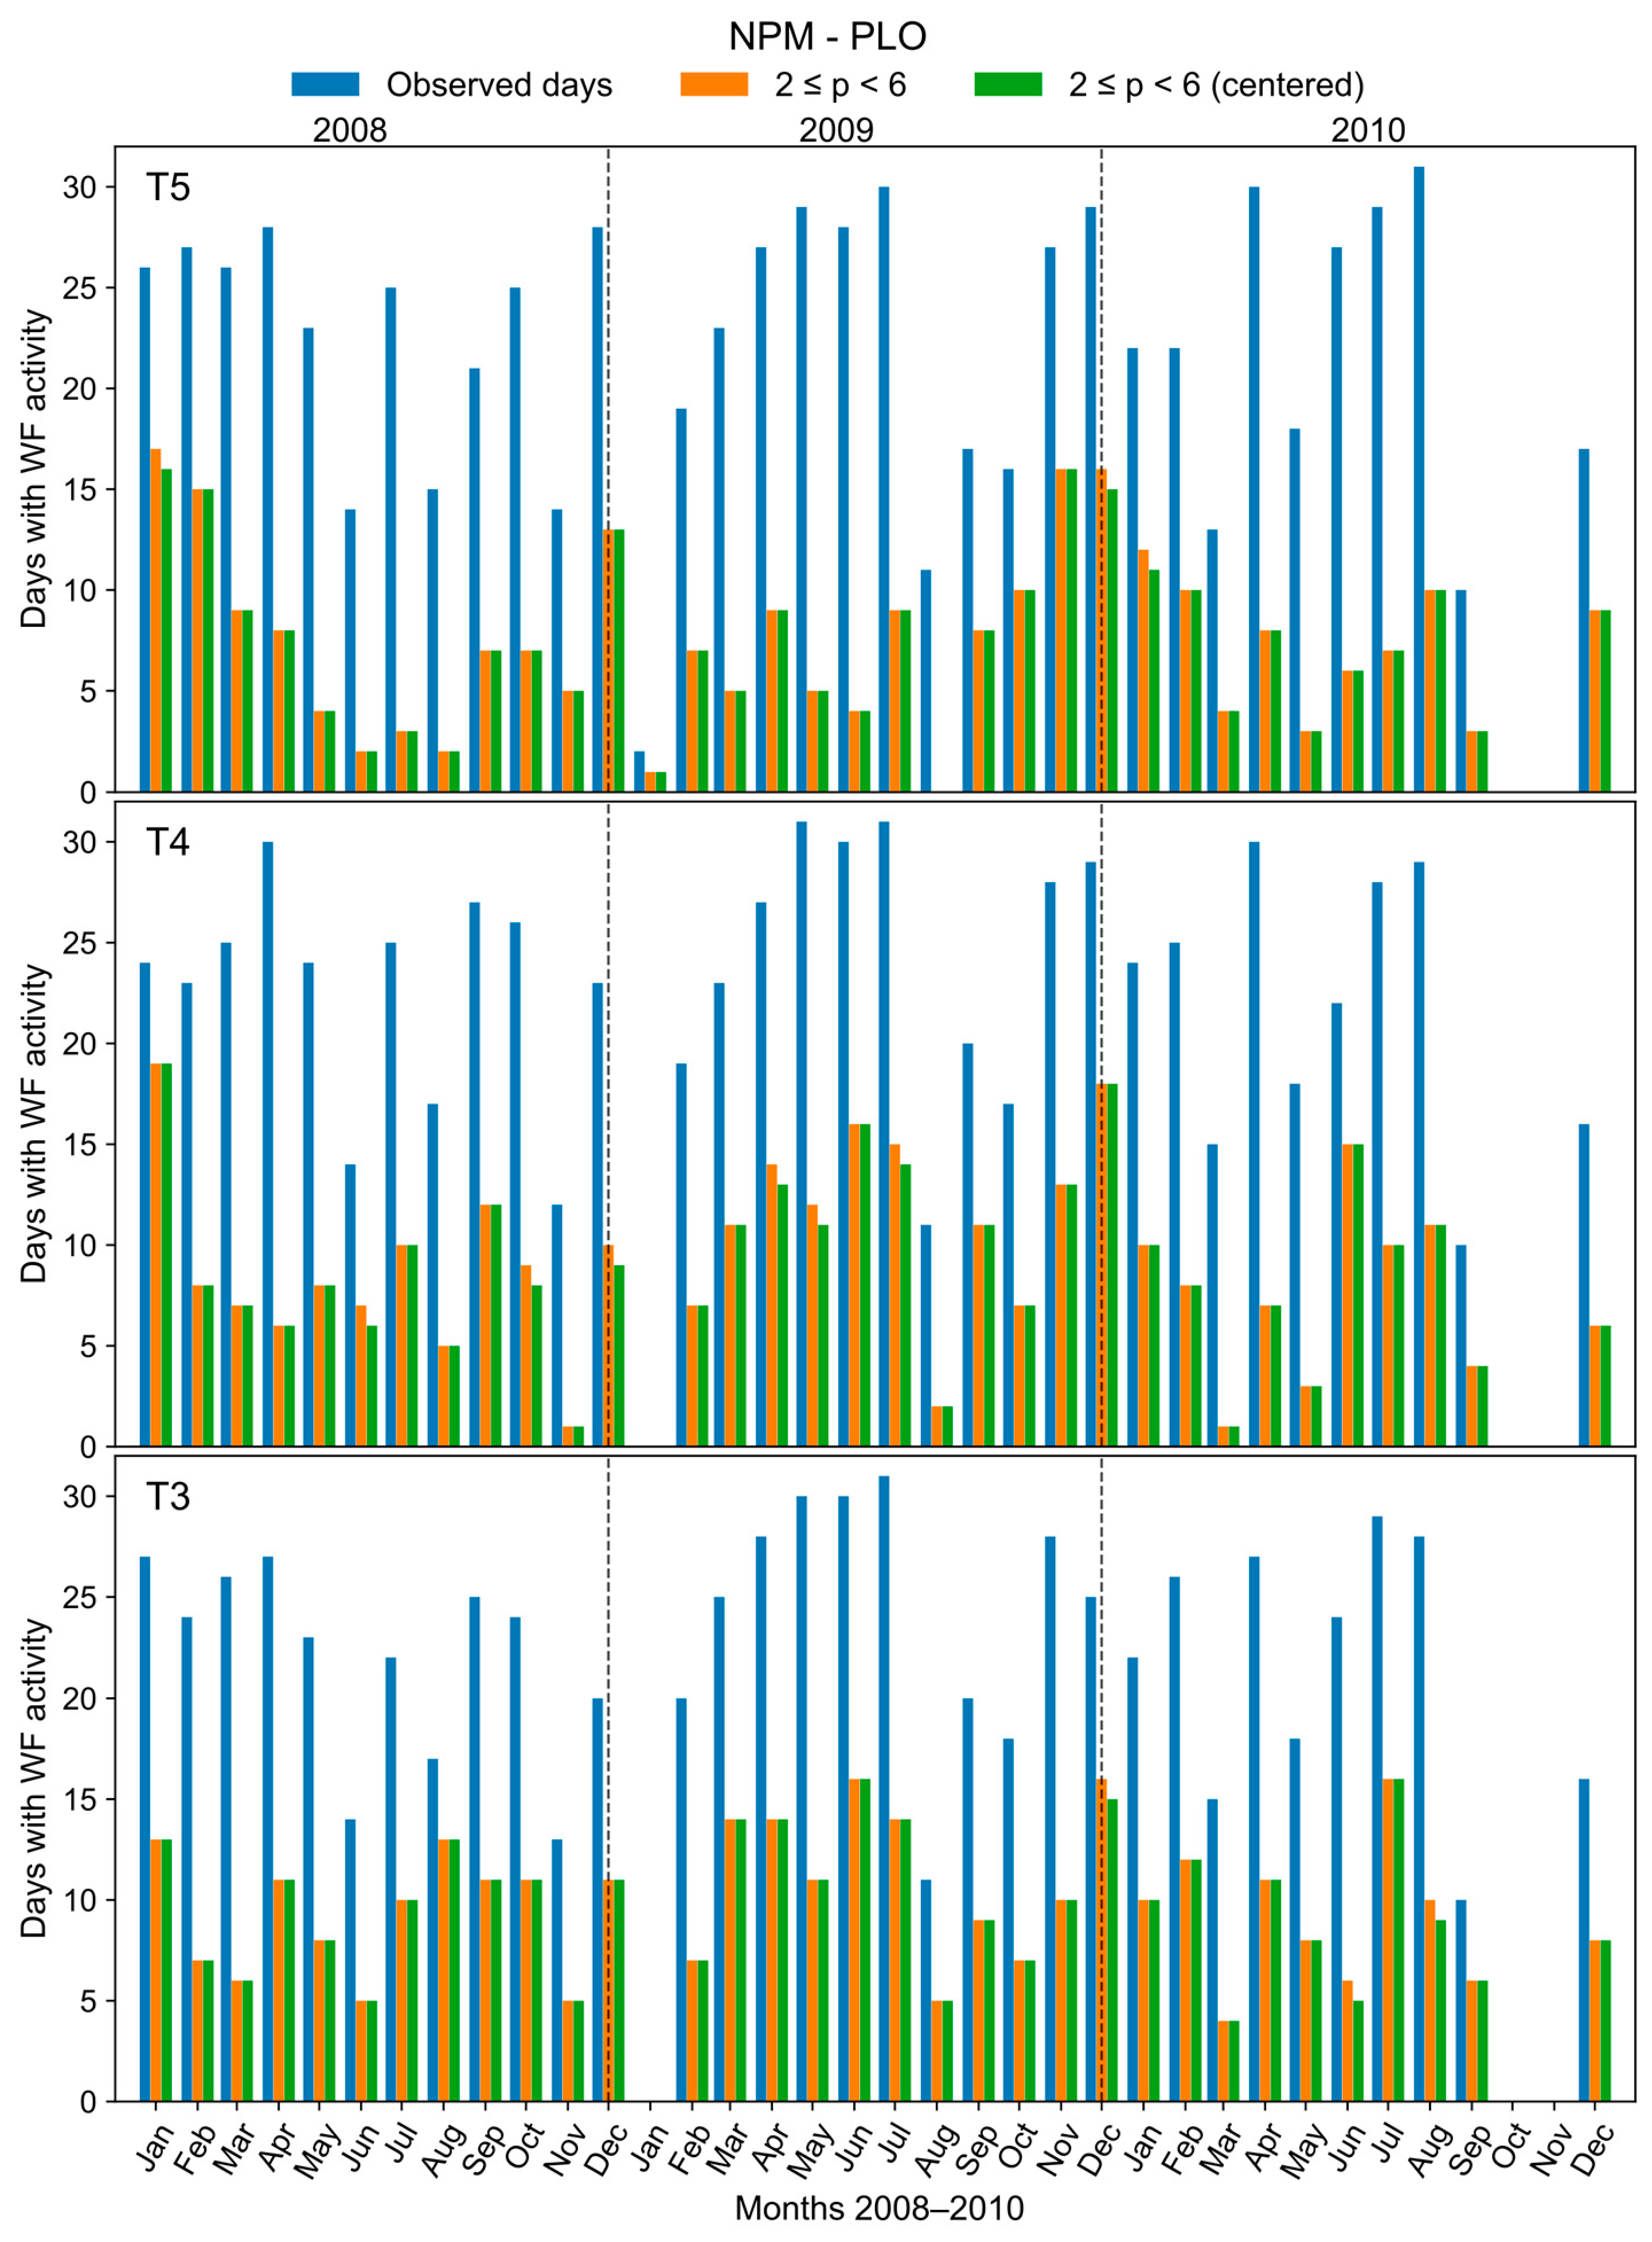
The monthly occurrence of WFs identified for the NPM-PIU and NPM-PLO propagation paths is shown in Figure 6 and Figure 7, respectively. For each month, blue bars indicate the number of days with available observations, while orange bars represent the number of days on which WFs with a dominant period between 2 and 6 min are detected. The green bars denote the subset of these days for which WF activity is centered within ±15 min around the corresponding amplitude minimum.
Figure 6.
Monthly occurrence of WFs for NPM-PIU propagation path and for minima T3, T4, and T5 over the period 2008–2010. Blue bars indicate the total number of available observation days per month, orange bars the number of days with detected WFs (dominant periods between 2 and 6 min), and green bars the subset of days for which the WF activity is centered within ±15 min of the corresponding amplitude minimum. Black vertical dashed lines separate the different years.
Figure 7.
Same as Figure 6, but for NPM-PLO propagation path.
For both propagation paths and for minima T3, T4 and T5, WFs with dominant periods between 2 and 6 min are detected on multiple days across most months. These periods are consistent with those previously reported in VLF amplitude measurements associated with the passage of the solar terminator [22]. In particular, periods shorter than ∼5 min are typically associated with acoustic waves below the acoustic cutoff frequency, whereas longer periods approach the Brunt–Väisälä limit for gravity waves, indicating that the observed WFs may include contributions from both acoustic and short-period gravity wave modes. Therefore, the detected oscillations likely reflect a mixed short-period atmospheric wave field whose signatures become observable in the VLF amplitude under favorable waveguide conditions during sunrise.
As shown in Figure 6 and Figure 7, WFs are predominantly centered around the minima, as indicated by the close correspondence between orange and green bars. As previously mentioned, this behavior suggests that the modal interference minima can be interpreted as localized regions of enhanced sensitivity, where the response of the VLF signal to small perturbations in the effective reflection height is amplified. Under these conditions, even weak ionospheric disturbances can produce detectable signatures in the received VLF amplitude. This interpretation is consistent with the idea that, near the minima, the waveguide response becomes more sensitive to small changes in the lower ionosphere because of the rapidly evolving modal structure during the sunrise transition.
On the other hand, seasonal variability is evident for both propagation paths, with enhanced activity during solstice months. This modulation is more pronounced for T4 and T5, whereas T3 exhibits a broader and more uniform distribution throughout the year. Similar seasonal behavior has been reported in VLF observations. For instance, Correia et al. [36] analyzed VLF amplitude measurements recorded at the Brazilian Antarctic Station and identified AGW signatures, showing that the distribution of detected wave periods varies with season and local time. Their statistical analysis revealed that short-period fluctuations below about 5 min occur preferentially during daytime conditions throughout the year, with increased occurrence between November and April. Consistently, Fedorenko et al. [37] reported that VLF amplitude fluctuations are observed across different seasons, with a tendency for increased amplitudes during summer months. In addition, studies of solar terminator waves have shown that their amplitudes and occurrence rates can be enhanced during solstice conditions, reflecting the seasonal variability of background atmospheric dynamics and migrating atmospheric tides that modulate the ionospheric response to terminator forcing [38,39]. These results are consistent with the enhanced WF activity observed here during solstice months and suggest seasonal changes in atmospheric wave generation, propagation conditions, and ionospheric sensitivity during the sunrise transition.
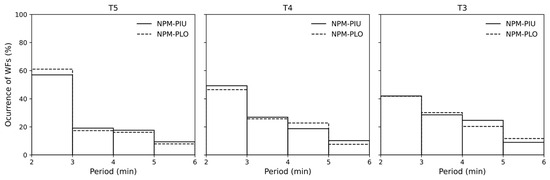
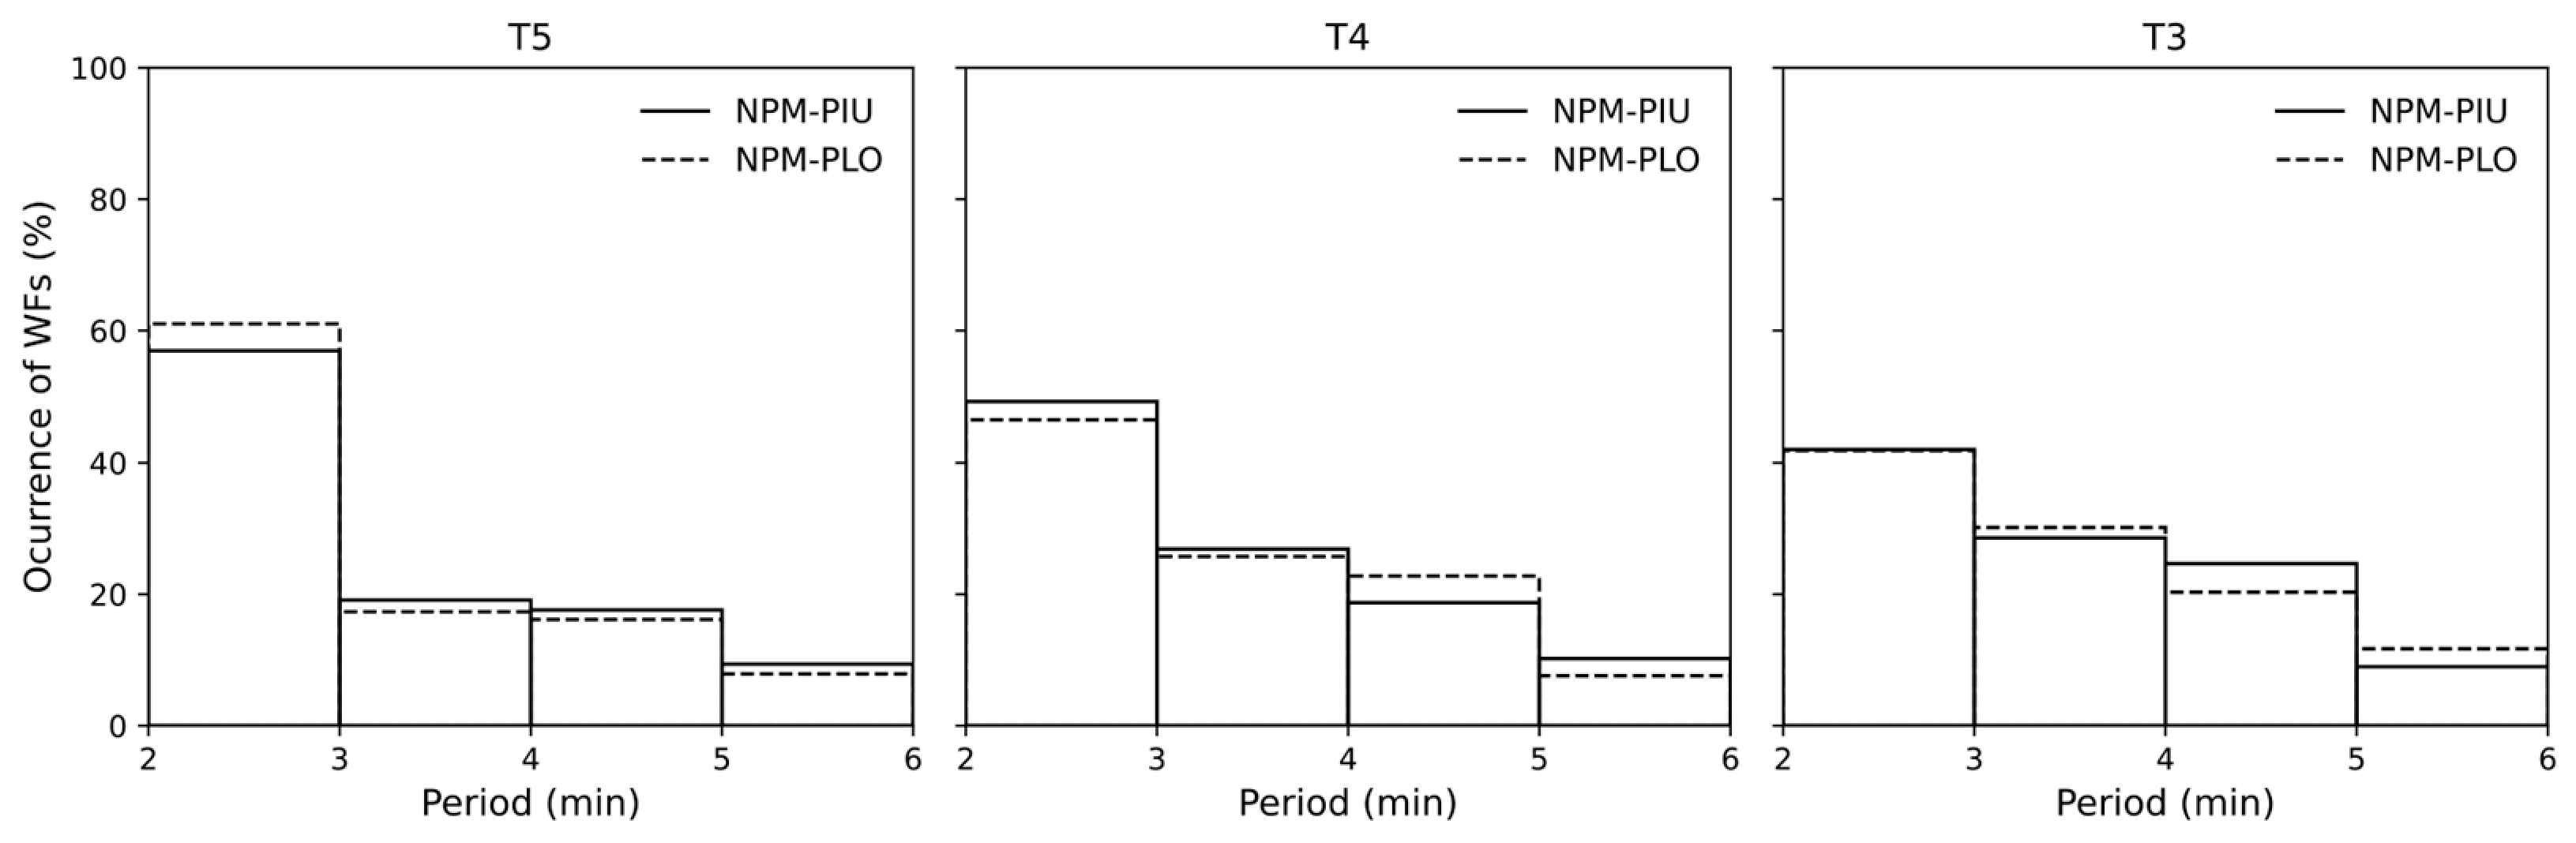
To further characterize the distribution of dominant periods associated with the detected WFs, Figure 8 presents the occurrence distribution for T3, T4, and T5, expressed as percentage values for both propagation paths. The distributions reveal that most WFs are concentrated within the 2–4 min range, with the highest occurrence at shorter periods (2–3 min). As the period increases, the occurrence decreases, although fluctuations with periods up to 5–6 min are still observed in a non-negligible number of cases. The similarity of this behavior across both propagation paths supports the robustness of the observed characteristics and reflects intrinsic properties of ionospheric variability during the sunrise transition. The consistent detection of similar oscillatory patterns along both independent propagation paths and across multiple days indicates that these fluctuations represent genuine variability in the VLF amplitude. In addition, the detected oscillations are preferentially concentrated within a relatively narrow period range of approximately 2–6 min and are systematically observed near the sunrise amplitude minima. Such coherent temporal and spectral behavior is not consistent with random noise-induced fluctuations or decomposition artifacts. These results are consistent with a sensitivity analysis with respect to geomagnetic activity, indicating that the occurrence and distribution of the detected WFs remain essentially unchanged when geomagnetically perturbed days are excluded. This suggests that their occurrence is not significantly controlled by geomagnetic conditions, further supporting the interpretation that they are primarily associated with terminator-related propagation and atmospheric processes.
Figure 8.
Occurrence distribution (%) of periods associated with WFs identified for T3, T4, and T5, for the NPM-PIU (solid line) and NPM-PLO (dashed line) propagation paths.
The observation of WFs during the later-stage minima (T3–T5) suggests that their detectability is linked to specific physical conditions of the EIWG during sunrise. Sunrise amplitude minima are widely interpreted as manifestations of modal interference and conversion processes driven by rapid changes in ionospheric conductivity and effective reflection height. During the transition from nighttime to daytime conditions, the increasing contribution of higher-order modes produces enhanced nonstationarity and stronger phase and amplitude variability [26]. Under such conditions, the evolving modal structure within the waveguide may enhance the sensitivity of the received VLF signal to small perturbations in the effective reflection height of the lower ionosphere. Consequently, even relatively weak ionospheric disturbances may produce detectable signatures in the received signal during the sunrise transition. In this sense, the later-stage minima appear to provide the most favorable conditions for resolving short-period variability, likely because the modal interference pattern is more fully developed and reproducible at those stages.
Overall, the results indicate that short-period WFs are a recurrent feature of the sunrise transition rather than isolated events, with their preferential localization near later amplitude minima, reflecting enhanced waveguide sensitivity under strongly evolving modal interference conditions during the solar terminator passage. These findings suggest that the modal interference pattern associated with sunrise provides favorable observational conditions under which weak short-period ionospheric disturbances become more readily detectable in sub-ionospheric VLF observations. In this context, focusing on time intervals centered on amplitude minima provides an effective approach for isolating short-period atmospheric perturbations, particularly under conditions where such signals are otherwise difficult to resolve.
4. Conclusions
This study investigates the spectral characteristics of VLF amplitude during the sunrise transition along long west–east propagation paths under solar minimum conditions. Narrowband VLF observations from the SAVNET for the NPM-PIU and NPM-PLO paths over the period 2008–2010 were analyzed. The analysis focuses on time intervals centered on sunrise amplitude minima, corresponding to characteristic stages of the solar terminator passage along the propagation path, which provide a consistent temporal framework for the characterization of short-period variability. By applying CEEMDAN decomposition combined with wavelet analysis, short-period oscillatory components embedded within the large-scale amplitude variations associated with the solar terminator transition were isolated and characterized.
The analysis reveals the recurrent presence of WFs with dominant periods between 2 and 6 min near the amplitude minima, particularly during the later-stage minima T3–T5, where the modal interference structure of the EIWG is more clearly developed and better defined. Under these conditions, the evolving modal structure of the waveguide may increase the sensitivity of the received VLF signal to small perturbations in the effective reflection height. The observed periodicities are consistent with previously reported short-period atmospheric wave disturbances, including both acoustic and gravity wave modes, affecting the lower ionosphere during the solar terminator transition. However, their physical origin cannot be attributed to a single source mechanism; therefore, future work should focus on combining VLF observations with complementary ground-based and satellite measurements to further constrain and validate these findings.
The results indicate that short-period WFs are a recurrent feature of the sunrise transition rather than isolated events. Their preferential localization at later-stage minima highlights the role of the evolving modal interference structure in enhancing the sensitivity of the VLF signal to small perturbations. Under these conditions, the modal interference minima can act as natural observational windows in which weak short-period disturbances in the lower ionosphere become detectable in VLF amplitude measurements.
Finally, a statistical analysis of the monthly occurrence of WFs shows that these fluctuations are detected on multiple days throughout the year and exhibit seasonal modulation, with increased occurrence during solstice months. This behavior suggests that seasonal variations in the background atmospheric and ionospheric conditions may influence both the generation of atmospheric wave disturbances and their detectability in sub-ionospheric VLF measurements.
Author Contributions
Conceptualization, methodology, formal analysis, investigation, data curation, visualization, writing—original draft and writing—review and editing, J.S.; visualization and writing—review, R.Y.C.C. All authors have read and agreed to the published version of the manuscript.
Funding
This research was funded by CONCYTEC through the PROCIENCIA program under the framework of the ‘‘E041-2023-01” call, according to contract N° PE501082050-2023-PROCIENCIA.
Data Availability Statement
Data availability is described at the following websites https://registry.opendata.aws/craam-open-vlf/ or contacting savnet@craam.mackenzie.br (accessed on 14 May 2026).
Acknowledgments
The authors thank PROCIENCIA for funding (contract N° PE501082050-2023-PROCIENCIA and the South America VLF Network (SAVNET) for providing the VLF data used in this work. J.S. acknowledges support from the Comisión Nacional de Investigación y Desarrollo Aeroespacial (CONIDA). R.Y.C. Cueva thanks UEMA (PIBIC and More Research program) and INPE for the research infrastructure.
Conflicts of Interest
The authors declare no conflicts of interest.
References
- Wait, J.R.; Spies, K.P. Characteristics of the Earth–Ionosphere Waveguide for VLF Radio Waves; Technical Note 300; National Bureau of Standards: Boulder, CO, USA, 1964.
- Barr, R.; Jones, D.L.; Rodger, C.J. ELF and VLF radio waves. J. Atmos. Sol.-Terr. Phys. 2000, 62, 1689–1718. [Google Scholar] [CrossRef]
- Thomson, N.R. Experimental daytime VLF ionospheric parameters. J. Atmos. Sol.-Terr. Phys. 1993, 55, 173–184. [Google Scholar] [CrossRef]
- Thomson, N.R.; Rodger, C.J.; Clilverd, M.A. Large solar flares and their ionospheric D-region enhancements. J. Geophys. Res. Space Phys. 2005, 110, A06306. [Google Scholar] [CrossRef]
- Raulin, J.; Bertoni, F.C.P.; Gavilán, H.R.; Guevara-Day, W.; Rodriguez, R.; Fernandez, G.; Correia, E.; Kaufmann, P.; Pacini, A.; Stekel, T.R.C.; et al. Solar flare detection sensitivity using the South America VLF Network (SAVNET). J. Geophys. Res. Space Phys. 2010, 115, A07301. [Google Scholar] [CrossRef]
- Thomson, N.R.; Clilverd, M.A.; McRae, W.M. Nighttime ionospheric D region parameters from VLF phase and amplitude. J. Geophys. Res. Space Phys. 2007, 112, A07304. [Google Scholar] [CrossRef]
- Schunk, R.W.; Nagy, A.F. Ionospheres: Physics, Plasma Physics and Chemistry, 2nd ed.; Cambridge University Press: Cambridge UK, 2009. [Google Scholar]
- Inan, U.S.; Bell, T.F.; Rodriguez, J.V. Heating and ionization of the lower ionosphere by lightning. Geophys. Res. Lett. 1991, 18, 705–708. [Google Scholar] [CrossRef]
- NaitAmor, S.; Ghalila, H.; Cohen, M.B. TLEs and early VLF events: Simulating the important impact of transmitter-disturbance-receiver geometry. J. Geophys. Res. Space Phys. 2017, 122, 792–801. [Google Scholar] [CrossRef]
- Kumar, S.; Kumar, A. Lightning induced electron precipitation observed using VLF propagation. J. Geophys. Res. 2013, 118, 6503–6510. [Google Scholar]
- Raulin, J.-P.; Trottet, G.; Giménez de Castro, C.G.; Correia, E.; Macotela, E.L. Nighttime sensitivity of ionospheric VLF measurements to X-ray bursts from a remote cosmic source. J. Geophys. Res. Space Phys. 2014, 119, 4758–4766. [Google Scholar] [CrossRef]
- Marshall, R.A.; Snively, J.B. Very low frequency subionospheric remote sensing of thunderstorm-driven acoustic waves in the lower ionosphere. J. Geophys. Res. Atmos. 2014, 119, 5037–5045. [Google Scholar] [CrossRef]
- Crombie, D.D. Periodic fading of VLF signals received over long paths during sunrise and sunset. J. Res. NBS Radio Sci. 1964, 68D, 27–35. [Google Scholar] [CrossRef]
- Walker, D. Phase steps and amplitude fading of VLF signals at dawn and dusk. J. Res. NBS Radio Sci. 1965, 69D, 1435–1443. [Google Scholar] [CrossRef]
- Samanes, J.E.; Raulin, J.-P.; Macotela, E.L.; Guevara Day, W.R. Estimating the VLF modal interference distance using the South America VLF Network (SAVNET). Radio Sci. 2015, 50, 122–129. [Google Scholar] [CrossRef]
- Clilverd, M.A.; Thomson, N.R.; Rodger, C.J. Sunrise effects on VLF signals propagating over a long north–south path. Radio Sci. 1999, 34, 939–948. [Google Scholar] [CrossRef]
- Somsikov, V.M. Solar terminator and dynamic phenomena in the atmosphere: A review. Geomagn. Aeron. 2011, 51, 707–719. [Google Scholar] [CrossRef]
- Beer, T.O.M. Supersonic generation of atmospheric waves. Nature 1973, 242, 34. [Google Scholar] [CrossRef]
- Afraimovich, E.L. First GPS-TEC evidence for the wave structure excited by the solar terminator. Earth Planets Space 2008, 60, 895–900. [Google Scholar] [CrossRef]
- Sindelarova, T.; Mosna, Z.; Buresova, D.; Chum, J.; McKinnell, L.-A.; Athieno, R. Observations of wave activity in the ionosphere over South Africa in geomagnetically quiet and disturbed periods. Adv. Space Res. 2012, 50, 182–195. [Google Scholar] [CrossRef]
- Galushko, V.G.; Paznukhov, V.V.; Yampolski, Y.M.; Foster, J.C. Incoherent scatter radar observations of AGW/TID events generated by the moving solar terminator. Ann. Geophys. 1998, 16, 821–827. [Google Scholar] [CrossRef]
- Nina, A.; Čadež, V. Detection of acoustic–gravity waves in lower ionosphere by VLF radio waves. Geophys. Res. Lett. 2013, 40, 4803–4807. [Google Scholar] [CrossRef]
- Cheremnykh, O.; Fedorenko, A.; Voitsekhovska, A.; Selivanov, Y.; Ballai, I.; Verth, G.; Fedun, V. Atmospheric waves disturbances from the solar terminator according to the VLF radio stations data. Adv. Space Res. 2023, 72, 4825–4835. [Google Scholar] [CrossRef]
- Raulin, J.P.; Correia de Matos David, P.; Hadano, R.; Saraiva, A.C.; Correia, E.; Kaufmann, P. The South America VLF NETwork (SAVNET). Earth Moon Planets 2009, 104, 247–261. [Google Scholar] [CrossRef]
- Raulin, J.P.; Correia de Matos David, P.; Hadano, R.; Saraiva, A.C.V.; Correia, E.; Kaufmann, P. The south America VLF NETwork (SAVNET): Development, installation status, first results. Geofísica Int. 2009, 48, 253–261. [Google Scholar] [CrossRef]
- Ries, G. Results concerning the sunrise effect of VLF signals propagated over long paths. Radio Sci. 1967, 2, 531–538. [Google Scholar] [CrossRef]
- Huang, N.E.; Shen, Z.; Long, S.R.; Wu, M.C.; Shih, H.H.; Zheng, Q.; Yen, N.-C.; Tung, C.C.; Liu, H.H. The empirical mode decomposition and the Hilbert spectrum for nonlinear and non-stationary time series analysis. Proc. R. Soc. London. Ser. A Math. Phys. Eng. Sci. 1998, 454, 903–995. [Google Scholar] [CrossRef]
- Wu, Z.; Huang, N.E. Ensemble empirical mode decomposition: A noise-assisted data analysis method. Adv. Adapt. Data Anal. 2009, 1, 1–41. [Google Scholar] [CrossRef]
- Torres, M.E.; Colominas, M.A.; Schlotthauer, G.; Flandrin, P. A complete ensemble empirical mode decomposition with adaptive noise. In Proceedings of the 2011 IEEE International Conference on Acoustics, Speech and Signal Processing (ICASSP), Prague, Czech Republic, 22–27 May 2011; IEEE: New York, NY, USA, 2011; pp. 4144–4147. [Google Scholar]
- Rezaie-Balf, M.; Maleki, N.; Kim, S.; Ashrafian, A.; Babaie-Miri, F.; Kim, N.W.; Chung, I.-M.; Alaghmand, S. Forecasting daily solar radiation using CEEMDAN decomposition-based MARS model trained by crow search algorithm. Energies 2019, 12, 1416. [Google Scholar] [CrossRef]
- Ye, Q.; Wang, C.; He, F.; Xue, B.; Zhang, X. The Frequency-Domain Characterization of Cosmic Ray Intensity Variations Before Forbush Decreases Associated With Geomagnetic Storms. Space Weather 2022, 20, e2021SW002863. [Google Scholar]
- Shi, Y.F.; Yang, C.; Wang, J.; Zheng, Y.; Meng, F.Y.; Chernogor, L.F. A hybrid deep learning-based forecasting model for the peak height of ionospheric F2 layer. Space Weather 2023, 21, e2023SW003581. [Google Scholar]
- Shaikh, M.M.; Butt, R.A.; Khawaja, A.; Jarboui, S. Optimized TEC prediction with the CEEMDAN-SE-LSTM framework: Integrating Sample Entropy for reducing processing time. Adv. Space Res. 2025, 76, 7044–7055. [Google Scholar] [CrossRef]
- Torrence, C.; Compo, G.P. A practical guide to wavelet analysis. Bull. Am. Meteorol. Soc. 1998, 79, 61–78. [Google Scholar] [CrossRef]
- Liu, Y.; San Liang, X.; Weisberg, R.H. Rectification of the bias in the wavelet power spectrum. J. Atmos. Ocean. Technol. 2007, 24, 2093–2102. [Google Scholar] [CrossRef]
- Correia, E.; Raunheitte, L.T.M.; Bageston, J.V.; D’Amico, D.E. Characterization of gravity waves in the lower ionosphere using very low frequency observations at Comandante Ferraz Brazilian Antarctic Station. Ann. Geophys. 2020, 38, 385–394. [Google Scholar] [CrossRef]
- Fedorenko, A.K.; Kryuchkov, E.I.; Cheremnykh, O.K.; Voitsekhovska, A.D.; Rapoport, Y.G.; Klymenko, Y.O. Analysis of acoustic-gravity waves in the mesosphere using VLF radio signal measurements. J. Atmos. Sol.-Terr. Phys. 2021, 219, 105649. [Google Scholar] [CrossRef]
- Miyoshi, Y.; Fujiwara, H.; Jin, H.; Shinagawa, H. Solar terminator wave and its relation to the atmospheric tide. J. Geophys. Res. Space Phys. 2009, 114, A07303. [Google Scholar] [CrossRef]
- Gasque, L.C.; Harding, B.J.; Immel, T.J.; Wu, Y.J.; Triplett, C.C.; Vadas, S.L.; Becker, E.; Maute, A. Evening solar terminator waves in Earth’s thermosphere: Neutral wind signatures observed by ICON-MIGHTI. J. Geophys. Res. Space Phys. 2024, 129, e2023JA032274. [Google Scholar] [CrossRef]
Disclaimer/Publisher’s Note: The statements, opinions and data contained in all publications are solely those of the individual author(s) and contributor(s) and not of MDPI and/or the editor(s). MDPI and/or the editor(s) disclaim responsibility for any injury to people or property resulting from any ideas, methods, instructions or products referred to in the content. |
© 2026 by the authors. Licensee MDPI, Basel, Switzerland. This article is an open access article distributed under the terms and conditions of the Creative Commons Attribution (CC BY) license.