


Abstract
China’s pollutant discharge permit system mandates total-quantity emission control for industrial volatile organic compounds (VOCs), yet the actual utilization of permitted capacity remains poorly studied. This study developed an “emission idle rate” (IR = 1 − actual/permitted emissions) framework and applied it to 130 chemical enterprises across three cities in Jiangsu Province using 2020–2024 panel data. The mean idle rate reached 78.1%, with no significant inter-city differences (H = 0.96, p = 0.619), attributable to both production underutilization and systematic over-estimation of emission ceilings inherent in the design-capacity-based permit methodology. Ward hierarchical clustering revealed three emission behavioral patterns, Persistent Surplus (n = 74, IR = 0.95), Declining Surplus (n = 32, IR = 0.69), and Growing Surplus (n = 19, IR = 0.59), exhibiting distinct idle rate levels and temporal trajectories. Cluster differentiation was significantly associated only with production-side emission characteristics, while enterprise economic variables showed no significant effects. The estimated tradeable emission surplus reached 668.3 t/a, though its realization faces transaction cost barriers including the lack of standardized transfer mechanisms and formal VOC trading infrastructure. A quadrant-based strategy matrix integrating idle rate levels with temporal trends is proposed for differentiated permit management.
1. Introduction
Volatile organic compounds (VOCs) are critical precursors of tropospheric ozone (O3) and secondary organic aerosols (SOA), posing substantial risks to air quality, human health, and climate systems [1,2,3]. With widespread sources across most industrial sectors, VOC control has become a core task of China’s ambient air quality management. During the 13th Five-Year Plan period, China officially incorporated VOCs into the total emission control system, and the national pollutant discharge permit system implemented in 2016 has since become the cornerstone of industrial VOC regulation [4,5]. This system shifts environmental management from concentration-based limits to total-quantity constraints, providing a solid institutional basis for market-based instruments such as emissions trading [6,7]. In regions with concentrated chemical manufacturing activity, the sector constitutes a major anthropogenic source of industrial VOCs, potentially amplifying localized emission loads, and is widely recognized as a priority sector for VOC total control [8,9].
As one of China’s most industrialized provinces, Jiangsu supports a dense network of chemical manufacturers, and competition for VOC emission quotas has grown increasingly fierce. A well-known South–North economic divide runs through the province [10]: Changzhou, in the south, reports a GDP per capita roughly double that of Huai’an in the north; the two ends of this gradient also differ markedly in industrial maturity and regulatory infrastructure. Under current policy, total emission caps function as a hard ceiling on new project approvals and industrial expansion. New, renovated, and expanded projects are required to obtain emission capacity through emission reduction replacement or pollutant discharge permit trading. However, a striking structural mismatch exists in practice: regional emission quotas appear scarce in official accounting and restrict project launch, yet numerous chemical enterprises hold permitted emission volumes far exceeding actual emissions, leaving massive quotas idle and untraded. This contradiction reduces the effectiveness of total emission control and restricts the efficient operation of the emissions trading market. Whether these economic disparities translate into systematic differences in permit utilization remains an important empirical question.
Existing studies on industrial VOCs in China have mainly focused on emission inventory development [8,11], source apportionment [12,13], ambient monitoring [14,15,16], and control technologies. However, systematic and quantitative research on permit utilization efficiency and emission idle rates remains limited, especially for the chemical industry. Few studies have quantified the gap between permitted and actual emissions, identified enterprise emission behavioral patterns, or addressed the structural mismatch of emission quotas [17,18]. This knowledge gap hinders regulators from optimizing permit allocation, facilitating cross-enterprise or cross-regional trading, and implementing differentiated control strategies.
To address these gaps, this study established an emission idle rate framework and analyzed 130 chemical enterprises across three economically stratified cities in Jiangsu Province (Changzhou, Taizhou, Huai’an) using 2020–2024 panel data. Specifically, four research objectives were pursued: (1) characterizing the spatiotemporal patterns of VOC idle rates across economic tiers; (2) identifying enterprise-level emission behavioral clusters via hierarchical clustering; (3) quantifying the driving factors of cluster membership; and (4) evaluating the potential for emissions trading and proposing a quadrant-based strategy matrix for differentiated management. This study provides a replicable method for permit utilization assessment and policy-ready insights for precise VOC control and market-oriented quota allocation in the chemical industry.
2. Materials and Methods
2.1. Study Area and Data Sources
This study focused on three cities in Jiangsu Province, China, purposively selected to represent distinct economic development tiers along the province’s South–North gradient (Figure 1). Three criteria guided city selection: the GDP per capita across the chosen cities had to span a sufficiently wide range to represent distinct economic tiers; each city needed no fewer than 30 permitted chemical enterprises; and emission permit records had to be accessible through the provincial information system. Changzhou (GDP per capita > CNY 160,000) sits at the “higher-development” end of this spectrum, with a long-established chemical industrial base. Taizhou falls in the middle (≈CNY 120,000), while Huai’an (≈CNY 90,000) anchors the “lower-development” end. One caveat is worth noting: all three cities share the same province-level environmental regulations for chemical enterprises, so differences in permit utilization may be muted by this uniform regulatory floor. Table 1 summarizes the key characteristics of the three study cities.
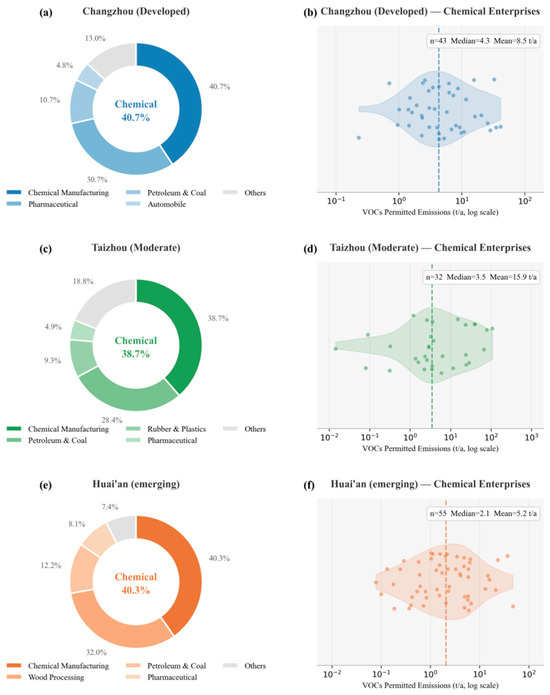
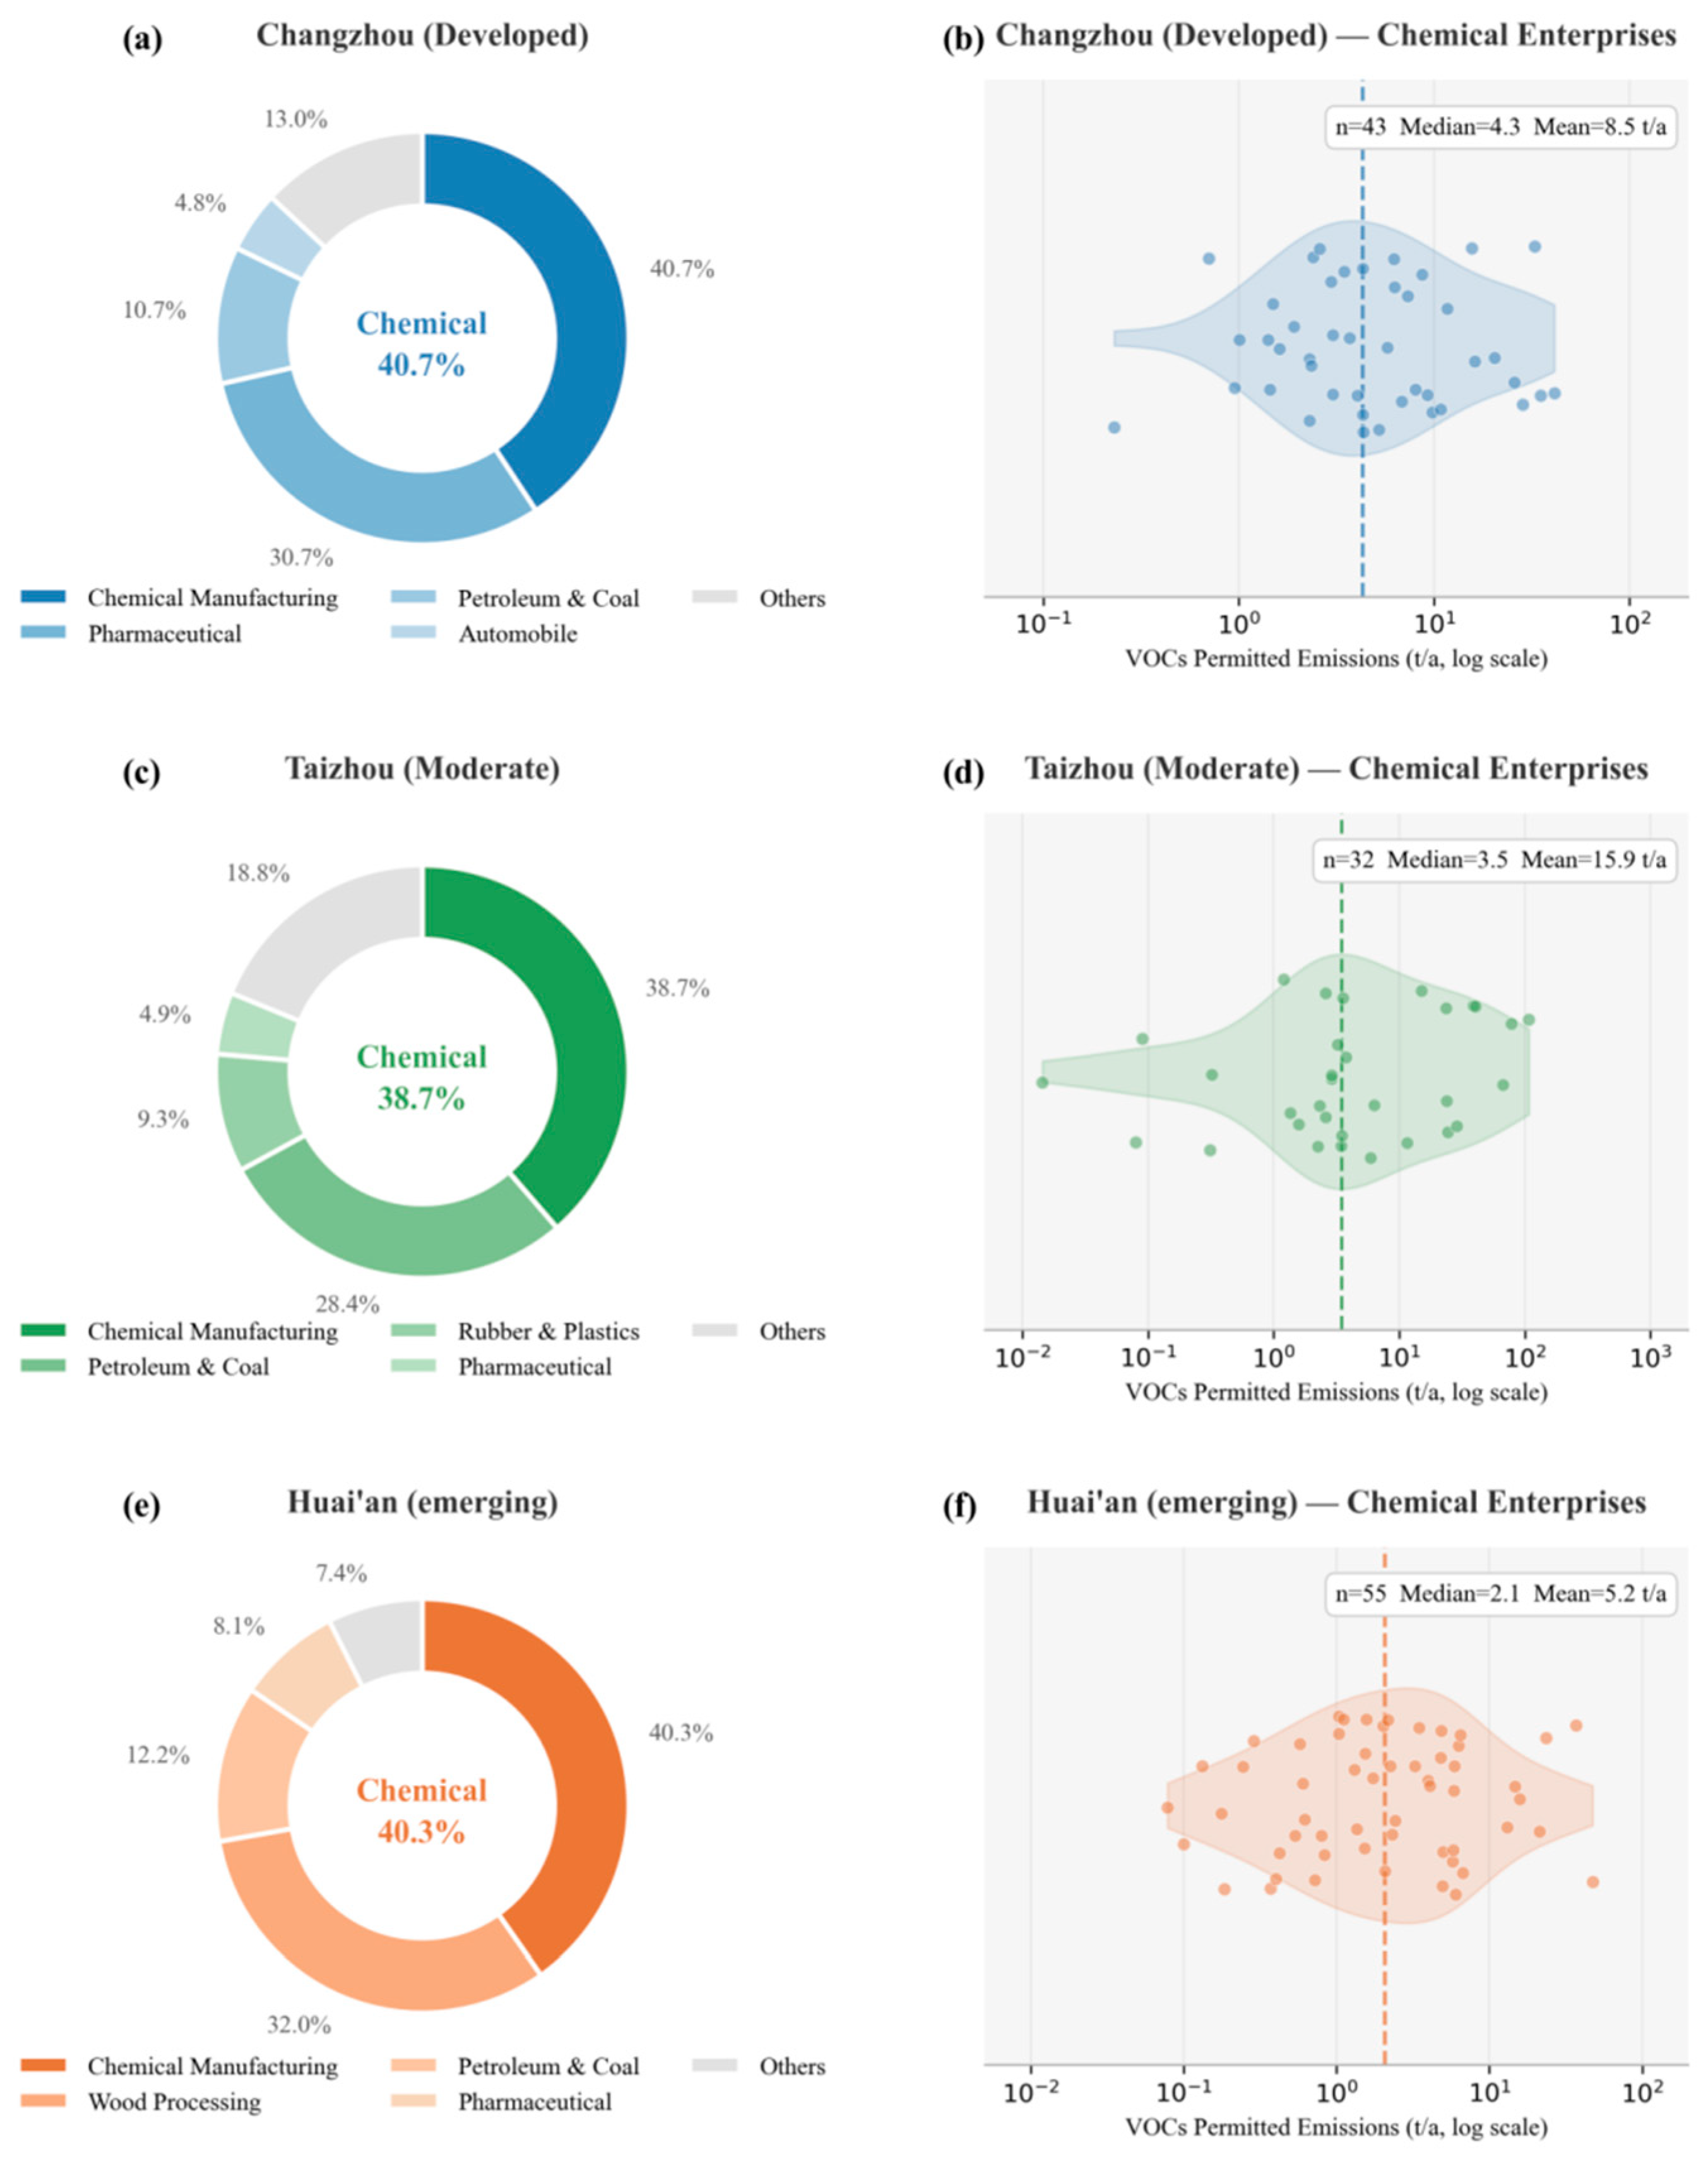
Figure 1.
Industry composition and permit allocation of VOC emissions in three cities. (Left panels): industry composition of VOC permitted emissions; (right panels): distribution of chemical enterprise permit allocations; in Changzhou, Taizhou, and Huai’an (violin plots show kernel density estimates); dots represent individual enterprises, dashed lines indicate medians.
Table 1.
Characteristics of the three study cities.
Data were collected from three primary sources. First, enterprise-level VOC permitted emission volumes and annual actual emission data (2020–2024) were obtained from the Qingyue Open Environmental Data Platform (https://data.epmap.org), which aggregates publicly disclosed pollutant discharge permit information across Jiangsu Province. Second, basic enterprise registration information, including the number of employees, was retrieved from the National Enterprise Credit Information Publicity System (https://www.gsxt.gov.cn). Third, operational indicators such as annual revenue and annual profit were compiled through field investigations, environmental impact assessment reports, and pollutant discharge permit application materials. For small and micro enterprises that did not publicly disclose operational data, accounting for approximately 10% of the sampled enterprises, base-year economic data were obtained through direct inquiries with the enterprises, and figures for the remaining years were estimated using industry-average growth rates from municipal statistical yearbooks. Only enterprises whose emission records spanned the full five years (2020–2024) were retained. After this filter, 243 VOC-emitting enterprises remained, distributed across 17 industry categories. The chemical raw materials and products sector (GB/T 4754-2017, Code C26) dominated the sample [19]—130 enterprises, or 53.5% of the total. The variables assembled for each enterprise were: permitted emission volume (Ep, t/a), annual actual emission volumes (Ea, t/a, for 2020–2024), enterprise scale (large/medium/small), annual revenue (CNY 10,000), annual profit (CNY 10,000), profit rate (%), number of employees, and year of establishment.
2.2. Emission Idle Rate Framework
The emission idle rate (IR) is defined as the proportion of permitted emission capacity that remains unused in a given year:
where IRt is the idle rate in year t, Ea,t is the actual emission volume in year t, and Ep is the permitted emission volume. An idle rate of 1.0 indicates zero actual emissions (complete idle), while 0 indicates full utilization of the permit. Values below 0 indicate over-emission, and such enterprises (n = 5 in this dataset) are excluded from subsequent clustering and trading analyses. It should be noted that the idle rate captures the aggregate gap between permitted and actual emissions without distinguishing its underlying sources. These may include: (1) over-allocation of permits relative to maximum feasible production, (2) normal production underutilization due to market conditions, and (3) successful emission reductions through cleaner technologies. Decomposing these contributions would require enterprise-level production capacity data, which were not available for this study (see Section 4.4).
To capture the central tendency of each enterprise’s emission behavior, the average idle rate across the five-year study period was computed:
An ordinary least squares (OLS) line was also fitted to year to obtain a temporal trend slope. Negative slopes correspond to shrinking idle capacity (i.e., permits being used up faster); positive slopes indicate the opposite direction.
2.3. Statistical Methods
Because idle rate distributions were non-normal (Shapiro–Wilk, p < 0.05 in all cities), inter-city differences were compared using the Kruskal–Wallis H test [20], followed by pairwise Mann–Whitney U tests with Bonferroni correction. Rank-biserial correlation coefficients (r) were reported as effect sizes.
To identify distinct emission behavioral patterns, Ward’s minimum variance hierarchical clustering [21] was applied to the standardized five-year idle rate profiles of 125 chemical enterprises. Five over-emitting enterprises with IRavg ≤ 0 (i.e., actual emissions exceeding permitted levels) were excluded; these were distributed across Changzhou (n = 1), Taizhou (n = 2), and Huai’an (n = 2), with over-emission ratios (mean actual/permitted) ranging from 1.00 to 1.98, likely reflecting reporting discrepancies or permit non-compliance rather than typical permit utilization behavior. Standardization was performed using z-score transformation to ensure equal weighting across years. The optimal number of clusters was determined by comparing candidate solutions (k = 2 through 5) using three internal validity indices—Silhouette coefficient [22], Calinski–Harabasz index, and Davies–Bouldin index—with full results reported in Section 3.3.
Cluster–city association was tested with Pearson’s chi-square statistic; Cramér’s V quantified the strength of this association. For the driver analysis, Kruskal–Wallis tests were conducted on eight candidate variables, and the H statistic was converted to eta-squared (η2) to express the share of variance attributable to cluster membership. Where the omnibus test was significant, Mann–Whitney U post hoc comparisons (Bonferroni-corrected) pinpointed which cluster pairs differed.
All analyses were carried out in Python 3.10. The main packages were scipy.stats for hypothesis tests, scipy.cluster.hierarchy for Ward linkage, sklearn.decomposition and sklearn.metrics for PCA and cluster validation, and matplotlib for figures. A significance threshold of α = 0.05 was adopted throughout.
2.4. Emissions Trading Potential Assessment
Following the principles of cap-and-trade systems [23,24], where emission permits are allocated and surplus capacity can be traded among regulated entities, the tradeable VOC capacity was estimated for enterprises with substantial surplus capacity (IRavg > 0.5). The tradeable quantity for each eligible enterprise was calculated as:
where Ēa is the five-year mean actual emission and the 0.7 discount factor provides a conservative safety margin accounting for production variability and potential future emission increases. This discount rate is consistent with the 70–80% release coefficients adopted in China’s provincial emission trading pilot programs, such as those in Jiangsu and Zhejiang provinces [25,26]. To assess the sensitivity of results to this parameter, tradeable capacities were additionally computed under discount factors of 0.5, 0.6, 0.8, and 0.9 (see Section 3.5). It should be noted that VOC emissions present greater measurement uncertainty than SO2 or NOx due to fugitive emission sources and the diversity of VOC species, which may justify a more conservative discount factor (closer to 0.5) in practice.
2.5. Strategy Matrix
A two-dimensional strategy matrix was developed by cross-classifying enterprises based on their average idle rate (IRavg) and temporal trend slope. The median idle rate served as the horizontal cut-off and zero slope as the vertical one (IRavg = 0.903; slope = 0), producing four quadrants: A—high idle rate but trending downward; B—high idle rate, stable or rising; C—low idle rate, trending downward; D—low idle rate, stable or rising. Each quadrant calls for a different management response. These thresholds are data-driven rather than theoretically motivated; the robustness of quadrant assignments to alternative threshold choices (e.g., mean instead of median, or ±0.01/yr slope band instead of zero) should be considered when interpreting the results.
3. Results
3.1. Industry Composition and VOC Permit Structure
Figure 1 presents the distribution of VOC permitted emissions (left panels) and the allocation of chemical enterprise permits (right panels) across the three cities. In all three cities, the manufacturing of chemical raw materials and products emerged as the predominant source of VOC permit allocations, comprising 40.7% (366.6 t/a) in Changzhou, 40.3% (288.1 t/a) in Huai’an, and 38.7% (508.4 t/a) in Taizhou. The sector contributing the second-largest share varied by city: pharmaceutical manufacturing accounted for 30.7% in Changzhou, wood processing contributed 32.0% in Huai’an, and petroleum/coal processing represented 28.4% in Taizhou.
Within the chemical sector (n = 130), the distribution of permitted emission volumes exhibited a pronounced right skew across all three cities, with median values considerably lower than the means (see Table 1). Changzhou demonstrated the most compact distribution, with a mean of 8.52 t/a, a median of 4.32 t/a, and a coefficient of variation (CV) of 1.18. In contrast, Taizhou displayed the greatest variability, with a mean of 15.89 t/a, a median of 3.47 t/a, a maximum of 107.81 t/a, and a CV of 1.61, indicative of the presence of large chemical industrial parks. Huai’an occupied an intermediate position, with a mean of 5.24 t/a, a median of 2.08 t/a, and a CV of 1.69.
3.2. City-Level Idle Rate Patterns
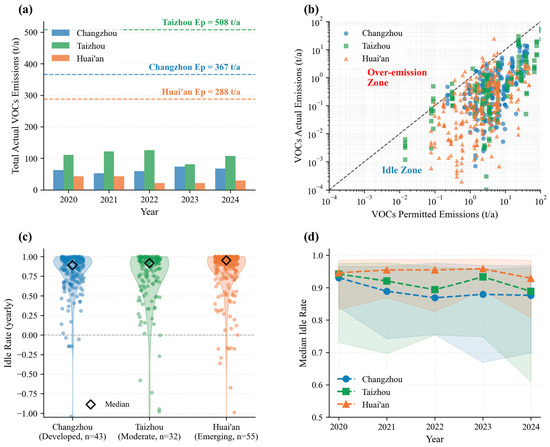
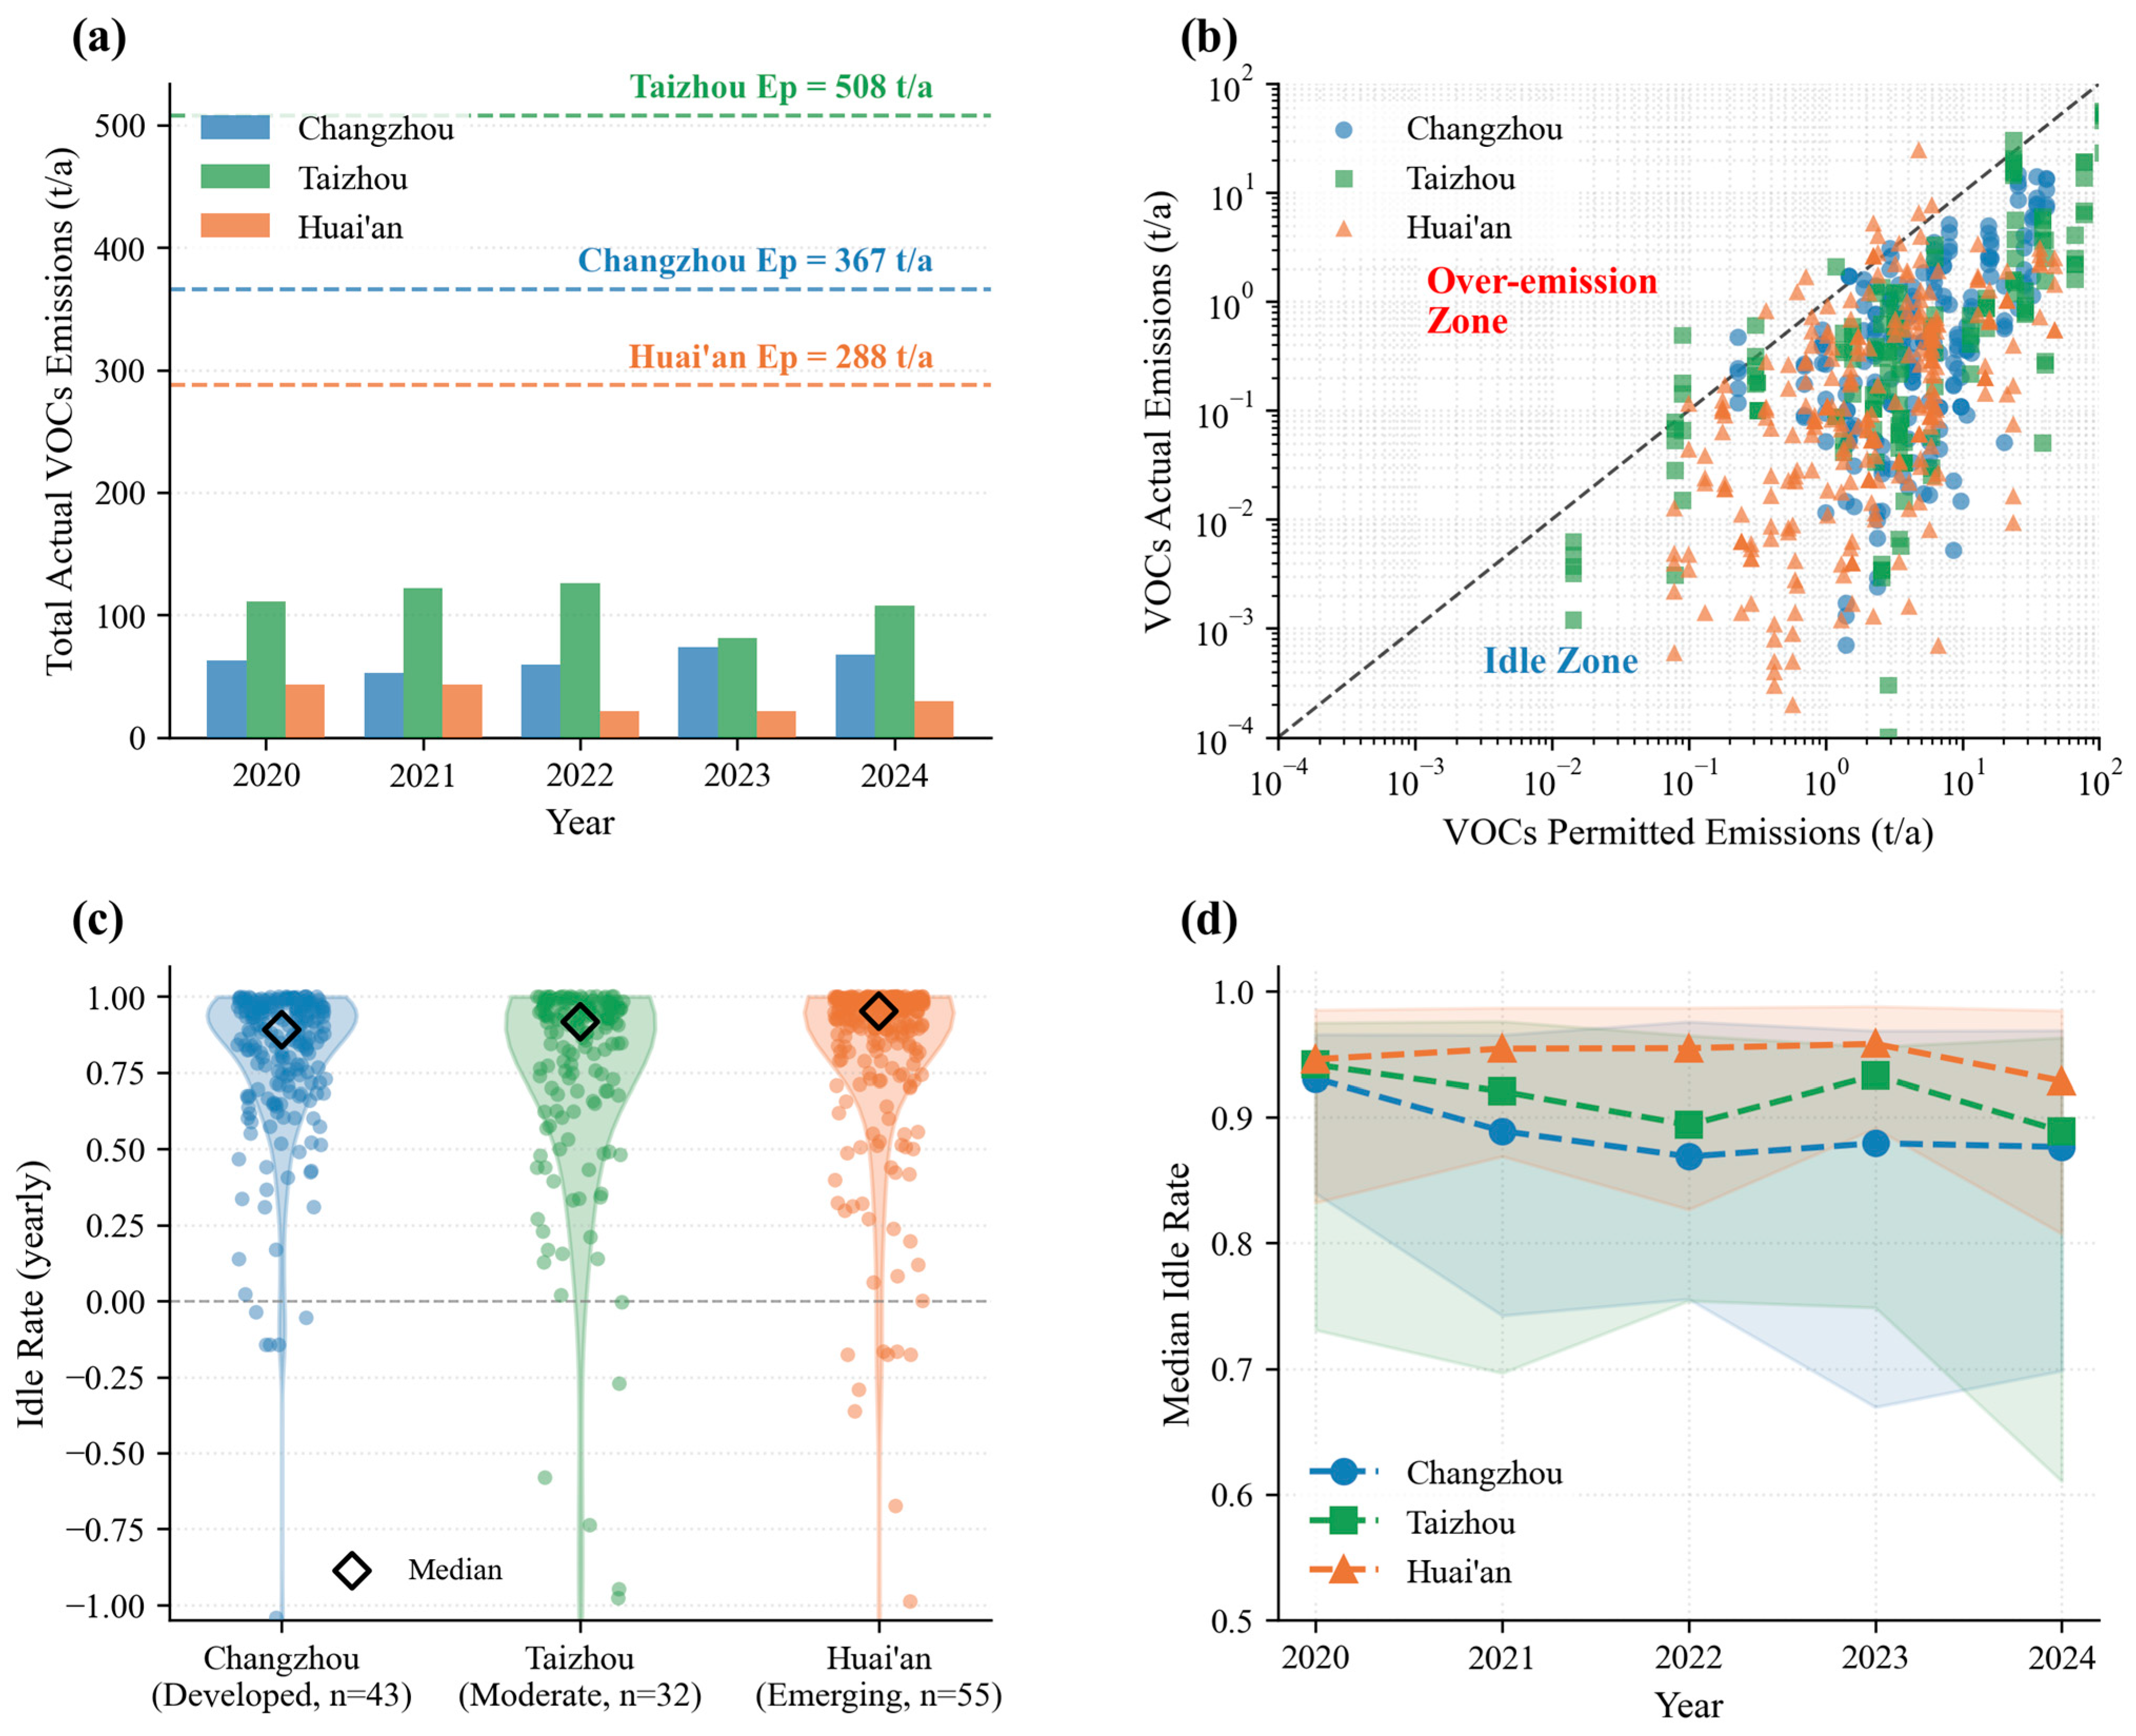
Figure 2a presents actual VOC emissions compared to permitted caps for each city. Although emission levels varied—Changzhou had the largest surplus due to higher industrial density—most enterprises in all three cities emitted well below their limits. As illustrated in Figure 2b, 95.8% of enterprise-year observations (623 of 650) fell below the 1:1 line, with similar proportions in Changzhou (97.2%), Taizhou (95.6%), and Huai’an (94.9%), confirming systemic over-allocation across cities.
Figure 2.
VOC emission characteristics and idle rate distribution across three cities. (a) Actual VOC emissions and permitted emission caps by city; (b) Log-scale scatter of permitted vs. actual emissions (the dashed diagonal line indicates the 1:1 reference line, where actual emissions equal permitted emissions); (c) Violin plots of idle rate distribution with Kruskal–Wallis test (violin bodies show kernel density estimates, dots represent individual enterprises); (d) Median idle rate trends by city, 2020–2024 (shaded bands indicate IQR).
The average idle rate for the 130 chemical enterprises was 78.1% (SD = 0.295), with no significant differences among cities (Kruskal–Wallis H = 0.96, p = 0.619). City-level medians were consistently higher than means—Changzhou 0.884 (mean = 0.803), Huai’an 0.920 (mean = 0.795), Taizhou 0.850 (mean = 0.729)—reflecting the right-skewed distribution noted in Section 3.1. No significant pairwise differences were found (all padj > 0.05).
Temporal analysis revealed varied trends among cities (Figure 2d). Changzhou’s idle rate declined from 0.828 in 2020 to 0.782 in 2024. Taizhou’s idle rate increased from 0.750 in 2020 to 0.800 in 2022, then sharply dropped to 0.632 in 2024, likely due to recent capacity expansion. Huai’an peaked at 0.871 in 2023 before falling to 0.774 in 2024. Despite these differences, the similar mean idle rates suggest that permit utilization is more closely linked to enterprise production characteristics than to regional economic factors.
3.3. Emission Behavioral Clustering
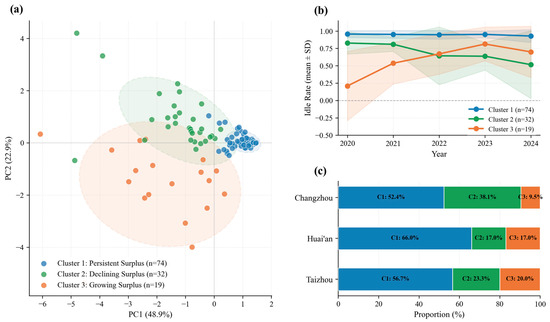
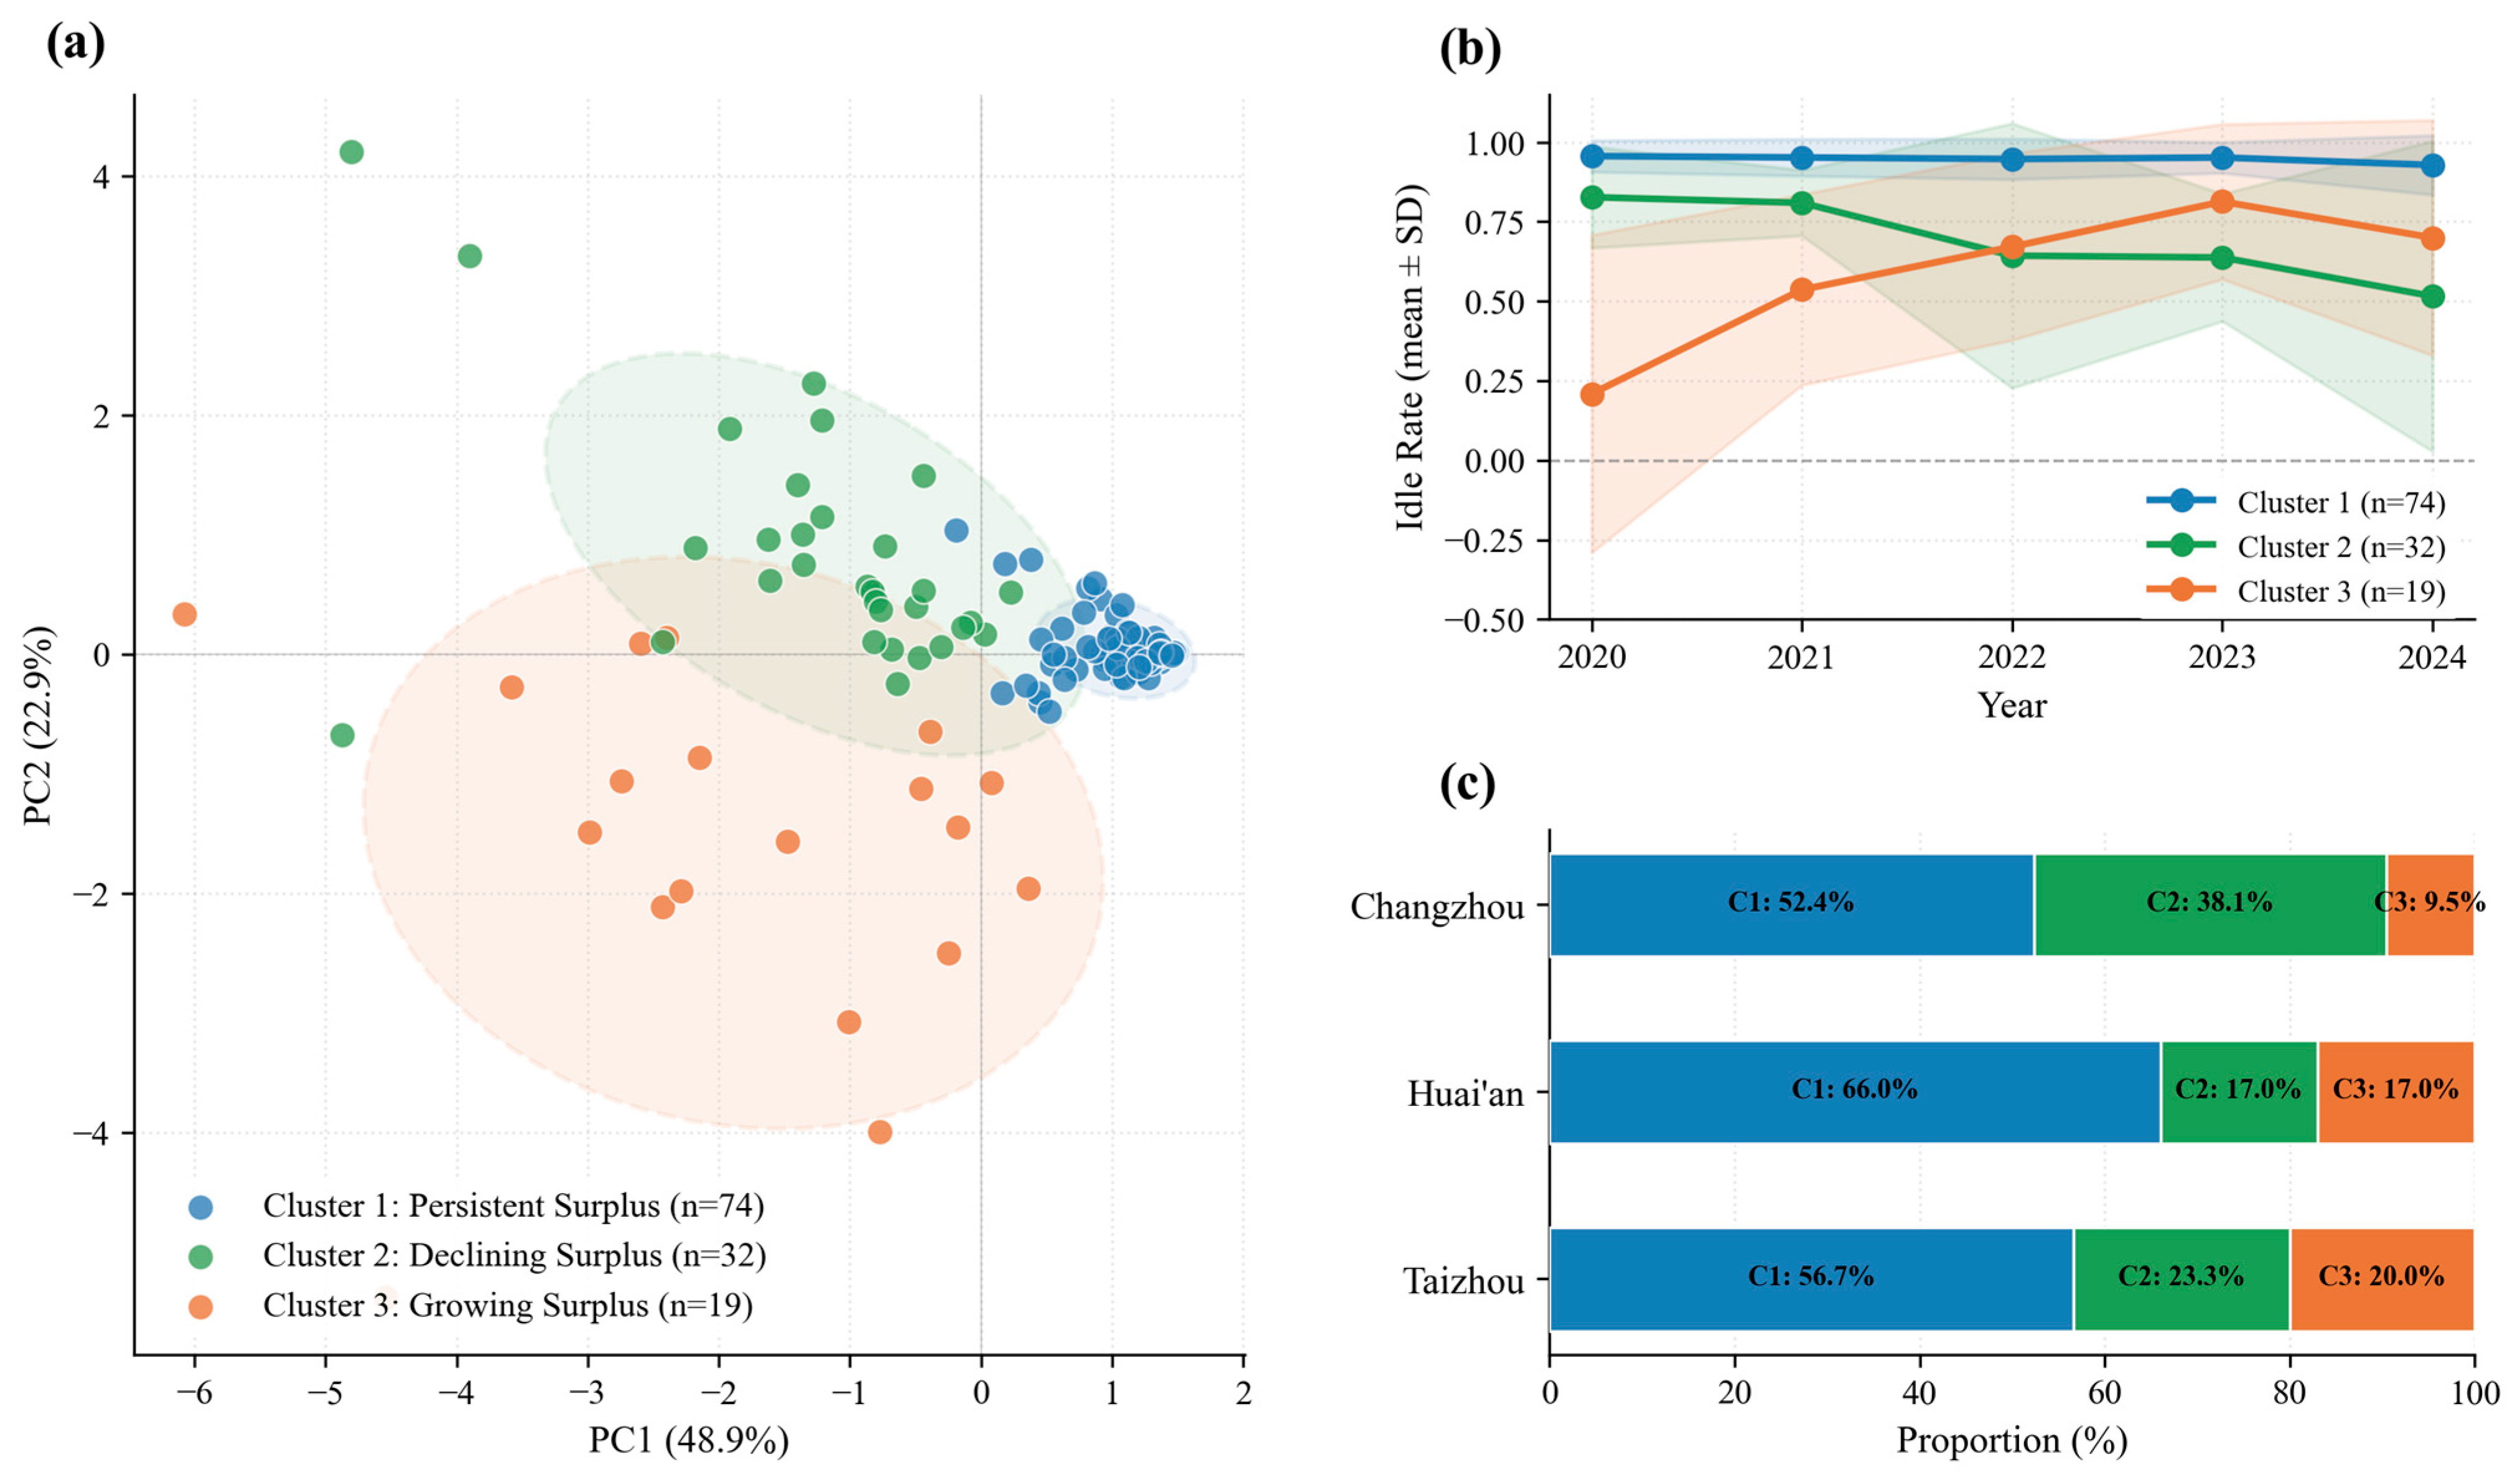
Ward hierarchical clustering on standardized five-year idle rate profiles identified three distinct clusters. Specifically, the input features for clustering were the five annual idle rate values (IR2020, IR2021, IR2022, IR2023, IR2024) of each enterprise, standardized via z-score transformation. Solutions with k ≥ 4 were discarded because they produced clusters with fewer than 15 enterprises, compromising statistical reliability. The k = 3 solution was selected for its higher Silhouette coefficient (0.456) compared to k = 2 (0.440), resulting in cluster sizes of 74, 32, and 19 enterprises. Full results for k = 2–5 and validity indices are reported in Supplementary Table S1; the corresponding dendrogram is shown in Figure S1. PCA projection (Figure 3a) showed clear separation among clusters, with the first two components explaining 71.8% of variance. Detailed statistics are provided in Supplementary Table S2.
Figure 3.
Emission behavioral clustering of 125 chemical enterprises. (a) PCA scatter plot with 75% confidence ellipses by cluster (shaded areas). (b) Temporal idle rate trends by cluster ((mean ± SD; dashed line indicates the zero-change reference; shaded areas represent ±1 SD)). (c) Cluster composition by city with chi-square test result.
Most enterprises (74, 59.2%) were classified in Cluster 1 (“Persistent Surplus”), with consistently high idle rates averaging 0.947 and minimal change over time (slope = −0.006/yr). Between 2020 and 2024, these enterprises utilized less than 6% of their permitted capacity, indicating a structural mismatch between permits and actual production. In contrast, Cluster 2 (“Declining Surplus,” 32, 25.6%) showed a steady decrease in idle rates from 0.827 in 2020 to 0.515 in 2024 (slope = −0.080/yr), as emissions increased relative to permitted levels. This shift may reflect production growth or reduced emission control efficiency, warranting further investigation. Cluster 3 (“Growing Surplus,” n = 19, 15.2%) exhibited the opposite trajectory: these enterprises started near their permit limits in 2020 (idle rate = 0.209) but showed substantial emission reductions, raising idle rates to 0.699 by 2024 (slope = +0.126/yr). This widening gap between permitted and actual emissions, termed “diverging surplus,” may be attributable to downsizing, process modifications, or the adoption of cleaner technologies, although distinguishing among these causes would require detailed enterprise-level data beyond the scope of this study.
The chi-square test for cluster–city association was not statistically significant (χ2 = 6.40, df = 4, p = 0.171, Cramér’s V = 0.16), indicating that cluster membership was not strongly determined by geographic location (Figure 3c). However, compositional differences were notable: Huai’an had the highest proportion of enterprises in Cluster 1 (66.0%), while Changzhou had the lowest (52.4%). Changzhou contributed the largest share of Cluster 2 enterprises (50.0%), while Cluster 3 enterprises were distributed relatively evenly across cities.
3.4. Drivers of Emission Behavior
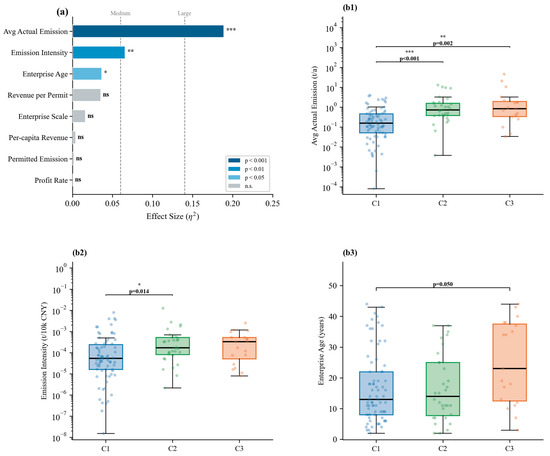
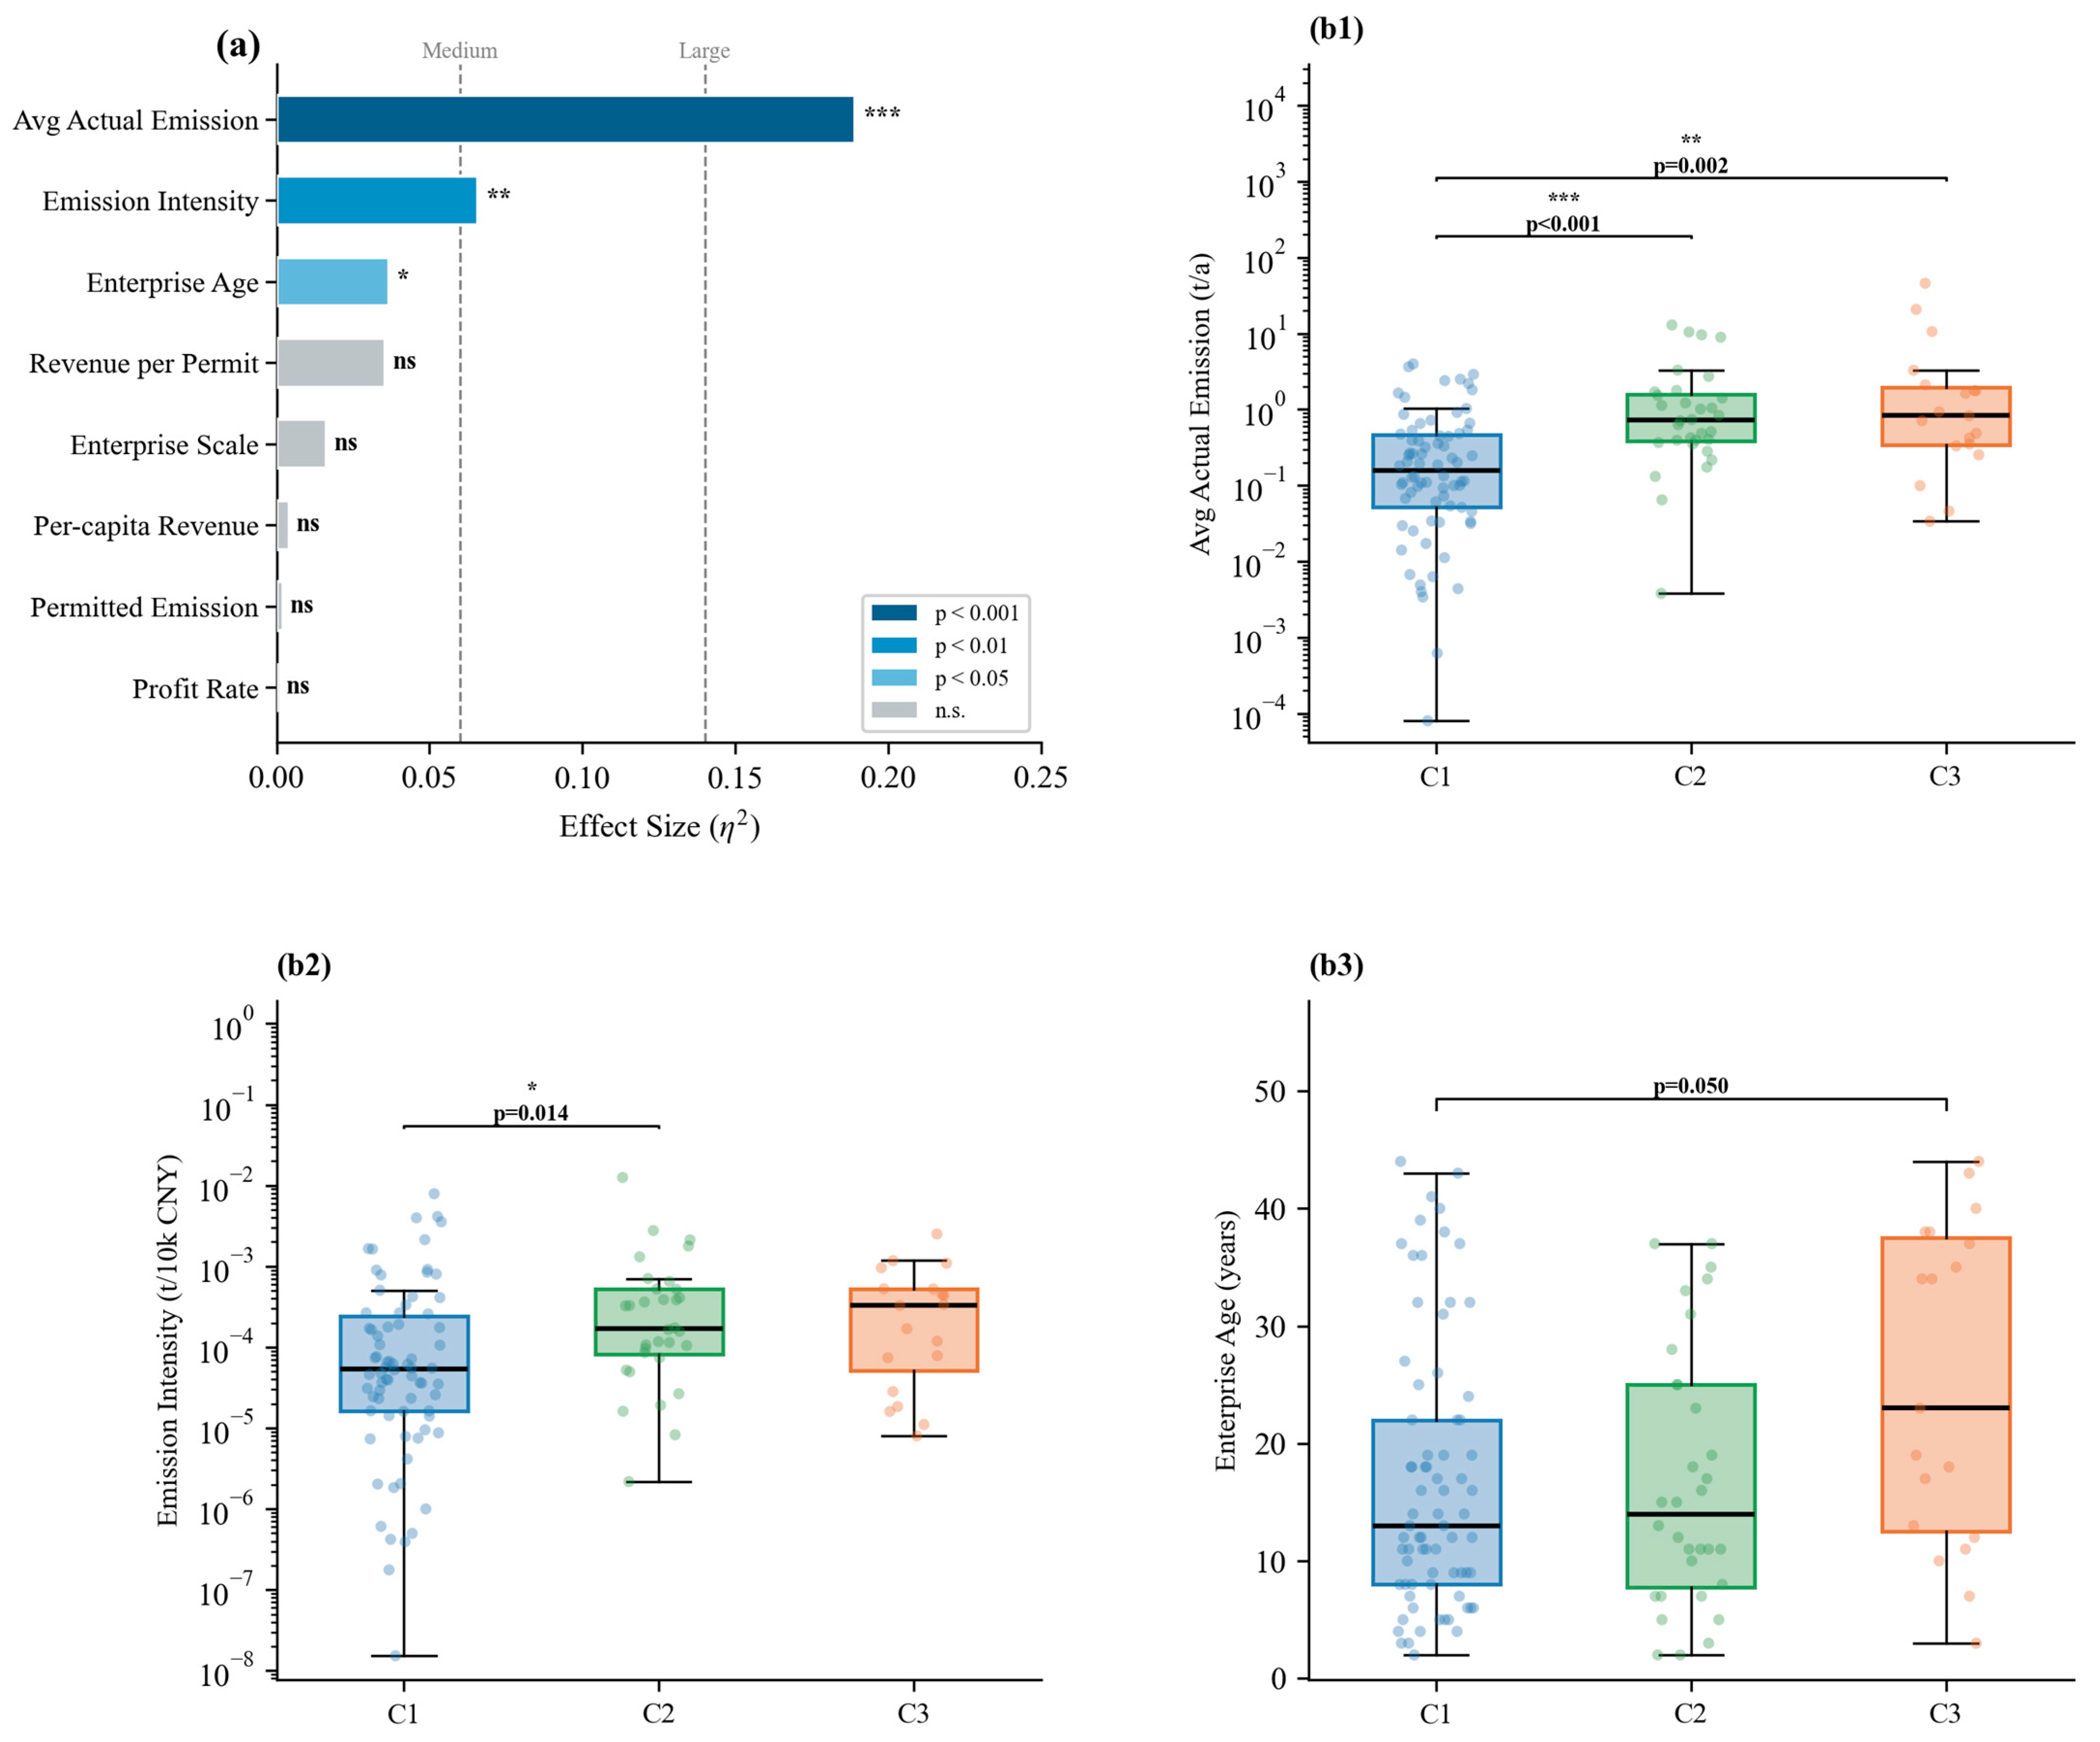
To identify the factors underlying cluster differentiation, Kruskal–Wallis H tests with eta-squared (η2) effect sizes were conducted for eight candidate variables spanning emission behavior and economic characteristics (Figure 4a). Actual emission volume (Ea) was the strongest predictor of cluster membership (η2 = 0.189, H = 25.09, p < 0.001), constituting a large effect. Emission intensity (Ea/output value) showed a medium effect (η2 = 0.066, H = 10.03, p = 0.007), and enterprise age exhibited a small but significant effect (η2 = 0.037, H = 6.47, p = 0.039). The remaining five variables—permitted emission volume, per capita revenue, revenue per permit unit, profit rate, and enterprise scale—were all non-significant (p > 0.05), indicating that cluster differentiation was driven by emission behavior rather than enterprise economic characteristics. Full effect sizes and significance levels are reported in Supplementary Table S3.
Figure 4.
Drivers of emission behavioral clustering. (a) Kruskal–Wallis effect sizes (η2) for candidate variables; dashed lines indicate medium (0.06) and large (0.14) effect thresholds. (b1–b3) Boxplots of the three significant variables across clusters, with Bonferroni-corrected post hoc comparisons. Significance levels: * p < 0.05, ** p < 0.01, *** p < 0.001; ns, not significant.
Post hoc pairwise Mann–Whitney U tests with Bonferroni correction identified specific inter-cluster differences (Figure 4b). Cluster 1 (Persistent Surplus) showed significantly lower actual emission volumes compared to Cluster 2 (Declining Surplus; padj < 0.001) and Cluster 3 (Growing Surplus; padj = 0.002), with no significant difference between Clusters 2 and 3. Similarly, for emission intensity, Cluster 1 was significantly lower than Cluster 2 (padj = 0.014). Although the omnibus test for enterprise age was significant, no pairwise comparison reached significance after correction (all padj > 0.05), indicating a diffuse group-level difference rather than discrete cluster separation. Overall, the Persistent Surplus cluster was primarily characterized by substantially lower actual emissions and emission intensity compared to the dynamic clusters, while Clusters 2 and 3 exhibited similar emission levels but divergent temporal trends. Importantly, no economic variables—enterprise scale, profit rate, per capita revenue, and permitted emission volume—were significant predictors, reinforcing that idle rate patterns are shaped by production-side emission behavior rather than firm-level economic attributes.
3.5. Emissions Trading Potential
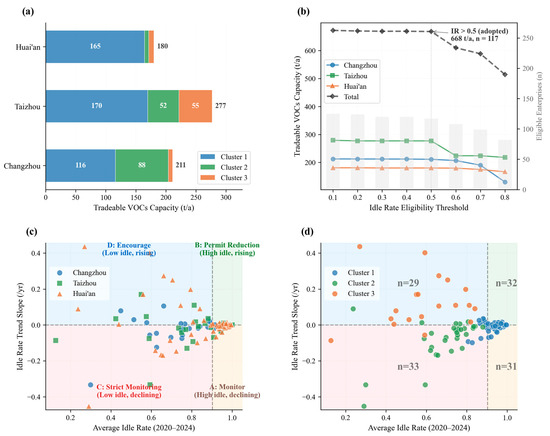
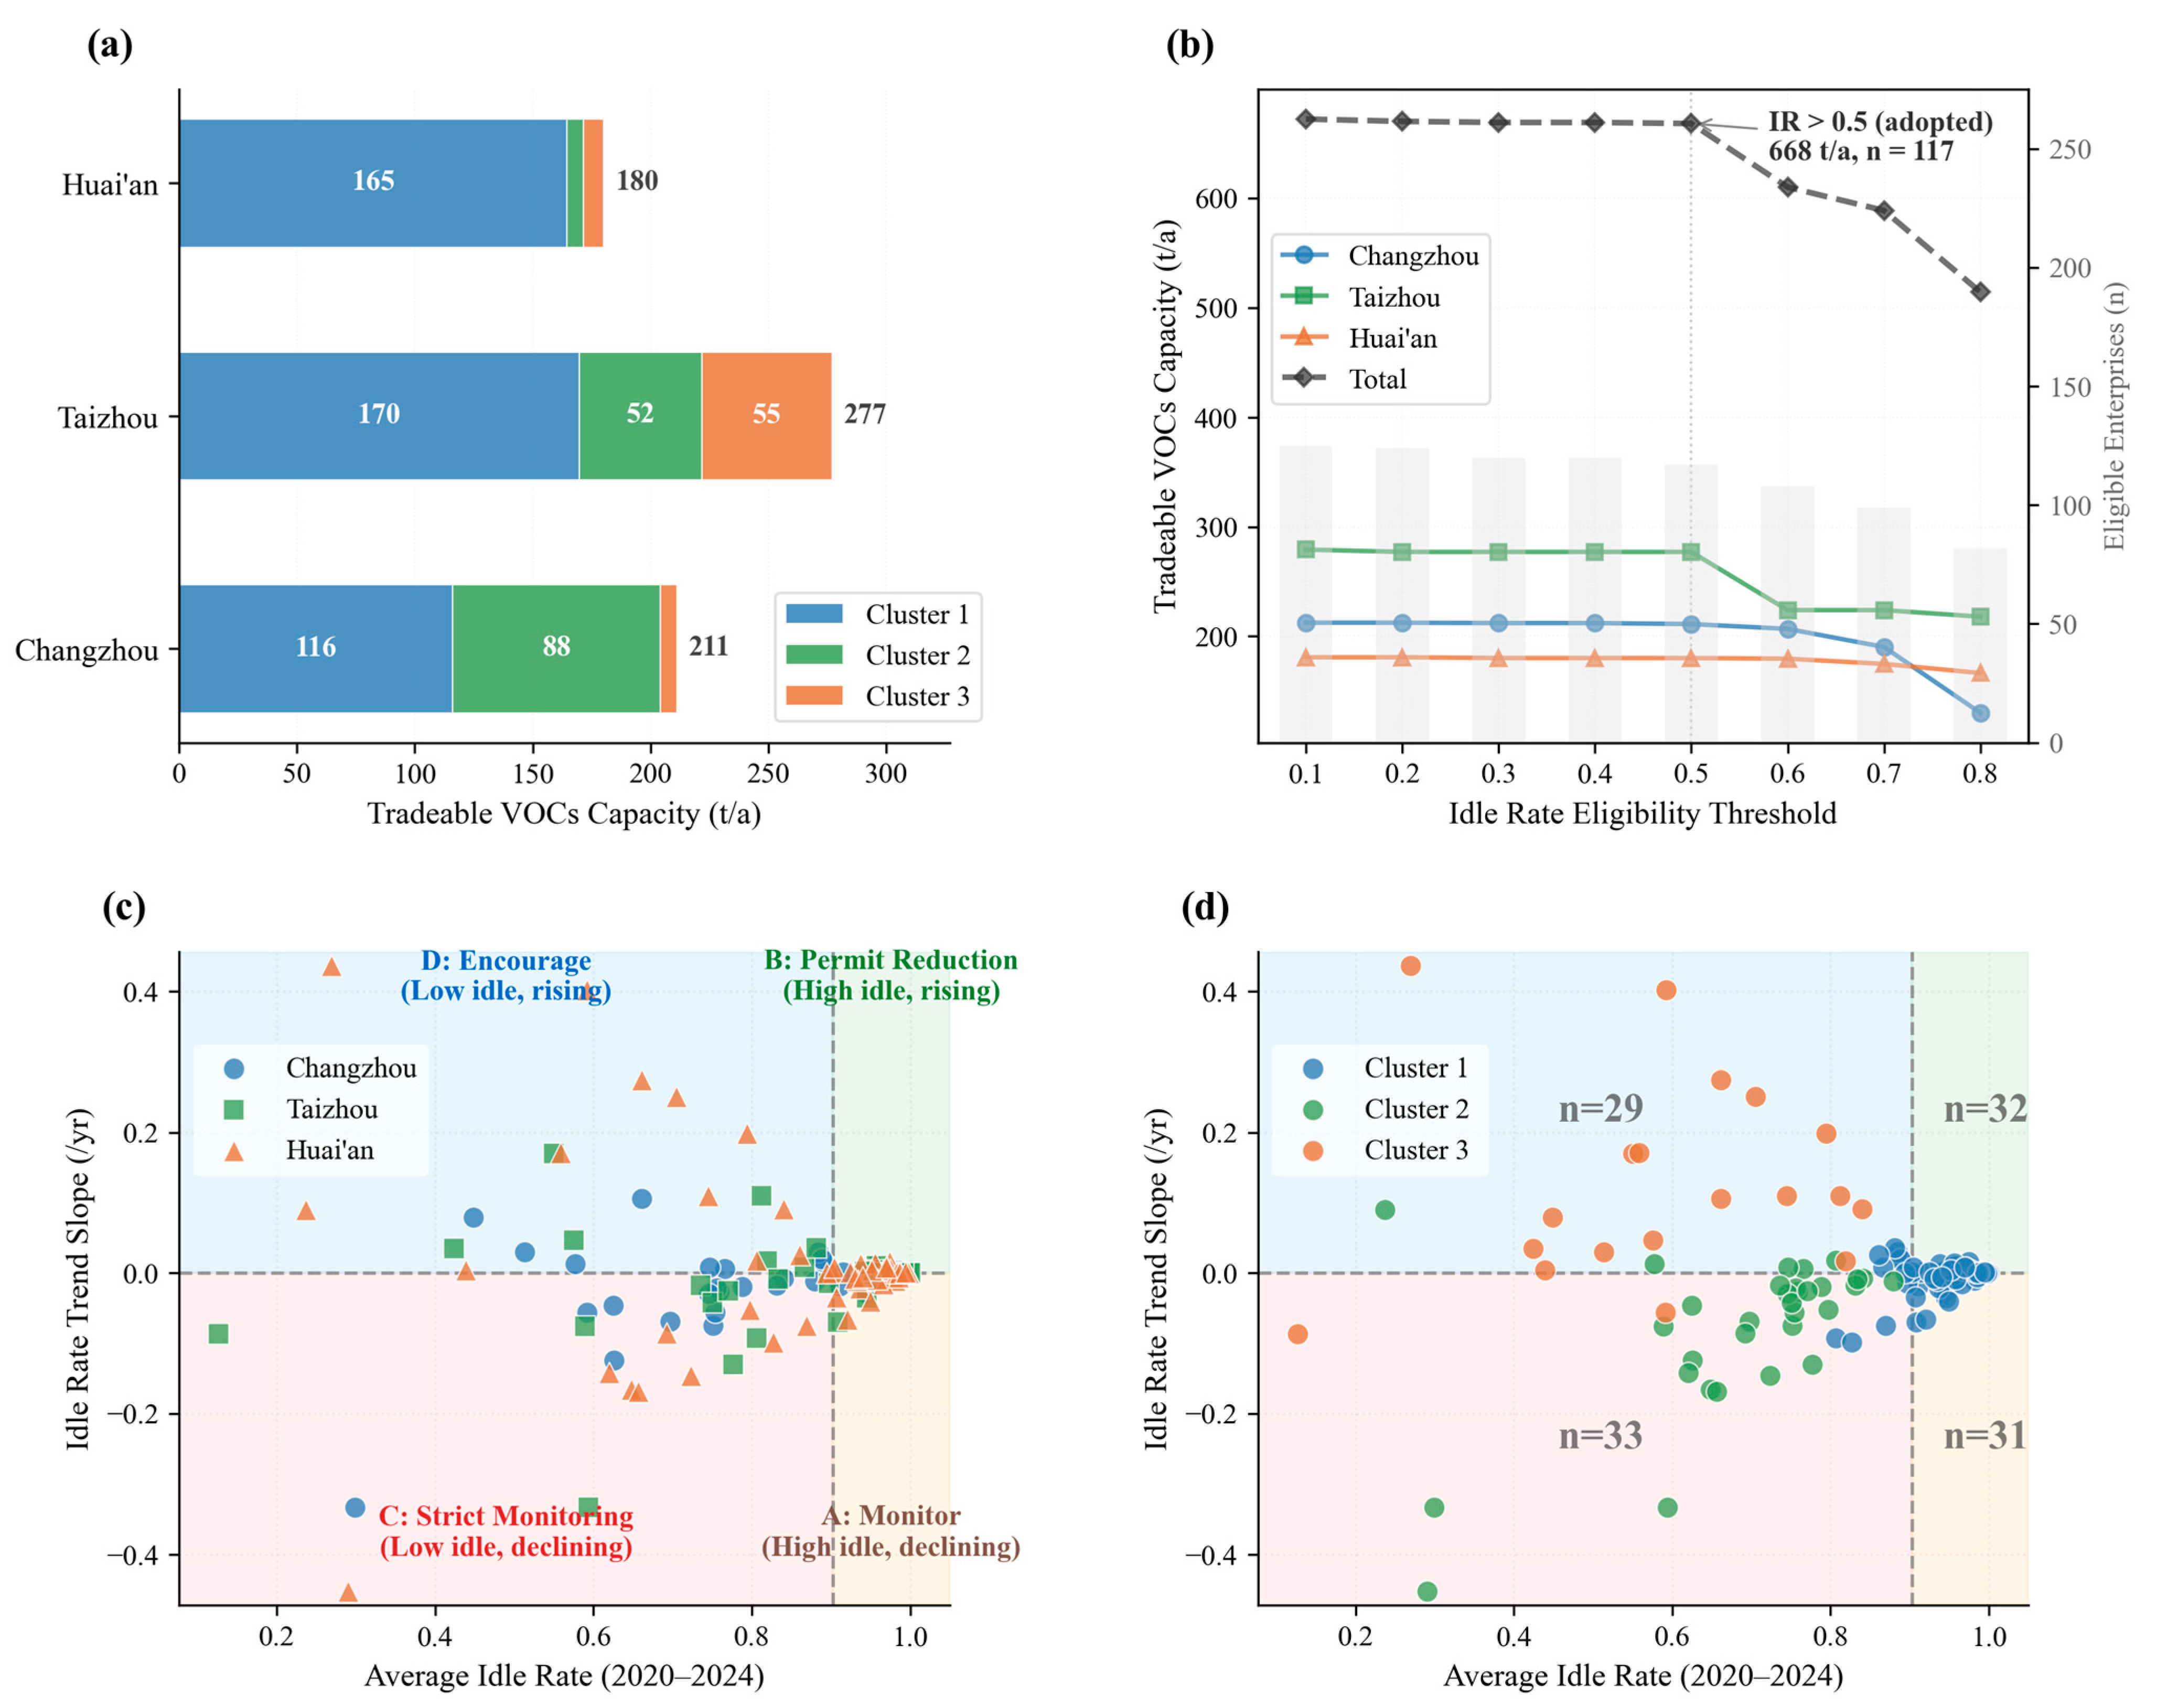
Among the 125 chemical enterprises that did not exceed emission limits, 117 (93.6%) exhibited average idle rates exceeding 0.5, thereby qualifying them as potential sellers within the proposed emissions trading framework. The total tradeable VOC capacity was estimated at 668.3 t/a (discount factor = 0.7). By city, Taizhou contributed 277.1 t/a (41.5%), Changzhou 211.2 t/a (31.6%), and Huai’an 180.1 t/a (26.9%). By cluster, Cluster 1 accounted for 450.5 t/a (67.4%), Cluster 2 for 147.2 t/a (22.0%), and Cluster 3 for 70.6 t/a (10.6%). City-level breakdowns of eligible enterprises and tradeable capacity are provided in Supplementary Table S4.
A sensitivity analysis was performed on both the idle rate eligibility threshold and the discount factor (Figure 5b). Raising the idle rate threshold from >0.3 to >0.9 reduced eligible enterprises from 120 to 63 and decreased total tradeable capacity from 669.3 to 377.5 t/a. This reduction was not uniform across cities: Changzhou’s capacity decreased from 212.1 to 93.7 t/a, Huai’an’s from 180.1 to 155.7 t/a, and Taizhou’s from 277.1 to 128.1 t/a. Altering the discount factor from 0.5 to 0.9 at the IR > 0.5 threshold produced total tradeable capacities ranging from 477.4 to 859.3 t/a.
Figure 5.
Strategy matrix and emissions trading potential. (a) Tradeable VOC capacity by city and cluster (η = 0.7); (b) Sensitivity of tradeable capacity to idle rate eligibility threshold; (c) Enterprises classified by average idle rate and temporal trend slope, colored by city; (d) Same matrix colored by cluster membership.
The quadrant-based strategy matrix categorized the 125 non-over-emitting chemical enterprises into four management groups based on idle rate (IR) and trend slope. Quadrant B (32 enterprises, mean IR = 0.964, slope = +0.005/yr) exhibited stable surpluses, making these enterprises ideal candidates for permit reduction or emissions trading. Quadrant A (31 enterprises, mean IR = 0.956, slope = −0.014/yr) showed declining surpluses that warrant closer monitoring. Quadrant C (33 enterprises, mean IR = 0.695, slope = −0.094/yr) represented the highest-risk group, with idle rates approaching permit ceilings. Quadrant D (29 enterprises, mean IR = 0.680, slope = +0.097/yr) displayed rising idle rates, suggesting ongoing emission reduction or production restructuring.
4. Discussion
4.1. Systematic Permit–Production Decoupling
The finding that 78.1% of permitted VOC capacity remained unused across 130 chemical enterprises reflects two reinforcing factors: production underutilization and systematic over-allocation in the permit methodology. On the production side, chemical enterprises routinely operate below their design capacity due to market fluctuations, seasonal scheduling, and capacity restructuring, leaving a portion of permitted emissions unused even under normal conditions. On the permit side, China’s discharge permit system calculates allowable emissions from design production capacity and standardized emission factors [27], rather than from verified operational data, structurally inflating the emission ceiling by assuming maximum production at all times. Furthermore, enterprises—aware that exceeding permitted levels triggers regulatory penalties—have strong incentives to report maximum possible emission scenarios during permit application to secure a compliance buffer, while regulators lack the means to verify actual utilization in real time [18,28]. These two mechanisms jointly produced the observed idle rates.
According to the National Bureau of Statistics of China, the capacity utilization rate for the chemical manufacturing industry fluctuated between approximately 74% and 78% during 2019–2024. Given that permitted emissions are calculated proportionally to design capacity, production underutilization at this level would account for an idle rate of approximately 22–26%, broadly consistent with Yang and Wang [29], who estimated that capacity gaps account for 20–40% of permit idling. The observed mean idle rate of 78.1% substantially exceeds this upper bound. Although national-level utilization rates may not precisely represent the sampled enterprises, the magnitude of the gap suggests that production underutilization alone cannot account for the majority of unused permit capacity. The design-capacity-based permit methodology is likely the larger contributor to the observed idle rates. Improved pollution control may also contribute to idle capacity in individual cases; however, 59.2% of enterprises (Cluster 1) maintained near-constant idle rates over five years (slope = −0.006/yr), suggesting that abatement improvements are not the dominant factor behind the systematic pattern.
4.2. Three Behavioral Patterns of Permit Utilization
Ward hierarchical clustering revealed three distinct patterns of permit utilization, each representing a different nature of idle capacity. Cluster 1 (Persistent Surplus, 59.2%) exhibited near-constant and extremely high idle rates over five years, consistent with the static permit–production mismatch identified in Section 4.1. The idle capacity in this group is largely an artifact of the permit methodology and represents the primary pool of potentially recoverable emission quotas. In contrast, Cluster 2 (Declining Surplus, 25.6%) showed steadily decreasing idle rates, indicating that these enterprises are progressively approaching their permit ceilings; this trajectory signals growing compliance risk, and the sustainability of their remaining idle capacity is uncertain and warrants caution in any trading assessment. Cluster 3 (Growing Surplus, 15.2%) displayed rapidly increasing idle rates, possibly reflecting cleaner production adoption, capacity restructuring, or partial production curtailment; among these, the idle capacity attributable to genuine emission reductions represents the most suitable candidate for emissions trading.
These behavioral patterns were not geographically or economically determined. Mean idle rates converged across the three economically stratified cities (H = 0.96, p = 0.619), and cluster membership showed no significant association with city location (χ2 = 6.40, p = 0.171). Moreover, all economic variables—permitted emission volume, per capita revenue, revenue per permit unit, profit rate, and enterprise scale—were uniformly non-significant as cluster predictors (all p > 0.05). The differentiation was driven by production-side emission behavior itself, consistent with the uniform regulatory environment of Jiangsu Province [5]. This finding supports behavior-based rather than geography- or scale-based approaches to permit management [17,30].
4.3. Trading Potential and Differentiated Management
The coexistence of 668.3 t/a of tradeable VOC capacity and acute quota scarcity for new projects highlights a fundamental barrier in the current system: substantial surplus exists but lacks institutional channels for reallocation. In Coasean terms, efficient reallocation of emission rights requires low transaction costs—clear property rights, reliable information, and accessible trading infrastructure [6]. In China’s current permit system, however, several barriers impede such reallocation. First, permits are tied to specific enterprises and facilities with no standardized transfer mechanism. Second, the systematic permit–production decoupling documented in Section 4.1 means neither regulators nor potential buyers can reliably distinguish genuinely surplus capacity from artifacts of the design-capacity-based permit methodology [18,28]. Third, the absence of a formal VOC emissions trading market in most provinces creates prohibitive search and negotiation costs. Moreover, because permit ceilings are calculated from design capacity rather than actual production, the nominal tradeable surplus of 668.3 t/a inevitably includes capacity that was never utilized in production and may not represent real environmental headroom. Any future trading mechanism must therefore incorporate verification procedures—such as continuous emission monitoring or production-linked permit recalculation—to ensure that only verified surplus enters the market.
The strategy matrix developed in this study provides an empirical framework for such differentiated management by classifying enterprises along two dimensions—idle rate level and temporal trend—into four quadrants linked to the behavioral patterns identified in Section 4.2. On the supply side, Quadrant B enterprises (n = 32, mean IR = 0.964, slope = +0.005/yr), predominantly from Cluster 1, hold large and stable surpluses that represent the most reliable candidate pool for trading, subject to the verification requirement outlined above. Quadrant A (n = 31, IR = 0.956, slope = −0.014/yr) holds comparable nominal surplus but on declining trajectories, requiring periodic reassessment before any trading authorization. On the demand side, Quadrant C enterprises (n = 33, IR = 0.695, slope = −0.094/yr), corresponding largely to Cluster 2, are converging toward their permit ceilings and represent potential quota buyers requiring enhanced compliance monitoring. Similarly, the five over-emitting enterprises excluded from this analysis may represent either legitimate capacity shortfalls warranting priority access to permit amendments, or non-compliant discharge requiring regulatory enforcement; clarifying their status would further refine the demand side of the trading framework. Quadrant D (n = 29, IR = 0.680, slope = +0.097/yr), corresponding to Cluster 3, shows improving emission performance that should be encouraged through favorable permit renewal conditions. The geographic concentration of tradeable capacity—Taizhou alone contributes 41.5% despite having fewer enterprises—suggests that a phased approach, beginning with intra-city pilot trading before expanding to inter-city markets, would be prudent [25,26]. China’s experience with pilot carbon trading programs provides relevant operational precedents for designing such verification and trading infrastructure [31,32,33].
More broadly, such reallocation operates within the total emission cap, which is established based on ambient environmental capacity and progressively tightened over regulatory cycles [4,5]. Revising over-estimated permit ceilings for persistently idle enterprises (e.g., Quadrant B) would release regulatory headroom for quota-constrained enterprises, improving allocative efficiency without compromising the environmental safeguards embedded in the cap.
4.4. Limitations and Future Research
Several limitations should be acknowledged. First, this study examined three cities within Jiangsu Province, where uniformly stringent environmental regulations may contribute to the observed convergence of idle rates; the behavioral typology (persistent, declining, and growing surplus) provides a transferable framework, but its empirical expression may differ in provinces with greater regulatory heterogeneity. Second, the study period (2020–2024) partially overlaps with the COVID-19 pandemic [34]; however, a supplementary analysis using 2019 data for 20 enterprises yielded a mean idle rate of 0.845, and idle rates continued rising in 2023–2024 after restrictions were lifted, suggesting the pattern predates and persists beyond the pandemic. Third, the broad “chemical raw materials and chemical products manufacturing” category encompasses diverse sub-sectors with different emission profiles; the absence of sub-sector classification data likely contributes to within-cluster variance and the modest effect sizes in the driver analysis.
Future research should expand the geographic scope to additional provinces, incorporate continuous emission monitoring system (CEMS) data where available to reduce reliance on self-reported figures, and extend the temporal window to capture longer-term idle rate dynamics. Integrating enterprise-level production data would enable more precise attribution of surplus transitions to demand-side versus supply-side factors.
5. Conclusions
This study developed an emission idle rate framework to evaluate VOC permit utilization among 130 chemical enterprises across three cities in Jiangsu Province. The central finding—that 78.1% of permitted emission capacity remained unused—revealed a systematic decoupling between permit allocation and actual production. Ward hierarchical clustering identified three distinct behavioral patterns: Persistent Surplus (59.2%, mean IR = 0.95), Declining Surplus (25.6%, IR = 0.69), and Growing Surplus (15.2%, IR = 0.59). These patterns were driven by production-side emission behavior rather than geographic location or enterprise economic characteristics (all economic predictors p > 0.05), supporting behavior-based rather than geography-based approaches to permit management.
Although significant reallocation barriers remain—non-transferable permits, unverifiable surplus inherent in the design-capacity-based methodology, and the absence of formal VOC trading markets—the quadrant-based strategy matrix developed in this study provides a practical path forward by matching management strategies to enterprise behavior: prioritizing stable-surplus enterprises as trading candidates subject to verification, strengthening compliance monitoring for those approaching permit ceilings, and incentivizing those demonstrating genuine emission reductions. This differentiated approach identifies 668.3 t/a of unused permit capacity, for which priority should be given to revising over-estimated ceilings and reallocating verified surplus to quota-constrained enterprises within the total emission cap. The analytical framework developed here—integrating idle rate quantification, behavioral clustering, and quadrant-based strategy classification—is transferable to other pollutants, sectors, and jurisdictions operating under permit-based emission control systems.
Supplementary Materials
The following supporting information can be downloaded at: https://www.mdpi.com/article/10.3390/atmos17060582/s1, Figure S1: Hierarchical clustering dendrogram; Table S1: Cluster validity indices for k = 2 through 5 (Ward hierarchical clustering on standardized five-year idle rate profiles); Table S2: Characteristics of the three emission behavioral clusters; Table S3: Driver analysis: effect sizes and significance for cluster membership; Table S4: Estimated tradeable VOC capacity by city.
Author Contributions
Conceptualization, X.L. and X.M.; Methodology, X.L.; Software, X.L.; Validation, X.L. and X.Z.; Investigation, X.L.; Resources, X.M.; Data curation, X.L. and J.P.; Writing—original draft, X.L.; Writing—review and editing, X.Z., J.P. and X.M.; Supervision, X.M.; Funding acquisition, X.M. All authors have read and agreed to the published version of the manuscript.
Funding
This research was funded by the Jiangsu Provincial College Student Innovation and Entrepreneurship Training Program, grant number 202311049018Z.
Institutional Review Board Statement
Not applicable.
Informed Consent Statement
Not applicable.
Data Availability Statement
The permitted emission and actual emission data used in this study were obtained from the Qingyue Open Environmental Data Platform (https://data.epmap.org), which aggregates publicly disclosed information from the National Pollutant Discharge Permit Management Information Platform (https://permit.mee.gov.cn). Enterprise-level economic data are not publicly available due to confidentiality agreements but may be made available upon reasonable request to the corresponding author.
Conflicts of Interest
The authors declare no conflicts of interest. The funders had no role in the design of the study; in the collection, analyses, or interpretation of data; in the writing of the manuscript; or in the decision to publish the results.
References
- Li, K.; Jacob, D.J.; Liao, H.; Shen, L.; Zhang, Q.; Bates, K.H. Anthropogenic Drivers of 2013–2017 Trends in Summer Surface Ozone in China. Proc. Natl. Acad. Sci. USA 2019, 116, 422–427. [Google Scholar] [CrossRef] [PubMed]
- Zhu, B.; Zhong, X.; Cai, W.; Shi, C.; Shao, X.; Chen, Z.; Yang, J.; Chen, Y.; Ni, E.; Guo, S.; et al. Characterization of VOC Source Profiles, Chemical Reactivity, and Cancer Risk Associated with Petrochemical Industry Processes in Southeast China. Atmos. Environ. X 2024, 21, 100236. [Google Scholar] [CrossRef]
- Wang, S.; Zhang, J.; Zhang, Y.; Wang, L.; Sun, Z.; Wang, H. Review on Source Profiles of Volatile Organic Compounds (VOCs) in Typical Industries in China. Atmosphere 2023, 14, 878. [Google Scholar] [CrossRef]
- State Council of China. Implementation Plan for the Control of Pollutant Discharge Permits; Document No. Guobanfa [2016] 81; General Office of the State Council: Beijing, China, 2016. [Google Scholar]
- Ministry of Ecology and Environment. Annual Report on Pollutant Discharge Permit Management; MEE: Beijing, China, 2021. [Google Scholar]
- Coase, R.H. The Problem of Social Cost. J. Law Econ. 1960, 3, 1–44. [Google Scholar] [CrossRef]
- Tietenberg, T.H. Emissions Trading: Principles and Practice, 2nd ed.; Resources for the Future: Washington, DC, USA, 2006. [Google Scholar]
- Wu, R.; Xie, S. Spatial Distribution of Secondary Organic Aerosol Formation Potential in China Derived from Speciated Anthropogenic Volatile Organic Compound Emissions. Environ. Sci. Technol. 2018, 52, 8146–8156. [Google Scholar] [CrossRef]
- Geng, G.; Liu, Y.; Liu, Y.; Liu, S.; Cheng, J.; Zheng, B.; Shi, Q.; Zhang, Q.; He, K. Efficacy of China’s Clean Air Actions to Tackle PM2.5 Pollution between 2013 and 2020. Nat. Geosci. 2024, 17, 987–994. [Google Scholar] [CrossRef]
- Wei, Y.H.D.; Fan, C.C. Regional Inequality in China: A Case Study of Jiangsu Province. Prof. Geogr. 2000, 52, 455–469. [Google Scholar] [CrossRef]
- Zheng, B.; Cheng, J.; Geng, G.; Wang, X.; Li, M.; Shi, Q.; Qi, J.; Lei, Y.; Zhang, Q.; He, K. Mapping Anthropogenic Emissions in China at 1 km Spatial Resolution and Its Application in Air Quality Modeling. Sci. Bull. 2021, 66, 612–620. [Google Scholar] [CrossRef]
- Gu, Y.; Liu, B.; Dai, Q.; Zhang, Y.; Zhou, M.; Feng, Y.; Hopke, P.K. Multiply Improved Positive Matrix Factorization for Source Apportionment of Volatile Organic Compounds during the COVID-19 Shutdown in Tianjin, China. Environ. Int. 2022, 158, 106979. [Google Scholar] [CrossRef]
- Liu, X.; Li, X.; Tan, X.; Bai, H.; Li, Y.; Zhang, S. Distribution Characteristics, Source Apportionment, and Chemical Reactivity of Volatile Organic Compounds in Two Adjacent Areas in Shanxi, North China. Atmos. Environ. 2022, 290, 119374. [Google Scholar] [CrossRef]
- Wang, G.; Zhao, N.; Zhang, H.; Li, G.; Xin, G. Spatiotemporal Distributions of Ambient Volatile Organic Compounds in China: Characteristics and Sources. Aerosol Air Qual. Res. 2022, 22, 210379. [Google Scholar] [CrossRef]
- Xiao, Z.; Yang, X.; Gu, H.; Hu, J.; Zhang, T.; Chen, J.; Pan, X.; Xiu, G.; Zhang, W.; Lin, M. Characterization and Sources of Volatile Organic Compounds (VOCs) during 2022 Summer Ozone Pollution Control in Shanghai, China. Atmos. Environ. 2024, 327, 120464. [Google Scholar] [CrossRef]
- Feng, Y.; An, J.; Tang, G.; Zhang, Y.; Wang, J.; Lv, H. Characteristics and Sources of Volatile Organic Compounds in the Nanjing Industrial Area. Atmosphere 2022, 13, 1136. [Google Scholar] [CrossRef]
- Schmalensee, R.; Stavins, R.N. Lessons Learned from Three Decades of Experience with Cap-and-Trade. Rev. Environ. Econ. Policy 2017, 11, 59–79. [Google Scholar] [CrossRef]
- Ye, W.; Liu, L.; Zhang, B. Designing and Implementing Pollutant Emissions Trading Systems in China: A Twelve-Year Reflection. J. Environ. Manag. 2020, 261, 110207. [Google Scholar] [CrossRef]
- GB/T 4754-2017; Industrial Classification for National Economic Activities. Standardization Administration of China: Beijing, China, 2017.
- Kruskal, W.H.; Wallis, W.A. Use of Ranks in One-Criterion Variance Analysis. J. Am. Stat. Assoc. 1952, 47, 583–621. [Google Scholar] [CrossRef]
- Ward, J.H. Hierarchical Grouping to Optimize an Objective Function. J. Am. Stat. Assoc. 1963, 58, 236–244. [Google Scholar] [CrossRef]
- Rousseeuw, P.J. Silhouettes: A Graphical Aid to the Interpretation and Validation of Cluster Analysis. J. Comput. Appl. Math. 1987, 20, 53–65. [Google Scholar] [CrossRef]
- Ellerman, A.D.; Convery, F.J.; de Perthuis, C. Pricing Carbon: The European Union Emissions Trading Scheme; Cambridge University Press: Cambridge, UK, 2010. [Google Scholar]
- Stavins, R.N. The Future of US Carbon-Pricing Policy. Environ. Energy Policy Econ. 2020, 1, 8–64. [Google Scholar] [CrossRef]
- Jiangsu Provincial Government. Interim Measures for the Paid Use and Trading of Emission Rights in Jiangsu Province; Document No. Suzhengbanfa [2017] 115; General Office of Jiangsu Provincial Government: Nanjing, China, 2017. [Google Scholar]
- Zhejiang Provincial Government. Interim Measures for the Pilot Work of Paid Use and Trading of Emission Rights in Zhejiang Province; Document No. Zhezhengbanfa [2010] 132; General Office of Zhejiang Provincial Government: Hangzhou, China, 2010.
- Ministry of Ecology and Environment. Technical Guidelines for Application and Issuance of Pollutant Discharge Permits—General Principles (HJ 942-2018); MEE: Beijing, China, 2018. [Google Scholar]
- Laffont, J.-J.; Tirole, J. A Theory of Incentives in Procurement and Regulation; MIT Press: Cambridge, MA, USA, 1993. [Google Scholar]
- Yang, X.M.; Wang, S.W. The Impact of Carbon Emission Rights Trading on Enterprise Capacity Utilization: Evidence from Eight Pilot Industries. Resour. Sci. 2023, 45, 1577–1589. [Google Scholar]
- Zhang, B.; Zhao, D. Emission Leakage and the Effectiveness of Regional Environmental Regulation in China. J. Environ. Econ. Manag. 2023, 121, 102869. [Google Scholar] [CrossRef]
- Stoerk, T.; Dudek, D.J.; Yang, J. China’s National Carbon Emissions Trading Scheme: Lessons from the Pilot Emission Trading Schemes, Academic Literature, and Known Policy Details. Clim. Policy 2019, 19, 472–486. [Google Scholar] [CrossRef]
- Huang, W.; Wang, Q.; Li, H.; Fan, H.; Qian, Y.; Klemes, J.J. Review of Recent Progress of Emission Trading Policy in China. J. Clean. Prod. 2022, 349, 131480. [Google Scholar] [CrossRef]
- Chen, X.; Lin, B. Towards Carbon Neutrality by Implementing Carbon Emissions Trading Scheme: Policy Evaluation in China. Energy Policy 2021, 157, 112510. [Google Scholar] [CrossRef]
- Le Quéré, C.; Jackson, R.B.; Jones, M.W.; Smith, A.J.; Abernethy, S.; Andrew, R.M.; De-Gol, A.J.; Willis, D.R.; Shan, Y.; Canadell, J.G.; et al. Temporary Reduction in Daily Global CO2 Emissions during the COVID-19 Forced Confinement. Nat. Clim. Change 2020, 10, 647–653. [Google Scholar]

Disclaimer/Publisher’s Note: The statements, opinions and data contained in all publications are solely those of the individual author(s) and contributor(s) and not of MDPI and/or the editor(s). MDPI and/or the editor(s) disclaim responsibility for any injury to people or property resulting from any ideas, methods, instructions or products referred to in the content. |
© 2026 by the authors. Licensee MDPI, Basel, Switzerland. This article is an open access article distributed under the terms and conditions of the Creative Commons Attribution (CC BY) license.