


Abstract
Seasonal snow cover can serve as an informative single-season indicator of atmospheric deposition in industrial urban areas because it accumulates airborne contaminants during the winter period. A total of 55 snow samples were collected across the urban area, and the liquid phase was analyzed for major and trace elements using instrumental elemental analysis with defined detection limits and measurement uncertainty. Descriptive statistics, background comparisons, and integrated pollution indicators were used to characterize the spatial variability and intensity of contamination. The results showed that the median concentrations of most analyzed elements did not exceed the reference limits; however, aluminum and iron exhibited elevated levels, with aluminum reaching 1.1–27 times and iron 1.0–3 times the reference values. Median concentrations included 270 μg L−1 for Al, 118 μg L−1 for Fe, 30 μg L−1 for Zn, 11.5 μg L−1 for Ni, and 7.3 μg L−1 for Pb. The obtained data indicate a heterogeneous pollution pattern across Pavlodar and suggest the combined influence of mineral dust, urban-industrial emissions, road-dust resuspension, and natural inputs on snow chemistry. Because the study is based on one winter sampling campaign, the results should be interpreted as a single-season assessment of snow-cover contamination rather than as evidence of long-term temporal stability.
1. Introduction
Air pollution is one of the most pressing environmental challenges in industrial urban areas because the atmosphere serves as the main pathway for the transport and deposition of contaminants emitted by industrial facilities, energy enterprises, vehicles, and resuspended surface materials [1]. The accumulation of chemical elements in urban environments affects not only air quality itself, but also soils, surface waters, vegetation, and human exposure pathways [2]. For this reason, the assessment of atmospheric deposition is an important part of environmental monitoring in cities with a pronounced industrial profile.
In cold-climate regions, seasonal snow cover is considered a valuable natural archive of atmospheric pollution [3]. During the winter season, snow accumulates both dry and wet deposition, trapping suspended particles and soluble contaminants from the atmosphere over a relatively long period [4]. Wintertime studies of atmospheric pollution also show that soluble trace metals may be enriched under conditions of intensified seasonal emissions and stagnant air masses [5]. As a result, the chemical composition of snowmelt reflects the integrated impact of airborne emissions rather than short-term fluctuations that are often captured by routine air measurements. This makes snow cover especially useful for identifying geochemical anomalies, assessing spatial patterns of contamination, and evaluating the contribution of anthropogenic sources in urban and industrial territories [6].
The use of snow as an environmental indicator has several practical advantages. Snow sampling is relatively simple, cost-effective, and suitable for dense spatial surveys across different functional zones of a city [7]. Unlike direct aerosol sampling, which often requires continuous monitoring and specialized equipment, snow cover studies provide an opportunity to obtain a cumulative picture of pollutant deposition over the winter period. In addition, the analysis of the liquid phase of melted snow allows the determination of a wide range of major and trace elements, which can be further interpreted in relation to possible industrial, traffic-related, and natural sources. Therefore, snow geochemistry has become an informative tool for environmental assessment in areas exposed to mixed anthropogenic impacts.
Industrial cities are of particular interest in this context because their atmospheric deposition is commonly formed under the combined influence of stationary emissions, transport-related pollution, construction and road dust, and lithogenic material derived from surrounding surfaces [8]. In such environments, elemental composition patterns can reveal both general contamination levels and source-specific signatures. Elevated concentrations of metals and metalloids in snow may indicate the influence of industrial processes, fuel combustion, metallurgical activity, or the redistribution of contaminated particles that have already accumulated in the urban landscape [9]. At the same time, the interpretation of snow chemistry should remain cautious, because some elements may also have a substantial natural component associated with mineral dust and local geological conditions.
Pavlodar is one of the major industrial cities of Kazakhstan and represents a relevant case for studying atmospheric deposition in an urban-industrial environment [9]. The city is characterized by the presence of large industrial enterprises, including metallurgical and energy-related facilities, which may influence the elemental composition of atmospheric fallout. Under such conditions, the investigation of snow cover contamination is not only environmentally relevant, but also important for understanding the spatial heterogeneity of pollutant accumulation within the city. Differences between industrial, roadside, and residential zones may provide additional insight into the distribution of atmospheric inputs and the relative roles of different emission sources [9].
Despite the environmental significance of such studies, the international literature on snow geochemistry in Kazakhstan remains limited, especially with regard to detailed urban-scale assessments of elemental deposition in industrial cities [10]. Most studies on air pollution in the region have traditionally focused on gaseous pollutants, particulate matter concentrations, or general atmospheric quality trends. By contrast, fewer investigations have examined snow cover as an integrative indicator of atmospheric contamination and as a medium for evaluating the distribution of trace elements across the urban environment. This creates a clear need for local case studies that combine field sampling, elemental analysis, and pollution assessment tools to characterize urban atmospheric deposition more comprehensively.
In the present study, snow sampling locations in Pavlodar were selected with consideration of the wind rose, distance from industrial facilities, and the functional zoning of the city, including industrial, roadside, and residential areas. This sampling design made it possible to evaluate both the overall elemental composition of snowmelt and the spatial variability of contamination associated with different types of anthropogenic influence. The obtained dataset provides a basis for identifying the dominant elemental patterns, determining the most significant pollution-related elements, and evaluating the heterogeneity of contamination within the urban territory.
In this study, particular attention is paid to elements such as aluminum, iron, zinc, nickel, and lead, which are important both from the point of view of urban geochemistry and from the perspective of possible anthropogenic influence. Their concentrations and distribution patterns may reflect a combination of industrial emissions, dust resuspension, and natural mineral inputs. Therefore, the interpretation of these elements is essential for understanding the geochemical character of atmospheric deposition in Pavlodar.
Recent studies confirm that snow cover can be used as an informative seasonal indicator of environmental pollution because it accumulates atmospheric pollutants during the cold period and reflects differences between urban, rural, and anthropogenically affected areas [11]. This is especially important for industrial cities, where snowmelt chemistry may integrate the influence of stationary emissions, transport-related particles, fuel combustion, and resuspended mineral dust.
For Pavlodar, previous research has already demonstrated the relevance of snow-cover analysis for assessing heavy metal contamination near oil refining, thermal power plants, aluminum-related production, and transport-influenced areas [12]. However, further urban-scale studies are still required to clarify how the liquid phase of snowmelt reflects background-normalized enrichment, sample-scale heterogeneity, and integrated pollution indices across a spatially distributed sampling network.
The novelty of the present study lies in the integration of elemental analysis of snowmelt, background-based concentration coefficients, integrated pollution indices, and spatially distributed sampling design for assessing snow cover contamination in Pavlodar. Unlike studies that focus mainly on total heavy-metal contents or individual industrial zones, this work emphasizes the liquid phase of snowmelt and combines concentration patterns with background-normalized enrichment indicators to characterize the urban-scale heterogeneity of atmospheric deposition in an industrial city of northeastern Kazakhstan.
The aim of this study was to assess snow cover contamination in Pavlodar, Kazakhstan, based on the elemental composition of snowmelt and pollution indices. The specific objectives were to characterize the distribution of elemental concentrations, identify the most significant pollution-related elements, evaluate spatial heterogeneity across the city, and interpret possible industrial and natural contributions to atmospheric deposition.
2. Materials and Methods
2.1. Study Area
Pavlodar is one of the largest industrial cities in Kazakhstan and represents an important urban center of the northeastern part of the country. The city is characterized by a well-developed industrial infrastructure that includes large enterprises of metallurgy, energy production, petrochemistry, ferroalloy manufacturing, mechanical engineering, and related industrial facilities. Among the major industrial sources located within the city and its surrounding area are the Pavlodar Petrochemical Plant, the aluminum plant, ferroalloy production facilities, thermal power plants, and auxiliary industrial units. Such a concentration of heavy industry forms a substantial technogenic load on the urban environment, particularly on the atmospheric air and the deposition of airborne contaminants.
Pavlodar is situated within one of the leading industrial regions of Kazakhstan, where industrial growth has resulted in persistently high atmospheric emissions. Monitoring data reported for the city indicate that air quality remains a matter of environmental concern, with elevated contributions from nitrogen dioxide, carbon monoxide, and other pollutants. The environmental relevance of Pavlodar is further supported by previous observations showing that the city belongs to a region with a pronounced anthropogenic burden and a heterogeneous atmospheric pollution pattern.
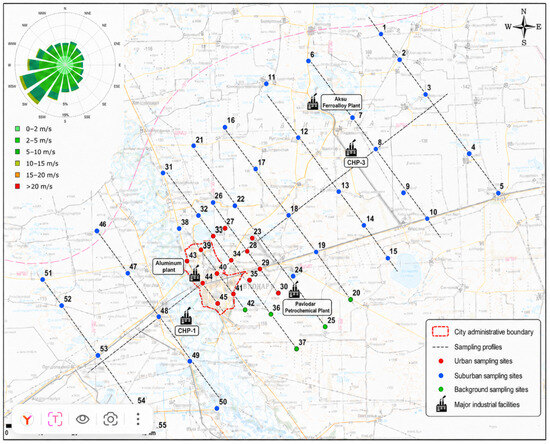
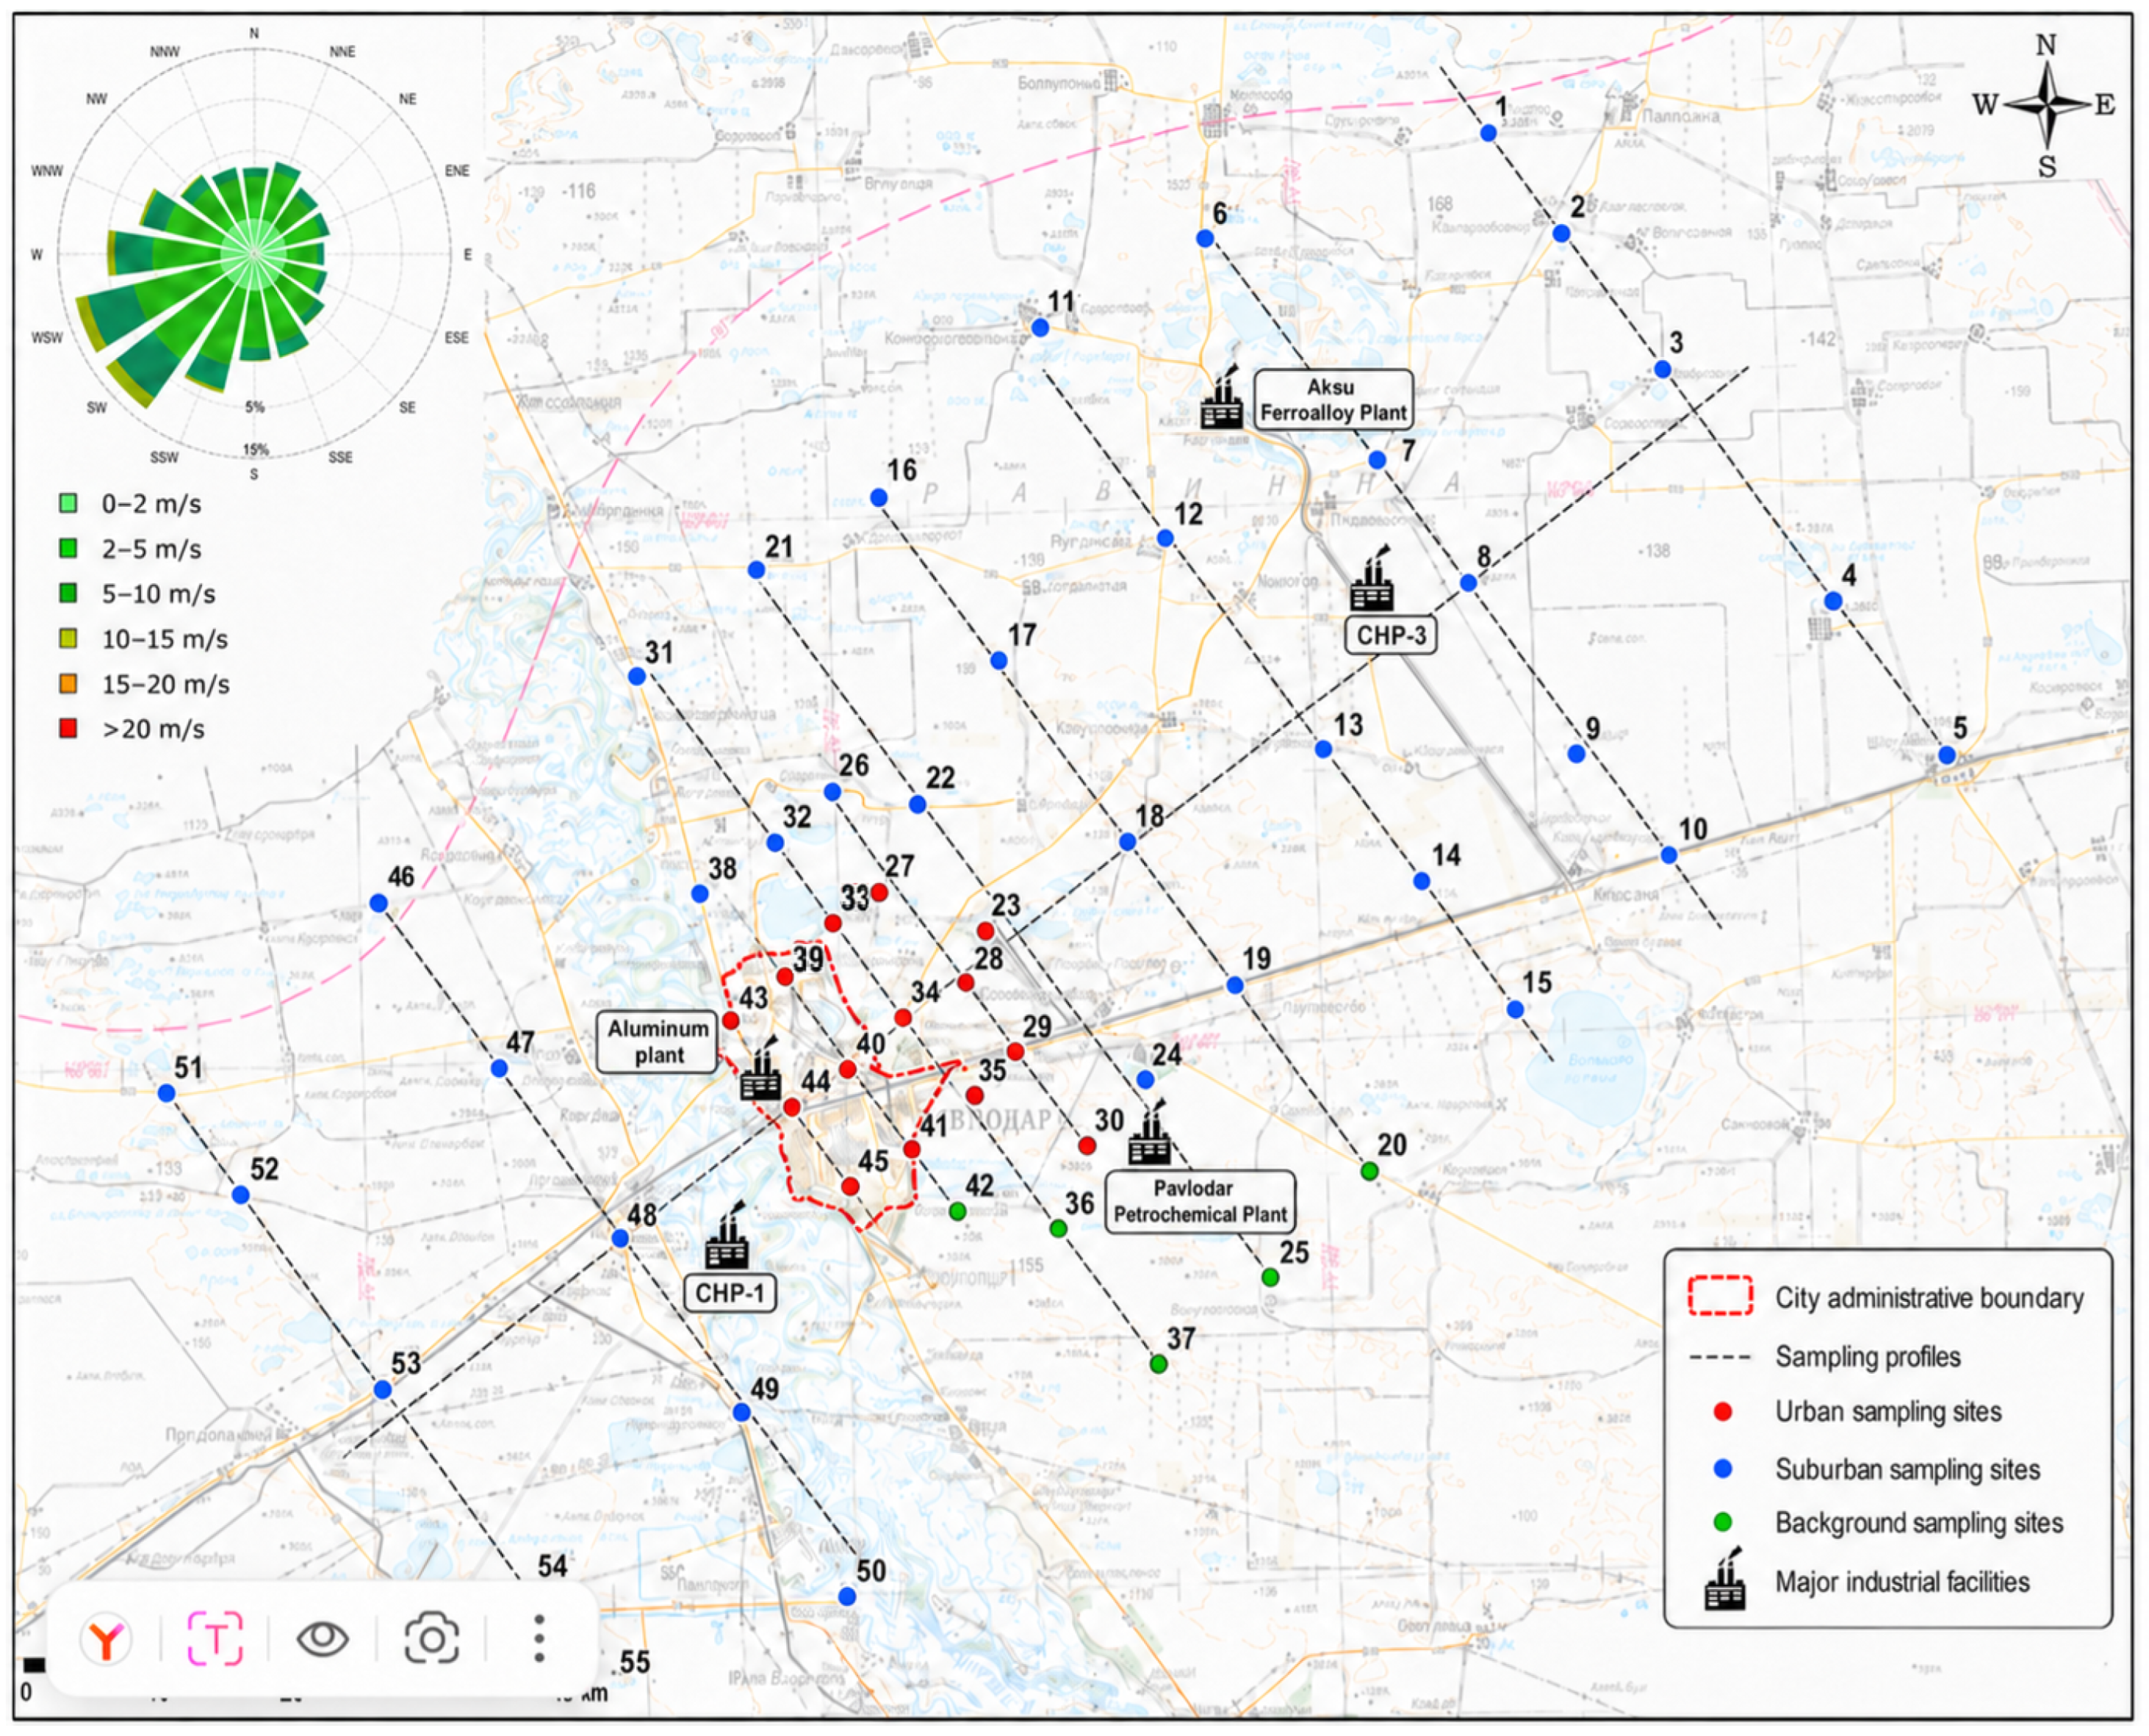
For the purposes of the present study, the sampling framework was designed with consideration of the local wind rose, the location of industrial facilities, and the functional zoning of the urban territory. Snow sampling points were distributed along pre-defined profiles to represent industrial, roadside, residential, and relatively less affected areas. Within the city, the sampling points were arranged at shorter intervals to provide a more detailed spatial characterization of contamination patterns under conditions of dense population and concentrated stationary emission sources. The spatial configuration of the study area, sampling profiles, snow sampling sites, and major industrial facilities is shown in Figure 1. The map includes the administrative boundary of Pavlodar, 55 snow sampling sites classified as urban, suburban, and background locations, the wind rose used for profile orientation, and the main industrial facilities considered as potential emission sources.
Figure 1.
Spatial distribution of snow sampling sites and major potential emission sources in Pavlodar, Kazakhstan.
2.2. Snow Sampling
Snow sampling was carried out within the urban territory of Pavlodar using a spatially differentiated design intended to capture both technogenically impacted and relatively less affected areas. The sampling framework was developed on the basis of retrospective air-pollution data and meteorological conditions. Profile lines were established according to the prevailing wind directions derived from wind roses and supported by interpolated distributions of sulfur dioxide and nitrogen dioxide, which served as a geospatial basis for positioning the snow sampling sites.
The investigated area was subdivided with consideration of the functional structure of the city, including industrial, roadside, and residential zones. Snow samples were collected at different distances from major industrial facilities and in different directions relative to the dominant air-flow pathways in order to assess the extent of atmospheric influence from the emission sources. According to the adopted sampling design, the spacing between points within the urban area was approximately 5 km, whereas in suburban and background areas it ranged from 10 to 20 km, allowing representative spatial coverage while maintaining survey efficiency.
Snow was collected over the full depth of the snowpack, except for the bottom 3–5 cm layer, which was excluded to minimize contamination from the underlying soil and vegetation. To reduce the influence of direct local contamination, visibly disturbed snow, snow piles affected by mechanical cleaning, areas immediately adjacent to building walls, drainage outlets, parking areas, and places with obvious direct contamination were avoided where possible. Roadside locations were retained only when they represented the intended traffic-influenced functional category; such samples were interpreted separately as part of the urban-impact signal rather than as background conditions. In total, 55 snow samples from Pavlodar were used for elemental analysis of the liquid phase of melted snow. The snow survey was treated as the initial stage of a comprehensive environmental assessment aimed at preliminary mapping of contamination patterns and identification of areas potentially affected by atmospheric transport of pollutants.
2.3. Chemical Analysis
The collected snow samples were melted under laboratory conditions, and the liquid phase of snowmelt was used for further chemical analysis. Both general hydrochemical parameters and elemental composition were determined for the obtained meltwater samples. The general chemical analysis included pH, mineralization, hardness, and the concentrations of major cations and anions, whereas the elemental analysis focused on a broad suite of major and trace elements. The report materials indicate that 38 elements were determined in the meltwater samples, including Be, Na, Mg, Al, K, Ca, As, V, Cr, Mn, Fe, Co, Ni, Cu, Zn, Ga, Rb, Sr, Cd, Cs, Ba, Se, Ag, Gd, Lu, Tl, La, Ce, Pr, Nd, Sm, Eu, Dy, Er, Yb, Pb, Th, and U.
Elemental concentrations in the liquid phase of snow were measured using inductively coupled plasma optical emission spectrometry (ICP-OES; EXPEC-6500) and inductively coupled plasma mass spectrometry (ICP-MS; SUPEC-7000). Both instruments were manufactured by Focused Photonics Inc. (No. 2466, Science & Technology Avenue, Qingshanhu Street, Lin’an, Hangzhou, Zhejiang, China).These techniques were used as complementary analytical methods according to the concentration range and analytical sensitivity required for the measured elements. ICP-OES was applied mainly to major and relatively abundant elements, whereas ICP-MS was used for trace and ultra-trace elements requiring lower instrumental detection limits. Multi-element standard solutions were used for calibration, and the calibration curves were rebuilt when the analytical requirements were not met, with corresponding adjustment of background parameters. The reported expanded measurement uncertainty was calculated with a coverage factor of , corresponding to an approximate confidence level of 95%. Instrumental detection limits and the analytical method used for each reported element are presented in Table 1.
Table 1.
Elemental concentrations, background values, and instrumental detection limits for the liquid phase of snow collected in Pavlodar city (), μg L−1.
2.4. Data Processing and Statistical Analysis
The analytical dataset was organized in tabular The analytical dataset was organized in tabular form and processed using Python (v3.12.3) in the JupyterLab environment. The main Python packages used for data handling, numerical calculations, statistical analysis, dimensionality reduction, and graphical visualization were pandas (v2.3.1), NumPy (v2.3.2), SciPy (v1.15.2), scikit-learn (v1.6.1), matplotlib (v3.10.5), and seaborn (v0.13.2). Data preprocessing included verification of variable names, conversion of numerical values to a consistent format, and preparation of the elemental concentration table for statistical analysis and visualization. Values reported below the instrumental detection limits were treated as non-detects. For descriptive statistics and graphical summaries, detected values were used, whereas for principal component analysis (PCA), values below the detection limit were replaced by one-half of the corresponding detection limit.
Descriptive statistics were calculated for each element, including minimum, maximum, median, and coefficient of variation. Median values were used as robust measures of central tendency because several elements showed wide concentration ranges, high coefficients of variation, asymmetric distributions, and local outliers. These characteristics indicated strong sample-scale heterogeneity in the snowmelt dataset.
Spearman rank correlation analysis was applied to evaluate inter-element associations among selected diagnostic elements. This non-parametric approach was selected because the concentration data were not uniformly distributed and contained pronounced dispersion. Graphical analysis included median concentration plots, boxplots, heatmaps, clustered correlation matrices, and pairwise scatter plots. These visualizations were used to identify dominant elemental patterns, assess spatial heterogeneity, and support the interpretation of possible common sources or deposition pathways.
Principal component analysis was also applied to identify the main multivariate structure of the elemental dataset. Prior to PCA, the concentration data were log-transformed using log10 and standardized to zero mean and unit variance. Elements with very low detection frequency were excluded to avoid unstable loadings. PCA was performed for the main Pavlodar snowmelt samples; control or replicate samples marked as “PK” were excluded from this analysis.
All calculations and data visualizations were performed within a unified analytical workflow to ensure internal consistency of the presented results.
2.5. Pollution Indices
To assess the degree of snow cover contamination, concentration-based and load-based pollution indices were calculated. The concentration coefficient () for each chemical element was defined as the ratio of its measured concentration in the studied sample (C) to the corresponding background concentration ()
where C is the measured concentration of the element in the liquid phase of snow and is its background concentration in the same environmental medium. The total pollution index of snow cover () was calculated as the sum of concentration coefficients for the elements exceeding their background values
where n is the number of anomalous elements included in the calculation. This index was used to characterize the cumulative degree of snow contamination by chemical elements relative to the background level.
In addition to concentration-based assessment, the total pollution load for each element was estimated from the amount of the element accumulated in the snow cover per unit area during the snow season. The total load () was calculated as
where C is the concentration of the element in the meltwater, V is the volume of melted snow collected from the sampling area, S is the sampled surface area, and t is the snow exposure period counted from the onset of stable snow cover. Based on this parameter, the relative increase in total pollution load () was determined as the ratio of the calculated load to the corresponding background load ()
The integrated load index () was then calculated as
where n is the number of considered elements.
The interpretation of contamination levels was based on the accepted classification scale for snow-cover pollution and snow-derived geochemical assessment of urban contamination [13]. According to this scale, values of 32–64 correspond to low pollution, 64–128 to moderate pollution, 128–256 to high pollution, and values above 256 to very high pollution. For the load-based index, values of 100–250 indicate low pollution, 250–450 moderate pollution, 450–850 high pollution, and values above 850 very high pollution. These indices were used to compare the relative contribution of individual elements and to evaluate the overall heterogeneity of contamination across the Pavlodar study area.
3. Results
3.1. Elemental Composition of Snowmelt
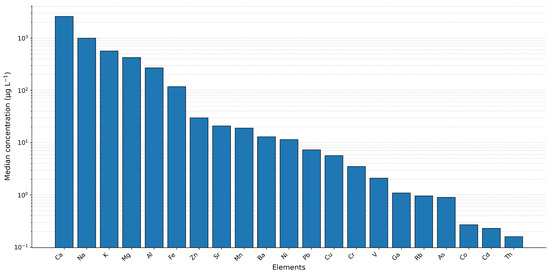
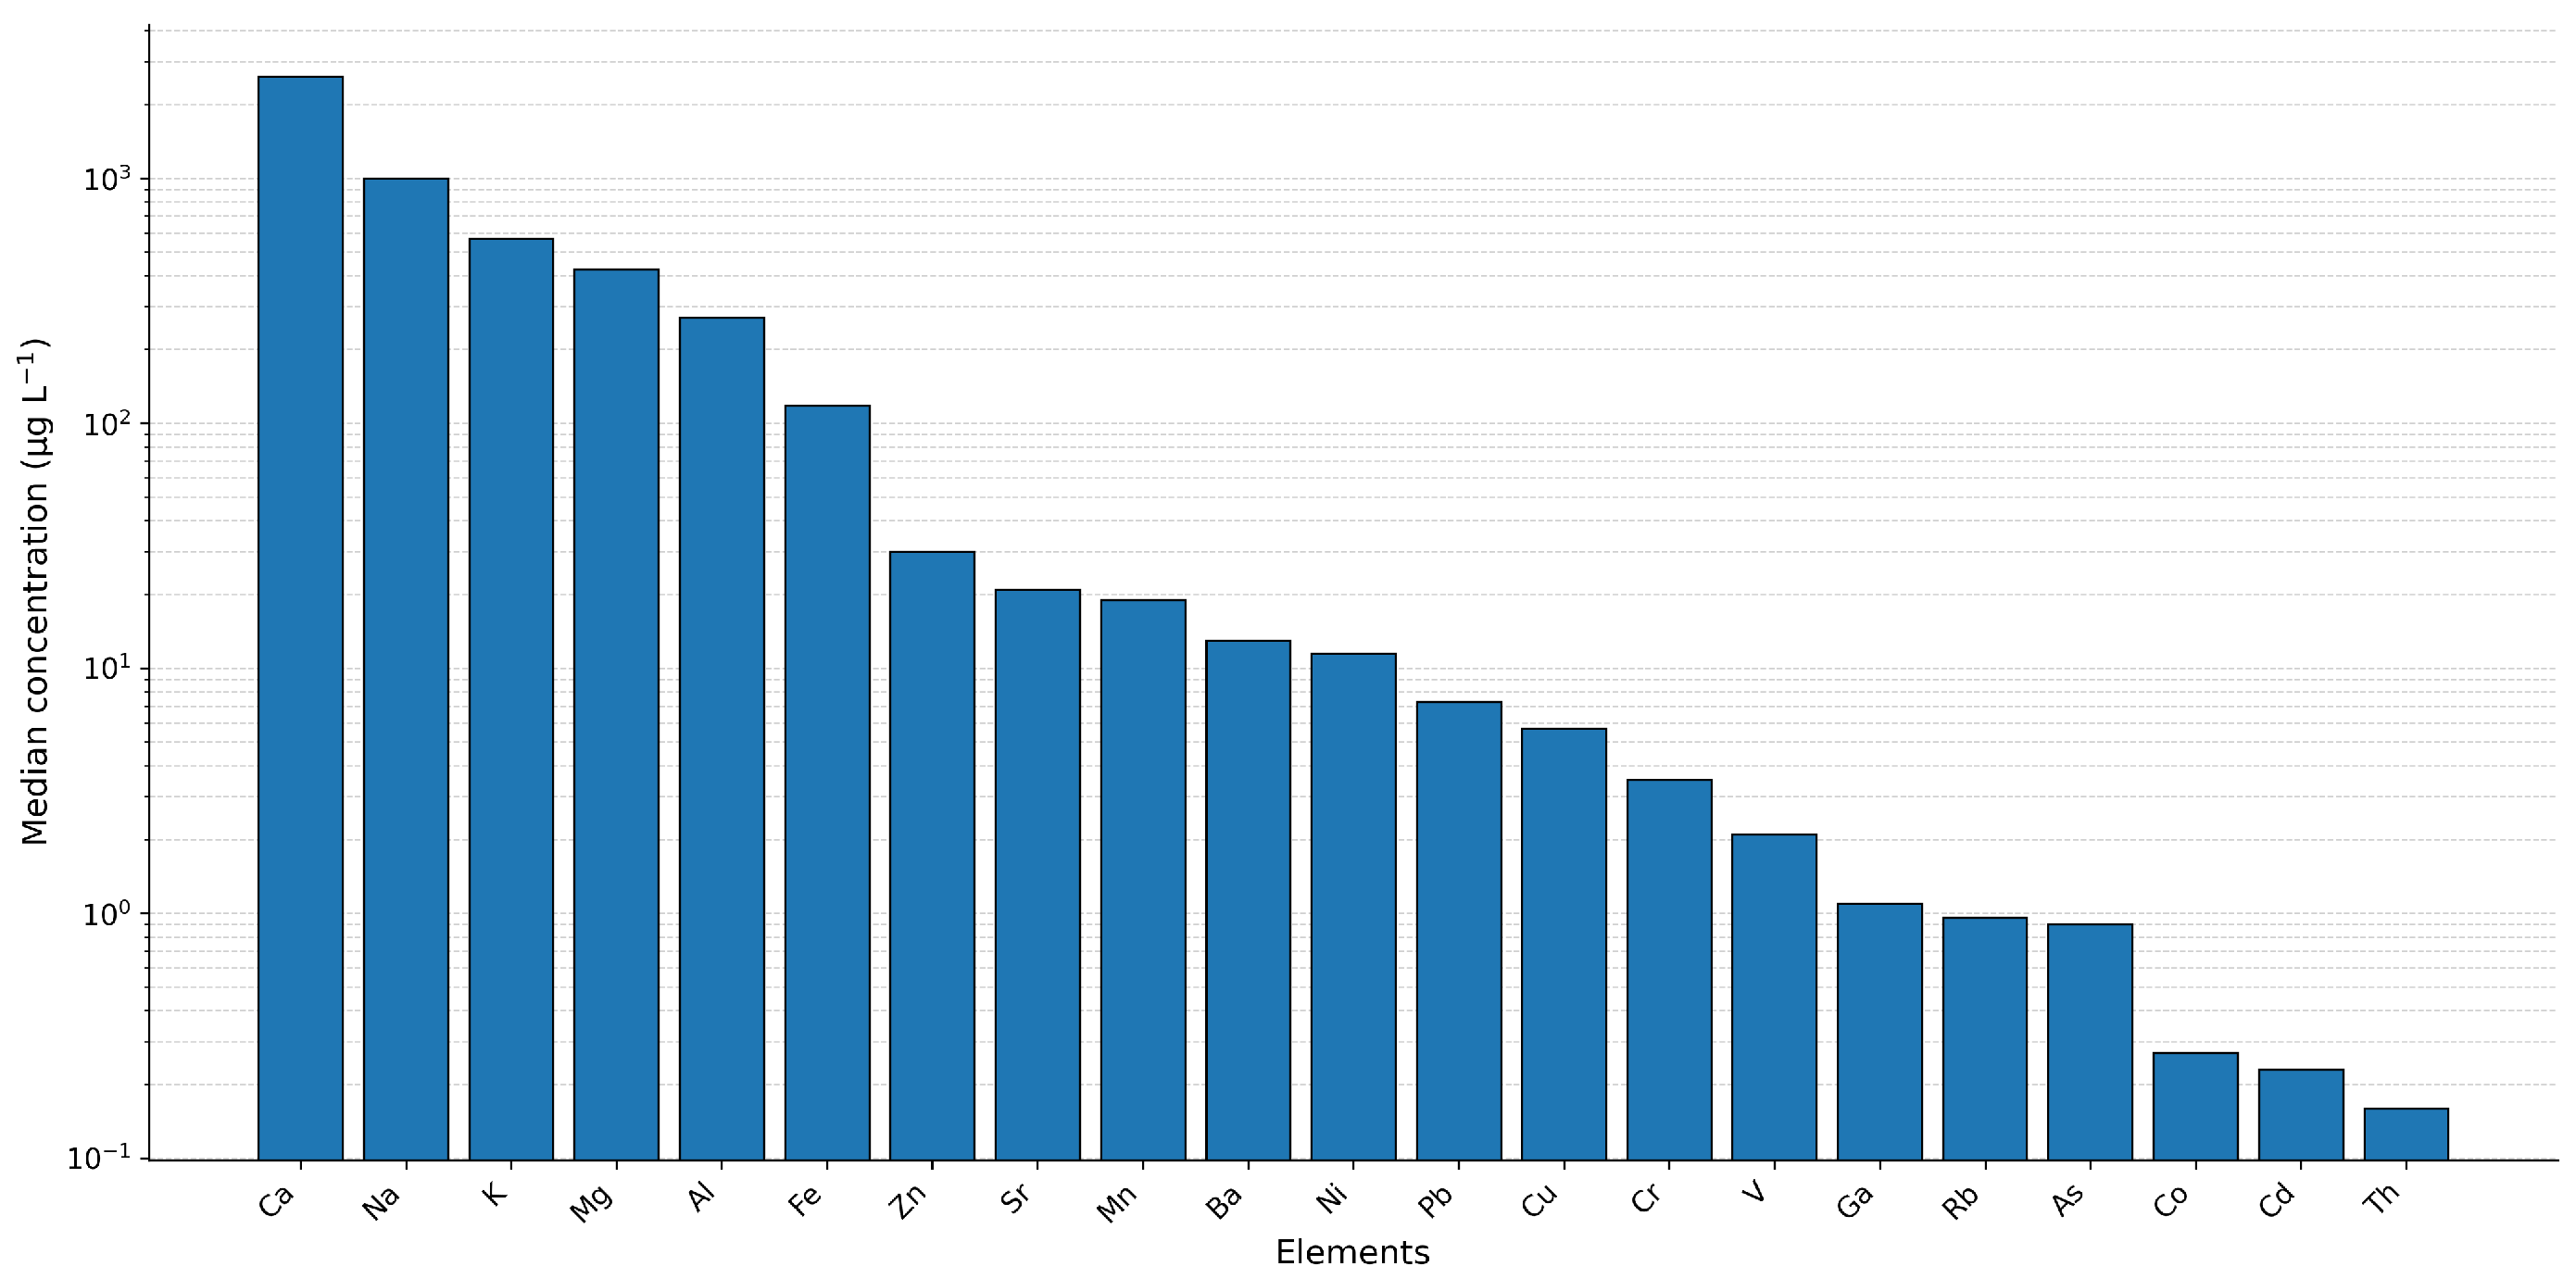
The analysis of the liquid phase of snow samples collected in Pavlodar revealed a heterogeneous elemental composition with clear differences between major and trace constituents. According to the median values shown in Figure 2, the highest concentrations were associated with Ca, Na, K, and Mg, which formed the dominant geochemical background of the snowmelt. Among the potentially pollution-related elements, comparatively higher median levels were observed for Al and Fe, while the remaining elements occurred at substantially lower concentrations.
Figure 2.
Median elemental concentrations in the liquid phase of Pavlodar snowmelt samples.
This pattern indicates that the chemical composition of snowmelt is controlled by both natural and anthropogenic factors. The high content of Ca, Na, K, and Mg is consistent with the accumulation of mineral particles, resuspended soil material, and readily soluble atmospheric deposits. In contrast, increased levels of Al and Fe may be associated with the input of aluminosilicate dust, industrial particulates, and mechanically generated urban aerosols. The full descriptive statistics of elemental concentrations in snowmelt are presented in Table 1. The table includes median values, concentration ranges, coefficients of variation, and background concentrations used for further interpretation.
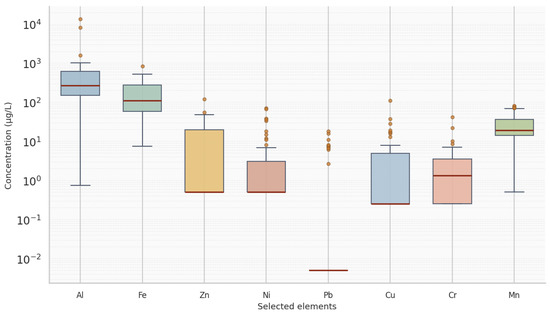
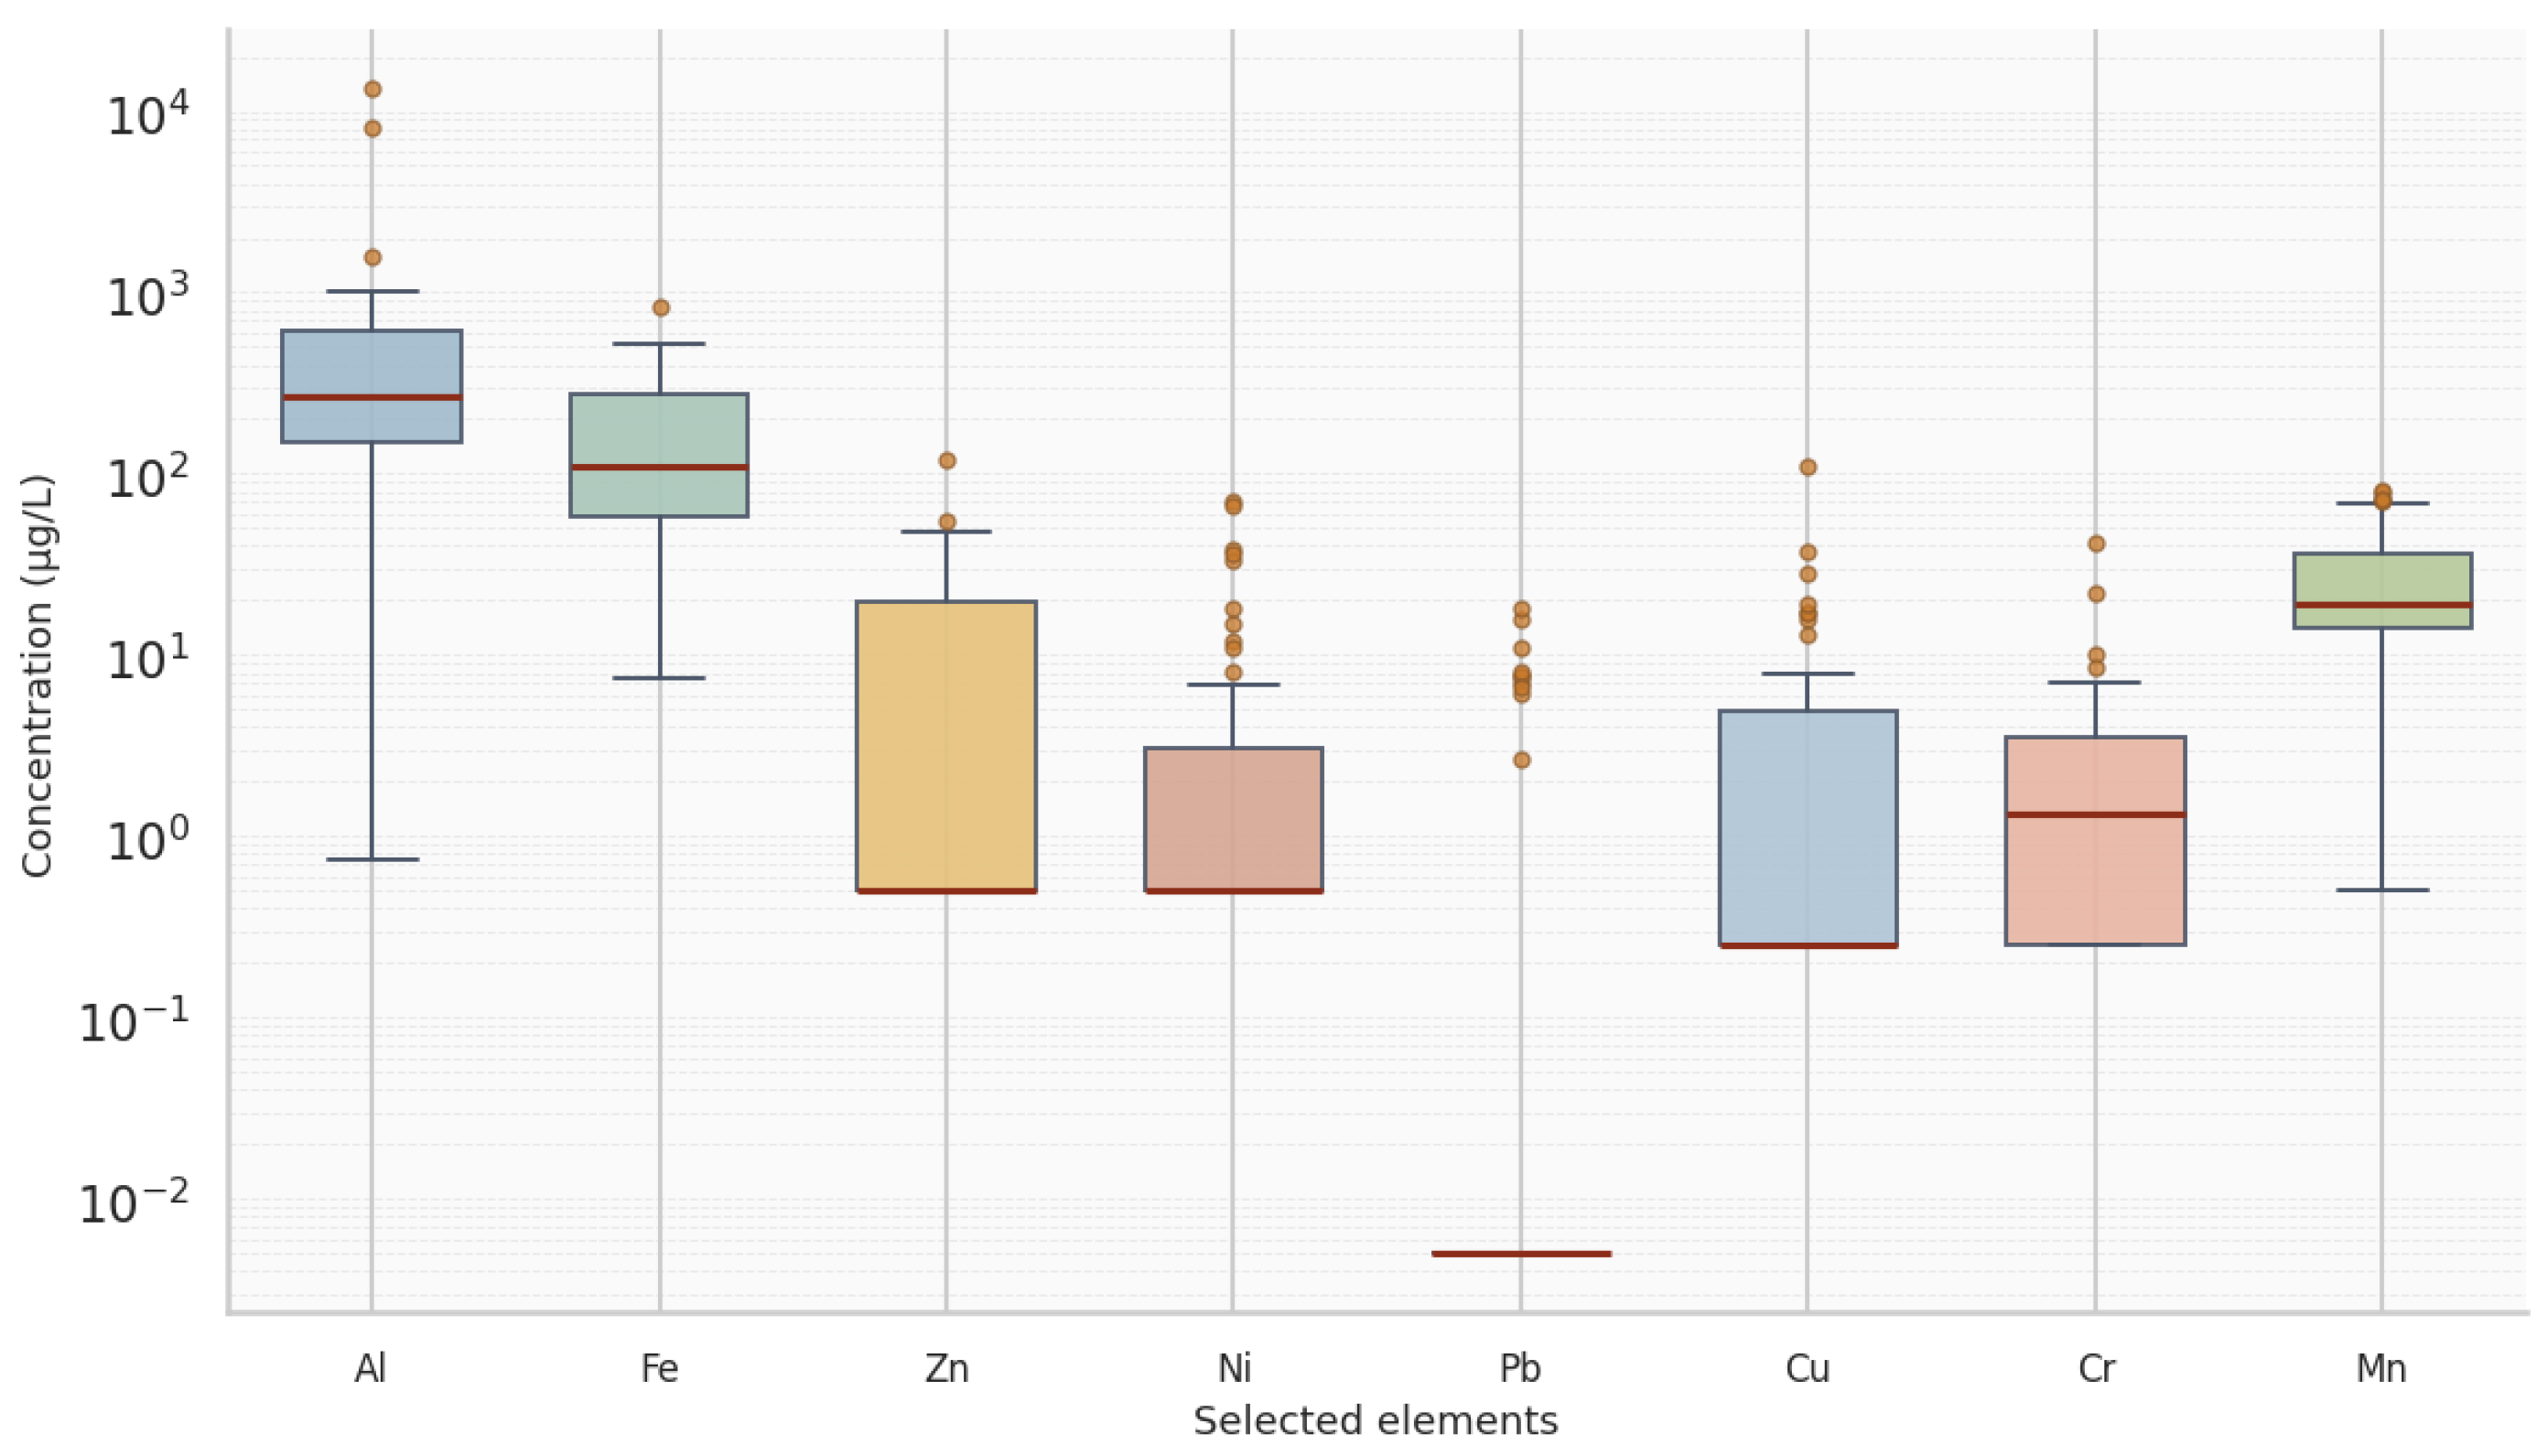
Figure 3 focuses on selected diagnostic elements representing lithogenic, metallurgical, toxic and urban-associated groups. These elements were selected on the basis of their environmental relevance, variability across the sampling network, background exceedance potential, and usefulness for interpreting possible source-related patterns. Al and Fe were included as indicators of mineral dust, aluminosilicate particles, and industrial particulate inputs; Zn, Pb, Cu, Ni, and Cr were selected as toxic or source-indicative metals associated with urban-industrial and traffic-related influences; Mn was included because of its marked variability and its possible association with both mineral and technogenic inputs.
Figure 3.
Boxplot distribution of selected element concentrations in snowmelt samples from Pavlodar.
Although 38 elements were determined analytically, Table 1 presents only the elements that were consistently detected, had available background values, and were environmentally interpretable for assessing urban-industrial snow contamination. Elements that were below the detection limit in most samples were excluded from the main statistical summary and considered only as part of the analytical coverage of the study.
To further evaluate spatial differences between sampling-zone categories, median concentrations of selected diagnostic elements were summarized for urban, suburban, and background sites (Table 2). This comparison was used to assess whether the elements selected for detailed interpretation showed stronger enrichment within the urban sampling network relative to background locations.
Table 2.
Median concentrations of selected diagnostic elements by sampling-zone category in Pavlodar snowmelt samples, μg L−1.
The descriptive statistics confirmed strong variability in elemental concentrations across the sampling network. Several elements showed high coefficients of variation, including Al, Na, Cr, Cu, Ni, and Th, together with wide minimum–maximum ranges. This indicates pronounced sample-scale heterogeneity and supports the use of median values as robust measures of central tendency. The same variability also justified the use of non-parametric Spearman rank correlation analysis for evaluating inter-element associations.
The distribution of selected elements across individual samples, further illustrated in Figure 3, highlights the uneven nature of snow cover contamination. The largest spread and the most pronounced outliers were observed for Al and Fe, suggesting substantial differences in deposition conditions between sampling points. Zn, Cu, Cr, and Mn also showed marked variability, indicating that these elements were not uniformly distributed throughout the study area. Such dispersion may reflect the combined effects of emission proximity, meteorological conditions, and local surface characteristics affecting pollutant accumulation in snow.
In general, the results demonstrate that the snow cover in Pavlodar acts as an effective accumulator of atmospheric impurities and preserves both the baseline mineral component and localized anomalies of technogenic origin.
3.2. Variability of Element Concentrations Across Samples
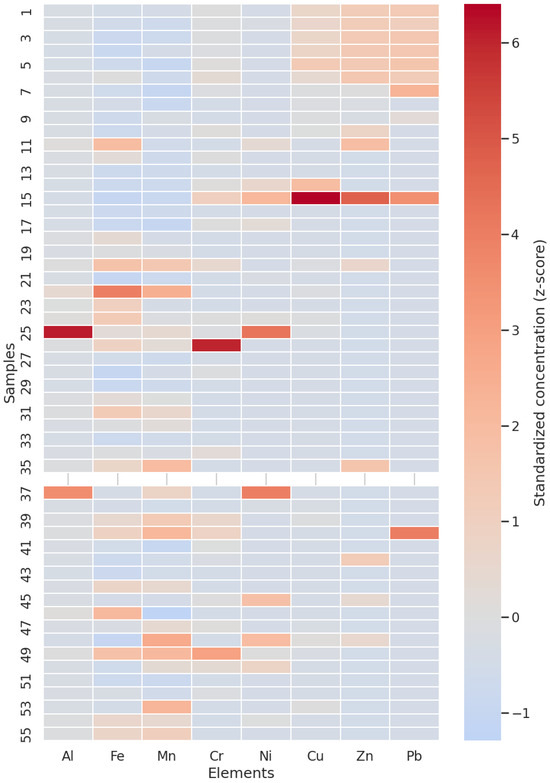
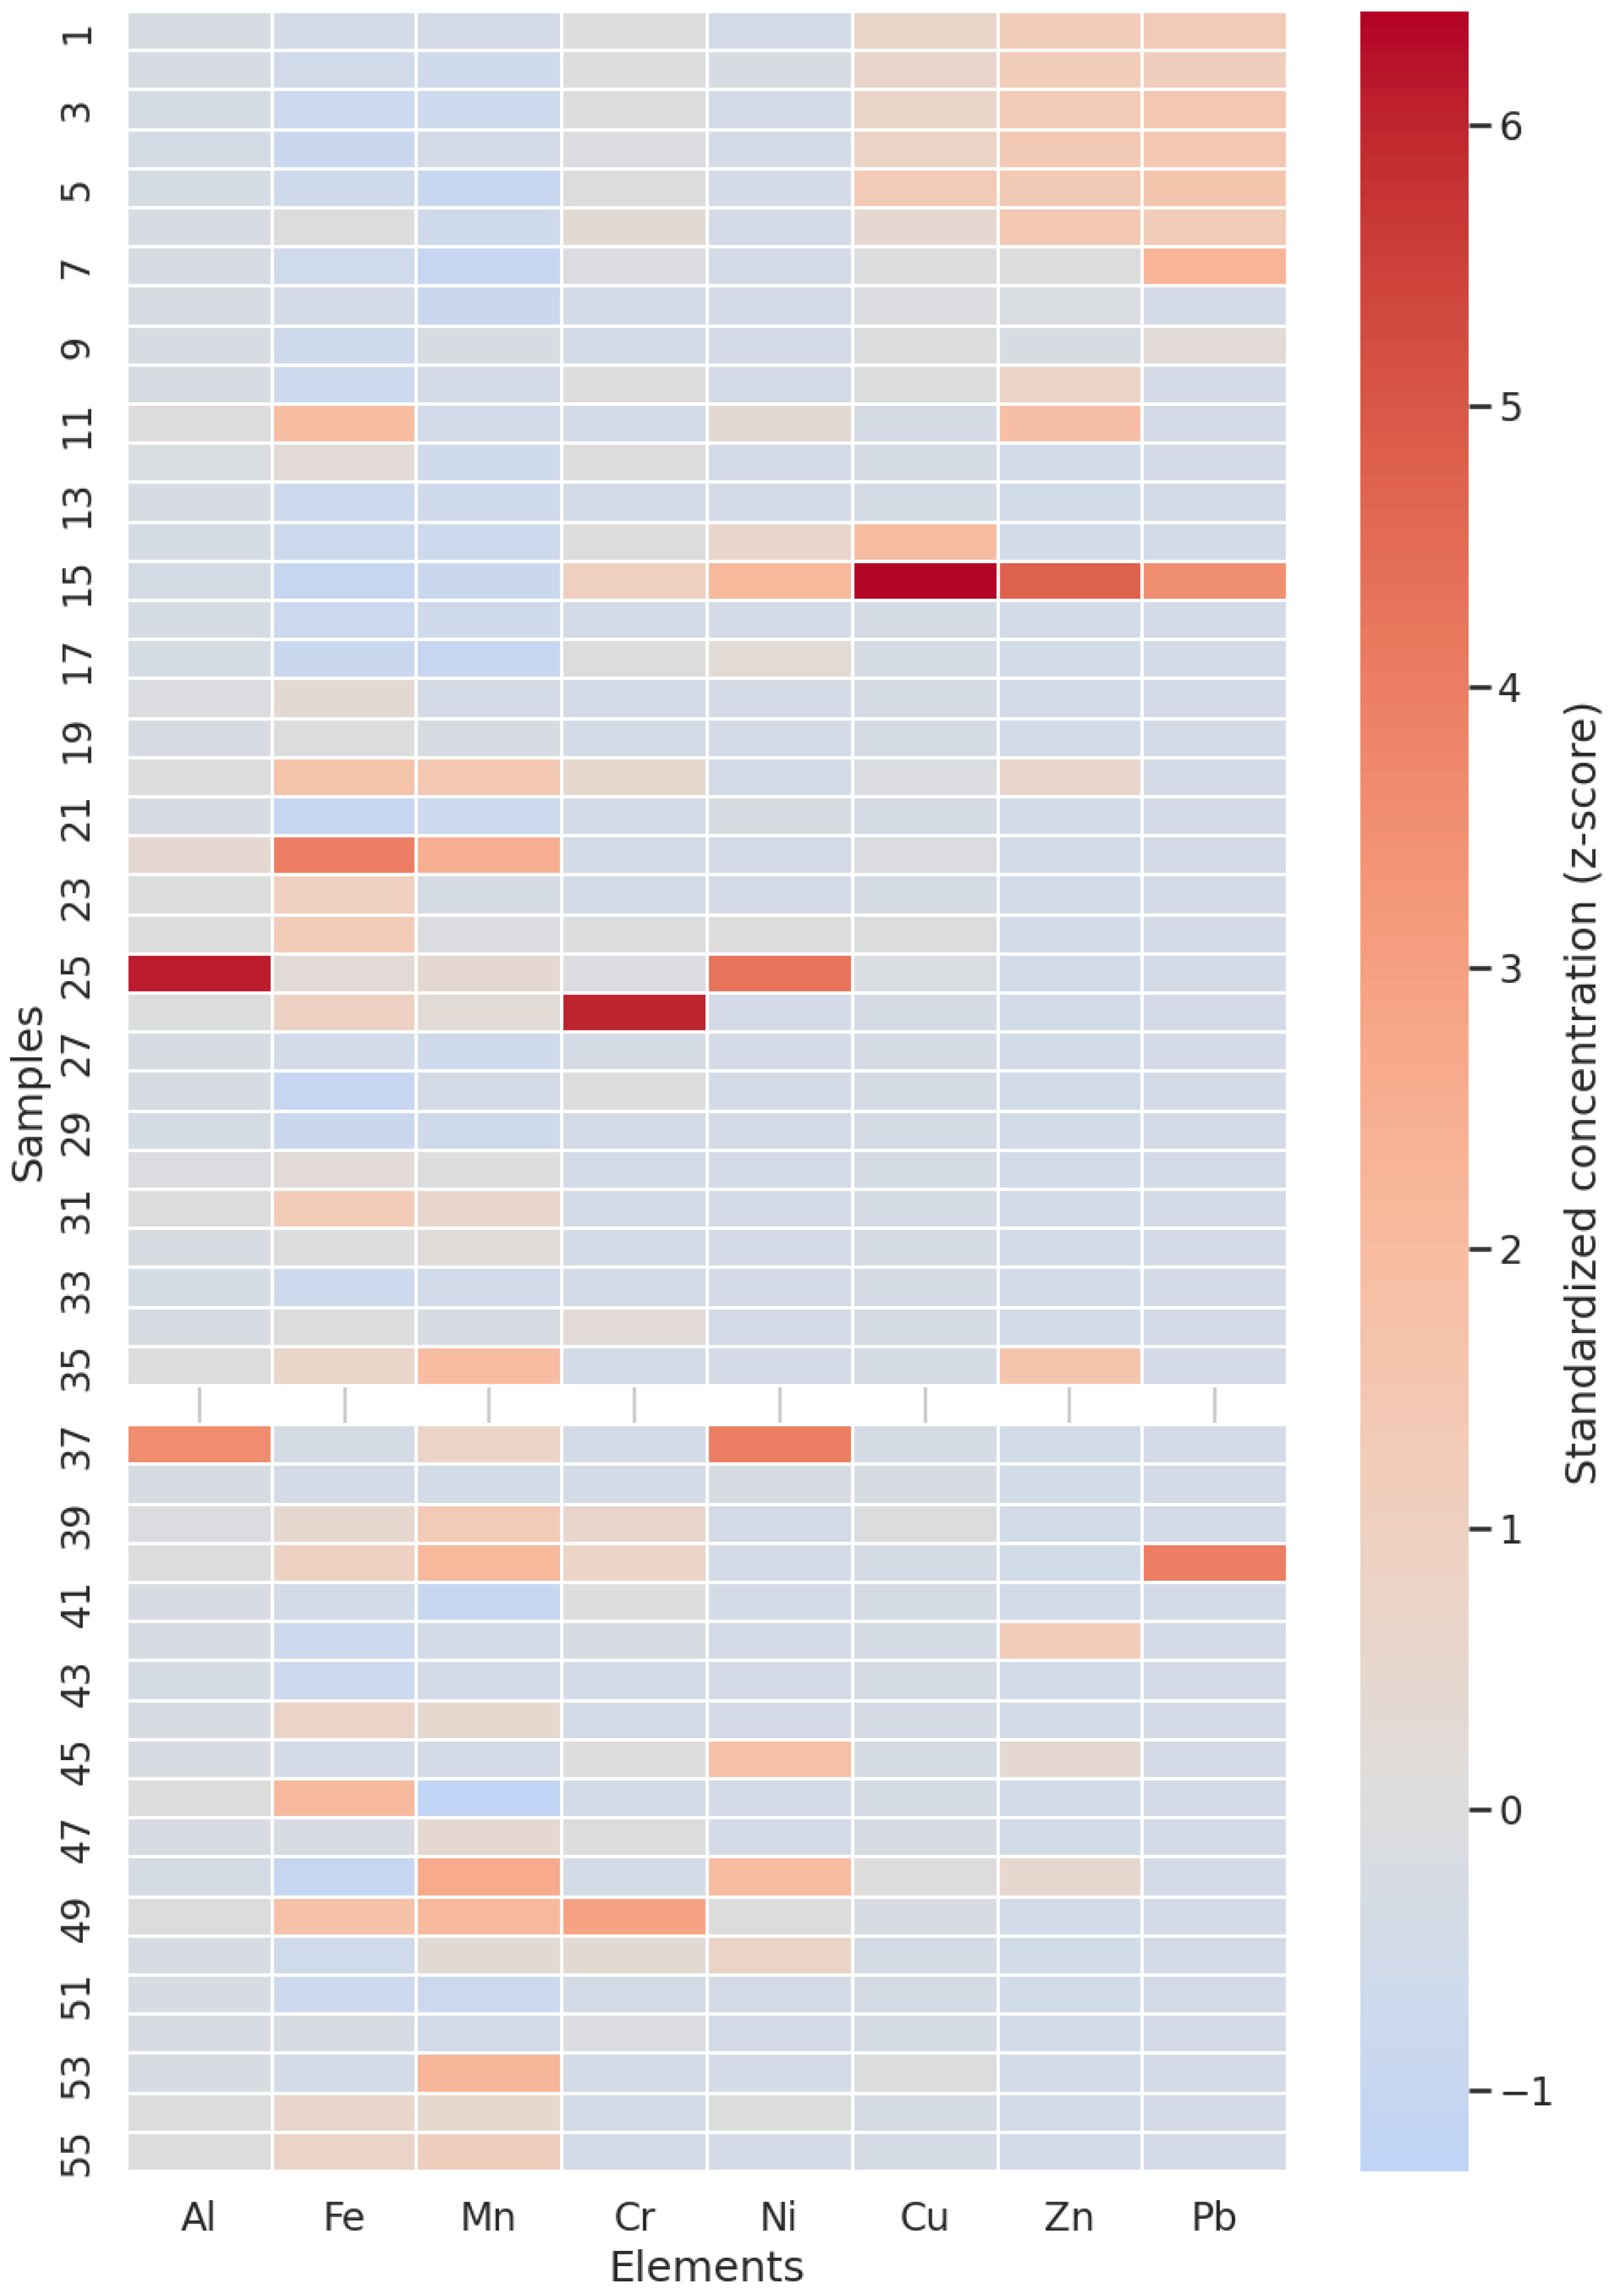
Figure 4 illustrates the distribution of element concentrations across the analyzed snowmelt samples and clearly demonstrates the heterogeneous nature of their accumulation. The heatmap reveals substantial inter-sample variability, with pronounced differences in concentration intensity both among individual elements and between sampling locations. This pattern indicates that the chemical composition of snowmelt in Pavlodar is strongly influenced by uneven deposition processes.
Figure 4.
Heatmap of elemental concentrations in snowmelt samples from Pavlodar.
The highest degree of variability was observed for Al, Fe, Zn, Cu, and Mn, whose concentrations fluctuated markedly from one sample to another. In several cases, elevated values of multiple elements occurred simultaneously within the same samples, forming localized geochemical anomalies. Such combined enrichment may reflect the influence of nearby anthropogenic sources, including industrial emissions, road dust resuspension, and urban aerosol deposition.
By contrast, some elements displayed relatively more moderate changes across the sampling set, although their distributions also remained non-uniform. The observed concentration contrasts suggest that pollutant deposition in the snow cover is controlled not only by emission intensity, but also by local environmental conditions such as wind regime, surface characteristics, and the position of sampling sites relative to emission sources.
In general, the heatmap confirms that the elemental composition of snowmelt is characterized by pronounced spatial heterogeneity and preserves distinct patterns of localized contamination within the urban environment.
3.3. Multivariate Elemental Structure: Spearman Correlation and Principal Component Analysis
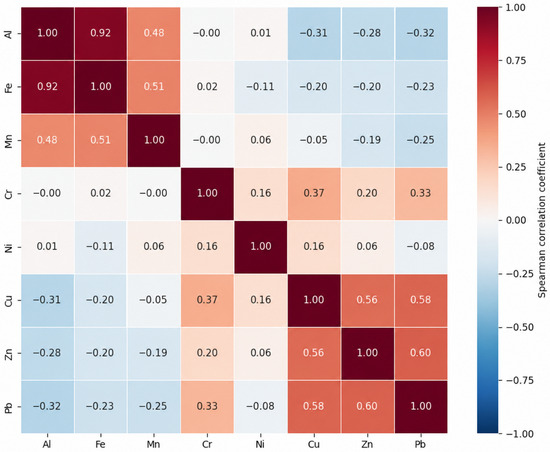
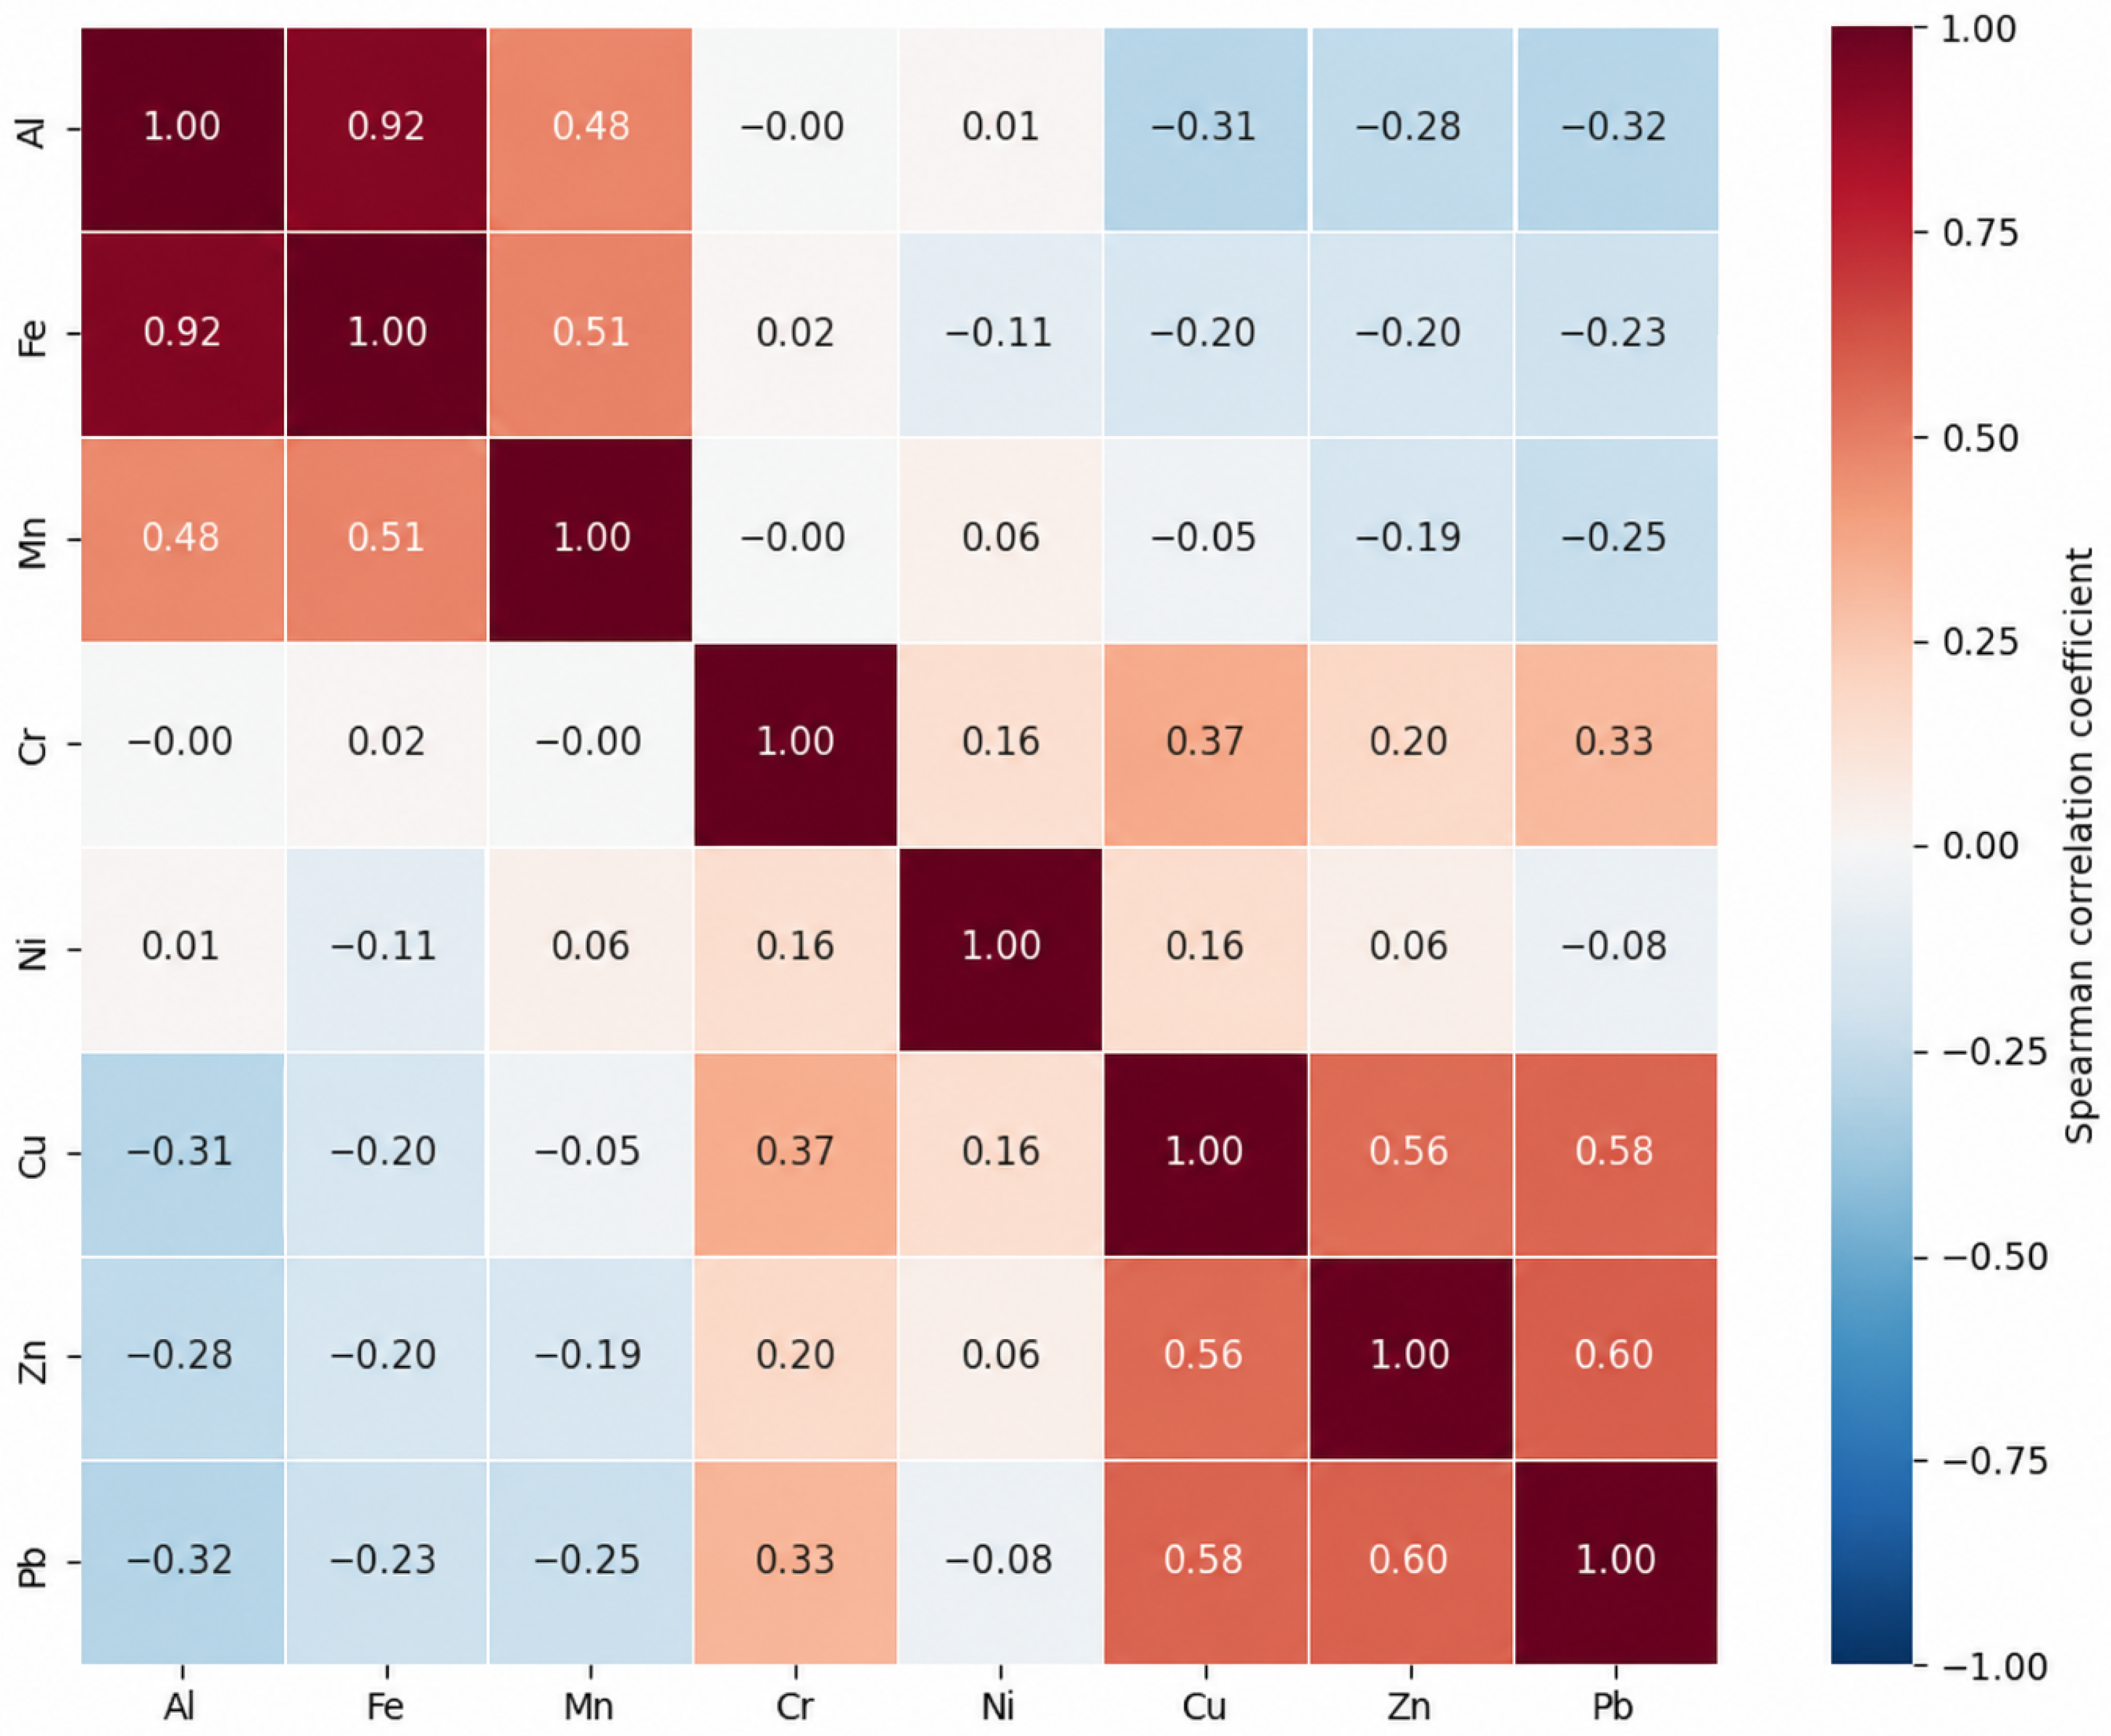
Figure 5 shows the clustered Spearman correlation matrix for the selected elements detected in the snowmelt samples. The analysis revealed several clear patterns of association. The strongest positive correlation was observed between Al and Fe (), while Mn also showed moderate positive relationships with Al () and Fe (). These results indicate a consistent co-variation of these elements across the analyzed samples.
Figure 5.
Clustered Spearman correlation matrix of selected elements in snowmelt samples collected in Pavlodar.
A second group of positive relationships was identified for Cu, Zn, and Pb. In particular, the correlations of Zn with Pb () and Cu (), as well as that of Cu with Pb (), indicate that these elements tended to increase together in a number of samples. Cr also showed moderate positive correlations with Cu () and Pb (), further supporting the presence of shared distribution patterns among these elements.
In contrast, Ni was only weakly correlated with the remaining elements, suggesting a relatively independent variability. At the same time, the matrix revealed several weak negative correlations between the Al–Fe–Mn cluster and the Cu–Zn–Pb cluster. This pattern reflects the non-uniform character of elemental associations in the snowmelt samples.
The hierarchical clustering structure shown in Figure 5 confirms the presence of several groups of interrelated elements. Overall, the results demonstrate that the elemental composition of snowmelt is characterized by distinct correlation patterns, indicating the heterogeneous nature of pollutant accumulation in the urban snow cover.
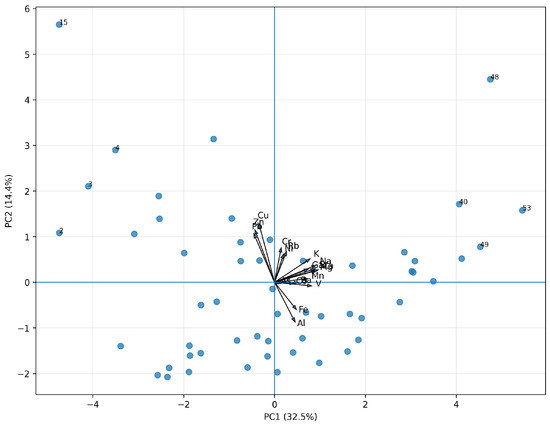
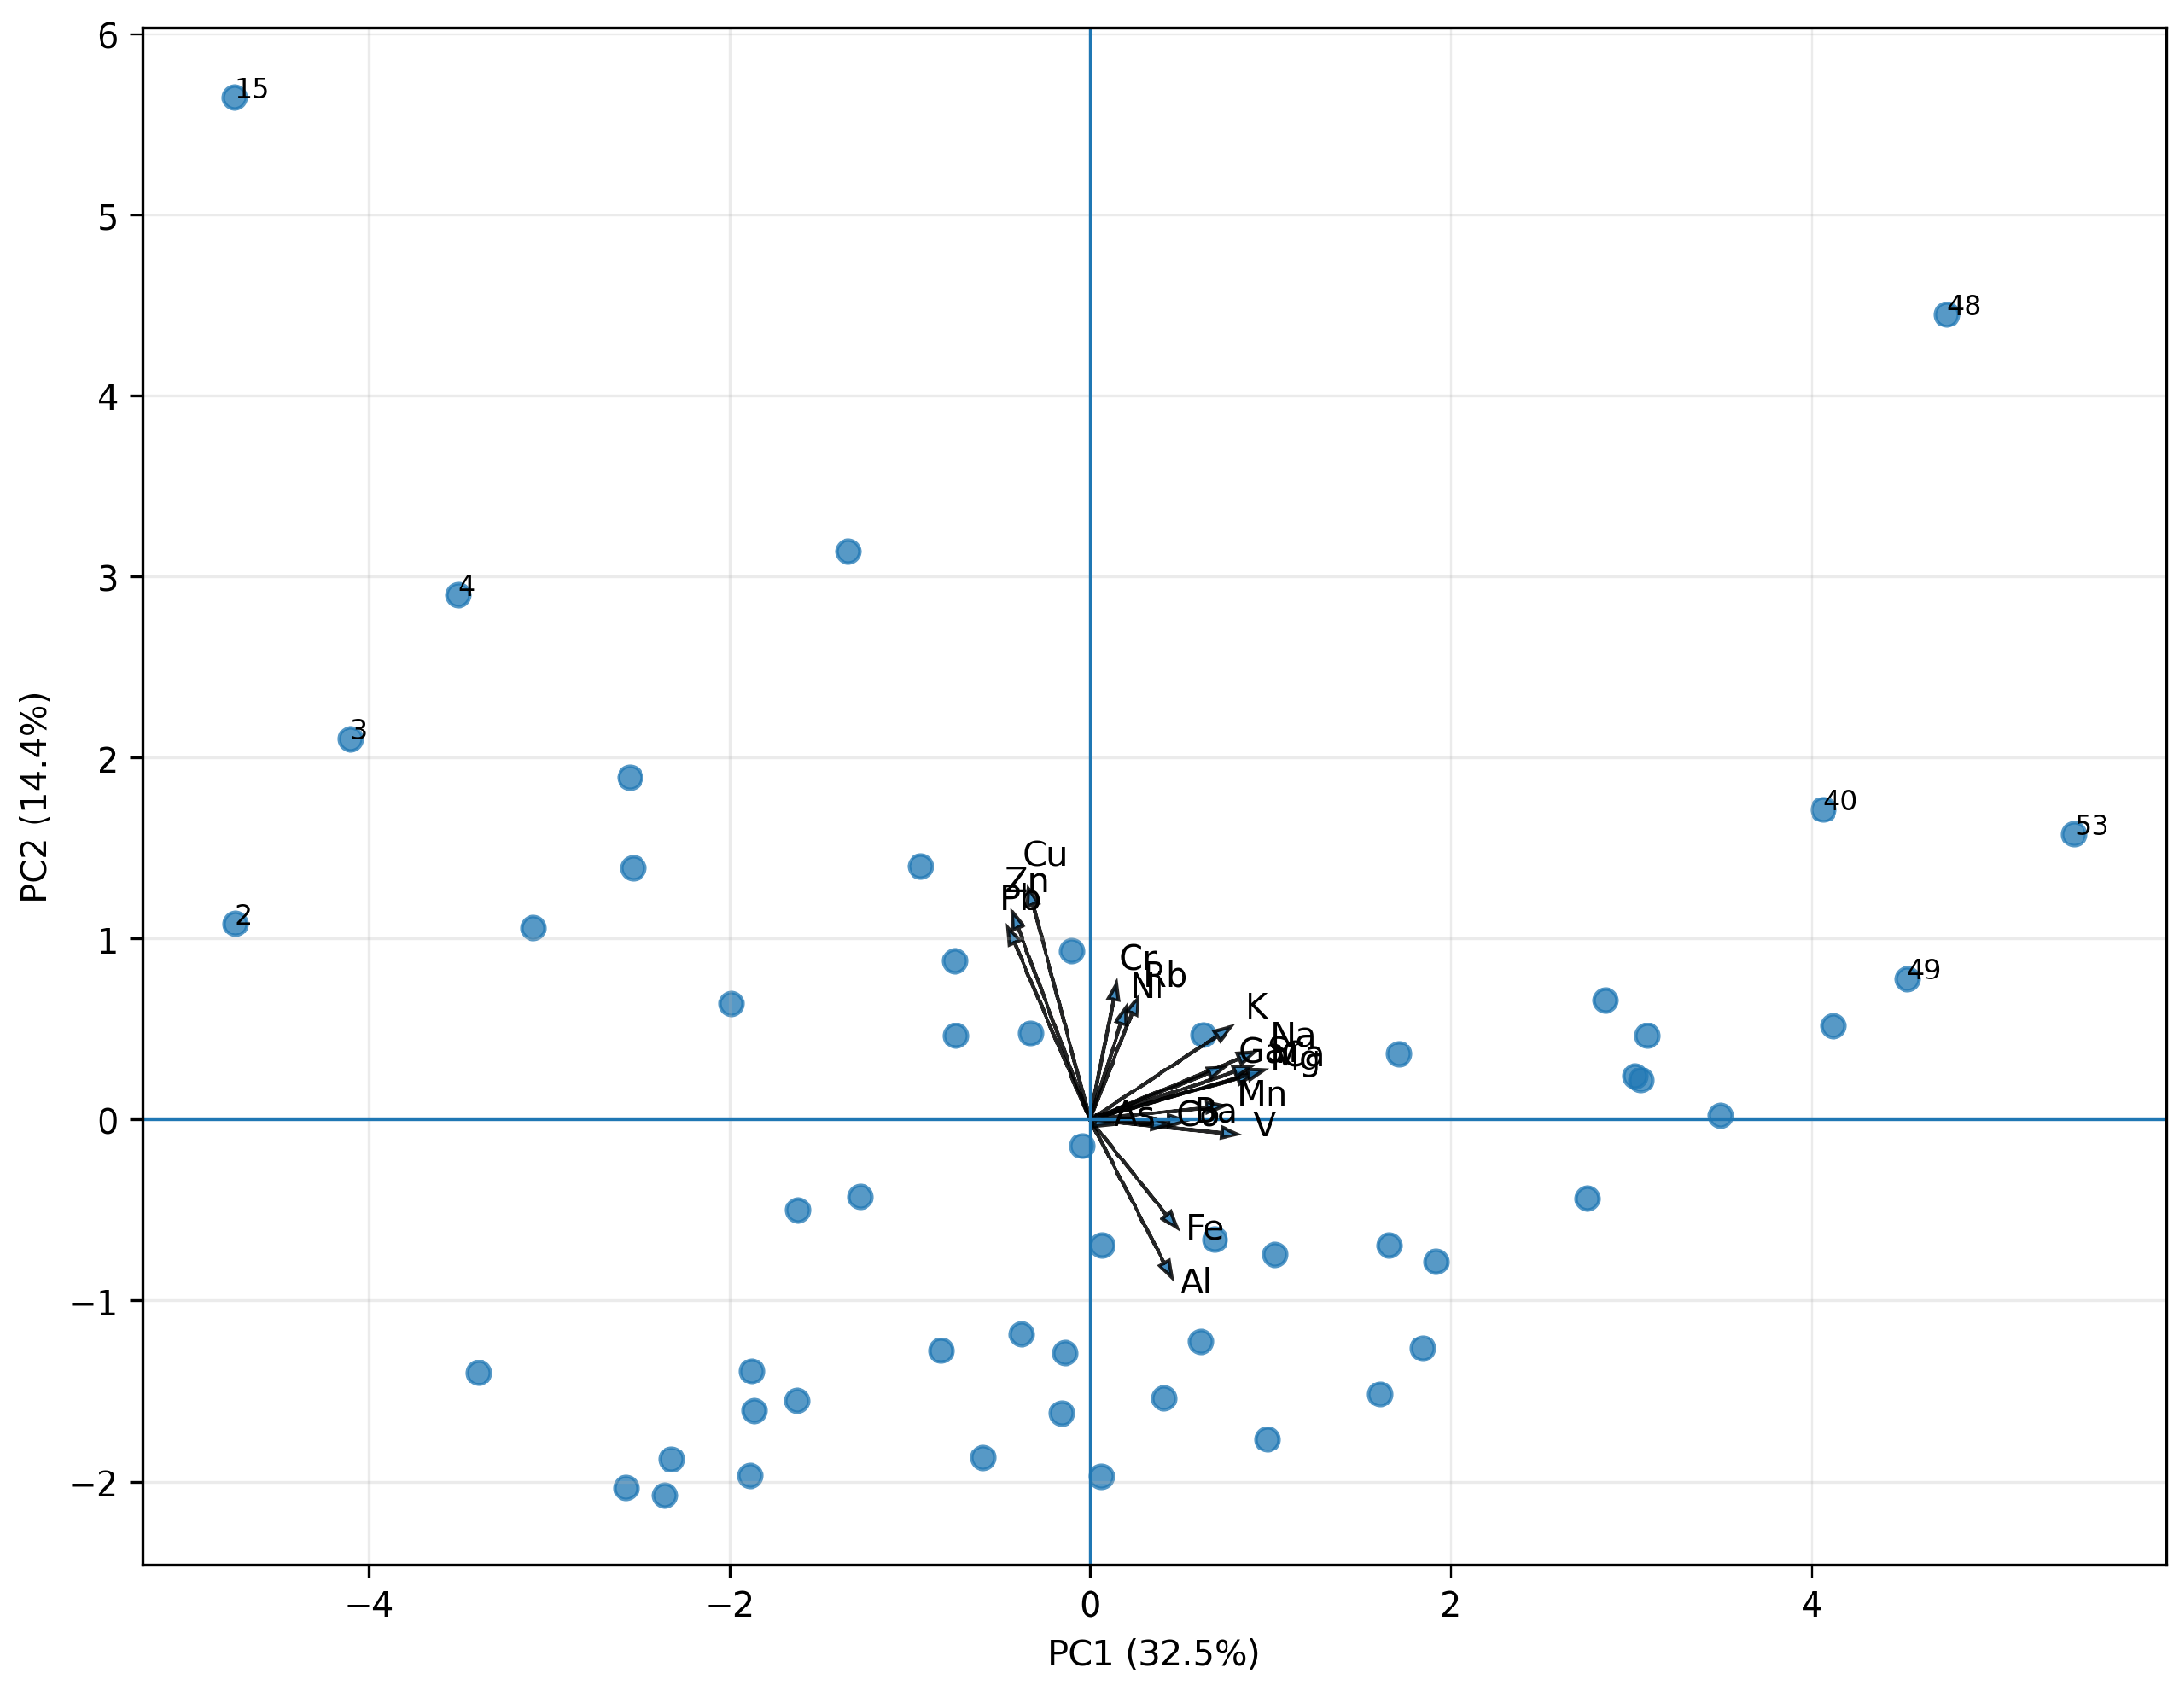
To complement the pairwise correlation analysis, principal component analysis (PCA) was performed using the original elemental concentration dataset for Pavlodar snowmelt samples. The resulting PCA biplot is shown in Figure 6. Values below the detection limit were replaced by one-half of the corresponding detection limit, after which the data were log-transformed using and standardized prior to PCA. Control or replicate samples marked as “PK” were not included in the PCA dataset.
Figure 6.
Principal component analysis (PCA) biplot of selected elemental concentrations in Pavlodar snowmelt samples. Points represent individual snow samples, while arrows indicate element loadings. The first two principal components explain 46.9% of the total variance, with PC1 accounting for 32.5% and PC2 for 14.4%.
The first two principal components explained 46.9% of the total variance, with PC1 accounting for 32.5% and PC2 accounting for 14.4%. PC1 was mainly associated with soluble and mineral-related elements, including Na, Ca, Mg, K, Sr, Mn, V and Ga. This component can be interpreted as a mixed mineral-dust and soluble-ion factor, reflecting the contribution of crustal particles, resuspended dust and soluble material accumulated in the snowpack.
PC2 showed a stronger association with trace metals such as Cu, Zn, Pb, Cr, Ni and Rb. This component indicates an urban-industrial trace-metal pattern, which may be related to mixed anthropogenic inputs, including industrial emissions, traffic-related particles and road-dust resuspension. The PCA therefore supports the interpretation that the snowmelt chemistry of Pavlodar is controlled by at least two overlapping factors: a mineral/soluble dust component and an anthropogenic metal-bearing component.
3.4. Elemental Associations and Integrated Pollution Structure
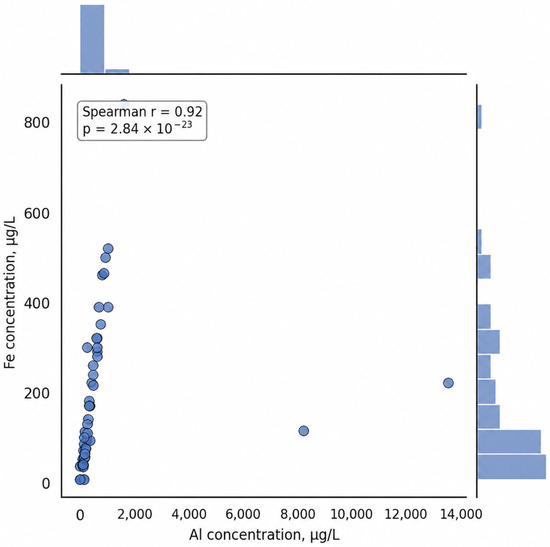
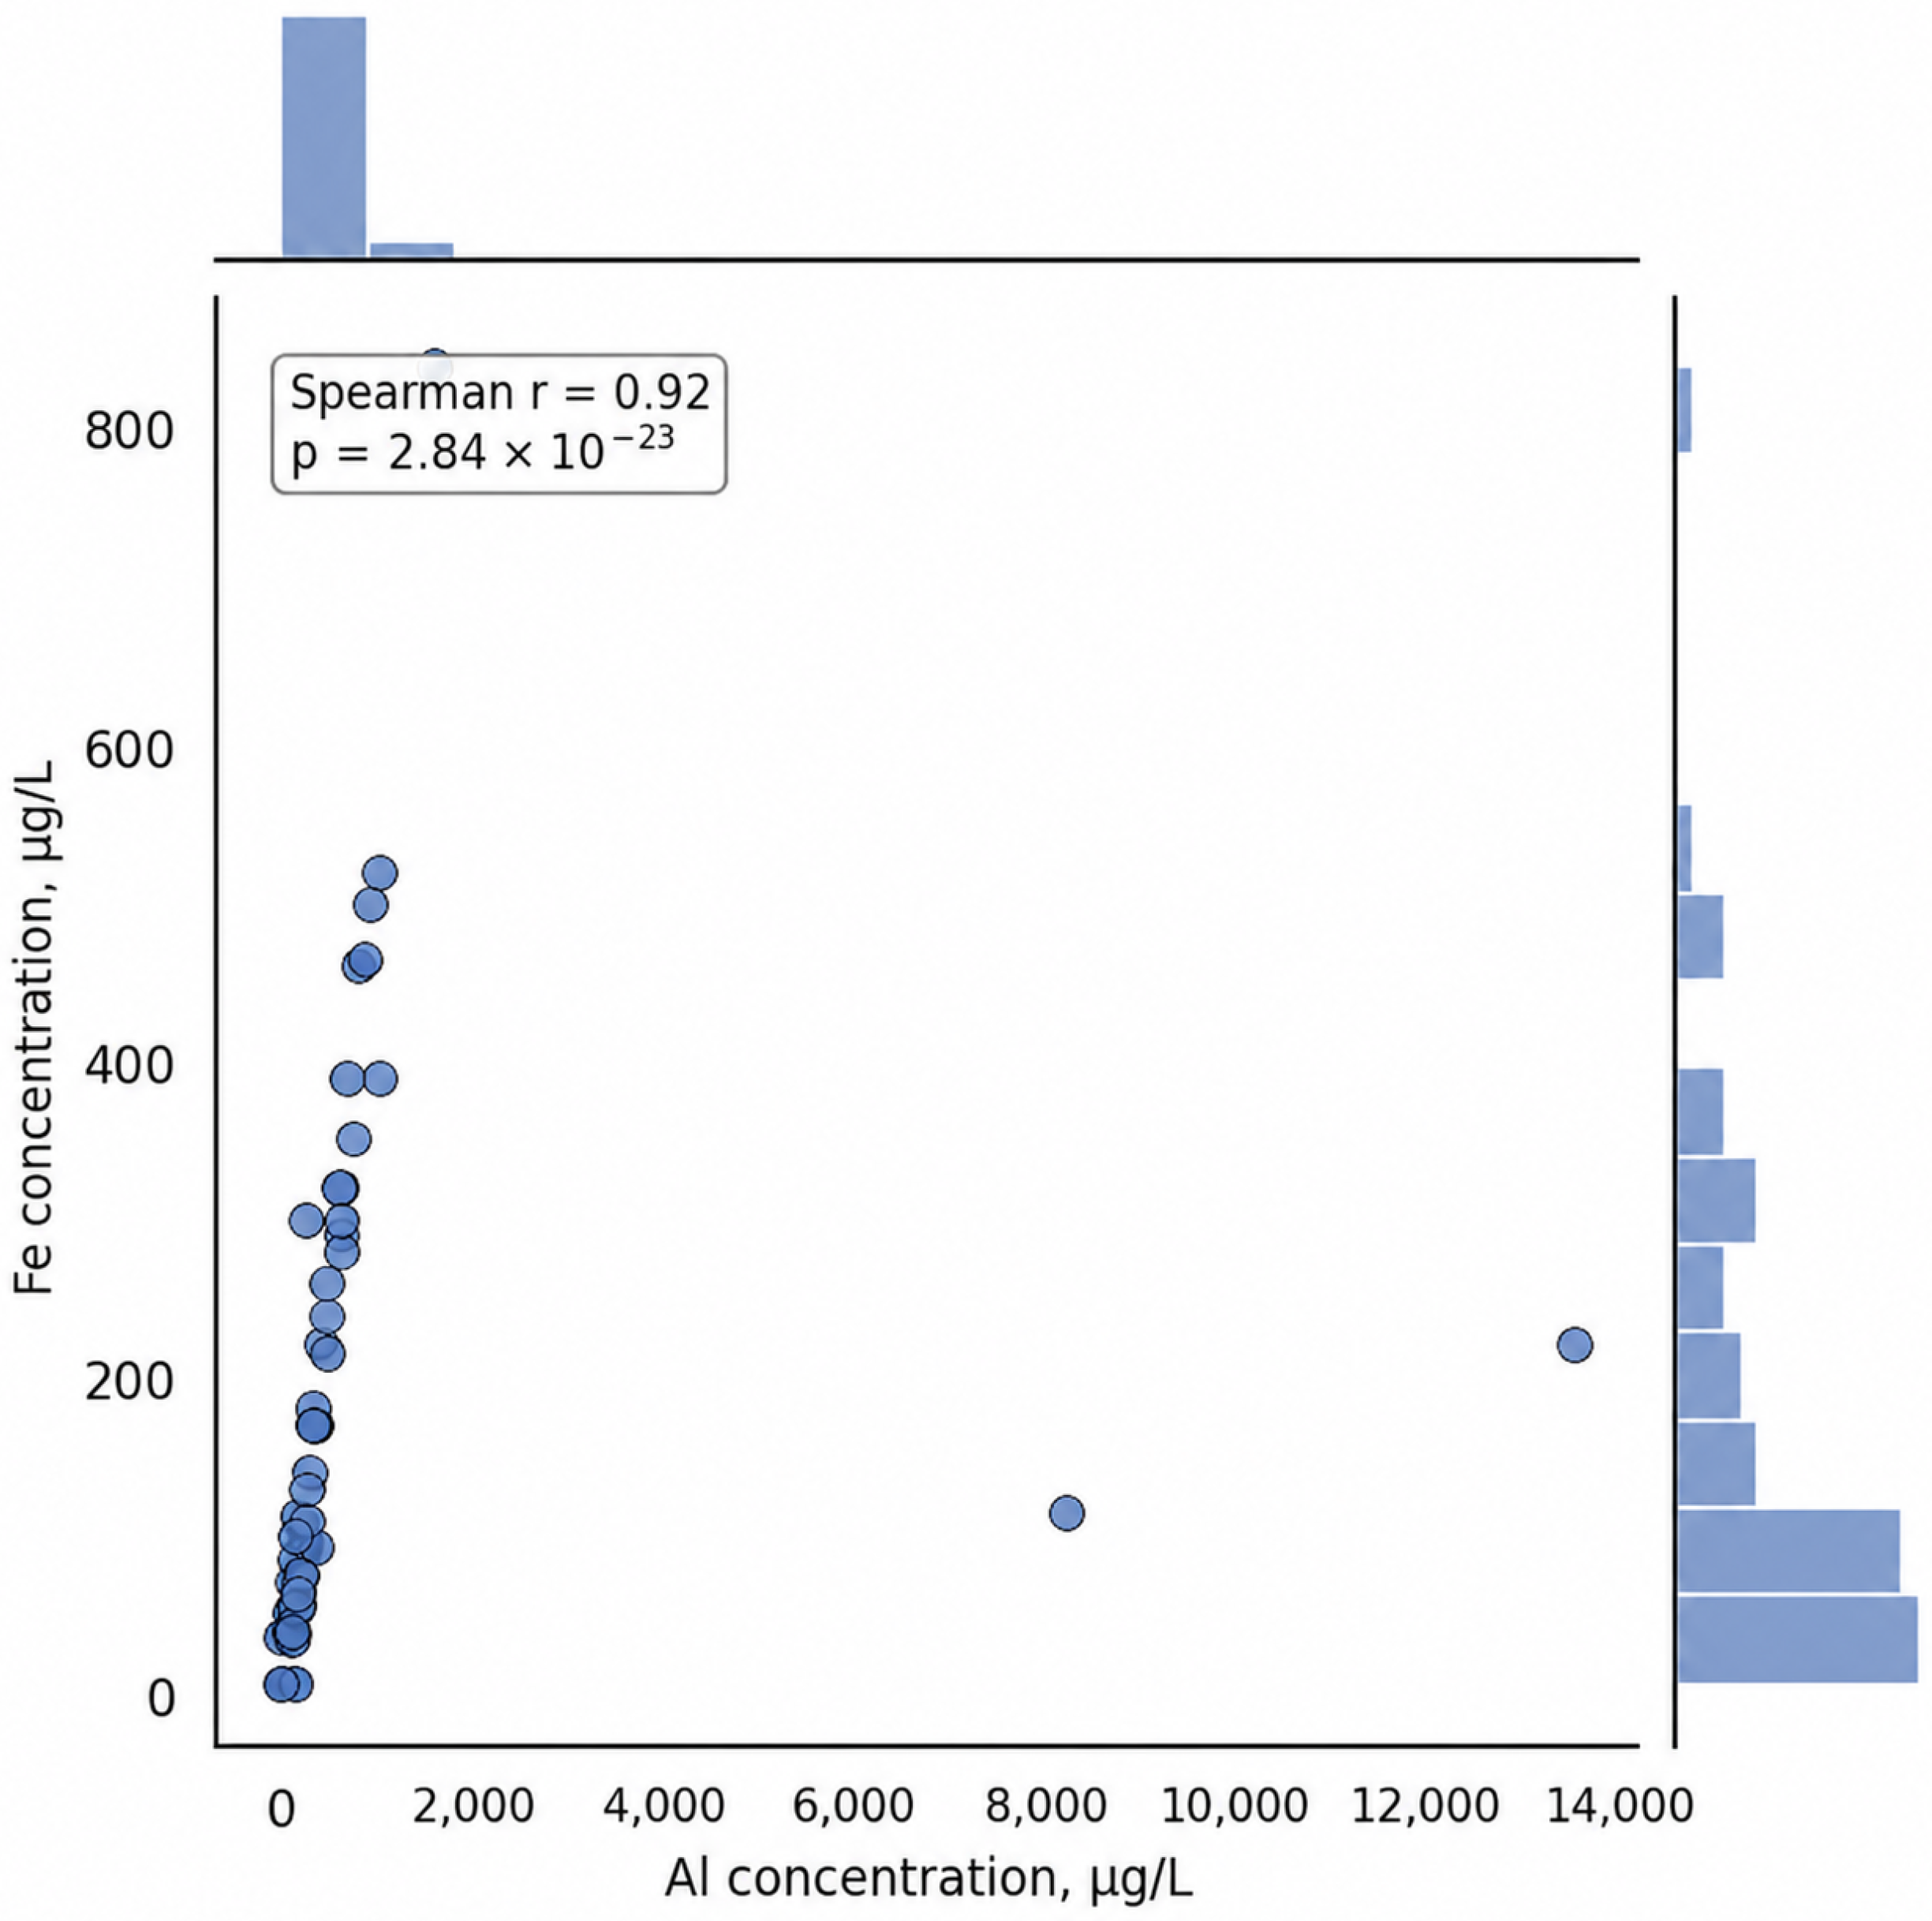
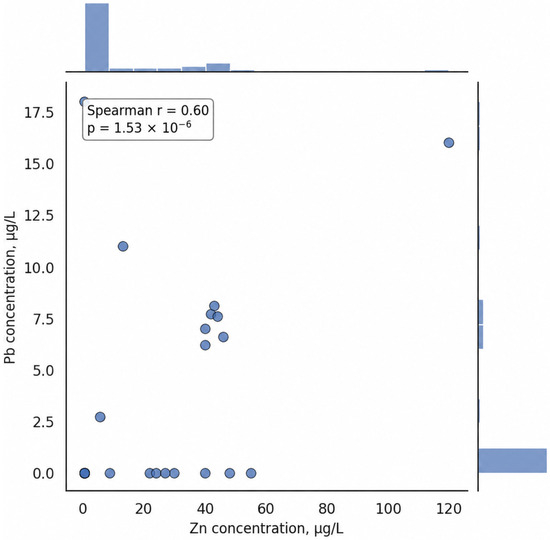
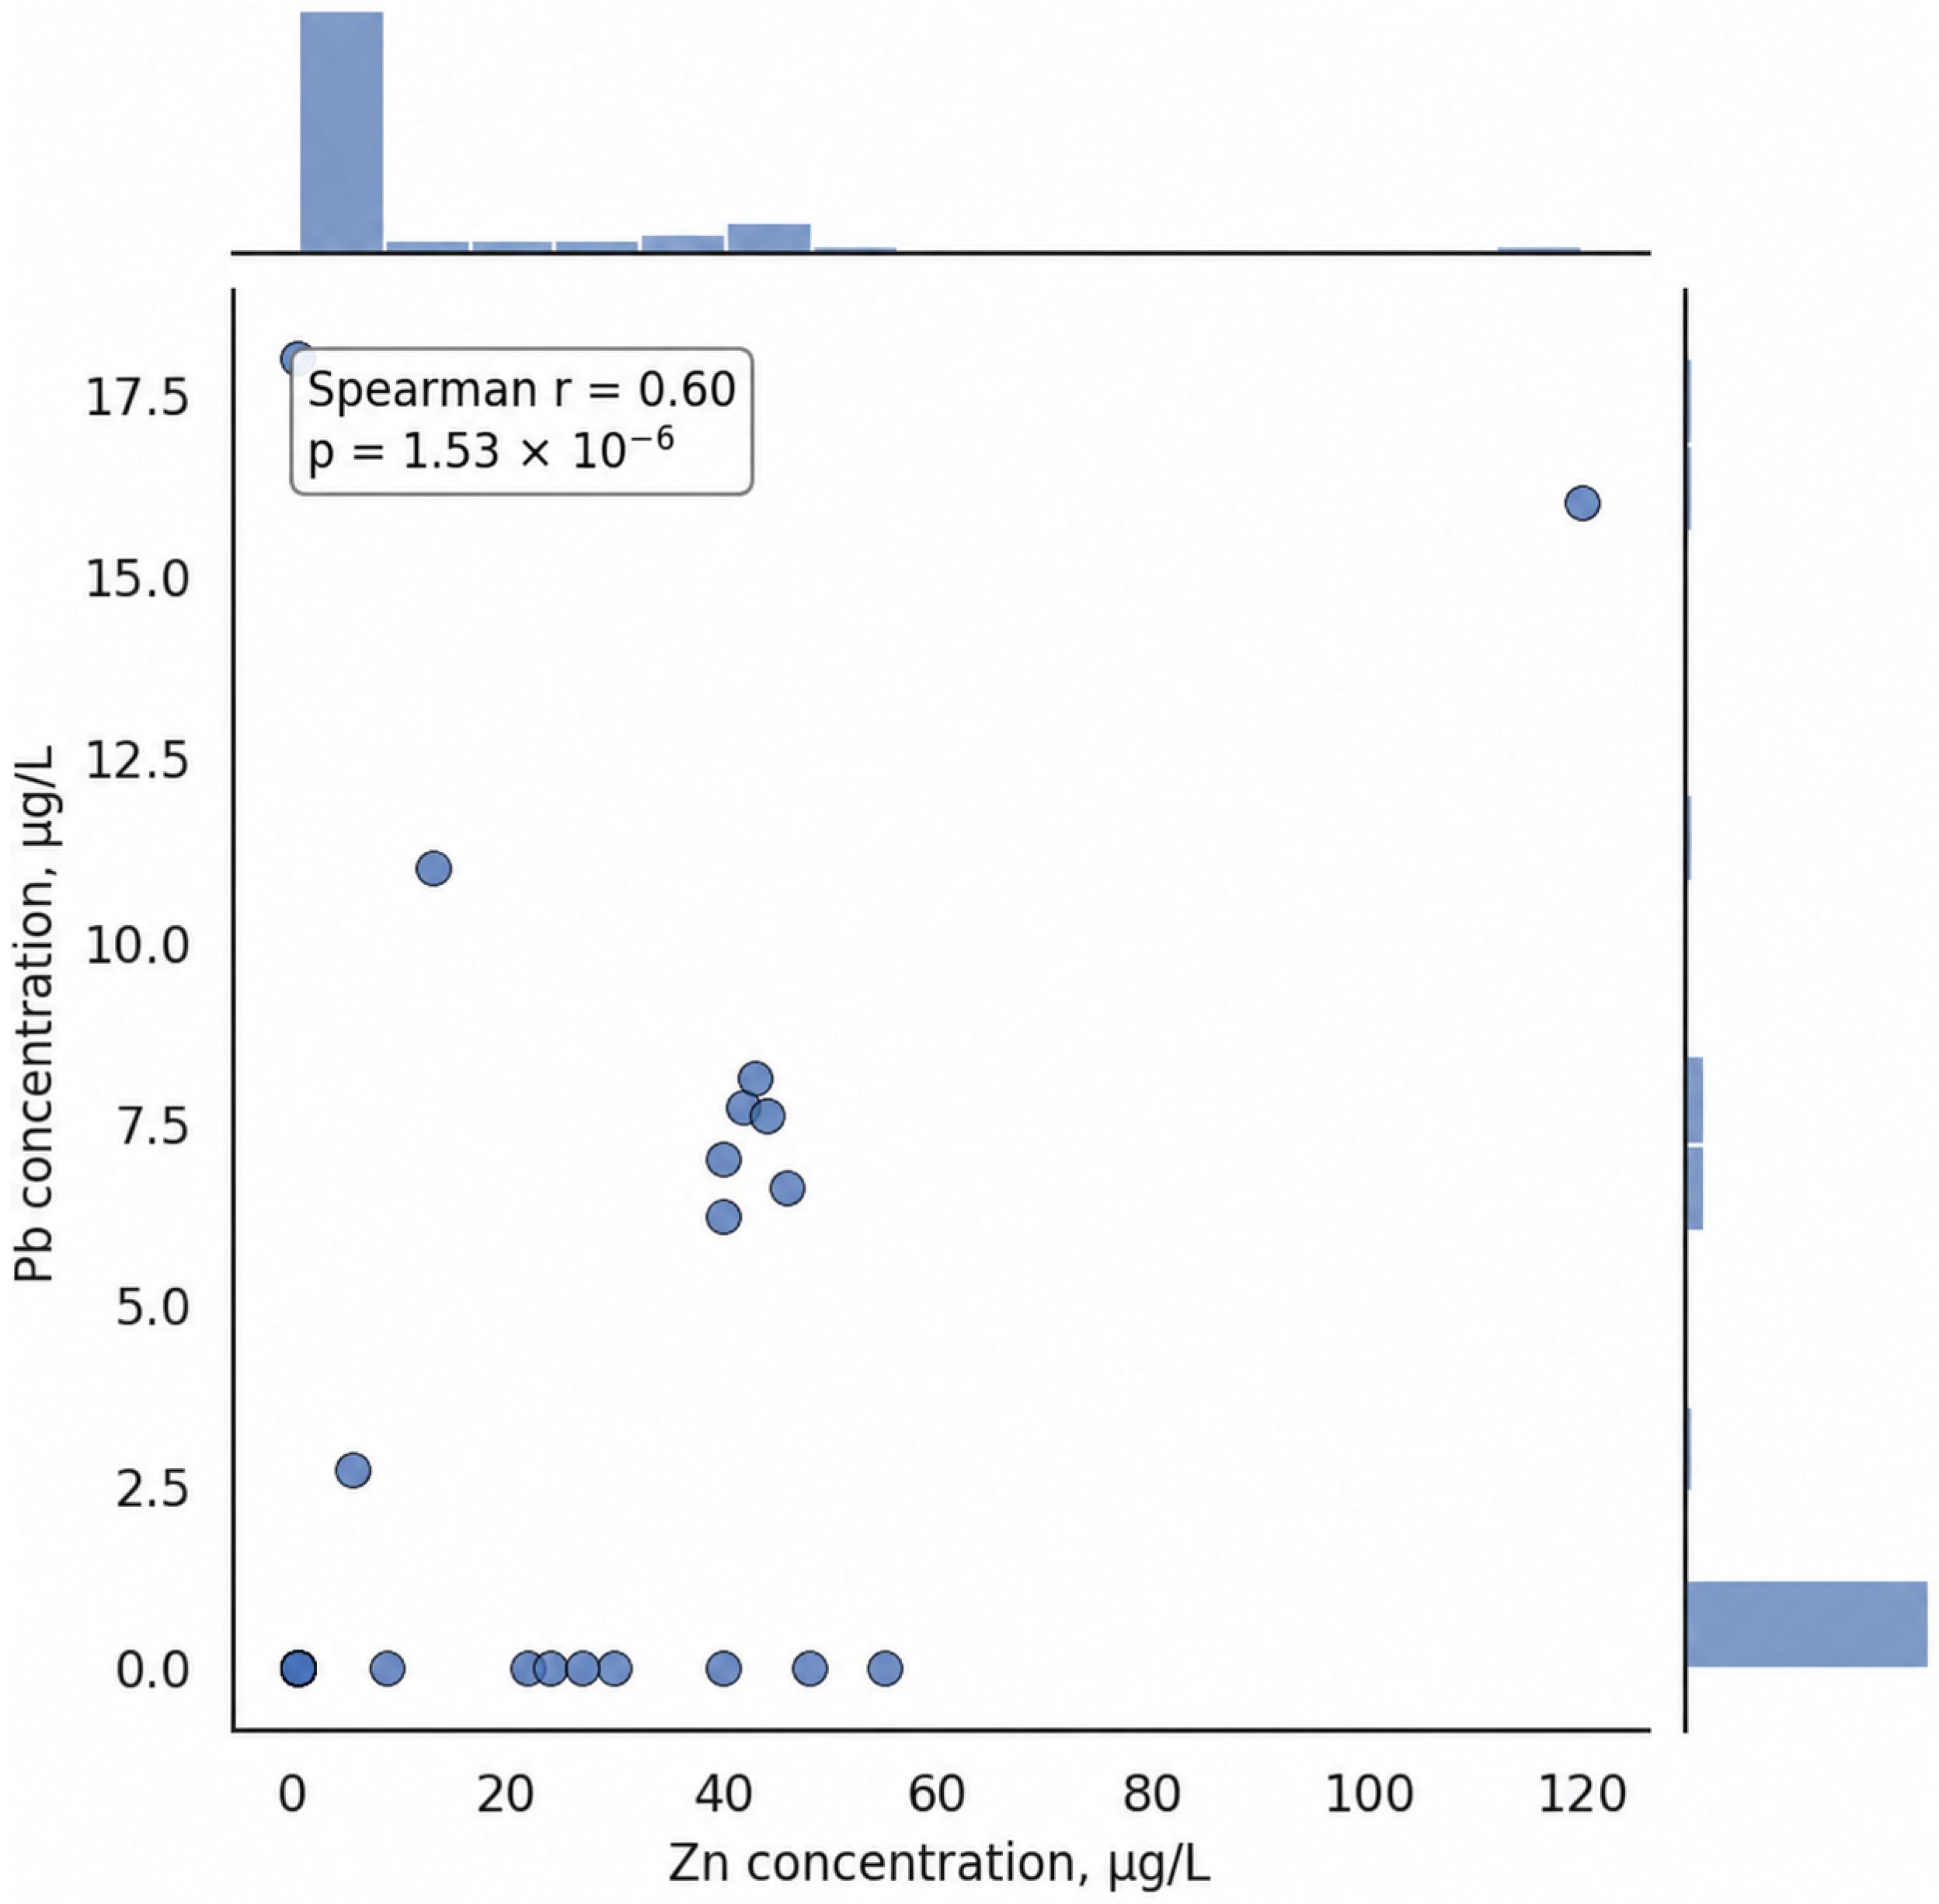
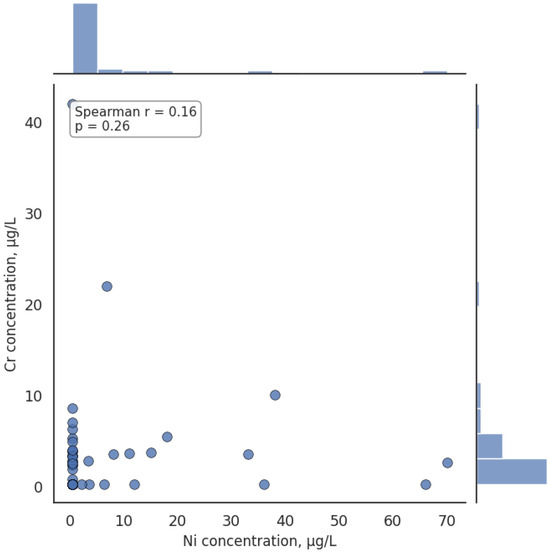
Figure 7, Figure 8 and Figure 9 illustrate representative pairwise relationships selected from the full correlation structure shown in Figure 5. These plots were not intended to repeat all possible element–element combinations, but to visualize three contrasting types of association identified by the correlation matrix: a strong lithogenic–industrial association (Al–Fe), a moderate urban-industrial metal association (Zn–Pb), and a weak or relatively independent relationship (Ni–Cr). The Cu-related relationships were interpreted within the Zn–Pb–Cu group in Section 3.3, where Cu showed positive correlations with Zn and Pb. Therefore, Cu was considered as part of the same urban-industrial association group rather than as an isolated pairwise case. As shown in Figure 7, the Spearman correlation coefficient reached , with , indicating a highly stable co-variation of these elements throughout the sample set. The compact arrangement of the data points and the pronounced monotonic trend suggest that Al and Fe were controlled by closely related accumulation processes.
Figure 7.
Scatter plot with marginal histograms showing the relationship between Al and Fe concentrations in snowmelt samples collected in Pavlodar.
Figure 8.
Scatter plot with marginal histograms showing the relationship between Zn and Pb concentrations in snowmelt samples collected in Pavlodar.
Figure 9.
Scatter plot with marginal histograms showing the relationship between Ni and Cr concentrations in snowmelt samples collected in Pavlodar.
A weaker but still statistically significant positive association was identified for Zn and Pb. Figure 8 shows that the Spearman correlation coefficient was , with . In this case, the scatter of observations was more substantial, yet the general positive trend remained evident. This pattern indicates that both elements tended to increase together in a subset of samples, pointing to a partial commonality in their deposition behavior.
The Zn–Pb relationship was interpreted together with the Cu correlations reported in Figure 5. The positive correlations of Cu with Zn and Pb indicate that Cu belongs to the same urban-industrial metal association group, although it was not shown as a separate pairwise scatter plot in order to avoid duplicating similar relationships.
By contrast, Ni and Cr showed only a weak and statistically insignificant relationship. According to Figure 9, the Spearman correlation coefficient was , while the probability value reached . Their dispersed distribution and the lack of a clear monotonic trend indicate that these elements were not systematically accumulated under the same conditions. This relative independence contrasts with the stronger associations observed for Al–Fe and Zn–Pb and further highlights the heterogeneous structure of elemental contamination in the snowmelt samples.
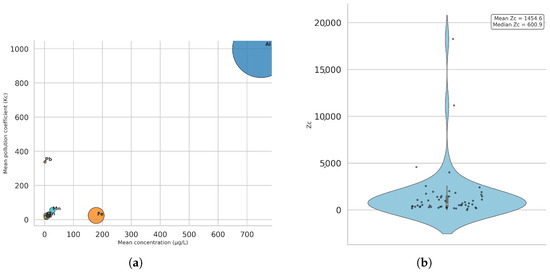
An integrated overview of snow pollution is presented in Figure 10. The bubble plot in Figure 10a demonstrates that the elemental contribution to contamination was highly uneven. Al had the highest mean pollution coefficient Kc, indicating the greatest enrichment relative to the adopted background value, while Pb also displayed a markedly elevated mean Kc despite its comparatively low mean concentration. In contrast, Fe showed a high mean concentration but a substantially lower pollution coefficient than Al, confirming that elevated absolute content does not necessarily correspond to the highest enrichment level.
Figure 10.
Integrated pollution structure of snowmelt samples collected in Pavlodar: (a) bubble plot of mean concentration versus mean pollution coefficient () for selected elements; (b) violin plot of the total pollution index ().
The violin plot of the total pollution index Zc, shown in Figure 10b, reveals a strongly asymmetric distribution, with the majority of samples concentrated in the lower part of the range and several extreme values extending the upper tail. This pattern suggests that the most severe pollution anomalies were confined to a limited number of samples. Taken together, Figure 7, Figure 8, Figure 9 and Figure 10 indicate that the snow cover in Pavlodar preserves both distinct pairwise elemental associations and a highly uneven integrated pollution pattern.
4. Discussion
The results of the present study demonstrate that snow cover in Pavlodar serves as an efficient accumulator of atmospheric pollutants and provides valuable information on the spatial structure of wintertime contamination. The detected elemental composition of the liquid phase of snow was characterized by substantial heterogeneity, indicating that the deposition of chemical elements across the urban area was not uniform. This pattern reflects the combined influence of natural mineral particles, urban dust, traffic-related emissions, and industrial activities, which together shape the geochemical signature of snow cover in an industrial city.
The zone-based comparison of selected diagnostic elements revealed that the territorial pattern of contamination was not uniform across Pavlodar. The clearest urban enrichment was observed for Fe and Cr, with urban/background median ratios of 1.8 and 1.3, respectively, indicating a stronger urban-industrial signal for these elements. In contrast, Al, Zn, Ni, Cu, and Mn did not show a simple urban-to-background increase. For several elements, background or suburban medians were comparable to, or higher than, urban medians, suggesting that the spatial structure of snow contamination was controlled not only by distance from the city center but also by local emission sources, wind-driven transport, road-dust resuspension, and site-specific surface conditions. Therefore, the established territorial pattern can be described as localized and element-specific rather than as a uniform city-wide gradient.
A prominent feature of the obtained dataset was the contrast between relatively abundant lithogenic elements and trace metals with elevated pollution coefficients. The high concentrations of Al and Fe suggest an important contribution of crustal and dust-derived material, which may originate from soil particles, road dust, ash residues, and industrial particulate matter. At the same time, the elevated contributions of Pb, Zn, Ni, Cu, and Cr indicate the presence of anthropogenic enrichment superimposed on the natural background. Such elements are widely regarded as indicators of technogenic impact in urban environments, particularly in regions influenced by metallurgical activity, fossil fuel combustion, traffic emissions, and the resuspension of contaminated particles [14]. Therefore, the observed chemical pattern suggests that snow cover in Pavlodar reflects a mixed lithogenic–anthropogenic pollution regime.
The variability of elemental concentrations among samples is also important for interpretation. The relatively high coefficients of variation calculated for several elements indicate pronounced spatial heterogeneity in the deposition process. This suggests that pollutant accumulation in snow was controlled not only by regional atmospheric transport but also by local emission sources and site-specific conditions. In practical terms, this means that contamination in the study area was concentrated in certain locations rather than distributed evenly across the city. Such heterogeneity is typical of industrial urban environments, where emission plumes, traffic intensity, land-use patterns, and microclimatic factors may strongly influence the local deposition of pollutants [15].
The analysis of pairwise elemental relationships provides additional insight into possible source associations. The relationship between Al and Fe may reflect a common origin linked to mineral dust, soil-derived particles, or industrial dust input [16]. In contrast, the associations observed for Zn and Pb, as well as for Ni and Cr, may point to shared anthropogenic sources, including industrial emissions and combustion-related processes [17]. These relationships do not by themselves prove source identity; however, they support the interpretation that the elemental composition of snow cover is governed by multiple overlapping inputs. Thus, the correlation structure reinforces the conclusion that the winter atmospheric environment of Pavlodar is influenced by both natural and technogenic factors.
The pollution indices further clarify the structure of contamination. The calculated concentration coefficients showed that not all elements contributed equally to the overall pollution signal. Some elements displayed relatively moderate concentrations but high enrichment relative to background values, which is environmentally important because enrichment is often more informative than absolute abundance when assessing anthropogenic impact. The integrated pollution index revealed a strongly uneven distribution among sampling sites, with a right-skewed pattern indicating that a limited number of locations experienced especially high total pollution loads. This result suggests the existence of local hotspots of atmospheric deposition, which may be associated with specific industrial zones, transport corridors, or areas with enhanced dust accumulation.
These findings are consistent with the general conclusion of previous snow geochemistry studies showing that urban snow cover acts as a temporary sink for airborne contaminants during the cold season. In industrial cities, snow is widely recognized as an informative seasonal medium for identifying atmospheric deposition patterns, tracing heavy metal accumulation, and detecting zones of increased environmental pressure. Similar studies have shown that elevated concentrations of trace elements in snow are often associated with mixed industrial and urban sources, while high spatial variability reflects the localized nature of pollutant emissions and deposition. In this context, the present results fit well within the broader understanding of snow cover as an indicator of winter air pollution in technogenically transformed environments.
The Zn–Pb–Cu association supports a mixed urban-industrial interpretation, with possible contributions from traffic-related particles, road dust, and industrial aerosol inputs. However, this pattern should not be interpreted as evidence of a single source, because these elements may originate from several overlapping urban and industrial processes. Moghadas et al. showed that Zn, Cu, Pb, Cd, and Ni are among the most frequently studied metals in urban snow and snowmelt, and that traffic-related activities, road dust, and vehicle-derived particles can substantially influence the metal composition of roadside snow [18]. Therefore, the positive relationships observed among Zn, Pb, and Cu in Pavlodar should be interpreted as evidence of a shared urban-industrial association rather than as proof of a single emission source.
The environmental significance of snow contamination is not limited to the winter accumulation period. Vlasov et. al. demonstrated that snow cover can influence runoff geochemistry during the spring melt period, particularly with respect to Cu, Zn, Cd, and Pb [19]. This is relevant for Pavlodar because accumulated elements in the snowpack may be transferred during snowmelt into roadside soils, urban drainage systems, and surface runoff. Thus, localized high values of pollution coefficients and the total pollution index should be considered not only as indicators of winter atmospheric deposition, but also as potential markers of seasonal redistribution of contaminants within the urban environment.
The observed enrichment pattern in Pavlodar is also consistent with previous snow-cover studies in urban and industrial regions. For example, Moskovchenko et al. reported that melted snow from an urban-industrial area in Starachowice, Poland, contained increased concentrations of Fe, Al, Zn, and Mn, confirming that snow cover can accumulate particulate pollutants acting as carriers of heavy metals [20]. In the present study, the relatively high variability of Al and Fe similarly indicates the important role of mineral and industrial dust inputs, whereas the enrichment of Zn, Pb, Cu, Ni, and Cr reflects additional anthropogenic contributions.
The present study did not include a quantitative ecological or human health risk assessment because the dataset was designed to characterize elemental accumulation in snowmelt and pollution-index-based enrichment rather than direct exposure pathways. Snowmelt concentrations alone are insufficient for a complete health-risk calculation, which would require exposure scenarios, intake rates, bioavailability assumptions, and receptor-specific parameters. Therefore, the environmental significance of the results is discussed in terms of potential contaminant redistribution during snowmelt, while quantitative ecological and health risk assessment should be addressed in future studies using coupled snow–soil-runoff data.
At the same time, the present study has several limitations that should be acknowledged. First, the dataset represents a specific seasonal snapshot and therefore does not capture interannual or full seasonal variability in atmospheric deposition. Second, although the analysis reveals clear patterns of enrichment and spatial heterogeneity, it does not provide direct source apportionment based on isotopic, mineralogical, or emission inventory data. Third, the interpretation of the concentration coefficient depends on the selected background values, which may influence the magnitude of the calculated enrichment. These limitations do not reduce the value of the obtained results, but they indicate that the conclusions should be interpreted as an evidence-based assessment of pollution patterns rather than as a final quantitative attribution of all sources.
Future research should expand this approach in several directions. Multi-season and multi-year sampling would allow a more robust assessment of temporal variability and the stability of pollution hotspots. A denser spatial network would improve the resolution of contamination patterns within the city. In addition, the combination of snow chemistry with meteorological analysis, land-use information, and multivariate statistical methods would strengthen source identification and help distinguish between industrial, traffic-related, and lithogenic inputs. Finally, further studies should evaluate the potential transfer and transformation of accumulated pollutants during snowmelt in order to better assess the environmental consequences of seasonal contaminant redistribution in urban ecosystems.
Overall, the results indicate that snow cover in Pavlodar is a sensitive and informative indicator of atmospheric deposition and urban geochemical pressure. The observed elemental composition, enrichment patterns, and integrated pollution indices collectively demonstrate that winter snow can be used as an effective tool for identifying contamination structure, detecting local hotspots, and supporting environmental monitoring in industrial cities.
5. Conclusions
This study demonstrated that snow cover in Pavlodar is an informative indicator of atmospheric deposition and urban environmental pressure during the winter season. The chemical composition of the liquid phase of snow was characterized by substantial spatial heterogeneity, reflecting the uneven distribution of pollutants across the city.
The obtained results showed that both major elements and trace metals contributed to the geochemical structure of snow contamination. Elevated enrichment factors and pollution coefficients for several elements indicated a pronounced anthropogenic influence superimposed on the natural background. The relationships between selected elements suggested that the observed contamination pattern was controlled by a combination of lithogenic material, urban dust, traffic-related emissions, and industrial inputs.
The calculated pollution indices confirmed that contamination was not uniformly distributed among sampling sites. In particular, the integrated pollution index revealed the presence of localized hotspots with increased total pollution load. This finding is environmentally significant because it indicates areas where accumulated pollutants may represent a potential source of contaminant redistribution during snowmelt, including possible transfer to soils, runoff, and urban surface environments.
Overall, this study confirms that snow geochemistry can be effectively used to assess wintertime atmospheric pollution in industrial cities. The proposed approach makes it possible to identify elemental accumulation patterns, evaluate the degree of contamination, and detect areas of elevated technogenic impact. Further research should focus on multi-season monitoring, expanded spatial coverage, and improved source identification in order to better understand the processes controlling pollutant deposition and redistribution in urban ecosystems.
Author Contributions
Conceptualization, Z.A., B.Z. and A.N.; methodology, Z.A., B.Z., A.N. and M.N.; software, Z.A. and A.N.; data curation, Z.A. and A.N.; formal analysis, Z.A. and A.N.; modeling, Z.A. and A.N.; visualization, Z.A. and A.N.; investigation, B.Z., M.N., Z.K., P.Y., S.S. and A.M.; field sampling, B.Z., Z.K., P.Y., S.S. and A.M.; instrumental analysis, M.N., A.M., P.Y. and S.S.; writing—original draft preparation, Z.A. and A.N.; writing—review and editing, Z.A., B.Z., A.N. and Z.K.; supervision, B.Z. All authors have read and agreed to the published version of the manuscript.
Funding
This work was supported by program-targeted funding from the Ministry of Science and Higher Education of the Republic of Kazakhstan (IRN BR27101493), under the project “Development of a strategy for reducing air pollution in industrial cities of Kazakhstan, based on identifying the distribution of pollution sources”.
Institutional Review Board Statement
Not applicable.
Informed Consent Statement
Not applicable.
Data Availability Statement
The data supporting the findings of this study are included within the article.
Conflicts of Interest
The authors declare no conflicts of interest.
References
- Abdollahi, S.; Hassanzadeh, N.; Sohrabi, M.; Loppi, S. Biomonitoring of potentially toxic elements in the urban atmosphere of Tehran metropolis using the lichen Anaptychia setifera (Mereschk.) Räsänen. Atmosphere 2025, 16, 206. [Google Scholar] [CrossRef]
- Faurat, A.; Yessimova, D.; Satybaldiyeva, G.; Kuatbayev, A.; Utarbayeva, A.; Kaliyeva, A.; Akhmetov, K.; Khan, S.M.; Ahmad, Z.; Rakhmanov, S. Assessing the spatial distribution and sources of heavy metal pollution in the snow cover: A case study from Pavlodar, northeastern Kazakhstan. PLoS ONE 2025, 20, e0322300. [Google Scholar] [CrossRef] [PubMed]
- Hu, Q.; Zhang, C.; Chen, Y.; Pei, N.; Zhao, Y.; Sun, L.; Lan, J.; Liu, F.; Guo, Z.; Mu, L.; et al. Concentration characteristics, source analysis, and health risk assessment of water-soluble heavy metals in PM2.5 during winter in Taiyuan, China. Atmosphere 2025, 16, 980. [Google Scholar] [CrossRef]
- Jiang, S.; Dong, X.; Han, Z.; Zhao, J.; Zhang, Y. Emissions and atmospheric dry and wet deposition of trace metals from natural and anthropogenic sources in mainland China. Atmosphere 2024, 15, 402. [Google Scholar] [CrossRef]
- Kujawska, J. Concentration and risk assessment of metals in snow cover monitoring in urban and rural areas. Ann. Agric. Environ. Med. 2024, 31, 205–211. [Google Scholar] [CrossRef] [PubMed]
- Liu, J.; Sun, Z.; Lei, W.; Xu, J.; Sun, Q.; Shen, Z.; Lyu, Y.; Shi, H.; Zhou, Y.; Zhang, L.; et al. A reliable medium for monitoring atmospheric deposition near emission sources by using snow from agricultural areas. Atmosphere 2025, 16, 26. [Google Scholar] [CrossRef]
- Liu, Y.; Gao, W.; Chai, S. Assessment of fluxes and ecological and health risks of toxic trace elements in atmospheric deposition from the Baicheng–Songyuan area, Jilin Province, northeast China. Atmosphere 2024, 15, 744. [Google Scholar] [CrossRef]
- Liu, Z.; Zhan, C.; Liu, H.; Liu, S.; Quan, J.; Liu, X.; Zhang, J.; Qu, C. Source-specific health risk of PM2.5-bound metals in a typical industrial city, central China, 2021–2022. Atmosphere 2023, 14, 1406. [Google Scholar] [CrossRef]
- Starodymova, D.P.; Kotova, E.I.; Shevchenko, V.P.; Titova, K.V.; Lukyanova, O.N. Winter atmospheric deposition of trace elements in the Arkhangelsk region (NW Russia): Insights into environmental effects. Atmos. Pollut. Res. 2024, 15, 102310. [Google Scholar] [CrossRef]
- Szwed, M. Snow cover as an indicator of dust pollution in the area of exploitation of rock materials in the Świętokrzyskie Mountains. Atmosphere 2022, 13, 409. [Google Scholar] [CrossRef]
- Siudek, P.; Frankowski, M.; Siepak, J. Trace element distribution in the snow cover from an urban area in central Poland. Environ. Monit. Assess. 2015, 187, 225. [Google Scholar] [CrossRef] [PubMed]
- Faurat, A.A.; Azhaev, G.S.; Kakezhanova, S.K.; Dossova, M.T. Heavy Metals Contamination in Snow Cover of Pavlodar (Kazakhstan). Fundam. Exp. Biol. 2024, 29, 164–178. [Google Scholar] [CrossRef]
- Kotova, E.I.; Shevchenko, V.P.; Lukyanova, O.N.; Titova, K.V.; Starodymova, D.P. Geochemical characteristics of the snow cover of the western territory of the Far North of Russia: The example of the Kola Peninsula and Karelian Coast. Russ. J. Earth Sci. 2025, 25, ES6015. [Google Scholar] [CrossRef]
- Szwed, M.; Kozłowski, R.; Ludew, M. Insights into the chemical characteristics of melted snow from urban-industrial sites: Case study of Starachowice (Poland). Acta Geogr. Lodz. 2025, 118, 39–54. [Google Scholar] [CrossRef]
- Vijayan, A.; Österlund, H.; Marsalek, J.; Viklander, M. Traffic-related metals in urban snow cover: A review of the literature data and the feasibility of filling gaps by field data collection. Sci. Total Environ. 2024, 920, 170640. [Google Scholar] [CrossRef] [PubMed]
- Wang, Y.; Hou, Z.; Ma, J.; Zhang, X.; Liu, X.; Wang, Q.; Chen, C.; Yang, K.; Meng, J. Seasonal variations and health risk evaluation of trace elements in atmospheric PM2.5 in Liaocheng, the North China Plain. Atmosphere 2025, 16, 72. [Google Scholar] [CrossRef]
- Zhang, H.; Zhao, Z.; Cai, A.; Liu, B.; Wang, X.; Li, R.; Wang, Q.; Zhao, H. Source apportionment of heavy metals in wet deposition in a typical industry city based on multiple models. Atmosphere 2022, 13, 1716. [Google Scholar] [CrossRef]
- Moghadas, S.; Paus, K.H.; Muthanna, T.M.; Herrmann, I.; Marsalek, J.; Viklander, M. Accumulation of traffic-related trace metals in urban winter-long roadside snowbanks. Water Air Soil Pollut. 2015, 226, 404. [Google Scholar] [CrossRef]
- Vlasov, D.; Vasil’chuk, J.; Kosheleva, N.; Kasimov, N. Dissolved and suspended forms of metals and metalloids in snow cover of megacity: Partitioning and deposition rates in Western Moscow. Atmosphere 2020, 11, 907. [Google Scholar] [CrossRef]
- Moskovchenko, D.; Pozhitkov, R.; Zakharchenko, A.; Tigeev, A. Concentrations of major and trace elements within the snowpack of Tyumen, Russia. Minerals 2021, 11, 709. [Google Scholar] [CrossRef]

Disclaimer/Publisher’s Note: The statements, opinions and data contained in all publications are solely those of the individual author(s) and contributor(s) and not of MDPI and/or the editor(s). MDPI and/or the editor(s) disclaim responsibility for any injury to people or property resulting from any ideas, methods, instructions or products referred to in the content. |
© 2026 by the authors. Licensee MDPI, Basel, Switzerland. This article is an open access article distributed under the terms and conditions of the Creative Commons Attribution (CC BY) license.