


Abstract
Livestock production is a major source of agricultural methane (CH4) and nitrous oxide (N2O), making the synergistic mitigation of these two gases essential for meeting climate targets. Based on the EDGAR emission database from 2000 to 2024, this study employs international comparisons, spatial analysis, and STIRPAT-based scenario projections to characterize emissions from China’s animal husbandry and explore pathways for synergistic mitigation. The results reveal that China’s livestock CH4 emissions exhibited a trend of early-stage fluctuation followed by a late-stage rebound, while N2O emissions fluctuated sharply. The two gases are strongly synergistic yet driven by distinct mechanisms. China accounts for the largest share of global emissions and exhibits a distinctive emission structure—with comparable contributions from enteric fermentation and rice paddies—setting it apart from both pasture-based and intensive developed countries. High-emission areas are becoming increasingly concentrated in northern production regions. Under the baseline scenario, CH4 and N2O emissions are projected to peak in 2032 and 2030, respectively; under an ultra-low-carbon scenario, both gases peak around 2029, at substantially lower levels. Achieving synergistic mitigation calls for a regionally differentiated framework that combines top-down governance with bottom-up participation from farmers, integrating enteric fermentation control with optimized manure management to support a low-carbon transition.
1. Introduction
Methane (CH4) and nitrous oxide (N2O) are the second and third most significant anthropogenic greenhouse gases after carbon dioxide (CO2). On a century-scale, their global warming potential (GWP) is approximately 27 and 273 times that of CO2, respectively, and they exhibit prolonged atmospheric lifetimes. Consequently, they have garnered considerable international attention in recent years [1,2]. The agricultural sector contributes approximately one-third of global CH4 emissions and nearly half of anthropogenic N2O emissions, and this contribution is likely to increase further as population and food demand continue to grow in the future [3]. This poses a significant challenge to achieving the target of limiting global warming to 1.5 °C [4]. In response, the international community has actively mobilized. For instance, 74% of countries have included agricultural GHG reduction targets in their Nationally Determined Contributions (NDCs) [5]. Concurrently, frameworks such as the Global Methane Pledge have been established to promote the coordinated management of non-CO2 gases like CH4 [6]. Countries such as Australia and New Zealand have also advanced CH4 and N2O mitigation through measures including legislative mandates, technological enablement, and market-based mechanisms [7].
As one of the world’s most populous nations and largest agricultural producers, China holds a significant position in global agricultural non-CO2 GHG emissions [8]. Structurally, China’s rice cultivation area accounts for roughly one-fifth of the global total, contributing an estimated 22–38% of global paddy field CH4 emissions [9]. Its highly intensive, integrated crop-livestock system supports 22% of global meat production [10,11]. However, factors such as feed quality and nutrient use efficiency contribute to comparatively high emission intensities for CH4 and N2O [12]. Furthermore, China’s nitrogen fertilizer application rate per unit area is three times the global average [13], making it the world’s largest emitter of agricultural N2O [14]. The confluence of these factors results in substantial agricultural non-CO2 GHG emissions in China, which have exhibited rapid growth over recent decades [15], partially offsetting the carbon sink capacity of terrestrial ecosystems [16]. In response to this pressing situation, China released the Action Plan for Methane Emission Control in 2023 and explicitly included in its latest NDC target a reduction in net GHG emissions across the entire economy by 7–10% below the peak level by 2035 [17], demonstrating a strong commitment to mitigating agricultural non-CO2 GHGs [8].
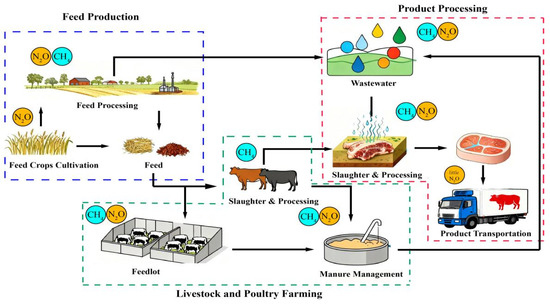
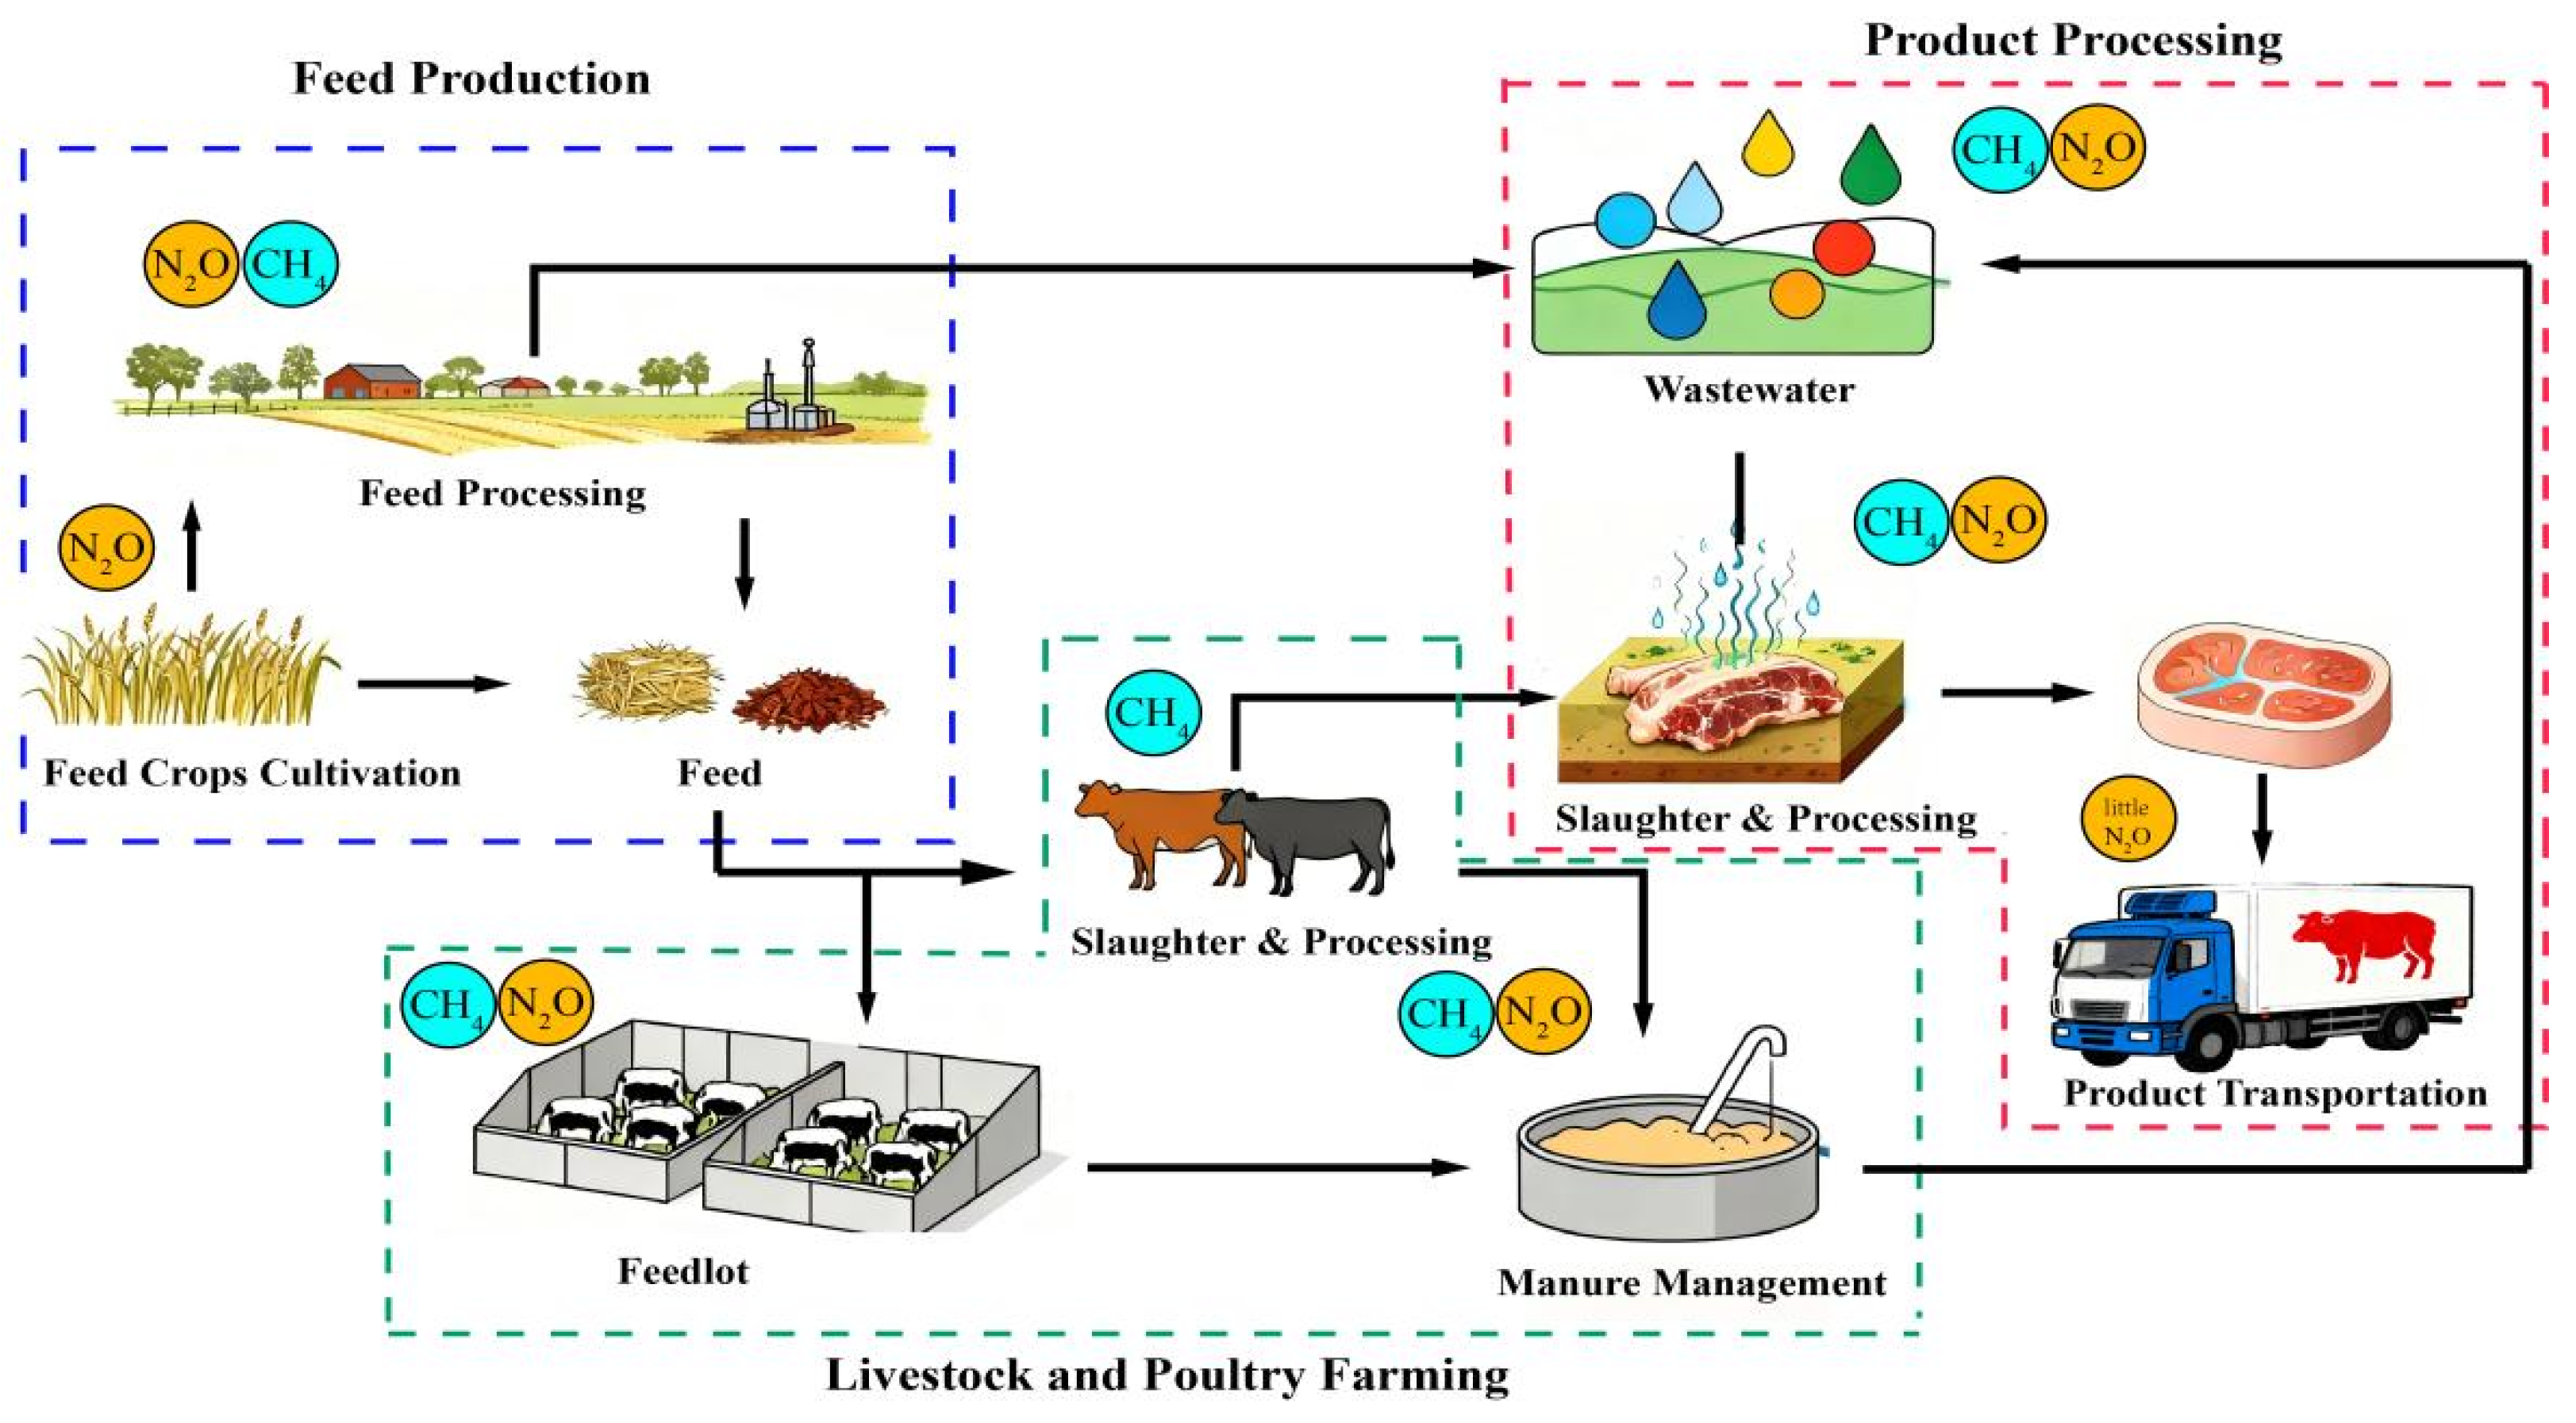
Regarding the emission sources within the animal husbandry, CH4 and N2O are generated synergistically across multiple stages of the “feed-soil-livestock-manure” continuum. In the soil phase, N2O is released via nitrification and denitrification processes resulting from nitrogen fertilizer application during feed crop cultivation [18]. Nitrogen losses during feed processing and storage also contribute to N2O emissions [19]. In the livestock production phase, enteric fermentation in ruminants constitutes the primary source of CH4 from the animal husbandry [20], with emission intensity influenced by factors such as feed composition, digestive efficiency, and animal breed [21]. During manure storage and treatment, anaerobic decomposition produces CH4, while alternating aerobic and anaerobic conditions facilitate N2O generation [22]. Feed composition not only influences the intensity of enteric fermentation but also affects emission profiles during manure treatment by altering manure characteristics [23]. Manure management practices concurrently influence CH4 emissions and significantly alter N2O formation pathways [24]. This inherently synergistic nature of multi-gas emissions necessitates a shift away from single-gas control strategies toward integrated mitigation pathways for GHG reduction in the animal husbandry [25] (Figure 1).
Figure 1.
Emission sources of CH4 and N2O in animal husbandry.
In recent years, Chinese scholars have conducted a series of studies on CH4 and N2O emissions from China’s animal husbandry. Regarding emission characteristics, Zhang et al. [26] revealed that CH4 emissions from China’s animal husbandry exhibit a spatial pattern characterized by “higher in the north, lower in the south, and agglomeration towards major northern production areas.” Enteric fermentation remains the dominant source of CH4. In contrast, N2O emissions are closely related to manure management practices and the structure of livestock production [27]. In terms of influencing factors, Li et al. [18] demonstrated that economic development levels and population size exert positive driving effects on CH4 and N2O emissions, while agricultural production efficiency and industrial structure have suppressive effects. Chen [28] indicated that economic growth is the primary factor driving GHG emissions from the animal husbandry in China’s four major pastoral regions, and that resource utilization of livestock manure can significantly inhibit GHG emissions.
However, existing studies have several limitations. First, most adopt a domestic perspective focused on emission characteristics and driving factors, with little international comparison of emission structures or mitigation pathways between China and other major livestock-producing countries. Second, research specifically addressing synergistic control measures for CH4 and N2O in the animal husbandry remains limited, and there has been insufficient exploration of how advanced international policy tools and governance mechanisms can be adapted to the Chinese context. Third, scenario-based projection studies—particularly those simulating emission pathways—require further development to support the science-based setting of mitigation targets. To address these gaps, this study systematically analyzes the spatiotemporal characteristics of CH4 and N2O emissions from China’s animal husbandry from 2000 to 2024, incorporates international comparative analyses, draws on advanced mitigation experiences from abroad, and integrates scenario-based projections with an exploration of synergistic mitigation pathways. The objective is to propose synergistic emission reduction strategies suited to China’s specific context, thereby providing a scientific basis for improving the policy framework for agricultural greenhouse gas mitigation in the country.
2. Materials and Methods
2.1. Data Sources
The Emissions Database for Global Atmospheric Research (EDGAR), established internally by the European Commission, is a database used to estimate anthropogenic greenhouse gas emissions [29]. It is based on a bottom-up emission estimation model, employing the Intergovernmental Panel on Climate Change (IPCC) methodology to aggregate global anthropogenic emissions using statistical data and emission factors. These emissions are then spatially allocated on a global 0.1° × 0.1° grid [30]. EDGAR encompasses all reporting categories outlined in the 2006 IPCC Guidelines, with detailed disaggregation by emission sector, and its time series are updated annually based on the availability of data sources [31].
For this study, data on global CH4 and N2O emissions from 2000 to 2024, disaggregated by the livestock subsectors defined in the 2006 IPCC Guidelines, were obtained from the EDGAR website https://edgar.jrc.ec.europa.eu/ (accessed on 1 March 2026) maintained by the Joint Research Centre (JRC) of the European Commission for analysis (Table A1). Among them, CH4_A1, CH4_A2, and CH4_C7 represent enteric fermentation, manure management, and rice cultivation, respectively; N2O_A2, N2O_C4, N2O_C5, and N2O_C6 represent manure management, direct N2O emissions from managed soils, indirect N2O emissions from managed soils, and indirect N2O emissions from manure management, respectively.
China, Denmark, New Zealand, The Netherlands, and Australia together account for a significant share of global livestock production. Specifically, China contributes over 25% of global meat output, Denmark accounts for 17% of global pork exports, New Zealand supplies more than 30% of global dairy exports, The Netherlands is the largest meat exporter in the European Union, and Australia is the world’s largest lamb exporter. These five countries represent three typical livestock production models: large-scale transitioning, technology-driven intensification, and pasture-based grazing [8]. Therefore, the selection of these five countries for a comparative analysis of greenhouse gas emissions from the animal husbandry is well-justified and highly representative.
The selection of STIRPAT model variables considered theoretical foundations, emission sources, and data availability. Li et al. [18] reported that agricultural economic factors and population size have positive effects on China’s agricultural CH4 and N2O emissions, whereas agricultural production efficiency and industrial structure have mitigating effects. Zhang et al. [26] analyzed CH4 and N2O emissions from China’s agricultural system using rural population, per capita GDP, industrial structure, technological level, and carbon emission intensity. Based on these findings, combined with actual emission sources (e.g., enteric fermentation, manure management, fertilizer application) and data availability, this study selected six core indicators as input variables for the STIRPAT model: proportion of livestock production value (representing agricultural economic structure), per capita disposable income (reflecting economic development level), year-end large livestock inventory (directly linked to enteric fermentation CH4 emissions), year-end resident population (representing population size), chemical fertilizer application in agriculture (affecting cropland N2O emissions), and manure recycling rate (indicating manure management technology and mitigation efficiency). These variables were used to project CH4 and N2O emissions. Relevant data were mainly sourced from the China Statistical Yearbook and the China Animal Husbandry & Veterinary Medicine (Table 1).
Table 1.
Description of STIRPAT model variables.
2.2. Model Construction
The STIRPAT model, which overcomes the limitation of the IPAT equation where all factors influence the dependent variable proportionally, is an extensible stochastic environmental impact assessment model proposed by York et al [32,33]. To investigate the factors influencing CH4 and N2O emissions and to accurately project future emissions of these two greenhouse gases, this study extended the STIRPAT model by incorporating indicator variables employed in relevant research [34], tailored to the specific context of the study area. The proportion of livestock production value (PLP), affluence (represented by per capita disposable income, PGDP), year-end large livestock inventory (YLLI), year-end resident population (POP), chemical fertilizer application in agriculture (CFA), and manure recycling rate (MRR) were selected to analyze their respective effects on CH4 and N2O emissions. This yields the following equation:
where I is the total emission; a is a constant; b, c, d, e, f, g are the exponents of PLP, PGDP, YLLI, POP, CFA, and MRR, respectively; e is the error term.
I = aPLPb × PGDPc × YLLId × POPe × CFAf × MRRg × e
Taking the natural logarithm of both sides of Equation (1) gives:
ln I = ln a + b ln PLP + c ln PGDP + d ln YLLI + e ln POP + f ln CFA + g ln MRR + ln e
3. Results
3.1. Spatiotemporal Distribution Characteristics of CH4 and N2O Emissions from Animal Husbandry
3.1.1. Characteristics of CH4 and N2O Emissions from Animal Husbandry in China
Based on 2000–2024 time-series data, CH4 emissions from China’s animal husbandry showed a fluctuating upward trend, while N2O emissions declined with fluctuations, indicating a clear divergence in emission patterns.
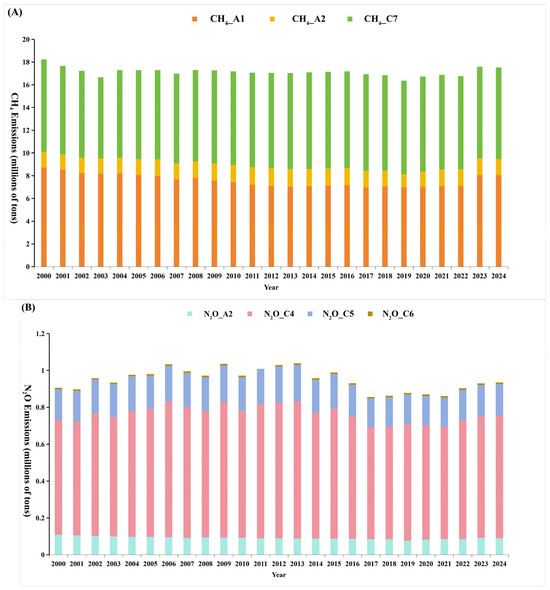
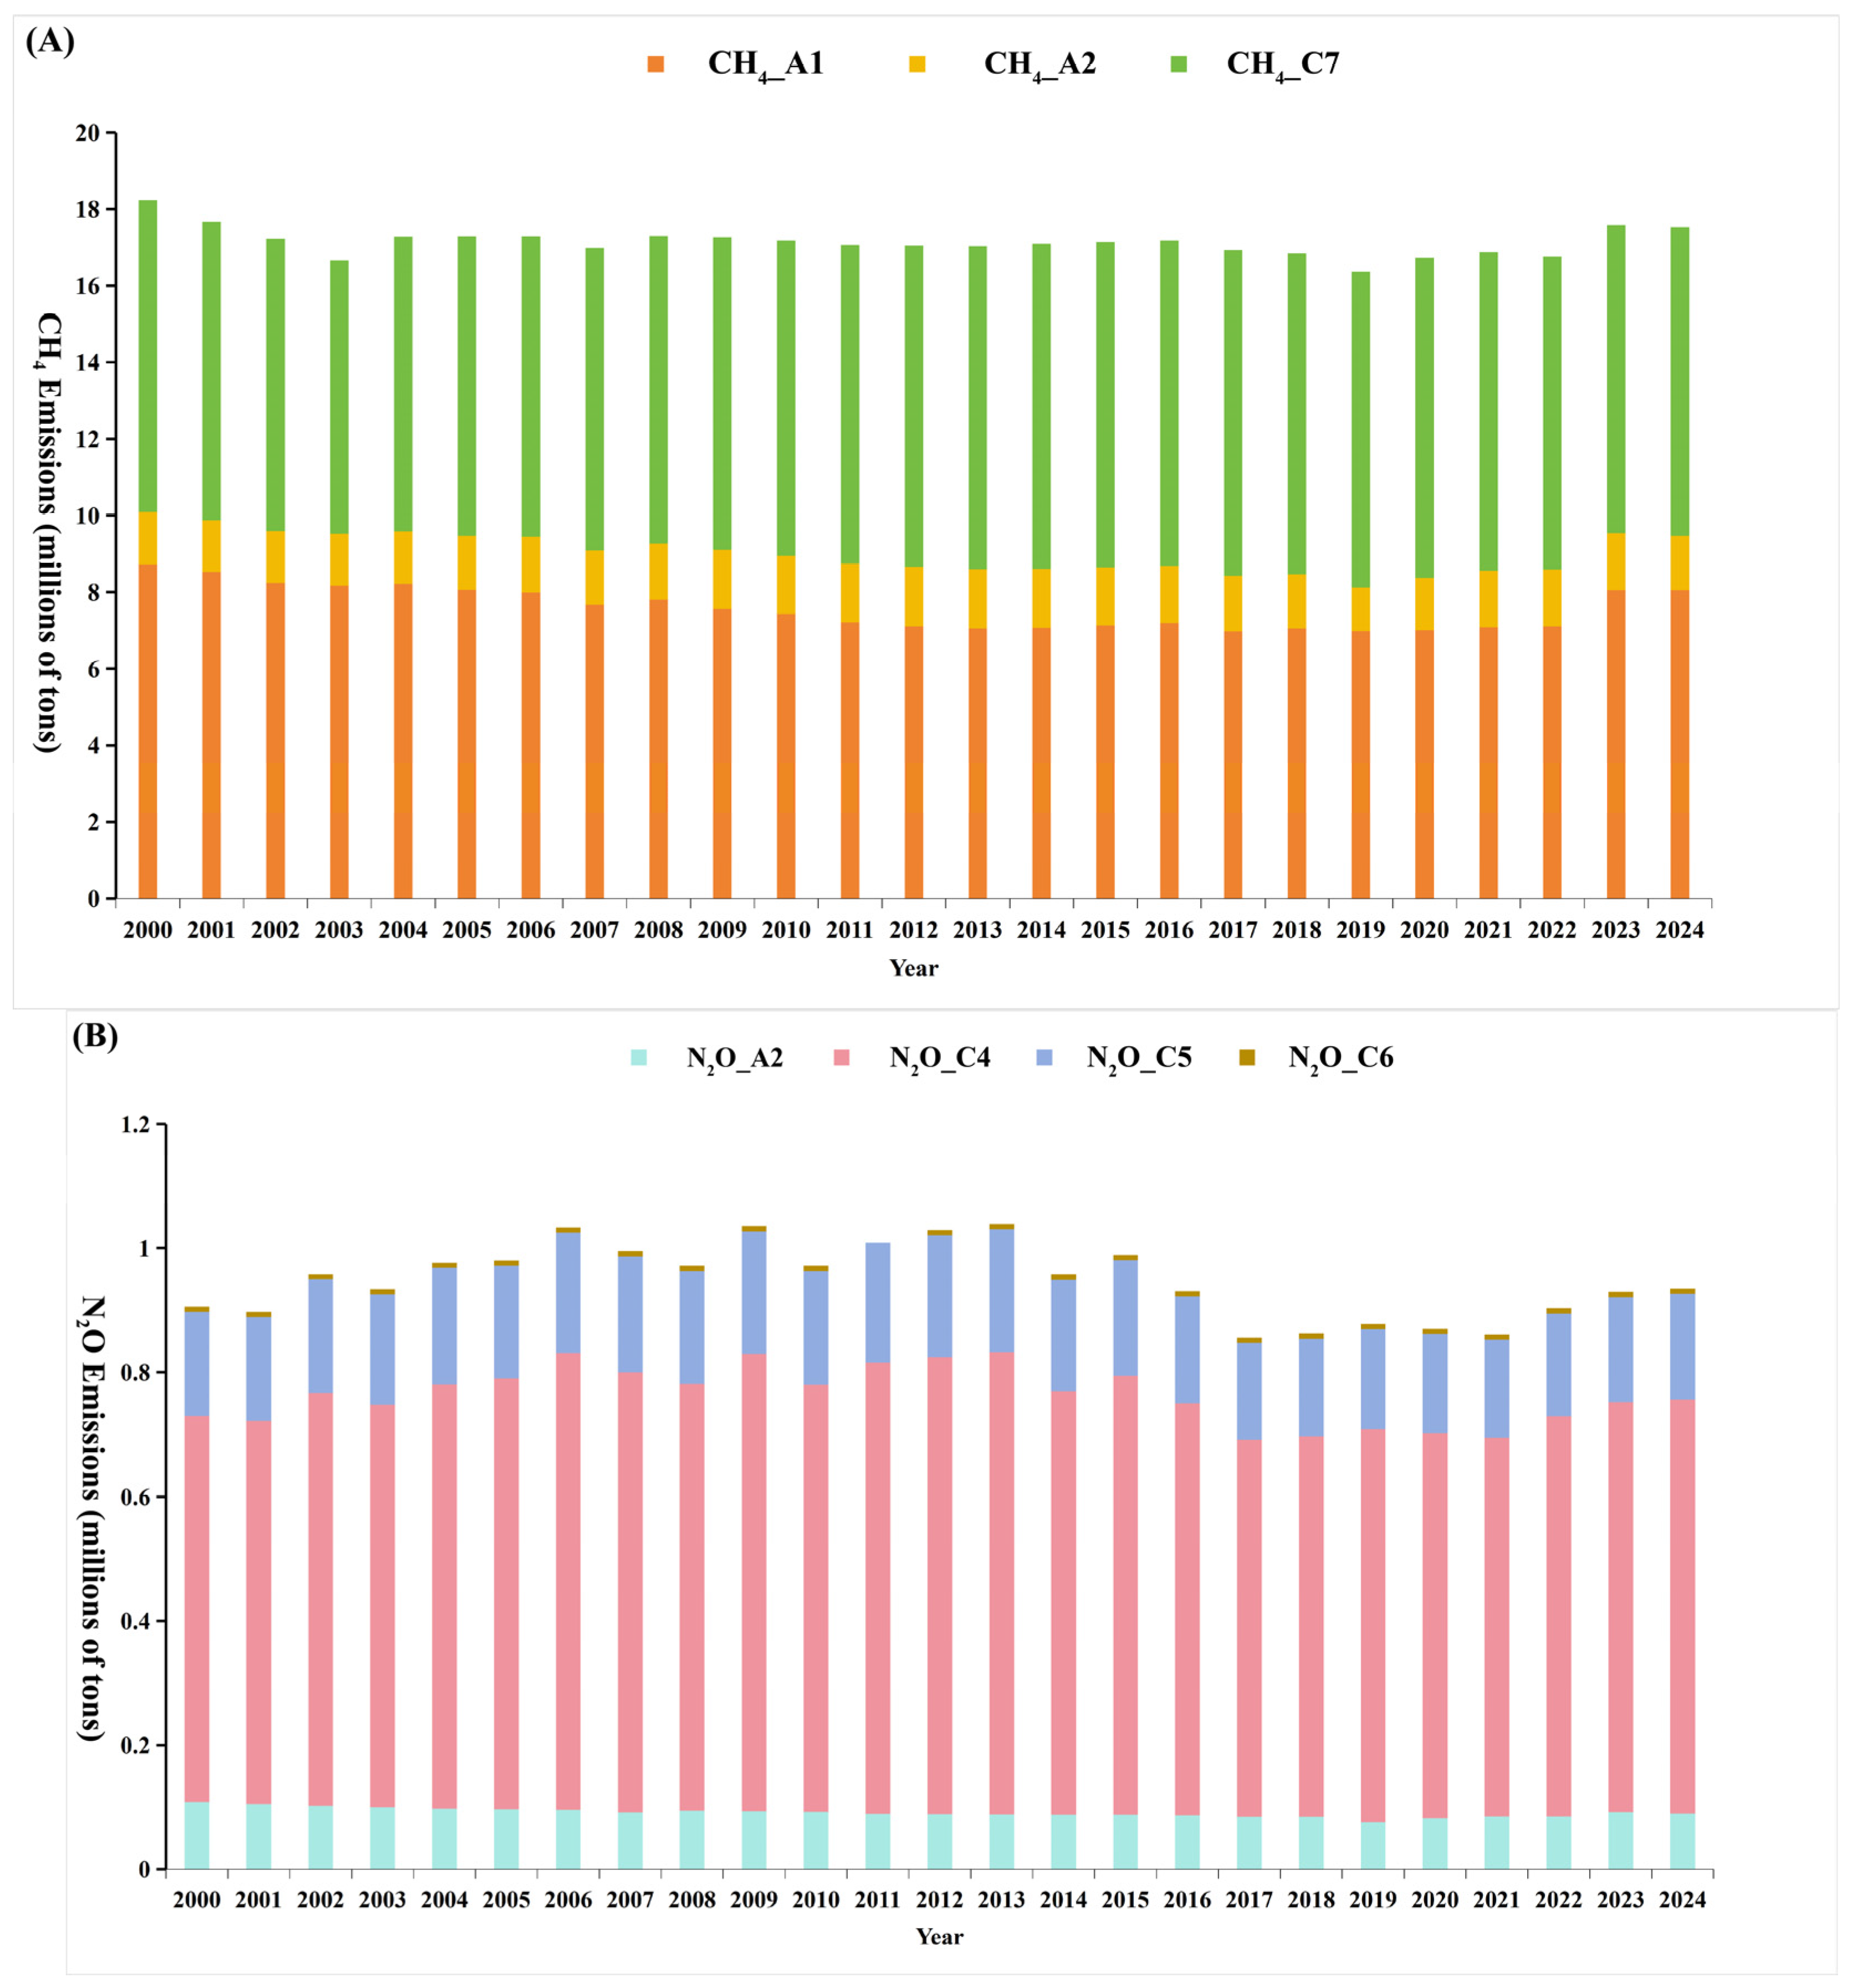
For CH4, enteric fermentation (A1) emissions decreased from 8.72 Mt in 2000 to 6.98 Mt in 2019 (a 19.9% drop), then rebounded rapidly after 2020 to 8.05 Mt in 2024. Manure management (A2) CH4 emissions fluctuated between 1.40 and 1.55 Mt in 2000–2010, fell to 1.14 Mt in 2019, and rose again to 1.49 Mt in 2023. Rice cultivation (C7) CH4 emissions increased from 8.14 Mt in 2000 to a peak of 8.49 Mt in 2014, then declined to 8.06 Mt in 2024 (Figure 2A).
Figure 2.
Changes in CH4 (A) and N2O (B) emission compositions in China (2000–2024). CH4_A1: enteric fermentation; CH4_A2: manure management; CH4_C7: rice cultivation; N2O_A2: manure management; N2O_C4: direct N2O from managed soils; N2O_C5: indirect N2O emissions from managed soils; N2O_C6: indirect N2O emissions from manure management.
For N2O, manure management (A2) emissions decreased from 0.108 Mt in 2000 to 0.076 Mt in 2019, then rebounded to ~0.090 Mt after 2020. Direct N2O emissions from managed soils (C4) N2O emissions ranged between 0.60 and 0.74 Mt. Indirect emissions (C5 + C6) remained relatively high (0.18–0.20 Mt) from 2002 to 2012, declined after 2015, and stabilized at 0.16–0.17 Mt in recent years (Figure 2B).
3.1.2. International Comparison of Characteristics and Structure of CH4 and N2O Emissions from Animal Husbandry
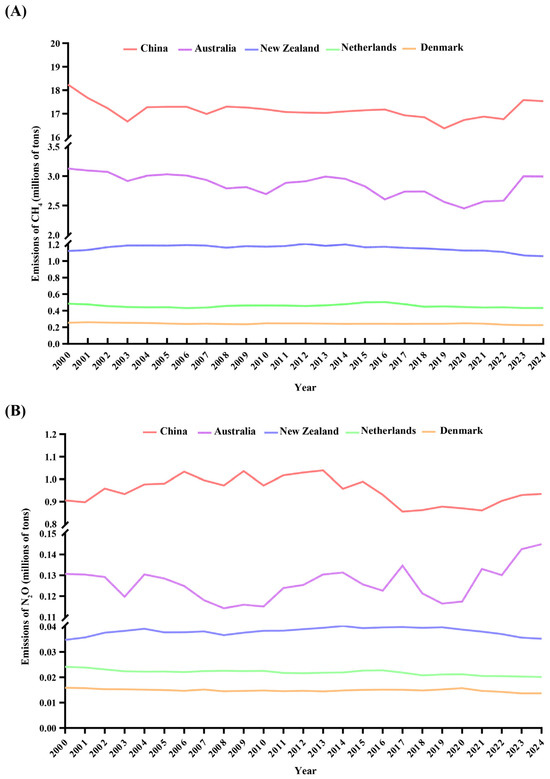
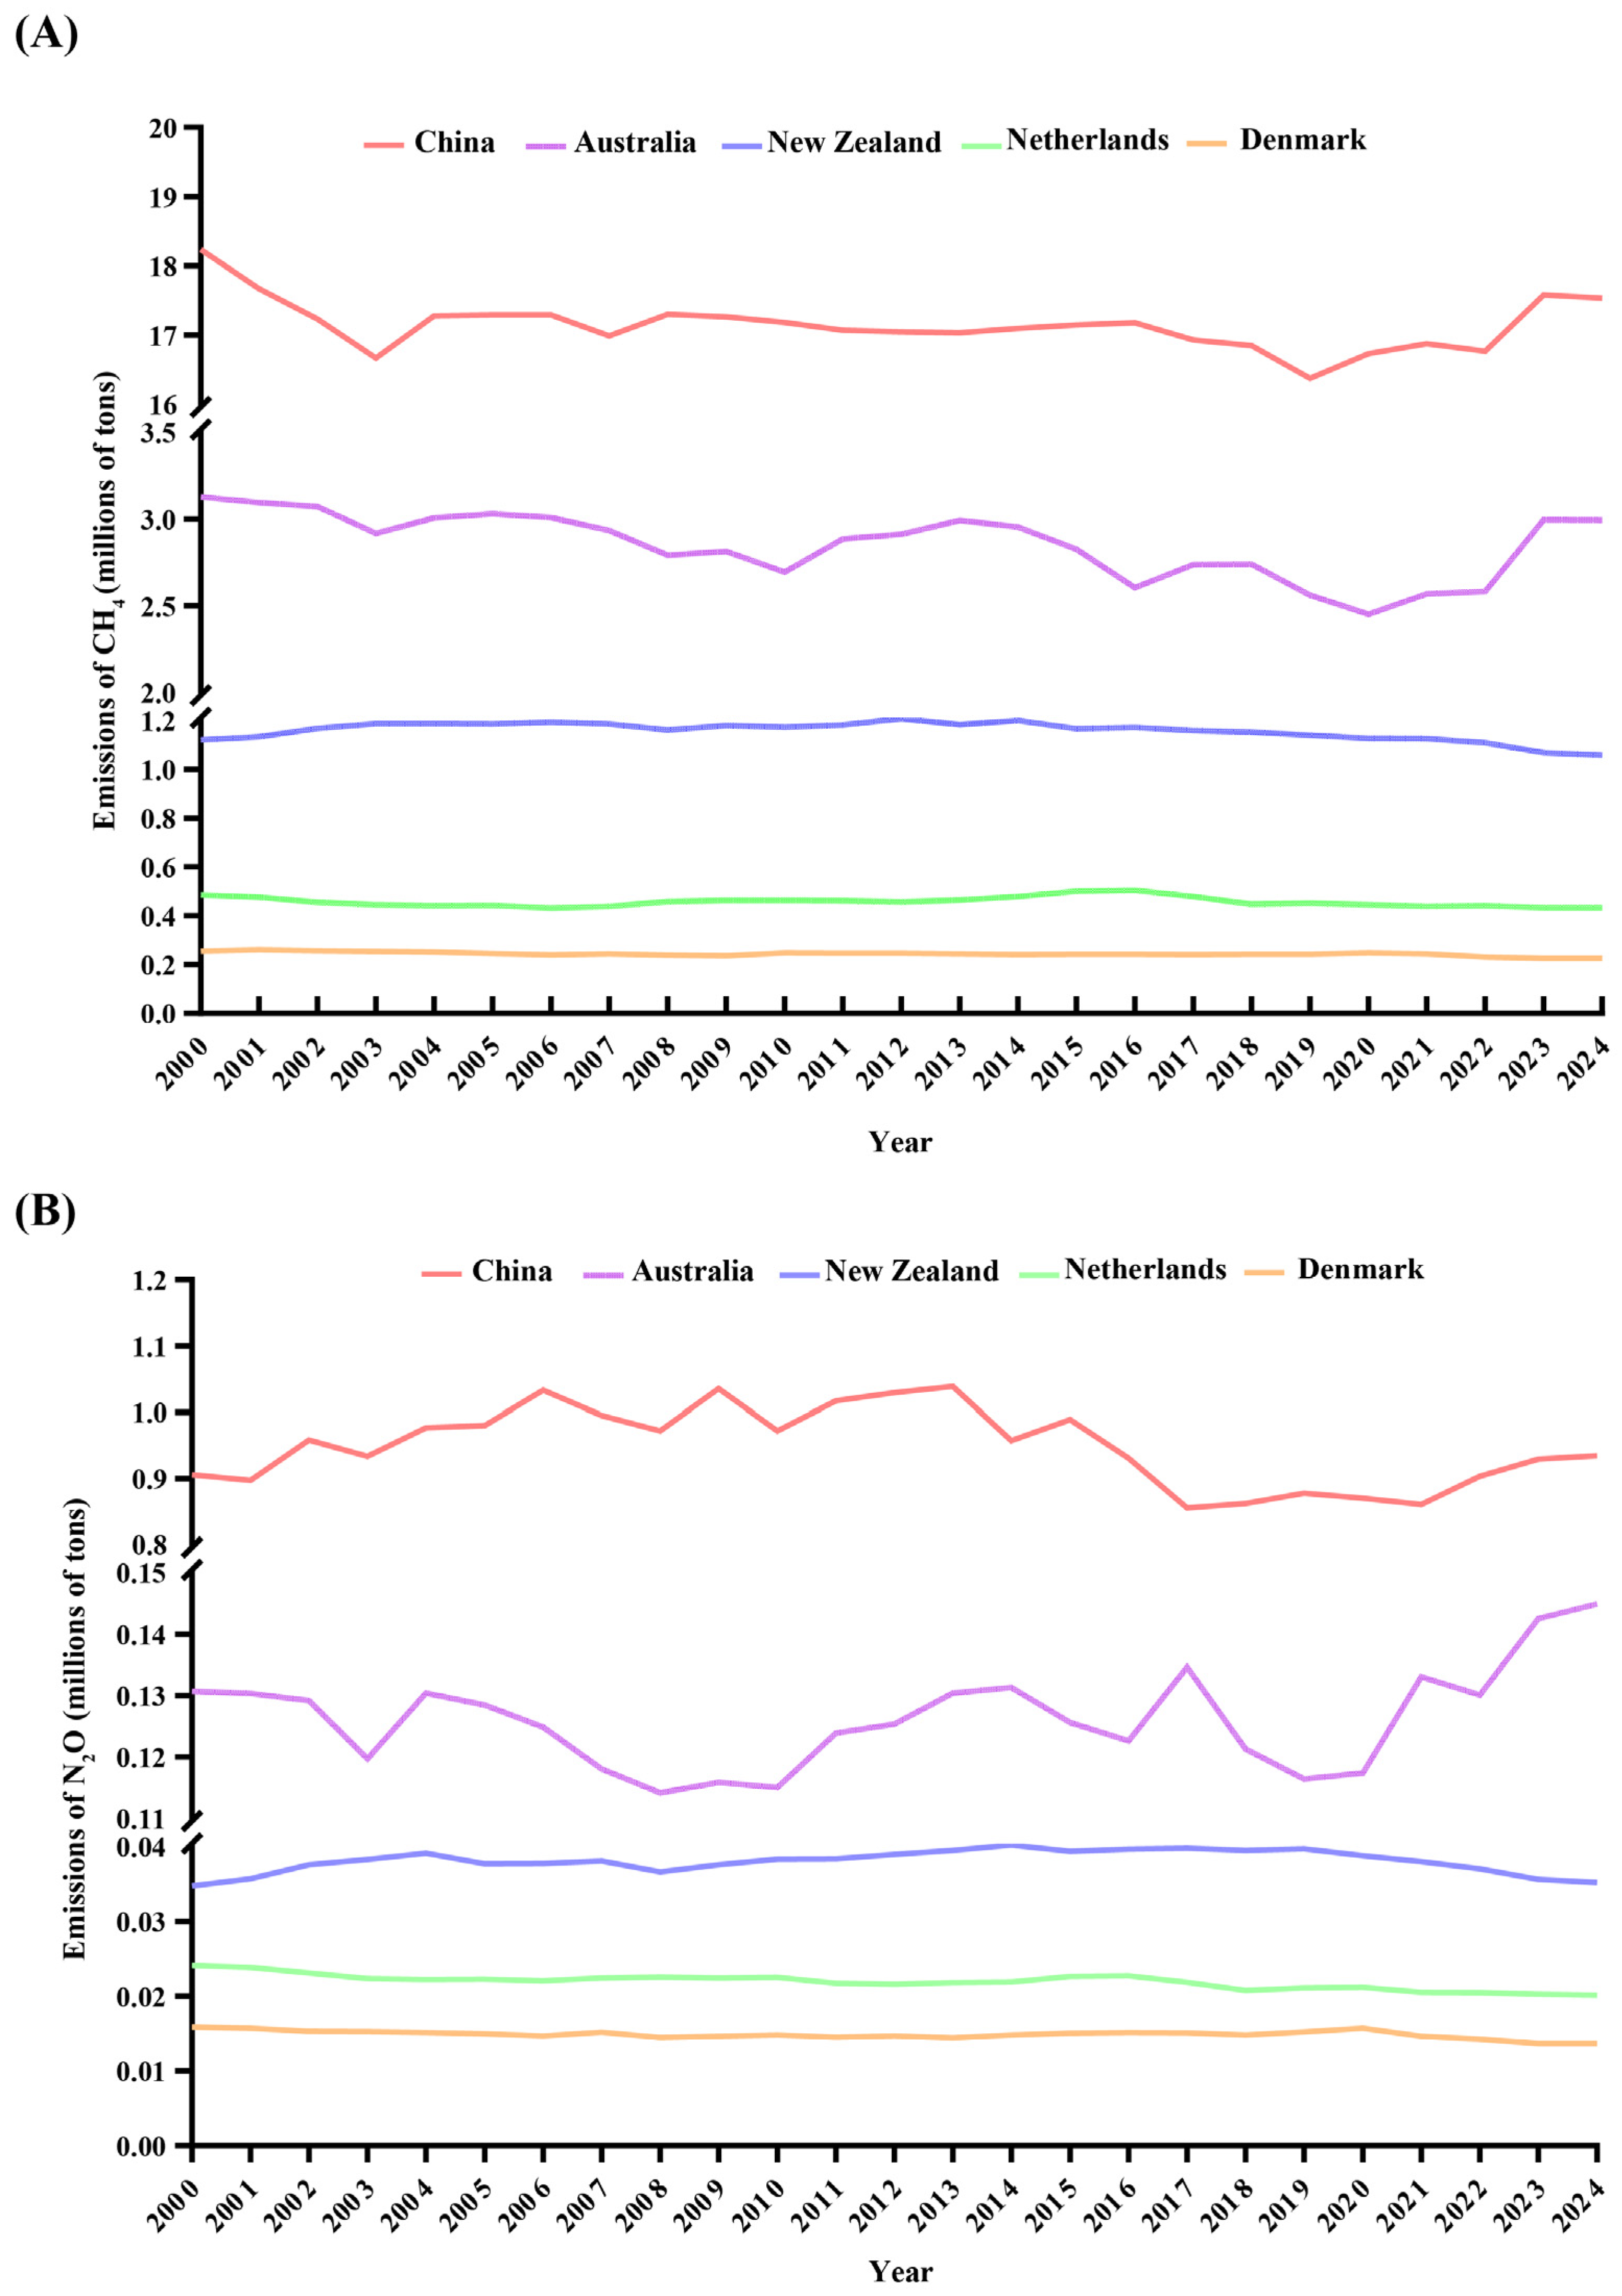
Analysis shows that from 2000 to 2024, total CH4 emissions from the animal husbandry varied greatly among China, Denmark, New Zealand, the Netherlands, and Australia (Figure 3A). China was the largest emitter, averaging 17.2 Mt per year, with a marked increase after 2022. Australia ranked second, showing a fluctuating decline followed by a slight rebound to 2.99 Mt in 2023–2024. New Zealand ranked third, with a slow decline from 1.12 Mt in 2000 to 1.06 Mt in 2024. The Netherlands and Denmark had lower emissions, decreasing from 0.49 Mt and 0.26 Mt to 0.43 Mt and 0.23 Mt, respectively. In international comparison, developed countries such as Denmark, The Netherlands, and New Zealand achieved low and steadily declining CH4 emissions, reflecting effective mitigation. In contrast, China not only had much higher emissions but also showed strong recent growth, mainly driven by livestock expansion and a rebound in enteric fermentation [21].
Figure 3.
Comparison of (A) CH4 and (B) N2O emissions from China, Denmark, New Zealand, Netherlands, and Australia from 2000 to 2024.
For N2O, China again ranked first among the five countries, with average annual emissions of 0.945 kt and large fluctuations. New Zealand’s emissions were stable, remaining between 0.034 and 0.040 kt. The Netherlands and Denmark had very low and declining emissions, falling to 0.020 kt and 0.0136 kt in 2024, respectively. Internationally, developed countries like Denmark, The Netherlands, and New Zealand have effectively controlled N2O emissions, showing long-term stability or decline. China, however, exhibited two notable features: high total emissions with strong interannual variability, and no clear downward trend since the 21st century, indicating unstable mitigation performance in manure management [35] (Figure 3B).
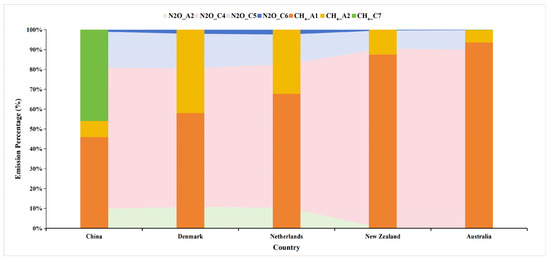
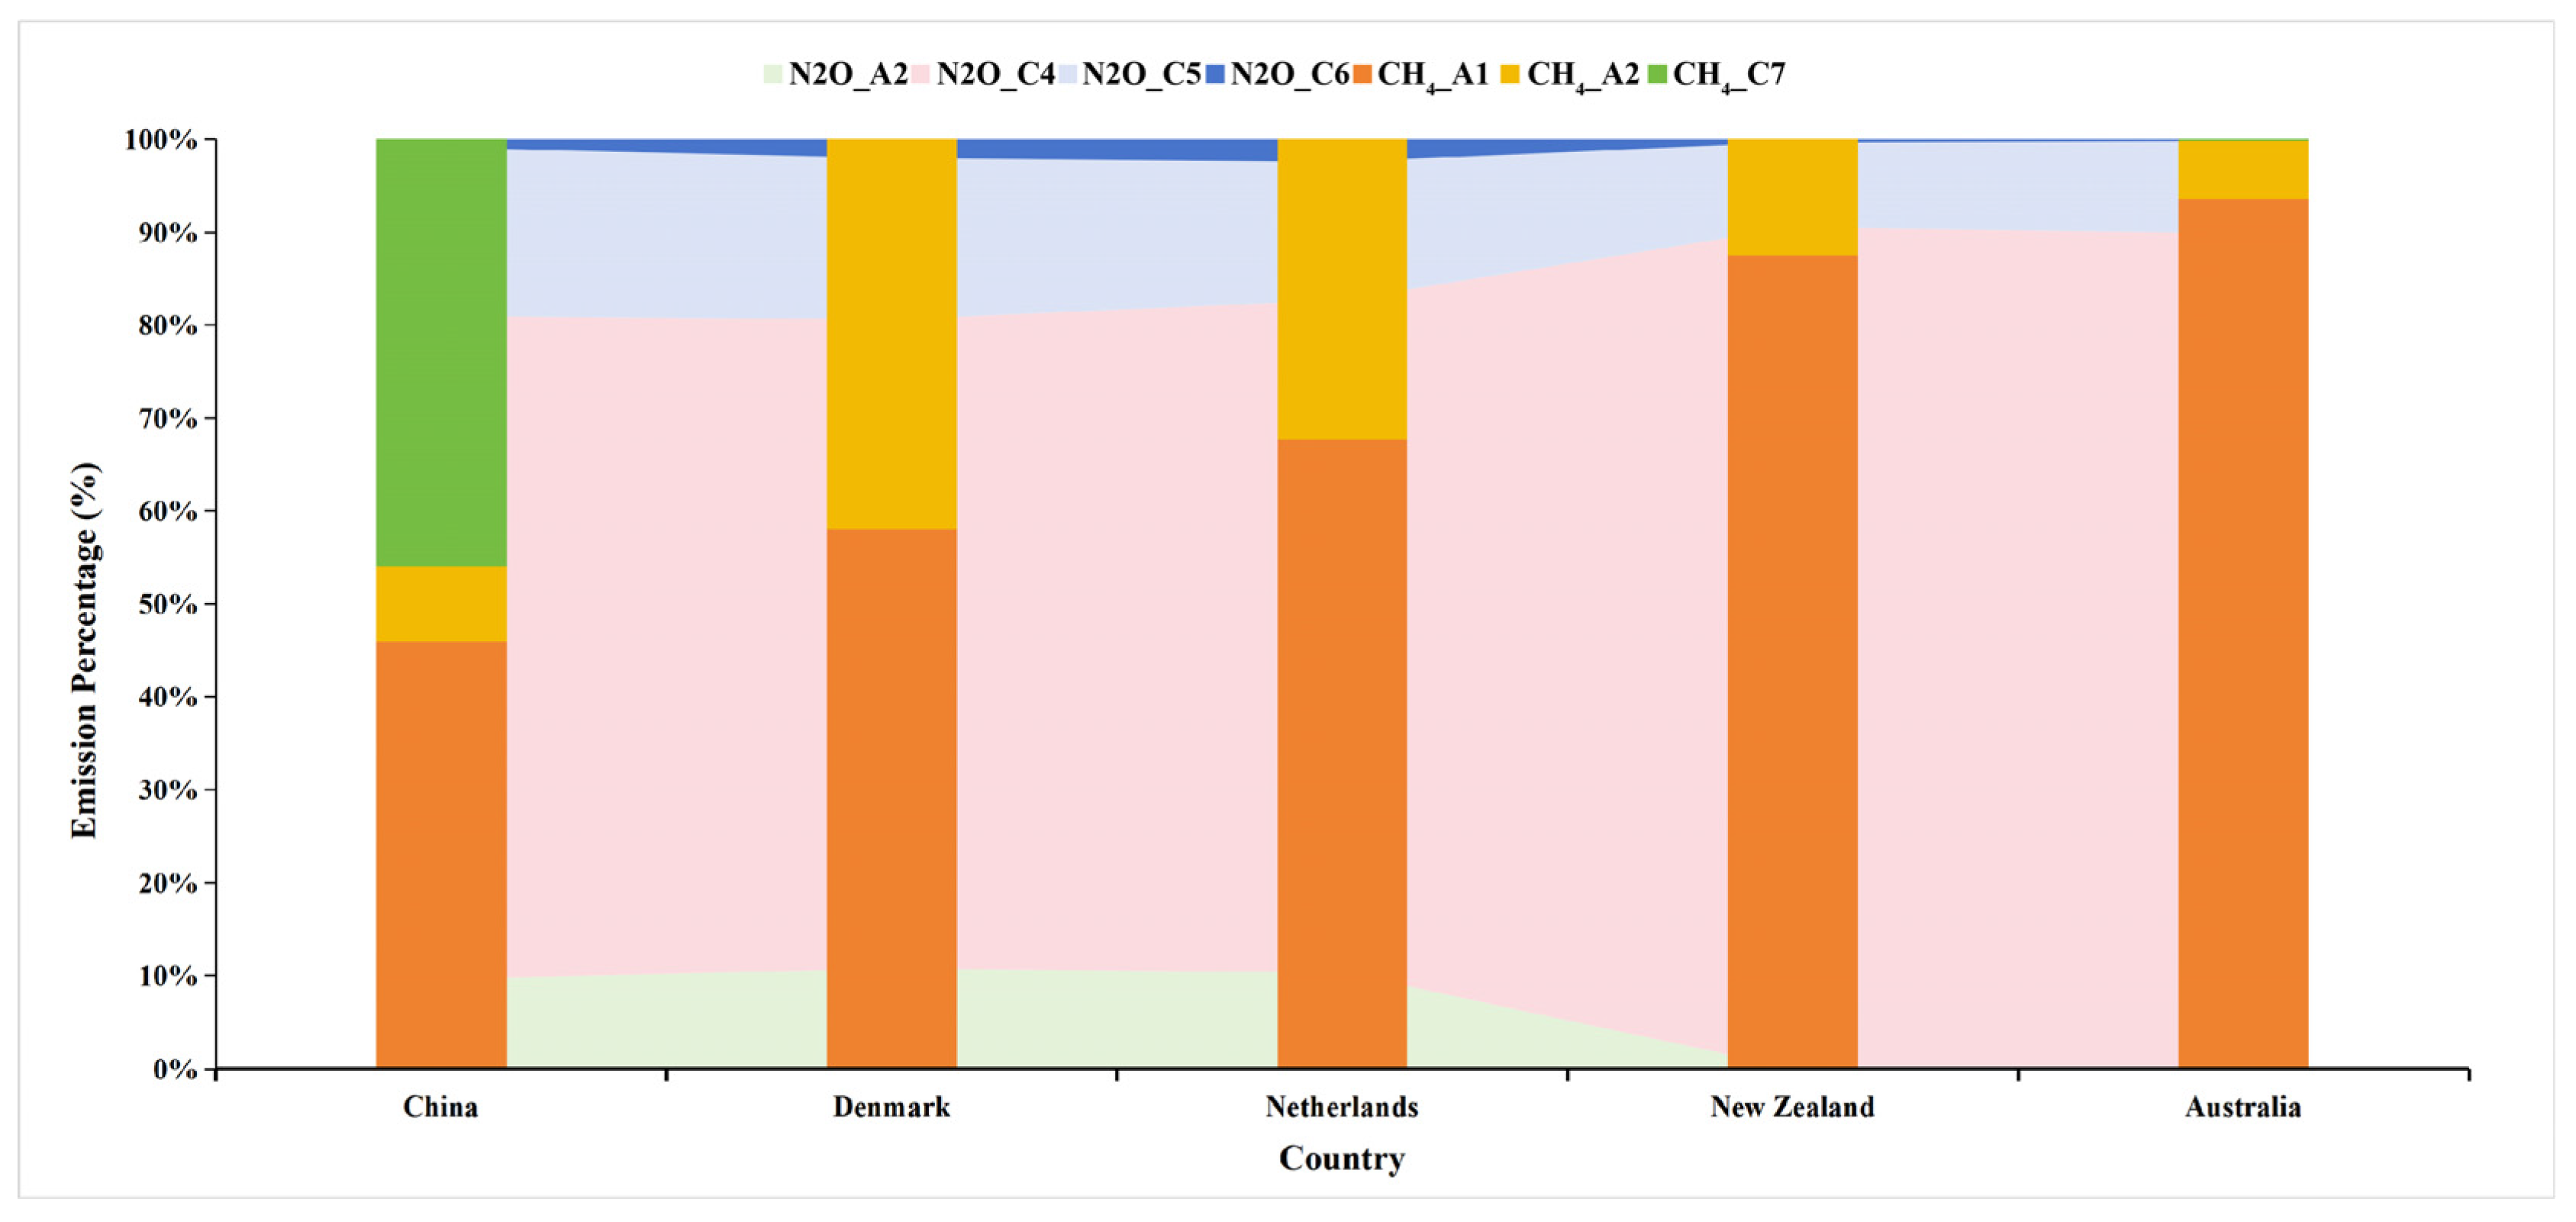
In 2024, the sectoral composition of CH4 emissions from animal husbandry varied significantly across the five countries. In terms of sectoral composition, enteric fermentation (A1), rice cultivation (C7), and manure management (A2) accounted for 45.9%, 46.0%, and 8.1% of China’s emissions, respectively, reflecting a pattern where enteric fermentation and rice cultivation are of comparable importance. Australia and New Zealand were dominated by enteric fermentation, which accounted for 93.7% and 87.7% of their respective emissions, while manure management contributed 6.3% and 12.3%, respectively, reflecting the characteristics of pasture-based livestock systems. In The Netherlands and Denmark, manure management made a prominent contribution, accounting for 32.4% and 42.5% of emissions, respectively, while enteric fermentation accounted for 67.6% and 57.5%, respectively, indicating a relatively balanced sectoral structure. These marked differences in emission structures across countries profoundly reflect national characteristics in livestock production models and manure management practices (Figure 4).
Figure 4.
Comparison of CH4 and N2O emission compositions in five countries (China, Denmark, New Zealand, Netherlands and Australia) in 2024. CH4_A1: enteric fermentation; CH4_A2: manure management; CH4_C7: rice cultivation; N2O_A2: manure management; N2O_C4: direct N2O from managed soils; N2O_C5: indirect N2O emissions from managed soils; N2O_C6: indirect N2O emissions from manure management.
In 2024, in terms of sectoral composition of animal husbandry N2O emissions among the five countries, China’s shares direct N2O from managed soils (C4), indirect emissions (C5 + C6), and manure management (A2) were 71.4%, 19.0%, and 9.6%, respectively. In Australia, New Zealand, The Netherlands, and Denmark, rice paddies were overwhelmingly dominant, accounting for 89.9%, 90.4%, 72.6%, and 69.9% of emissions, respectively, followed by indirect emissions, which ranged from 10.1% to 19.1%. With the exception of Netherlands (10.0%) and Denmark (11.0%), the contribution of manure management was minimal in these countries. The notable distinction between China and the other countries lies in the relatively prominent contributions of indirect emissions and manure management, reflecting the national context where intensive livestock farming is more prevalent and emissions from manure treatment cannot be overlooked (Figure 4).
3.1.3. Evolution of the Spatial Pattern of CH4 and N2O Emissions from Animal Husbandry in China
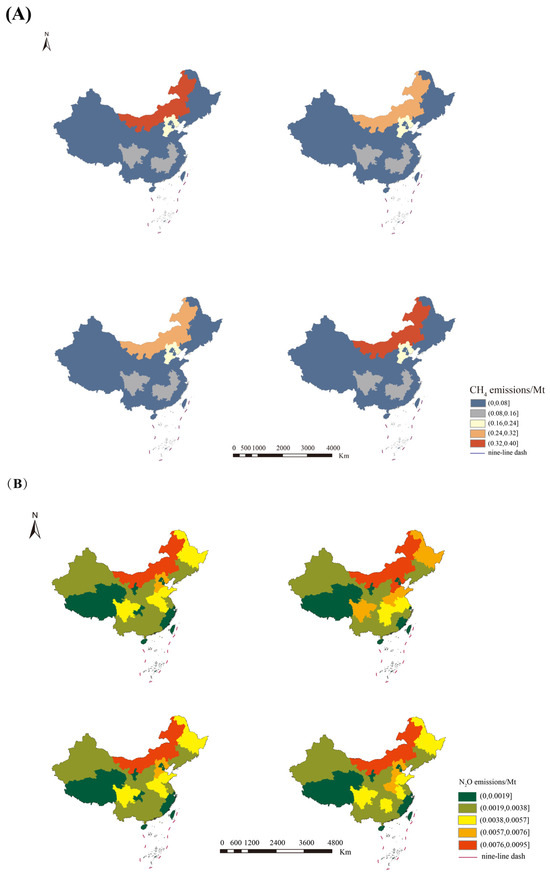
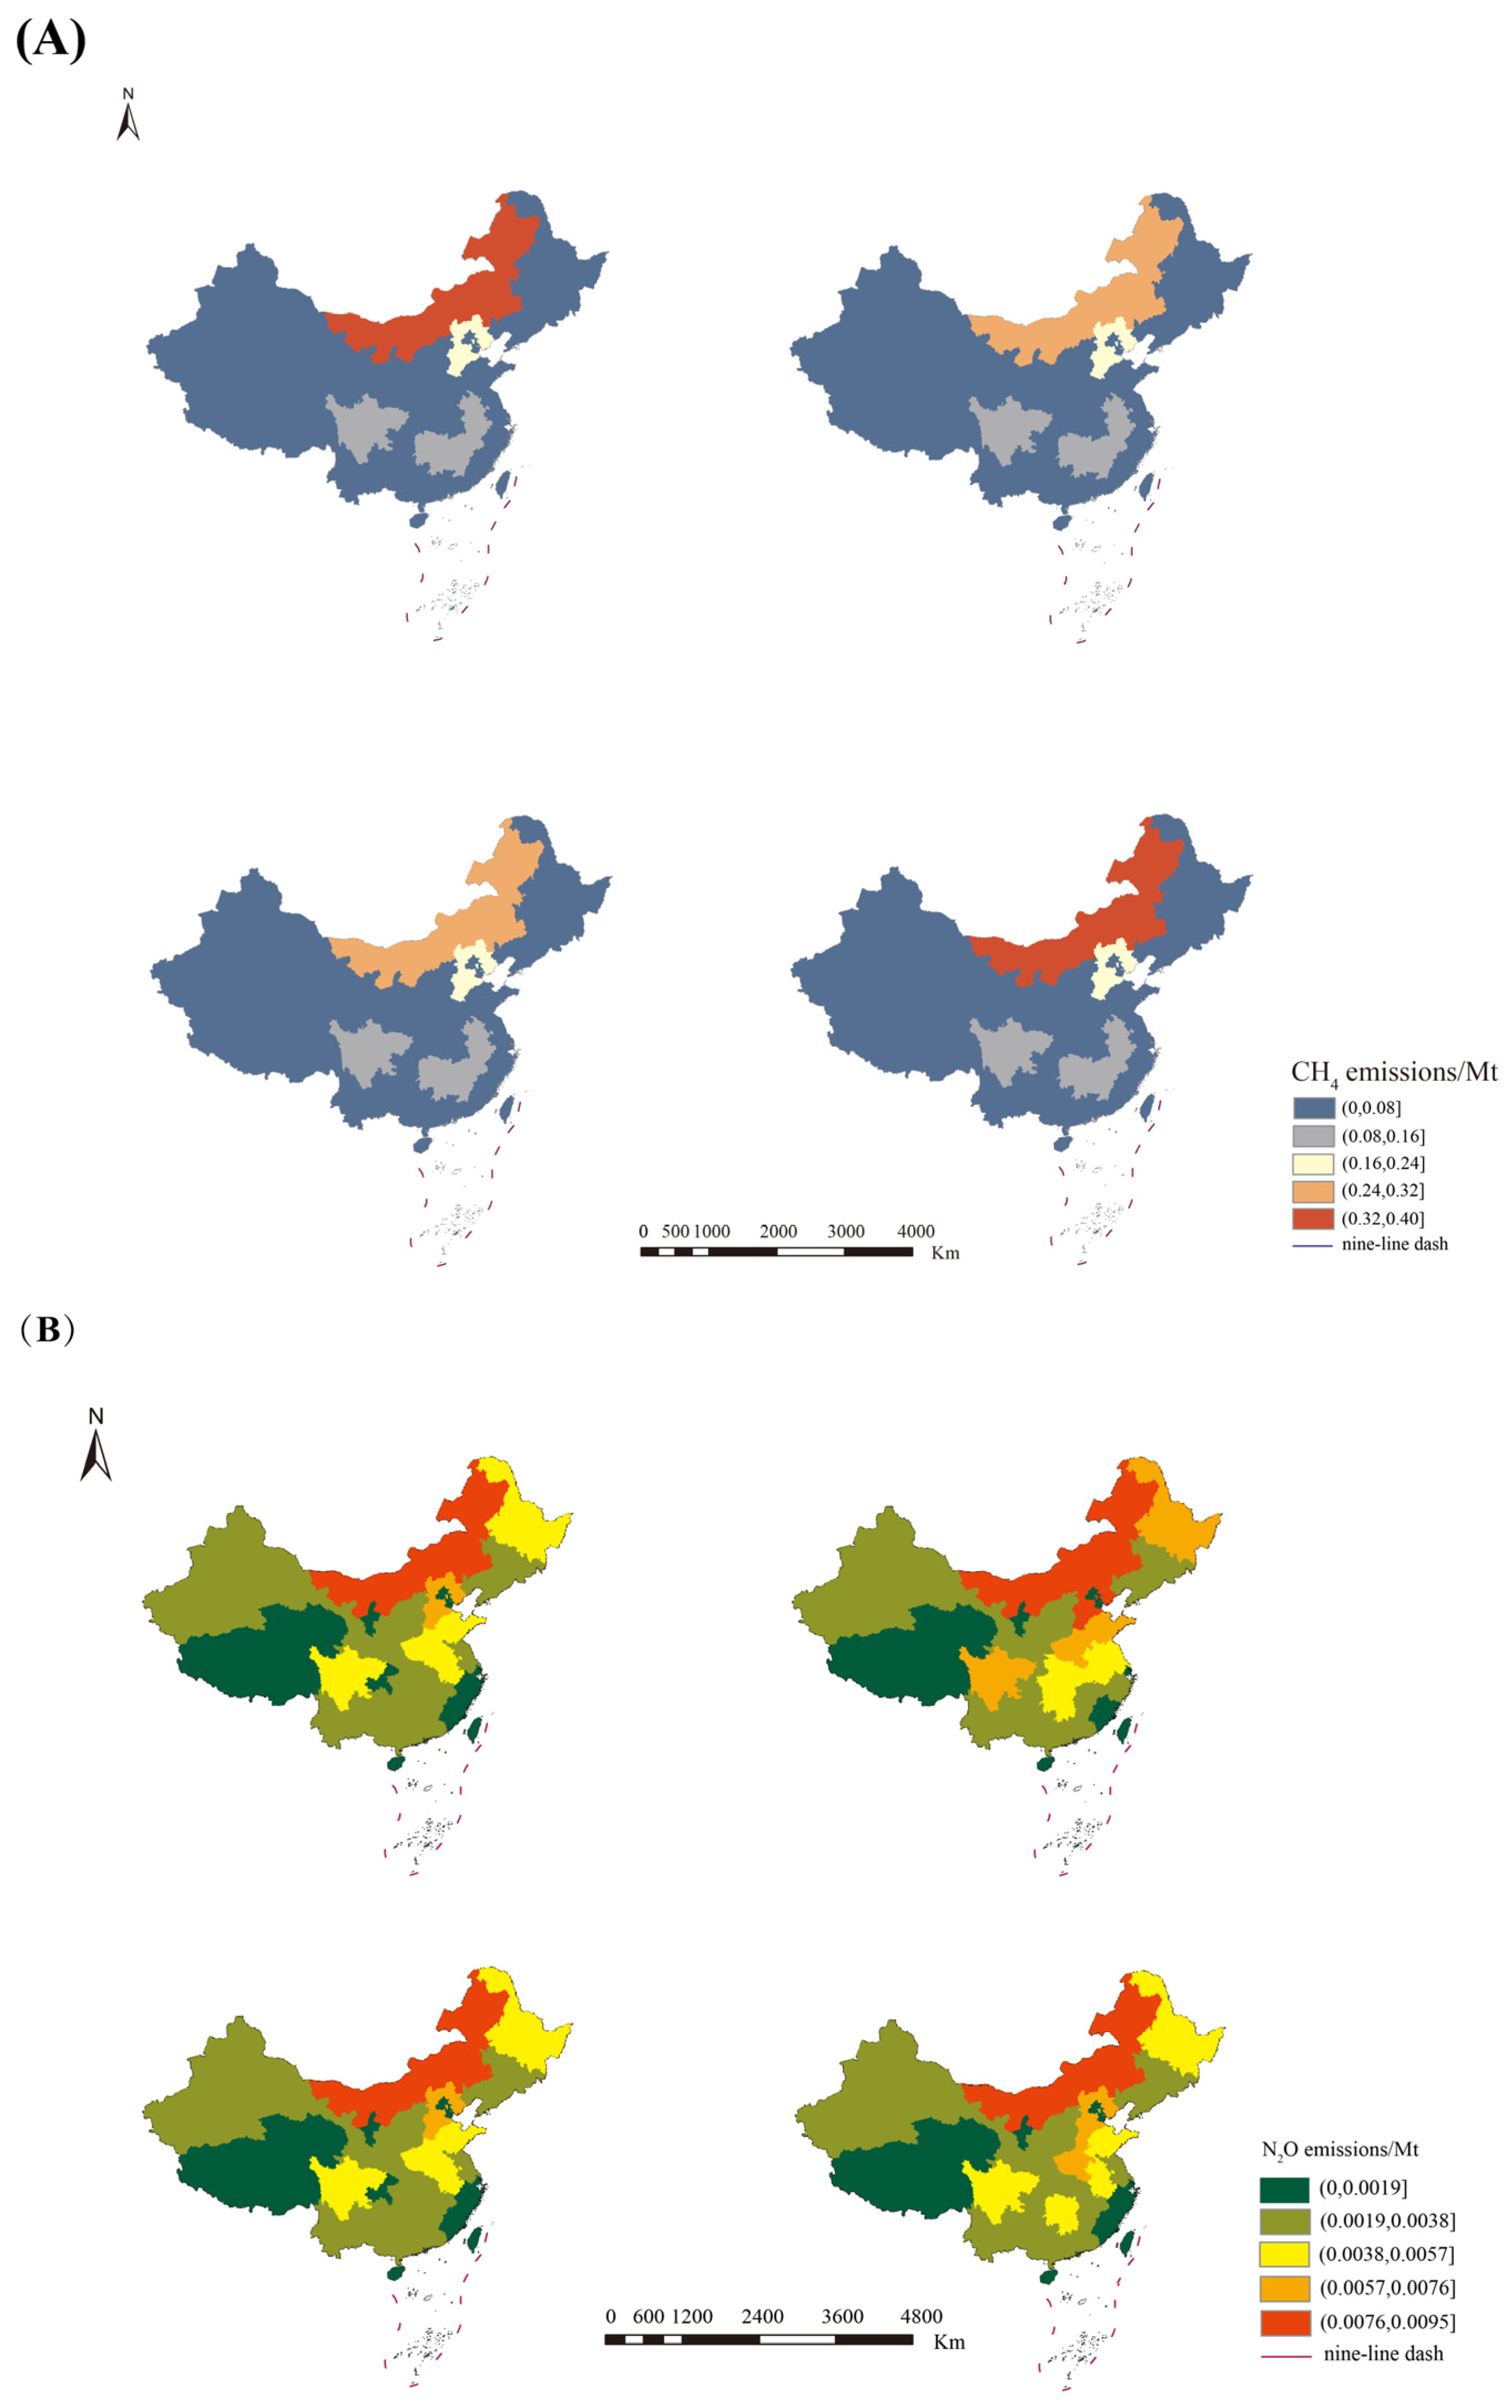
This study analyzed the spatial variation patterns of CH4 and N2O emissions from China’s animal husbandry across four selected years: 2000, 2012, 2021, and 2024. As illustrated in Figure 5, the regional differentiation of greenhouse gas emissions from China’s animal husbandry is pronounced. The spatial distributions of the two gases are broadly similar, though their evolutionary trajectories differ slightly.
Figure 5.
Spatial distribution of (A) CH4 and (B) N2O emissions in China for 2000, 2012, 2021, and 2024.
In terms of CH4 emissions, the overall spatial pattern is characterized by “higher values in the north, lower values in the south, and agglomeration in the central region.” In 2000, areas with high CH4 emissions (>0.32 Mt) were mainly distributed in Inner Mongolia. In North China, provinces such as Hebei and Shanxi had emissions ranging from 0.10 to 0.24 Mt; provinces such as Sichuan and Hunan had emissions between 0.08 and 0.16 Mt; and emissions in the remaining provinces of the southern region were all below 0.080 Mt. By 2012, Inner Mongolia remained a high-emission area, though its emissions had decreased to the range of 0.24–0.32 Mt. In 2021, the spatial pattern of emissions remained largely unchanged from that of 2012. By 2024, the spatial pattern of CH4 emissions had further solidified, with Inner Mongolia still being a high-emission area, where emissions once again exceeded 0.32 Mt (Figure 5A).
The spatial pattern of N2O emissions was highly similar to that of CH4, but the high-value areas were more concentrated, and the evolutionary trend was relatively stable. In 2000, the high-value areas for N2O emissions (>0.0076 Mt) were also in Inner Mongolia. In North China, provinces such as Hebei and Shanxi, along with Heilongjiang in Northeast China, had emissions ranging from 0.0057 to 0.0076 Mt; Provinces such as Sichuan, Shandong, Henan, and Anhui had emissions between 0.0038 and 0.0057 Mt; and the remaining provinces had emissions below 0.0038 Mt. Regions such as Tibet, Qinghai, Zhejiang, and Fujian had relatively low emissions (<0.002 Mt). By 2012, the distribution of high-value areas had further expanded. In addition to Inner Mongolia, Hebei also became a high-emission area (>0.0076 Mt). Furthermore, emissions in Sichuan, Henan, Shandong, and Heilongjiang increased further, reaching 0.0057–0.0076 Mt, while emissions in Hubei and Hunan also increased to above 0.0038 Mt. In 2021, emissions decreased compared to 2012, with the overall pattern aligning with that of 2000. By 2024, the spatial pattern of emissions had further concentrated in the major production areas of northern China. Inner Mongolia remained the region with the highest emissions (>0.0076 Mt). Hebei and Henan were areas with the second-highest emissions, exceeding 0.0057 Mt. In addition to Sichuan, Heilongjiang, Shandong, and Anhui, which had already reached emission levels of 0.0038 Mt in 2021, emissions in Hunan once again rose above 0.0038 Mt. Low-emission areas (<0.0020 Mt) were widely distributed along the southeastern coast and the Qinghai–Tibet Plateau (Figure 5B).
3.2. Projection of CH4 and N2O Emissions from Animal Husbandry in China
3.2.1. Correlation Test and Collinearity Analysis
After converting and organizing the original data, a pairwise correlation analysis was conducted with ln I as the dependent variable and ln PLP, ln PGDP, ln YLLI, ln POP, ln CFA, and ln MRR as the independent variables. The correlation coefficients among the variables are presented in Table 2.
Table 2.
Correlation test among variables.
As shown in Table 2, most variables exhibit high correlations. Specifically, CH4 emissions (ln I) are significantly positively correlated with the proportion of livestock production value (ln PLP) and the year-end large livestock inventory (ln YLLI), with correlation coefficients of 0.720 and 0.532, respectively. This indicates that the expansion of the animal husbandry directly increases CH4 emissions, which is consistent with the fact that animal husbandry is a major source of CH4 emissions. Meanwhile, CH4 emissions are significantly negatively correlated with the manure resource utilization rate (ln MRR) (coefficient of −0.624), suggesting that improving manure resource utilization contributes to reducing CH4 emissions, aligning with mitigation practices in environmental protection. For N2O emissions (ln I), they are positively correlated with agricultural fertilizer application rate and the proportion of livestock production value (coefficient of 0.498), reflecting the contribution of fertilizer use and livestock activities to N2O emissions. N2O emissions also show a negative correlation with the manure recycling rate (coefficient of −0.590), indicating that resource utilization has a mitigating effect on both greenhouse gases. Additionally, per capita disposable income (ln PGDP) is negatively correlated with both emissions, which may be attributed to technological advancements and industrial structure optimization associated with economic development.
A further collinearity diagnosis was conducted for the six independent variables, and the results are presented in Table 3. The variance inflation factor (VIF) test revealed that the VIF values for both the CH4 and N2O regression models were generally greater than 10. Among them, variables such as year-end resident population (VIF = 433.054), per capita disposable income (VIF = 236.446), and manure recycling rate (VIF = 41.592) had VIF values far exceeding the critical threshold, indicating severe multicollinearity among the independent variables. In the CH4 model, year-end large livestock inventory (p = 0.014) and year-end resident population (p = 0.014) were significant, while in the N2O model, only the manure recycling rate was significant (p = 0.024).
Table 3.
Results of collinearity analysis.
3.2.2. Ridge Regression Analysis and Model Prediction
To avoid distortion in model evaluation and to address the issue of multicollinearity, the ridge regression estimation method was employed to fit the data in order to obtain accurate coefficients for each variable. The results are presented in Table 4.
Table 4.
Ridge regression estimation results.
As shown in Table 4, both R2 and Adjusted R2 are greater than 0.7, indicating that the regression equations are significant and the fitting effect meets the requirements. The STIRPAT model equations for CH4 and N2O emissions with respect to various variables are as follows:
ln(N2O) = 5.314751 + 0.055399 × ln(PLP) + 0.114799 × ln(PGDP)
+ 0.126388 × ln(YLLI) − 0.209582 × ln(POP) + 0.303422 × ln(CFA)
− 0.250527 × ln(MRR)
+ 0.126388 × ln(YLLI) − 0.209582 × ln(POP) + 0.303422 × ln(CFA)
− 0.250527 × ln(MRR)
In terms of the coefficients, the primary driving factor for CH4 emissions is year-end resident population, with an elasticity coefficient of −4.244; the manure recycling rate (0.139) and the year-end large livestock inventory (−0.108) had secondary effects. N2O emissions were mainly influenced by the chemical fertilizer application inagriculture, with an elasticity coefficient of 0.303, while the manure recycling rate (−0.251) also exhibited a significant negative effect. Year-end resident population showed a strong negative influence on both greenhouse gases, and manure recycling rate demonstrated potential for synergistic emission reduction.
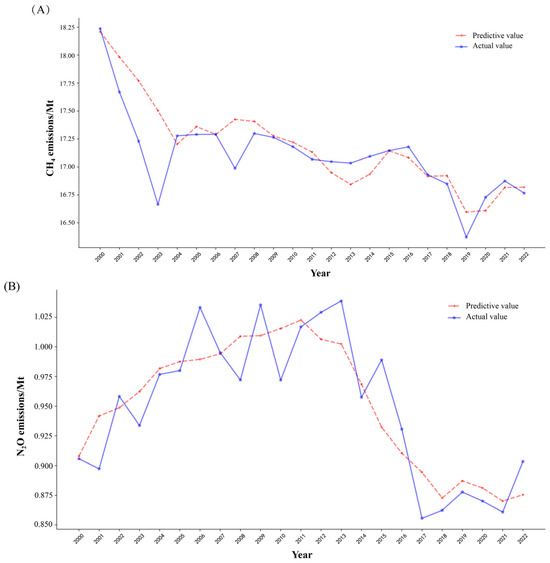
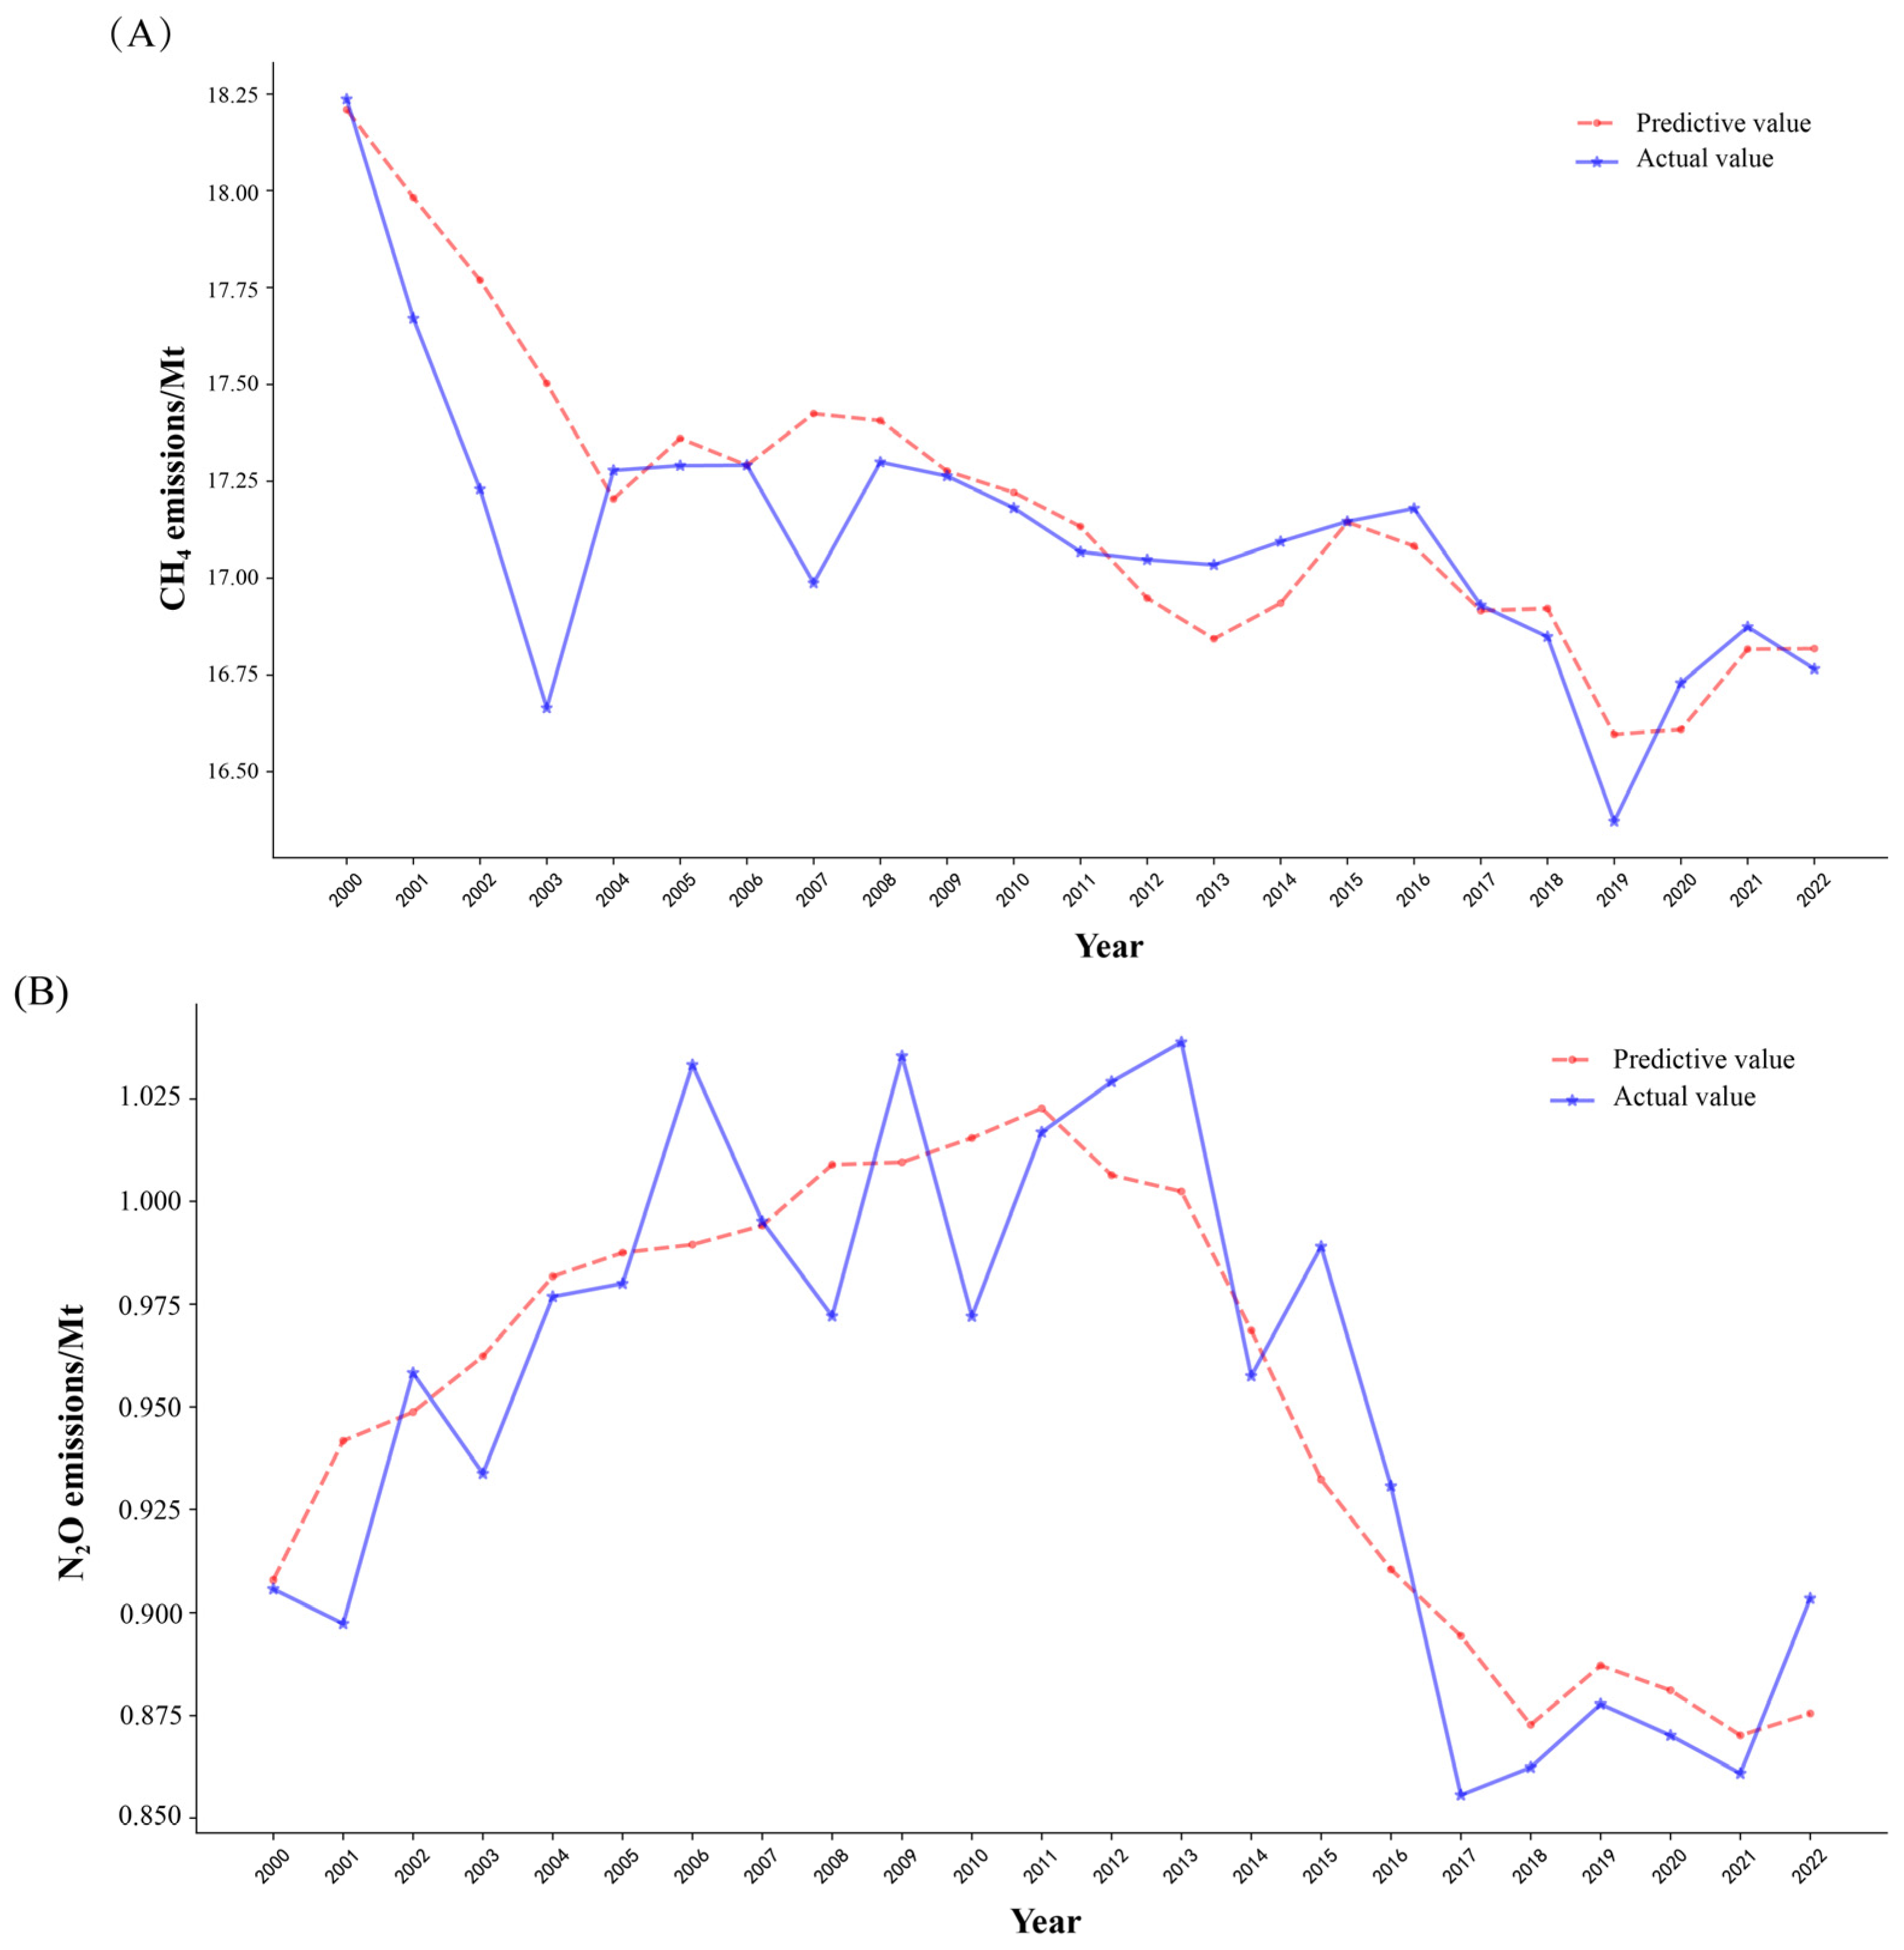
To ensure the model could accurately predict CH4 and N2O emissions, it was necessary to validate its effectiveness. The values of the respective independent variables from 2000 to 2022 were substituted into Equations (3) and (4) for model error testing. The comparison results between the predicted values from the STIRPAT model and the actual values are shown in Figure 6.
Figure 6.
Comparison of predicted and estimated (A) CH4 and (B) N2O emissions from 2000 to 2022.
As shown in Figure 6, the average annual relative errors between the model-predicted values and the actual values for CH4 (Figure 6A) and N2O (Figure 6B) emissions were 0.92% and 2.31%, respectively, indicating a good fit of the data. Therefore, the model can be used to predict future CH4 and N2O emissions.
3.2.3. Development Scenario Setting and Analysis
To further assess the potential for synergistic mitigation of CH4 and N2O emissions from China’s animal husbandry, this study established three scenarios—baseline, low-carbon, and ultra-low-carbon—based on varying policy intensities. Rates of change for each variable from 2023 to 2024 were calculated using official data from the China Statistical Yearbook and the China Animal Husbandry & Veterinary Medicine. Projections for post-2024 data followed the principles outlined below: Growth rates for economic indicators (per capita disposable income, proportion of livestock production value) were assumed to gradually decelerate in line with the stage of economic development. Declining rates for production scale indicators (year-end large livestock inventory, chemical fertilizer application inagriculture) were assumed to gradually narrow and stabilize, reflecting ongoing industrial transformation and the implementation of environmental policies. Year-end resident population was assumed to continue its trend of negative growth, with annual decreases. The manure recycling rate was assumed to increase annually, with the growth trend gradually flattening, reflecting diminishing marginal returns from technology diffusion. Differences among the three scenarios reflect varying policy stringency. The ultra-low-carbon scenario assumes a more pronounced economic slowdown, faster contraction in production scale, and more aggressive improvements in manure utilization. The baseline scenario assumes the continuation of current policy inertia, while the low-carbon scenario falls between the two. Parameter settings were closely aligned with the anticipated targets of the Recommendations of the Central Committee of the Communist Party of China for Formulating the 15th Five-Year Plan for National Economic and Social Development and China’s Nationally Determined Contributions (NDCs) to ensure the scientific robustness and policy relevance of the projection results.
Specifically, the share of livestock output value (initial: 3.01%) declines annually from 4.65% (baseline scenario) to 3.50% (2030–2035), following the Recommendations of the Central Committee of the Communist Party of China for Formulating the 14th Five-Year Plan for National Economic and Social Development and a historical decline of 0.2 percentage points per year; under low-carbon and ultra-low-carbon scenarios, the decline narrows from 4.50% to 3.00% and from 4.00% to 2.50%, respectively. Per capita disposable income (initial: 39,218 CNY) decreases annually from 5.34% to 4.00% (baseline), from 5.00% to 3.50% (low-carbon), and from 4.50% to 3.00% (ultra-low-carbon), based on employment promotion plans and slowing economic growth. Year-end resident population (initial: 1409.67 million) shows negative growth narrowing from −0.10% to −0.04% (baseline), from −0.08% to −0.02% (low-carbon), and from −0.06% to −0.01% (ultra-low-carbon), aligning with post-2022 trends and UN projections. Chemical fertilizer application inagriculture (initial: 50.217 million tons) declines annually from 0.67% to 0.37% (baseline), from 0.57% to 0.27% (low-carbon), and from 0.47% to 0.17% (ultra-low-carbon), following the 2025 Fertilizer Reduction Action Plan and seven consecutive years of decline. Year-end large livestock inventory (initial: 111.154 million head) declines annually from 4.34% to 1.34% (baseline), from 3.34% to 0.34% (low-carbon), and from 2.34% to 0.04% (ultra-low-carbon), influenced by grazing bans and dairy industry revitalization policies. Manure recycling rate (initial: 78.30%) increases annually from 1.40% to 1.10% (baseline), from 1.30% to 1.00% (low-carbon), and from 1.20% to 0.09% (ultra-low-carbon), approaching saturation (84.5% by 2035, consistent with policy targets of 80% by 2025 and 85% by 2030). These assumptions are aligned with the Recommendations of the Central Committee of the Communist Party of China for Formulating the 15th Five-Year Plan for National Economic and Social Development and national determined contributions (NDCs), ensuring scientific robustness and reproducibility of the projections.
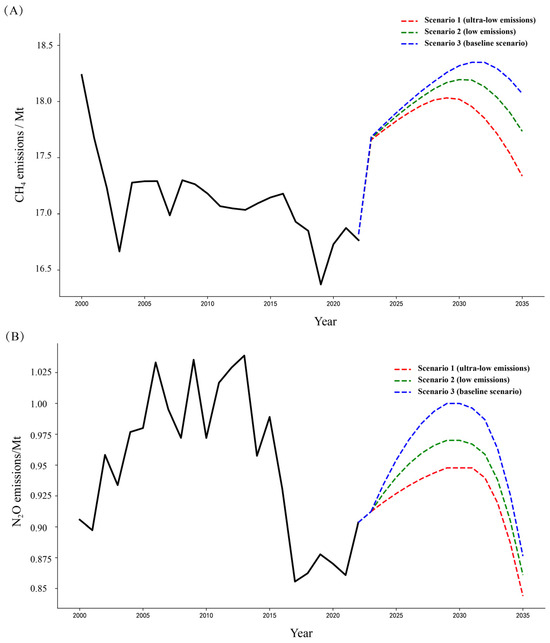
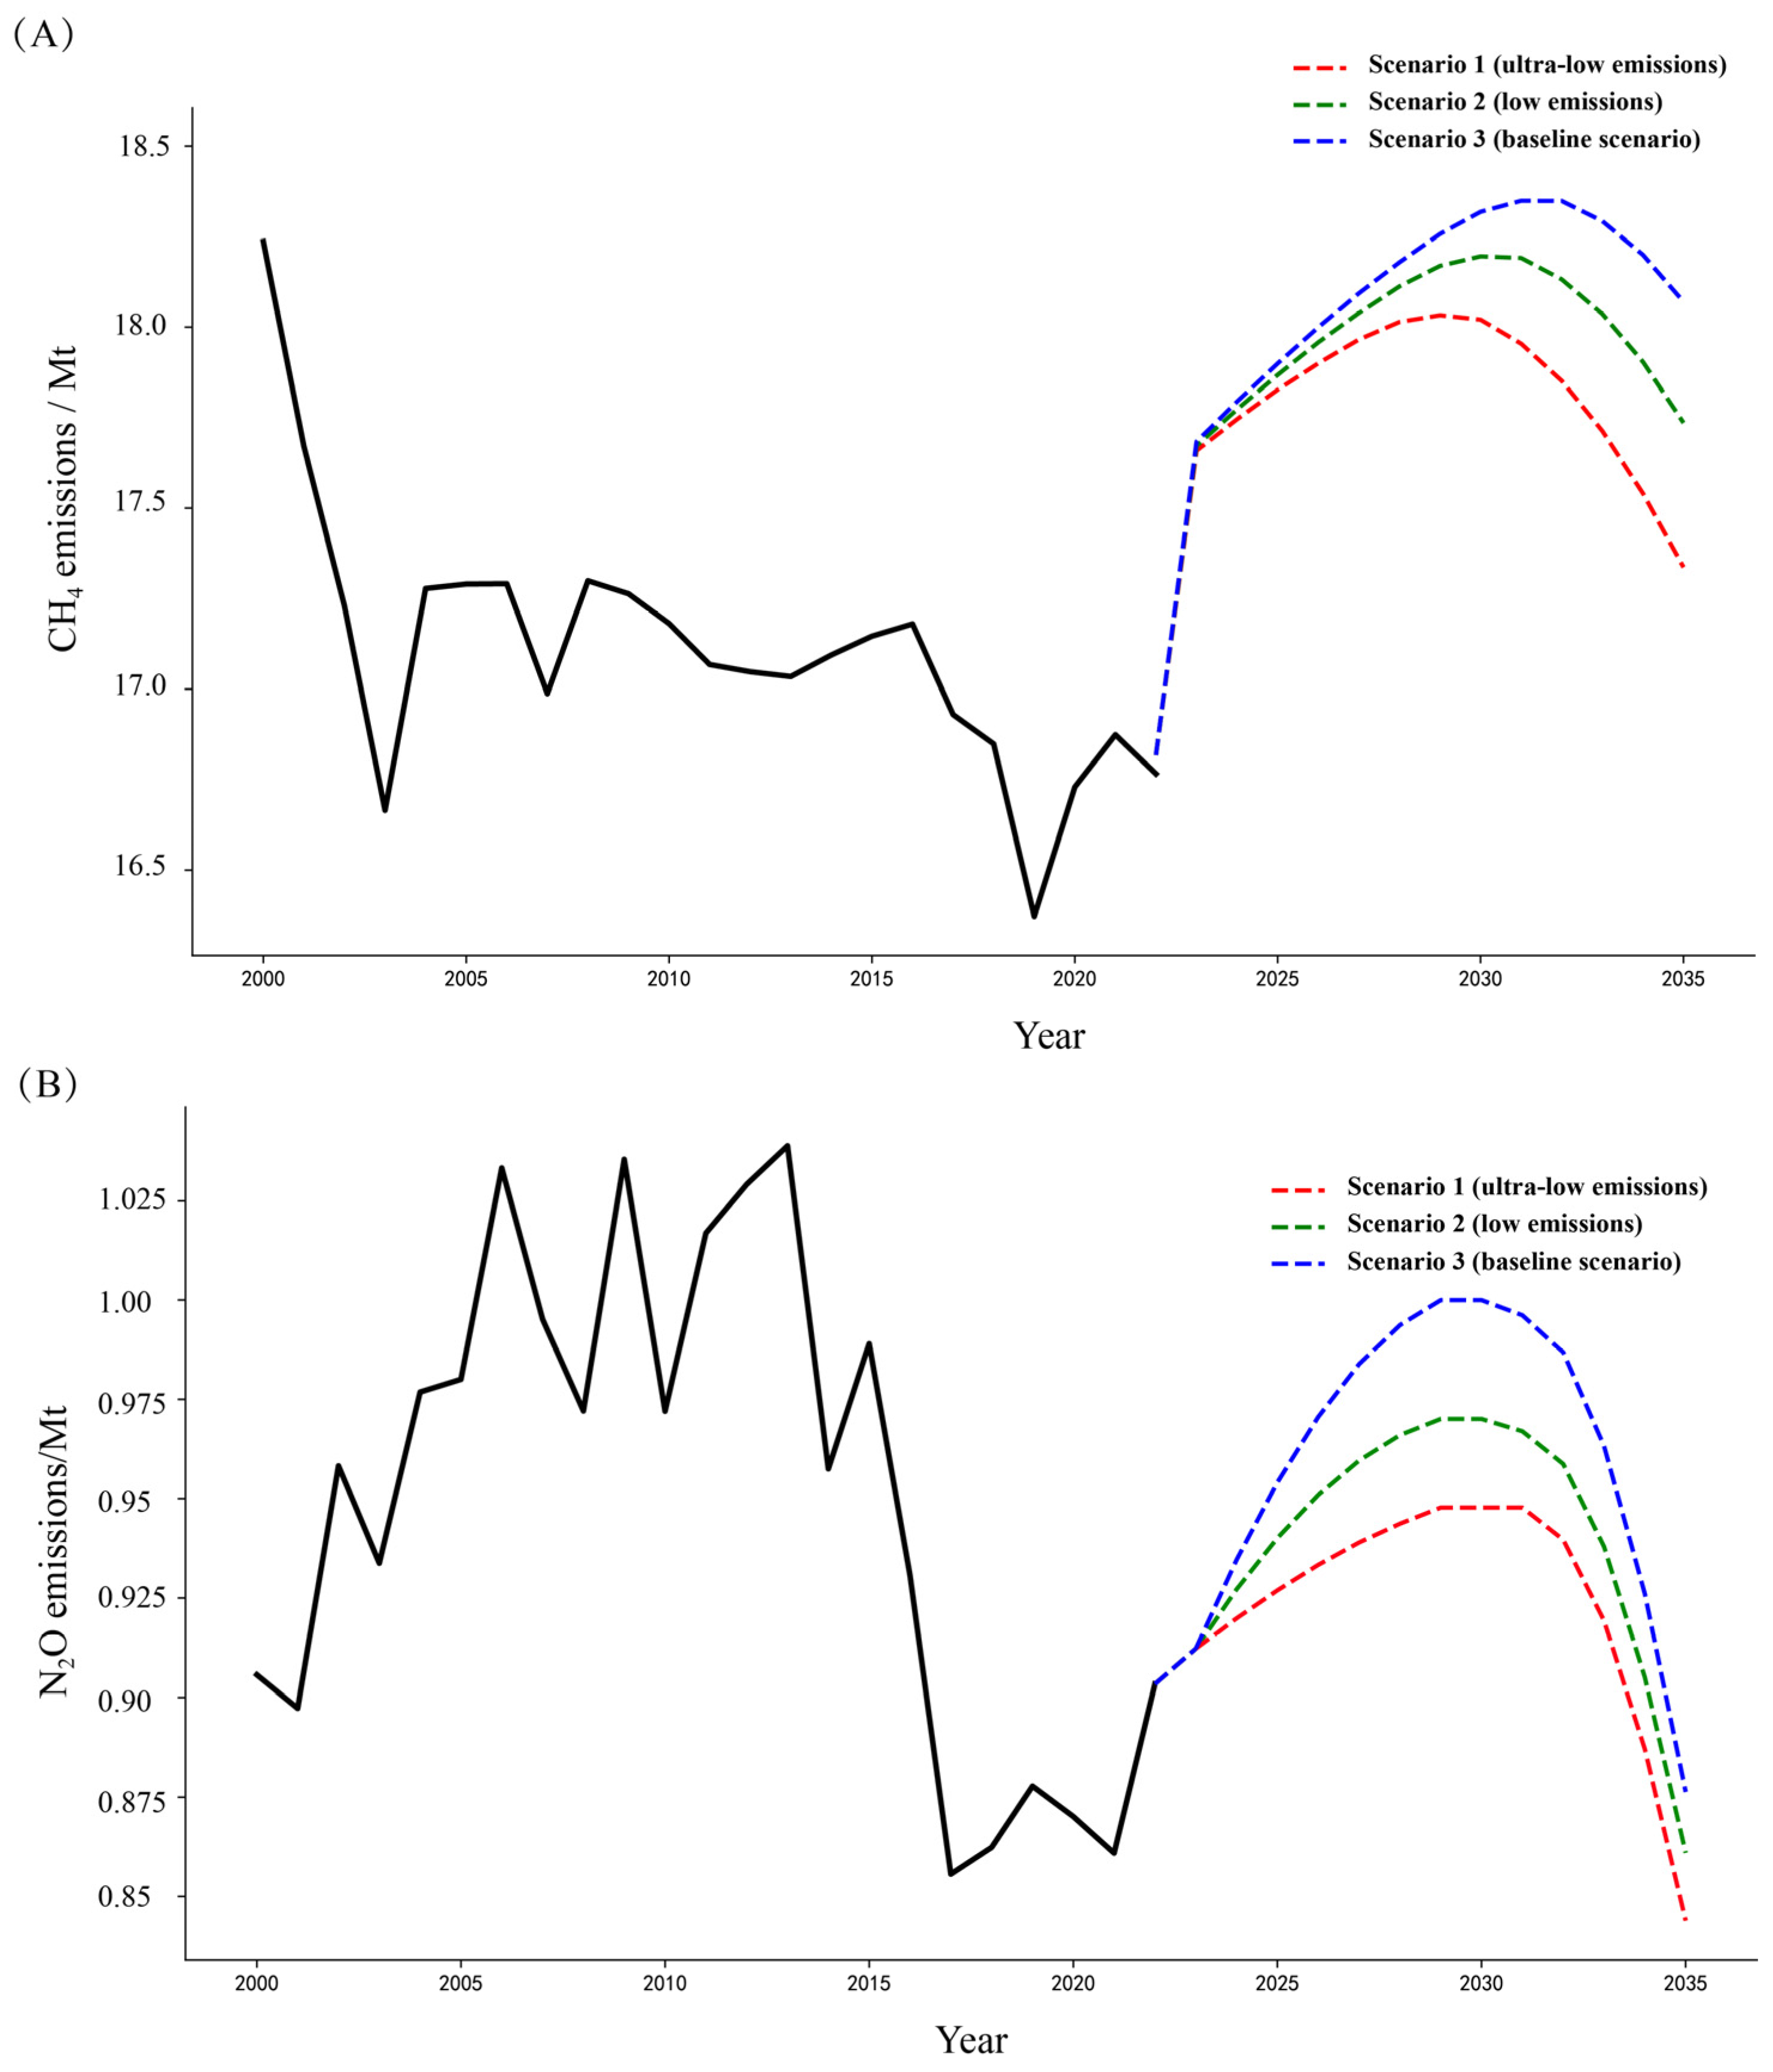
These data were substituted into the regression equations to obtain the projected peak emission years and corresponding peak values for total annual CH4 and N2O emissions from 2023 to 2035. The results are presented in Figure 7.
Figure 7.
Scenario projections of (A) CH4 and (B) N2O emissions from 2023 to 2035.
Under different scenarios, the evolution pathways of CH4 and N2O emissions from China’s animal husbandry exhibit markedly distinct trajectories. For CH4, under the baseline scenario, emissions continue to rise from 16.8 Mt in 2020, reaching a peak of 18.4 Mt in 2032. Under the low-carbon scenario, the growth rate of emissions is significantly dampened, with a projected peak of approximately 18.3 Mt in 2031, lower than that in the baseline scenario. Under the ultra-low-carbon scenario, benefiting from more proactive industrial restructuring and manure resource utilization, emissions are expected to peak at 18.0 Mt around 2029 and subsequently decline (Figure 7A). N2O emissions exhibit a common pattern of initially increasing and then decreasing, though the timing and magnitude of the peak vary by scenario. Under the baseline scenario, emissions gradually rise from 0.920 Mt in 2020, reaching a peak of 0.995 Mt in 2030, followed by a slow decline. Under the low-carbon scenario, the peak also occurs in 2030, with a peak level of 0.96 Mt. Under the ultra-low-carbon scenario, emissions are projected to peak in 2029 and then decline at an accelerated pace, with emissions in 2035 being significantly lower than those in the baseline scenario. The differences in peak timing and peak levels for the two gases across scenarios directly reflect the decisive influence of mitigation policy intensity on the emission pathways of greenhouse gases from the animal husbandry sector (Figure 7B).
4. Discussion
4.1. Synergistic Emission Characteristics of CH4 and N2O from Animal Husbandry
CH4 and N2O emissions from China’s animal husbandry exhibit pronounced spatiotemporal synergy and divergence. Temporally, the two gases share a notable common origin, as both enteric fermentation and manure management derive from livestock production activities; nevertheless, their emission trajectories diverge considerably. CH4 emissions declined steadily from 2000 to 2012, remained at a low plateau during 2013–2019, and surged to historical highs over 2020–2024. In contrast, N2O emissions fluctuated intensely without a clear monotonic trend, peaking in 2006 and 2011–2013, dropping to a trough in 2016–2020, and rebounding again after 2021. This divergence is consistent with CH4 emissions are largely governed by livestock population size and enteric fermentation intensity, thus displaying a strong trend [26,36,37], whereas N2O emissions are tightly coupled to seasonal shifts in manure management practices and storage conditions, resulting in more pronounced interannual variability [38]. Spatially, high-emission zones for the two gases overlap substantially, both clustering in the major northern production regions (Shandong, Henan, Inner Mongolia, and Heilongjiang), indicating a dominant role of livestock population size in shaping the spatial emission pattern [39]. Studies have further confirmed that, among agricultural greenhouse gas emission sources, the emission factor exerts a greater influence than animal numbers, making the reduction in emission factors the key to mitigation [34]. Li et al. [18] additionally showed that economic factors positively influence agricultural CH4 and N2O emissions, whereas efficiency factors exert a suppressive effect. This aligns with our observation that the two gases rebounded synchronously after 2019, a phenomenon closely associated with the post-pandemic recovery of livestock production.
The emission patterns of CH4 and N2O from the animal husbandry across the five countries share similarities but also exhibit notable differences. China dominates emissions of both gases, accounting for 86.4% of CH4 and 86.9% of N2O, underscoring its central role in global agricultural GHG mitigation. Emission structures closely reflect livestock production systems [25]. Pasture-based countries (New Zealand, Australia) are dominated by enteric fermentation, which contributes 87.7% and 93.7% of their CH4 emissions, respectively. In more intensive systems (Netherlands, Denmark), manure management plays a substantial role, accounting for 32.4% and 42.5% of CH4, and 10.0% and 11.0% of N2O. In China, CH4 emissions are equally derived from enteric fermentation and rice paddies (45.9% and 46.0%), whereas N2O emissions originate mainly from rice paddies (71.4%). In the other countries, CH4 emissions overwhelmingly stem from enteric fermentation. The contribution of manure management to total emissions in China (8.1% for CH4, 9.6% for N2O) exceeds that of Australia but remains below levels in The Netherlands and Denmark, reflecting cross-country differences in manure treatment practices and regulatory stringency [40,41].
However, assessing the sustainability of the agricultural and animal husbandry solely based on absolute total methane emissions is insufficient. We find a few studies emphasize the critical importance of evaluating emission intensity—defined as CH4 emissions per unit of product produced, such as CH4 emissions per kg of meat [42], per kg of milk [42], and per kg of rice [43]. These indices are crucial as they reflect how efficiently the agricultural system transforms feed, water, and other inputs into human-consumable products. For example, while total emissions might be high in intensive dairy or beef systems, their CH4 emissions per kg of milk or meat are often substantially lower due to optimized feed efficiency, superior animal genetics, and advanced health management compared to extensive systems [42,44]. Similarly, in rice cultivation, improved agronomic practices and water management can significantly reduce CH4 emissions per kg of rice yielded [44]. Currently, China’s GHG emission intensity per unit of agricultural and livestock output remains considerably higher than that of developed countries with highly optimized intensive systems, indicating substantial mitigation potential [45]. Therefore, synergistic mitigation strategies must not only target absolute emission reductions but also prioritize enhancing production efficiency to ensure food security alongside climate goals.
Scenario projections reveal divergent evolutionary pathways for CH4 and N2O emissions from China’s animal husbandry, yet both gases exhibit a coordinated response to varying policy stringency. Stronger mitigation measures effectively advance emission peaks and reduce their magnitude, highlighting the synergistic role of technological intervention and structural optimization in curbing livestock GHG emissions. The differing source profiles—CH4 dominated by enteric fermentation and N2O by manure management—result in distinct sensitivities to production changes, explaining the observed differences in peak timing under the same scenarios [46]. Strengthening synergistic abatement of non-CO2 GHGs is a critical component of climate action, with technology development, deployment, and market mechanisms serving as key enablers. Agricultural mitigation strategies should prioritize industrial restructuring and improvements in production efficiency [47]. The scenario analysis further demonstrates that policy intensity directly determines emission trajectories. Future efforts should therefore integrate the regulation of enteric fermentation with advances in manure treatment technologies to achieve coordinated reductions in both gases [48].
4.2. Synergistic Mitigation Strategies for CH4 and N2O from Animal Husbandry
4.2.1. “Top-Down” Government Guidance
- (a)
- Strengthening the emission data foundation and establishing a differentiated accounting framework
Greenhouse gas accounting for China’s animal husbandry started relatively late, and challenges such as inconsistent accounting methodologies and insufficient localization of emission factors remain, limiting the precision of mitigation policy design. It is recommended that, building on the existing livestock statistics system, representative livestock-producing provinces be selected to conduct localized measurements of emission factors, with the goal of gradually establishing a dynamic emission factor database disaggregated by region and livestock type. In terms of monitoring capacity development, the integrated model adopted by New South Wales—which incorporates high-precision greenhouse gas monitoring equipment into existing air quality monitoring networks—offers a useful reference [48]. Online CH4 monitoring facilities could be deployed in key livestock-producing areas, and the accuracy and timeliness of emission inventories could be enhanced through the integration of statistical surveys, remote sensing inversion, and ground-based observational data [49].
- (b)
- Setting synergistic mitigation targets and implementing categorized and tiered control pathways
CH4 and N2O emissions from animal husbandry should be incorporated into the provincial greenhouse gas inventory management framework, and emission control requirements for key livestock-producing counties should be clearly defined in alignment with the national carbon peak and carbon neutrality strategy [50]. Given the differing drivers of the two gases—CH4 emissions are dominated by enteric fermentation, while N2O emissions are primarily associated with manure management—a uniform mitigation pathway should be avoided. Instead, the principle of “differentiated gas management” as established in New Zealand’s Climate Change Response (Zero Carbon) Amendment Act 2019 could serve as a reference, with distinct phased targets set for each gas according to its emission characteristics. Furthermore, a key monitoring list for major livestock-producing counties should be established, with joint dynamic assessments conducted by the ecological and environmental authorities and the agricultural and rural affairs departments.
- (c)
- Establishing emission functional zones and implementing targeted control measures
Given China’s vast territory, livestock-producing regions vary considerably in resource endowments, production scale, and technological capacity. We recommend dividing the country into distinct functional zones based on emission intensity, livestock structure, and environmental carrying capacity—for example, intensive livestock farming zones in the north, smallholder farming zones in the southern hilly areas, and pastoral zones in agro-pastoral ecotones. Differentiated control guidelines should be developed for each zone: high-emission areas should be prioritized for supervision and periodic verification, while areas with high mitigation potential should receive greater technical guidance and policy support [51]. At the same time, large-scale livestock farms should be encouraged to establish annual carbon emission accounts, with greenhouse gas management gradually incorporated into the existing environmental regulatory framework.
4.2.2. “Bottom-Up” Farmer-Driven Approaches
- (d)
- Strengthening the participation of livestock producers and bridging the “last mile” of technology adoption
Livestock producers are the direct implementers of mitigation measures, yet their technical knowledge and adoption capacity vary considerably, which constitutes a critical factor limiting mitigation effectiveness [52]. It is recommended that policy focus be directed toward producers by establishing a regular mechanism for technical exchange, facilitating information sharing between research institutions and grassroots livestock farms. Drawing on the experience of New Zealand’s Agricultural Emissions Center and the AgriZeroNZ public–private partnership platform, a technology extension and service platform could be developed. Practical operational guidelines should be formulated focusing on key areas such as enteric fermentation regulation and manure resource utilization, with targeted training delivered through the grassroots agricultural extension system to ensure that technological advances are effectively implemented on the ground [53].
- (e)
- Optimizing incentive policy design to balance emission reduction benefits with farmer incomes
Given that producers are highly sensitive to input costs, overly burdensome mitigation requirements could weaken their willingness to adopt new practices. It is recommended that preferential treatment be provided within the existing fiscal subsidy framework for farms adopting low-carbon livestock technologies. Additionally, mitigation activities such as manure resource utilization and biogas projects could be integrated into the voluntary greenhouse gas emission reduction trading system, offering producers predictable economic returns [54]. Drawing on New Zealand’s approach—which explicitly avoids taxing agricultural CH4 emissions and instead relies on industry collaboration and processor incentives—policy design should prioritize reducing compliance costs for farmers while fostering intrinsic motivation for proactive mitigation.
- (f)
- Improving demonstration and dissemination mechanisms to develop replicable mitigation models
At the national level, targeted surveys on carbon emissions from the animal husbandry should be organized to systematically assess the effectiveness and applicability of mitigation practices across different regions. For low-carbon livestock models that are well-established and demonstrate significant benefits, demonstration sites should be established in representative areas for pilot implementation. Through these pilots, experience can be accumulated and technical parameters refined, gradually forming integrated pathways that can be replicated and scaled up. Concurrently, active participation in international exchanges within relevant fields should be pursued, introducing applicable mitigation technologies and standards through bilateral or multilateral cooperation to support domestic capacity building and elevate the overall level of low-carbon development in China’s animal husbandry.
5. Conclusions
Based on CH4 and N2O emission data from China’s animal husbandry from 2000 to 2024, this study systematically characterized the emission patterns and synergistic mitigation pathways of the two greenhouse gases through international comparison, spatial analysis, and scenario projection. The main conclusions are as follows:
- (1)
- From the perspective of temporal evolution and international comparison, China’s animal husbandry CH4 emissions have exhibited an early-stage fluctuating trend followed by a late-stage rebound, while N2O emissions have fluctuated sharply. The two gases display strong synergy yet are driven by distinct mechanisms. Globally, China’s total emissions dominate, and its emission structure is characterized by comparable contributions from enteric fermentation and rice paddies—a feature distinct from both pasture-based and intensive developed countries.
- (2)
- Spatially, CH4 and N2O emissions share highly similar distribution patterns. High-emission areas have become increasingly concentrated from the North China Plain to the northern agro-pastoral ecotone, forming contiguous high-emission zones across major northern production regions. Emissions in southern provinces remain generally low, underscoring the dominant role of production scale and resource endowments in shaping spatial patterns.
- (3)
- Scenario projections reveal distinct peak pathways for the two gases under different mitigation intensities. In the baseline scenario, CH4 emissions continue to rise and peak in 2032, while N2O emissions peak in 2030 and then decline slowly. In the low-carbon scenario, growth rates of both gases slow considerably, with lower peak levels. In the ultra-low-carbon scenario, both gases peak earlier, in 2029, with further reductions in peak magnitudes. Structural changes and efficiency improvements are key drivers of emission reductions, and policy stringency decisively shapes emission trajectories. The two gases thus offer substantial potential for synergistic mitigation.
- (4)
- For synergistic mitigation, a regionally differentiated control framework combining top-down government guidance with bottom-up farmer participation should be established. At the government level, priorities include strengthening accounting systems and implementing functional zoning for targeted regulation. At the farmer level, efforts should focus on facilitating technology adoption and improving incentive policies. Given the differing drivers of the two gases, mitigation strategies must avoid a one-size-fits-all approach. Instead, coordinated efforts to manage enteric fermentation and optimize manure treatment are essential to achieve synergistic reductions and support the low-carbon transition of the animal husbandry.
Author Contributions
Conceptualization, L.Y., M.W., X.F. and L.Z.; Methodology, L.Y. and M.W.; Investigation, L.Y., M.W. and X.F.; Writing—Original Draft, L.Y.; Writing—Review and Editing, X.F., L.Z. and M.W.; Funding Acquisition and Supervision, X.F. and L.Z. All authors have read and agreed to the published version of the manuscript.
Funding
This work was supported by the National Natural Science Foundation of China under Grant Number 42107502.
Institutional Review Board Statement
Not applicable.
Informed Consent Statement
Not applicable.
Data Availability Statement
The data presented in this study are available on request from the corresponding authors.
Conflicts of Interest
The authors declare no conflicts of interest.
Appendix A
Table A1.
Sector names of CH4 and N2O emission sources and their IPCC codes.
References
- FAO. Livestock’s Long Shadow: Environmental Issues and Options; FAO: Rome, Italy, 2006; Volume 16, p. 7. [Google Scholar]
- Clough, T.J.; Cardenas, L.M.; Friedl, J.; Wolf, B. Nitrous oxide emissions from ruminant urine: Science and mitigation for intensively managed perennial pastures. Curr. Opin. Environ. Sustain. 2020, 47, 21–27. [Google Scholar] [CrossRef]
- FAO. How to Feed the World in 2050. Available online: https://www.fao.org/fileadmin/templates/wsfs/docs/expert_paper/How_to_Feed_the_World_in_2050.pdf (accessed on 20 February 2025).
- IPCC. Climate Change 2021—The Physical Science Basis: Working Group I Contribution to the Sixth Assessment Report of the Intergovernmental Panel on Climate Change; Cambridge University Press: Cambridge, UK, 2023. [Google Scholar]
- Institute for Global Environmental Strategies. NDC Database, version 7.4; Institute for Global Environmental Strategies: Hayama, Japan, 2022. Available online: https://pub.iges.or.jp/pub/iges-ndc-database (accessed on 20 February 2025).
- Wang, J.; Ciais, P.; Smith, P.; Yan, X.; Kuzyakov, Y.; Liu, S.; Li, T.; Zou, J. The role of rice cultivation in changes in atmospheric methane concentration and the Global Methane Pledge. Glob. Change Biol. 2023, 29, 2776–2789. [Google Scholar] [CrossRef]
- Methane Review Panel. Methane Science and Target Review; Methane Review Panel: Wellington, New Zealand, 2024. [Google Scholar]
- FAO. World Food and Agriculture-Statistical Yearbook; FAO: Rome, Italy, 2022. [Google Scholar] [CrossRef]
- Qian, H.; Zhu, X.; Huang, S.; Linquist, B.; Kuzyakov, Y.; Wassmann, R.; Minamikawa, K.; Martinez-Eixarch, M.; Yan, X.; Zhou, F.; et al. Greenhouse gas emissions and mitigation in rice agriculture. Nat. Rev. Earth Environ. 2023, 4, 716–732. [Google Scholar] [CrossRef]
- Havlík, P.; Valin, H.; Herrero, M.; Obersteiner, M.; Schmid, E.; Rufino, M.C.; Mosnier, A.; Thornton, P.K.; Böttcher, H.; Conant, R.T.; et al. Climate change mitigation through livestock system transitions. Proc. Natl. Acad. Sci. USA 2014, 111, 3709–3714. [Google Scholar] [CrossRef]
- Hu, Z.; Zhang, X.; Dong, H.; Wang, S.; Reis, S.; Li, Y.; Gu, B. Integrated livestock sector nitrogen pollution abatement measures could generate net benefits for human and ecosystem health in China. Nat. Food 2022, 3, 161–168. [Google Scholar] [CrossRef] [PubMed]
- Chang, J.; Peng, S.; Yin, Y.; Ciais, P.; Havlik, P.; Herrero, M. The key role of production efficiency changes in livestock methane emission mitigation. AGU Adv. 2021, 2, e2021AV000391. [Google Scholar] [CrossRef]
- Cross, L.; Gruère, A. Public Summary—Medium-Term Fertilizer Outlook 2023–2027. In Proceedings of the IFA Annual Conference; IFA: Berlin, Germany, 2023. [Google Scholar]
- Tian, H.; Pan, N.; Thompson, R.L.; Canadell, J.G.; Suntharalingam, P.; Regnier, P.; Davidson, E.A.; Prather, M.; Ciais, P.; Muntean, M.; et al. Global nitrous oxide budget 1980–2020. Earth Syst. Sci. Data 2024, 16, 2543–2604. [Google Scholar] [CrossRef]
- Duan, Y.; Gao, Y.; Zhao, J.; Xue, Y.; Zhang, W.; Wu, W.; Jiang, H.; Cao, D. Agricultural methane emissions in China: Inventories, driving forces and mitigation strategies. Environ. Sci. Technol. 2023, 57, 13292–13303. [Google Scholar] [CrossRef] [PubMed]
- Wang, X.; Gao, Y.; Wang, K.; Sang, Y.; Wang, Y.; Zhang, Y.; Hong, S.; Zhang, Y.; Yuan, W. The greenhouse gas budget for China’s terrestrial ecosystems. Natl. Sci. Rev. 2023, 10, nwad274. [Google Scholar] [CrossRef]
- Ministry of Ecology and Environment of China. Methane Emission Control Action Plan. 2023. Available online: https://www.mee.gov.cn/xxgk2018/xxgk/xxgk03/202311/t20231107_1045421.html (accessed on 7 November 2023).
- Li, Y.; Chen, M.P. Influencing factors of methane and nitrous oxide emissions from agricultural sources in China. Acta Sci. Circumstantiae 2021, 41, 710–717. [Google Scholar]
- Yuan, J.; Liu, Y.; Tang, R.; Ma, R.; Li, G. A review of carbon and nitrogen losses and greenhouse gas emissions during livestock manure composting. J. Agro-Environ. Sci. 2021, 40, 2428–2438. [Google Scholar]
- Sun, J.; Zhao, G.; Li, M.M. Using Nutritional Strategies To Mitigate Ruminal Methane Emissions From Ruminants. Front. Agric. Sci. Eng. 2023, 10, 390–402. [Google Scholar] [CrossRef]
- Zhang, X.M.; Wang, R.; Ma, Z.Y.; Wang, M.; Tan, Z. Enteric methane emissions and mitigation strategies in ruminants. J. Agro-Environ. Sci. 2020, 39, 732–742. [Google Scholar]
- Chen, R.R.; Wang, Y.M.; Hu, J.L.; Lin, X. Methane emission and mitigation strategies in animal manure management system. Acta Pedol. Sin. 2012, 49, 815–823. [Google Scholar]
- Hu, W.L.; Huang, M.L.; Wang, H.L. Methane emission and mitigation strategy of animal husbandry under low carbon background. J. Huazhong Agric. Univ. (Nat. Sci. Ed.) 2022, 41, 115–123. [Google Scholar]
- Wang, K.Y.; Li, X.; Lu, J.D.; Zhou, B.; He, Y. Low-carbon development strategies of livestock industry to achieve goal of carbon neutrality in China. Trans. Chin. Soc. Agric. Eng. 2022, 38, 230–238. [Google Scholar]
- Wang, X.X.; Li, J.K.; Ye, L.; Lin, B. Mitigation of non-CO2 greenhouse gas emissions in China’s agricultural sector: Policy measures, technology applications, and future perspectives. Chin. J. Eco-Agric. 2024, 32, 1793–1804. [Google Scholar]
- Zhang, J.X.; Liu, J.T.; Huang, M.L.; Wang, H.L.; Hu, W.L. Analysis of Spatiotemporal Heterogeneity and Influencing Factors of Methane Emissions from Animal Husbandry in China. Res. Environ. Sci. 2025, 38, 1184–1194. [Google Scholar] [CrossRef]
- Gu, S.Y.; Qiu, Z.J.; Zhan, Y.B.; Wang, F.; Zhang, Y.; Chen, S.H. Spatial-temporal characteristics and trend prediction of carbon emissions from animal husbandry in China. J. Agro-Environ. Sci. 2023, 42, 705–714. [Google Scholar]
- Chen, Y.; Shang, J. Estimation and Effecting Factor Decomposition of Green House Gas Emission of Animal Husbandry Industry in Four Pastoral Areas. China Popul. Resour. Environ. 2014, 24, 89–95. [Google Scholar]
- Solazzo, E.; Crippa, M.; Guizzardi, D.; Muntean, M.; Choulga, M.; Janssens-Maenhout, G. Uncertainties in the emissions database for global atmospheric research (EDGAR) emission inventory of greenhouse gases. Atmos. Chem. Phys. 2021, 21, 5655–5683. [Google Scholar] [CrossRef]
- Oreggioni, G.D.; Ferraio, F.M.; Crippa, M.; Muntean, M.; Schaaf, E.; Guizzardi, D.; Solazzo, E.; Duerr, M.; Perry, M.; Vignati, E. Climate change in a changing world: Socio-economic and technological transitions, regulatory framework and trends on global greenhouse gas emissions from EDGAR v.5.0. Glob. Environ. Change 2021, 70, 102350. [Google Scholar] [CrossRef]
- Crippa, M.; Guizzardi, D.; Pagani, F.; Banja, M.; Muntean, M.; Schaaf, E.; Becker, W.; Monforti-Ferrario, F.; Quadrelli, R.; Risquez Martin, A.; et al. Insights into the spatial distribution of global, national and subnational greenhouse gas emissions in the emissions database for global atmospheric research (EDGAR v8.0). Earth Syst. Sci. Data 2024, 16, 2811–2830. [Google Scholar] [CrossRef]
- York, R.; Rosa, E.A.; Dietz, T. STIRPAT, IPAT and ImPACT: Analytic tools for unpacking the driving forces of environmental impacts. Ecol. Econ. 2003, 46, 351–365. [Google Scholar] [CrossRef]
- York, R.; Rosa, E.A.; Dietz, T. Bridging environmental science with environmental policy: Plasticity of population, affluence, and technology. Soc. Sci. Q. 2002, 83, 18–34. [Google Scholar] [CrossRef]
- Zhang, X.Z. Assessment of Methane and Nitrous Oxide Emissions from Agricultural Systems in Mainland China and Low-Carbon Measures. Ph.D. Thesis, Jilin Agricultural University, Changchun, China, 2023. [Google Scholar]
- Zhu, Z.P.; Dong, H.M.; Wei, S.; Ma, J.; Xue, P. Impact of changes in livestock and poultry manure management on greenhouse gas emissions in China. J. Agro-Environ. Sci. 2020, 39, 743–748. [Google Scholar]
- Xu, B.; Wang, L.Z.; Yan, T. Methane emission inventories for enteric fermentation and manure management of yak, buffalo, dairy and beef cattle in China (1988–2009). Agric. Ecosyst. Environ. 2014, 195, 202–210. [Google Scholar] [CrossRef]
- Gao, Y.Y.; Li, Z.M.; Hong, S.B.; Zhang, L.; Xu, M.; Wang, X.H. Recent stabilization of agricultural non-CO2 greenhouse gas emissions in China. Natl. Sci. Rev. 2025, 12, nwaf040. [Google Scholar] [CrossRef]
- Hu, B.; Zhang, L.J.; Liang, C.; Zhang, T.; Wang, Y.C.; Li, Y. Characterizing spatial and temporal variations in CH4 emissions from dairy manure management in China based on IPCC methodology. Agriculture 2024, 14, 753. [Google Scholar] [CrossRef]
- Han, R.M.; Wang, Y.; Fan, Y.Q.; Wang, H.L.; Li, X.Y. Spatial-temporal evolution and influencing factors of nitrous oxide emissions from animal husbandry in China. J. Agric. Resour. Environ. 2026, 43, 186–193. [Google Scholar] [CrossRef]
- Chen, Z.L. A study on the comparison of urban fecal treatment system models at home and abroad. J. Wuhan. Urban. Constr. Inst. 2000, 1, 48–51. [Google Scholar]
- Hu, Y.; Hu, J.Z. The Latest Progress of Denmark’s Livestock Carbon Tax and Its Enlightenment to China. Environ. Prot. 2025, 53, 75–78. [Google Scholar] [CrossRef]
- Gerber, P.J.; Steinfeld, H.; Henderson, B.; Mottet, A.; Opio, C.; Dijkman, J.; Falcucci, A.; Tempio, G. Tackling Climate Change Through Livestock: A Global Assessment of Emissions and Mitigation Opportunities; Food and Agriculture Organization of the United Nations (FAO): Rome, Italy, 2013. [Google Scholar]
- Knapp, J.R.; Laur, G.L.; Vadas, P.A.; Weiss, W.P.; Tricarico, J.M. Invited review: Enteric methane in dairy cattle production: Quantifying the opportunities and impact of reducing emissions. J. Dairy Sci. 2014, 97, 3231–3261. [Google Scholar] [CrossRef]
- Linquist, B.; van Groenigen, K.J.; Adviento-Borbe, M.A.; Pittelkow, C.; van Kessel, C. An agronomic assessment of greenhouse gas emissions from major cereal crops. Glob. Change Biol. 2015, 18, 194–209. [Google Scholar] [CrossRef]
- Zhu, Z.; Wang, Y.; Yan, T.; Zhao, J.; Zhang, W. Greenhouse gas emissions from livestock in China and mitigation options within the context of carbon neutrality. Front. Agric. Sci. Eng. 2023, 10, 226–233. [Google Scholar] [CrossRef]
- Li, S.J.; Zhang, Q.X.; Shi, X.Y.; Sun, Y.; Zhao, L.J. Spatial-temporal evolution, regional difference and heterogeneity influencing factors of carbon emissions from animal husbandry in China. Acta Ecol. Sin. 2026, 46, 3279–3295. [Google Scholar]
- He, L.J.; Ma, H.M. Theoretical Logic and Implementation Pathways of the Green and Low-Carbon Transformation of Animal Husbandry in the Process of Chinese-Style Modernization. Anim. Husb. Feed. Sci. 2026, 47, 92–97. [Google Scholar]
- Qiang, S.Y.; Han, X.; Huang, Y.B.; Wang, J.L.; Liu, Y. Current status of methane emissions in the livestock sector, emission reduction technologies, and challenge analysis. Clim. Change Res. 2026, 22, 186–197. [Google Scholar]
- Wang, J.L.; Jiang, Z.X.; Liu, Y.; Qiang, S.Y.; Han, X. Agricultural methane emissions in China: Dynamic accounting, socio-economic drivers and future trends. J. Agro-Environ. Sci. 2026. Available online: https://link.cnki.net/urlid/12.1347.S.20260311.1544.007 (accessed on 20 February 2025).
- Liu, S.L.; Yan, W.; Gao, Q.X.; Wang, Y.; Zhang, X. Dual-Perspective Analysis of the Warming Effect of the Methane Emissions from Animal Husbandry in China. Environ. Sci. 2023, 44, 6692–6699. [Google Scholar]
- Zhou, J.; Ma, Y.H.; Yang, S.Y.; Wang, L.J. Mechanism of Greenhouse Gases Emission from Livestock and Its Reducing Measures. Agric. Environ. Dev. 2013, 30, 78–82. [Google Scholar]
- Zhu, G.D. Characterizing CH4 and N2O Emissions from Intensive Dairy Operations. Master’s Thesis, Hebei Agricultural University, Baoding, China, 2014. [Google Scholar]
- Huang, M.G.; Chen, B.G. Implementation of manure reduction and resource utilization in animal husbandry. North. Anim. Husb. 2025, 2, 53. [Google Scholar]
- Li, G.L.; Wu, Z.H.; Zhao, L.S.; Zhang, Y.L.; Wang, J.F. Advancements in Researchon Methane Emission Reduction in Ruminant Animals. China Anim. Husb. Vet. Med. 2024, 51, 4812–4823. [Google Scholar]

Disclaimer/Publisher’s Note: The statements, opinions and data contained in all publications are solely those of the individual author(s) and contributor(s) and not of MDPI and/or the editor(s). MDPI and/or the editor(s) disclaim responsibility for any injury to people or property resulting from any ideas, methods, instructions or products referred to in the content. |
© 2026 by the authors. Licensee MDPI, Basel, Switzerland. This article is an open access article distributed under the terms and conditions of the Creative Commons Attribution (CC BY) license.