


Abstract
Research on the differences and correlations of typhoon precipitation along similar trajectories, as well as their underlying causes, remains insufficient. Therefore, this study selects two typhoons with similar tracks but significantly different precipitation characteristics—Chanthu (2114) and Mitag (1918) in the Western Pacific—as research cases. Using the China Meteorological Administration best-track dataset, ERA5 reanalysis data, surface station observations, and GPM IMERG precipitation products, their precipitation features and underlying mechanisms are analyzed. Results show that the area-averaged land precipitation associated with Chanthu (51.9 mm) was nearly twice that of Mitag (27.2 mm). Chanthu produced broader and more persistent rainfall, mainly distributed along the northern side of its track, whereas Mitag exhibited weaker and more scattered precipitation. These differences were primarily related to the combined effects of large-scale circulation, moisture transport, dynamical and thermodynamic structure, and convective instability. During Chanthu, the subtropical high remained stable and the upper-level trough stayed farther north, favoring the maintenance of an organized typhoon structure. Chanthu also featured stronger upper-level divergence, sustained dual-channel moisture transport, a deeper warm-core structure, stronger upward motion, and better-developed convective instability. In contrast, Mitag was affected by the southward extension of the upper-level trough and the eastward retreat of the subtropical high, together with weaker divergence, insufficient moisture supply, a shallower structure, and weaker instability. Overall, precipitation differences between similarly tracked typhoons result from the synergistic effects of multiple environmental and internal factors. These findings improve understanding of typhoon precipitation mechanisms and may provide guidance for forecasting.
1. Introduction
Typhoons represent one of the most destructive weather systems affecting China [1], owing to their abrupt development [2] and substantial impacts [3]. They are capable of producing extreme winds, intense precipitation, and storm surges, and often induce secondary hazards such as flooding, landslides, and debris flows, thereby posing significant risks to life and property [4,5,6]. In recent years, typhoon-induced precipitation along the southeastern coast of China has exhibited a noticeable increase in both frequency and intensity, further exacerbating the challenges associated with quantitative precipitation forecasting [7,8,9]. Despite considerable improvements in typhoon track prediction, accurately forecasting precipitation remains a major challenge [10,11,12]. Recent studies using regional numerical modeling systems and satellite-based soil moisture assimilation have further demonstrated the potential to improve the prediction of tropical cyclone track, intensity, and associated heavy-rainfall processes, highlighting the importance of model representation and land–atmosphere initial conditions in operational forecasting [13,14,15]. Notably, even typhoons with similar tracks can produce markedly different precipitation characteristics in terms of intensity, extremity, and spatial distribution, which significantly constrains the reliability and applicability of similarity-based forecasting methods in operational settings [16,17,18,19].
Previous studies have extensively investigated the mechanisms underlying precipitation variability among typhoons and tropical cyclones with similar tracks, with particular emphasis on large-scale circulation, moisture transport, and tropical cyclone structure [20,21,22]. In terms of large-scale circulation, the configuration of the westerly trough and the subtropical high is widely recognized as a key factor influencing precipitation variability [23]. Environmental vertical wind shear also plays an important role in modulating the spatial distribution of heavy rainfall [24]. In addition, variations in moisture supply, dynamical forcing, and thermodynamic conditions are considered primary drivers of differences in typhoon-induced precipitation over long distances. Furthermore, the evolution of typhoon structure and its interaction with the surrounding atmospheric environment are crucial in shaping the spatial distribution of precipitation [25]. From the perspective of the typhoon’s internal structure, the duration of heavy rainfall is regarded as a more critical factor controlling cumulative precipitation than rainfall intensity alone [26]. Moreover, topography exerts a significant modulating effect on precipitation patterns [27]. Despite these advances, several limitations remain. First, many studies adopt a single-factor perspective, leading to an insufficient understanding of the synergistic interactions among circulation background, moisture transport, and dynamical–thermodynamical processes. Second, the quantitative relationship between the direction of vertical wind shear and precipitation distribution has yet to be robustly validated through representative case studies. Third, the role of the vertical configuration of convective instability and its potential amplification of precipitation extremes has received limited attention. Finally, investigations of moisture transport have predominantly focused on horizontal fluxes, with comparatively little emphasis on their vertical structural characteristics [28,29,30,31,32].
Although extensive research has been conducted on typhoon-induced precipitation, the differences in rainfall characteristics between typhoons following similar tracks, as well as the mechanisms underlying variations in precipitation intensity, remain unclear. To address this issue, Typhoon Mitag (1918) and Typhoon Chanthu (2114), which followed highly similar tracks but exhibited markedly different precipitation characteristics, were selected as typical cases for comparative analysis. Both systems formed over the northwestern Pacific in September and successively influenced Taiwan and the coastal regions of East China. Despite substantial overlap in the affected areas, pronounced differences were observed in precipitation intensity, spatial distribution, and duration, making these cases well suited for investigating the key factors governing such discrepancies. This study employs the China Meteorological Administration (CMA) tropical cyclone best-track dataset, ground-based observations, GPM IMERG half-hourly precipitation products, and ERA5 reanalysis data [33]. Focusing on the region spanning 20–28° N and 115–123° E, a comparative analysis is conducted on precipitation characteristics, large-scale circulation, vertical wind shear, moisture transport, and dynamical–thermodynamical structures. Specifically, this study aims to: (1) examine the modulating effect of vertical wind shear direction on precipitation distribution; (2) reveal the vertical structural characteristics of moisture transport and their controlling influence on precipitation intensity; and (3) elucidate the vertical configuration of convective instability and its amplifying effect on extreme precipitation. Based on these analyses, a multi-factor synergistic framework is proposed to explain precipitation differences among typhoons with similar tracks, providing a scientific basis for improving factor selection in typhoon precipitation forecasting and enhancing operational prediction capability.
This paper is organized as follows. Section 2 describes the study area, data, methods, and information on the two typhoons. Section 3 compares the precipitation intensity and rainfall distribution of typhoons Chanthu and Mitag. Section 4 examines the precipitation differences in relation to the hierarchical effects of key factors. Finally, Section 5 summarizes the main mechanisms responsible for the precipitation differences.
2. Materials and Methods
2.1. Study Area
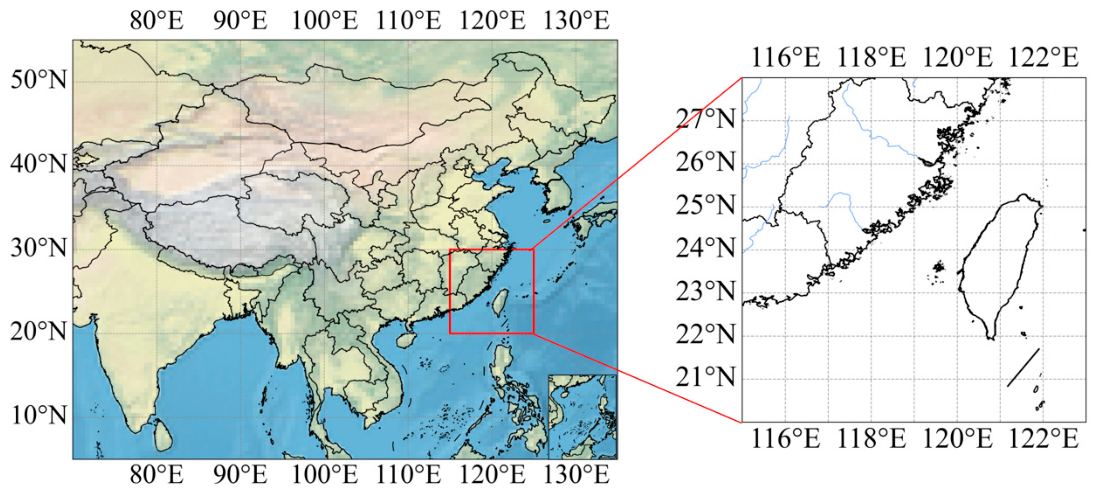
Figure 1 shows the location of the study area, which encompasses Taiwan and its surrounding waters. This area encompasses Taiwan and its surrounding waters and serves as a key corridor for the formation, movement, and landfall of typhoons in the northwestern Pacific, affecting the southeastern coast of China. Its complex land–sea distribution and topography, particularly the Central Mountain Range of Taiwan, strongly affect typhoon structure, intensity, and precipitation distribution. Therefore, this region serves as a representative area for enhanced typhoon rainfall and frequent extreme precipitation events. In addition, the region is economically developed and densely populated, rendering it highly vulnerable to typhoon-induced precipitation hazards. It plays a crucial role in the development of China’s marine economy and in the establishment of coastal disaster prevention and mitigation systems and is also a key area for national flood control, disaster reduction, and meteorological risk management [34,35,36].
Figure 1.
Geographical location of the study area.
2.2. Data
To elucidate the mechanisms underlying differences in precipitation intensity and spatial distribution between typhoons with similar tracks, this study integrates multiple datasets, including the China Meteorological Administration (CMA) tropical cyclone best-track dataset [37,38], ground-based stations, and half-hourly precipitation estimates from GPM IMERG, and ERA5 reanalysis data. A systematic diagnostic comparison is conducted for typhoons Mitag and Chanthu, focusing on precipitation characteristics, three-dimensional dynamical and thermodynamical structures, convective instability, and moisture transport processes. Particular emphasis is placed on the regulatory role of vertical wind shear direction in shaping precipitation distribution, the influence of the vertical structure of moisture transport on precipitation intensity, and the amplification effect of the vertical configuration of convective instability on extreme precipitation. The objective is to identify the key physical drivers and their synergistic interactions responsible for the observed precipitation differences between the two typhoons, thereby providing a scientific basis for improving fine-scale analysis and forecasting of typhoon-induced wind and rainfall [39,40,41,42,43]. All data processing, analysis, and visualization were conducted using Python 3.12.7 in Jupyter Notebook 7.2.2. The main Python packages used included NumPy 1.26.4, pandas 2.2.2, xarray 2023.6.0, Matplotlib 3.9.2, Cartopy 0.25.0, SciPy 1.13.1, and netCDF4 1.7.4.
2.3. Criteria for Assessing Typhoon Impact Duration
To objectively and consistently determine the duration of typhoon influence on the study area, this study establishes criteria based on three key factors: precipitation, wind patterns, and the position of the typhoon center [34]. The thresholds of 50 mm for 24 h accumulated precipitation and 17.2 m/s for maximum gust were adopted to identify substantial tropical-cyclone-related rainfall and wind impacts, respectively [44,45]. The 300 km distance threshold was used as a proximity constraint rather than an independent criterion to ensure that the identified precipitation or wind impacts were reasonably associated with the typhoon circulation rather than unrelated weather systems.
The onset of a typhoon’s influence is defined as follows: the typhoon is considered to have exerted a substantial impact on the study area when the 24 h cumulative precipitation reaches or exceeds 50 mm, or when the maximum gust attains 17.2 m/s (Force 8), provided that the typhoon center is within 300 km of the area. This criterion implements a combined logical framework in which either strong wind or heavy rainfall alone can indicate impact, while the simultaneous occurrence of both is further constrained by proximity to the typhoon center. Such a design accounts for the temporal asynchrony between precipitation and wind effects and ensures that the observed impacts are attributable to the typhoon [6].
The end of a typhoon’s influence is defined as follows: the typhoon is considered to have ceased impacting the study area when precipitation remains below 1 mm for six consecutive hours, the maximum gust is less than 10.8 m/s (Force 6), and the typhoon center is located more than 300 km from the study area.
The interval from the onset to the termination of a typhoon’s influence is defined as the typhoon impact period. This definition accounts for the typhoon’s dynamical, moisture, and spatial characteristics, providing a unified and physically meaningful timescale for subsequent analyses of its impact characteristics and variability.
2.4. Calculation Method for Temperature Anomalies
In this study, the ambient temperature field prior to the typhoon onset was used as the background reference. Taking the start of the typhoon’s impact as the reference time, ERA5 temperature data from 7 days to 1 h prior to the onset of typhoon influence were averaged over time to construct the pre-typhoon environmental temperature field. Temperature anomalies at each time step during the typhoon were then obtained by subtracting this ambient field from the corresponding instantaneous temperature fields.
2.5. Calculation Method for Vertical Wind Shear
Vertical wind shear (VWS) is defined as the difference between the wind vectors at 200 hPa and 850 hPa [46]; its magnitude reflects the degree of environmental forcing exerted on the typhoon structure, whereas its direction indicates the preferred orientation of vortex tilt and rainfall asymmetry. The calculation formula is:
where u and v are the zonal and meridional wind components at 200 hPa and 850 hPa, respectively. The resulting wind shear direction θ is converted to meteorological convention after quadrant adjustment, where 0° indicates a northerly wind and 90° indicates an easterly wind. The vertical wind shear at the typhoon center is computed from the 6-hourly ERA5 wind fields using bilinear interpolation [36,37]. In this study, changes in the shear direction are used to examine changes in the preferred orientation of rainfall asymmetry and the possible adjustment of rainband organization relative to the typhoon center.
VWS = V200 − V850,
2.6. Definition and Diagnostic Method for Convective Instability
Convective instability refers to the tendency of atmospheric layers to release stored potential energy and develop deep convection when certain conditions are met and lifting mechanisms are present. It is commonly quantified using the vertical gradient of pseudo-equivalent potential temperature(θse), where ∂θse/∂p < 0 indicates convective instability, and larger negative values correspond to stronger instability. This study focuses on the vertical extent of the instability layer and its coupling with the dynamic structure, aiming to elucidate its regulatory effect on precipitation intensity.
2.7. Comparison of the Basic Characteristics of Two Typhoons
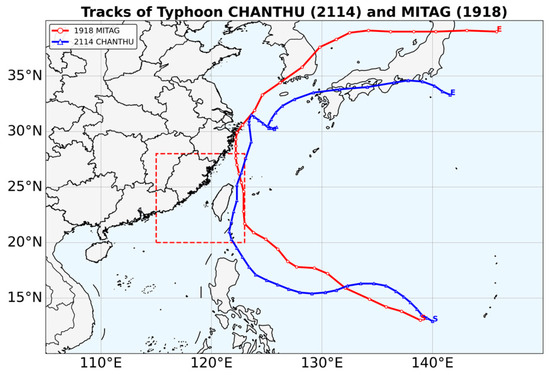
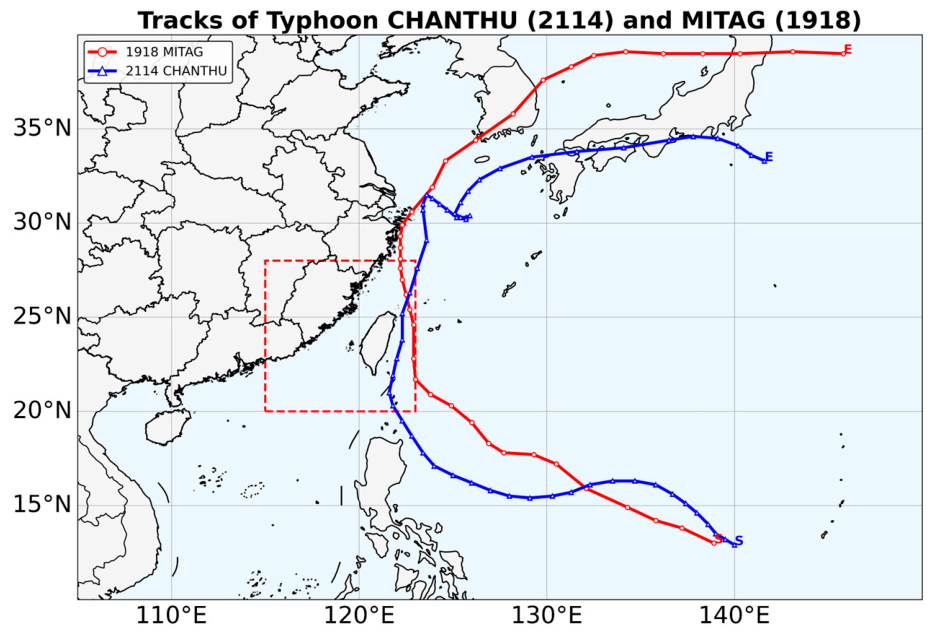
The tracks of the two typhoons are presented in Figure 2. Typhoon Chanthu (2114) formed over the waters east of the Philippines at 08:00 on 7 September and subsequently intensified rapidly into a super typhoon. As it approached the waters northeast of Luzon, it turned northward and weakened slightly. Upon entering the study area on 11 September, Chanthu moved northward along the eastern coast of Taiwan, weakened to a severe typhoon on 12 September, and approached the eastern coast of Zhejiang on 13 September. It remained nearly stationary while circulating in the northern East China Sea for approximately three days before turning northeastward, making landfall in Kyushu, Japan, on 17 September, and being de-designated on 18 September. Typhoon Mitag (1918) formed at 08:00 on 28 September over the waters east of the Philippines. It moved northwestward and gradually intensified, reaching typhoon intensity on 29 September. After entering the study area on 30 September, Mitag turned northward and made landfall near Zhoushan, Zhejiang, around 20:30 on 1 October (maximum wind speed 30 m·s−1, central pressure 980 hPa). The typhoon then turned northeastward, made a second landfall in South Korea on 2 October, and gradually weakened, being de-designated on 3 October [47,48].
Figure 2.
Trajectory maps of typhoons Chanthu (2114) and Mitag (1918) in the Western Pacific. The red box denotes the study area.
3. Differences in Precipitation Patterns
3.1. Regional Distribution of Precipitation Intensity
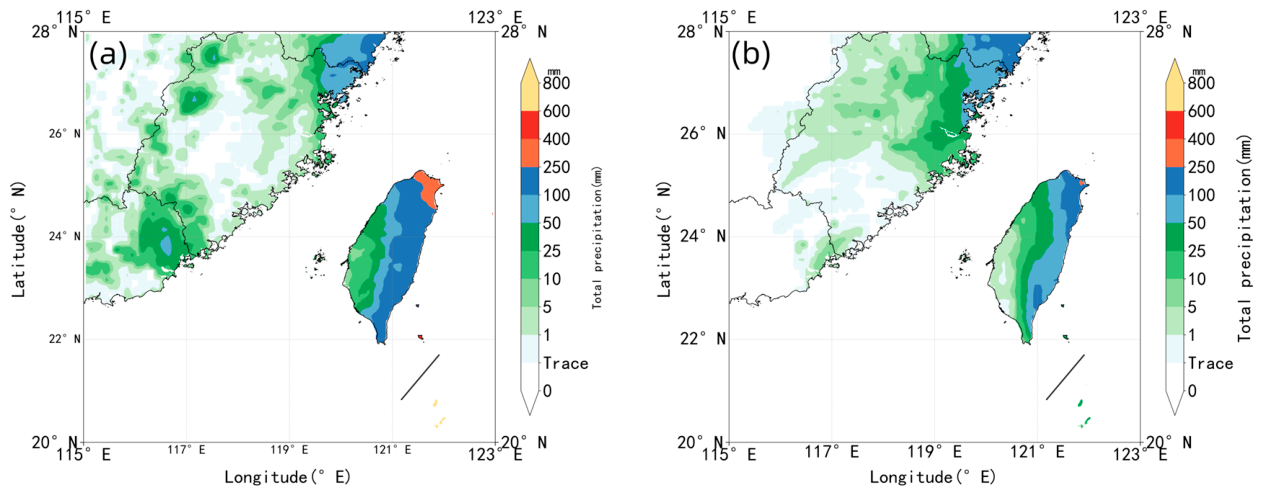
Based on the above criteria, the impact period of Typhoon Chanthu (2114) on the study area was from 06:00 on 10 September 2021 to 00:00 on 13 September 2021, whereas that of Typhoon Mitag (1918) was from 12:00 on 29 September 2019 to 18:00 on 1 October 2019. Cumulative precipitation at each station within the study area was calculated over the respective impact periods, and the areal mean was used to represent the average precipitation intensity of each typhoon event. The results indicate that during their respective impact periods, Chanthu produced 51.9 mm of area-averaged precipitation, nearly twice the 27.2 mm recorded for Mitag, reflecting marked differences in precipitation intensity and regional impact between the two typhoons.
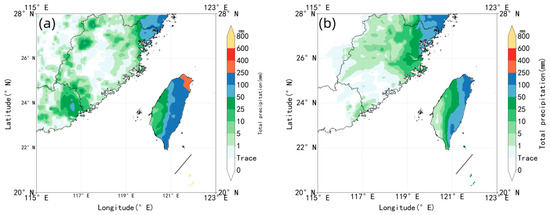
As shown in Figure 3, the cumulative precipitation distributions of typhoons Chanthu and Mitag exhibited broadly similar spatial patterns, mainly because the two typhoons followed similar tracks and both affected Taiwan and the adjacent coastal areas. However, clear differences were observed in precipitation intensity and spatial coverage. Precipitation associated with Typhoon Chanthu affected nearly the entire study area (Figure 3a). Rainfall was particularly intense along the southern coast of Zhejiang and the central and eastern coasts of Taiwan, forming a continuous band of heavy precipitation that gradually weakened inland. Heavy rainfall (≥50 mm) was primarily observed in eastern Guangdong, the border region between Fujian and Zhejiang, and most parts of Taiwan. Areas of torrential rain (≥100 mm) largely coincided with the heavy rainfall regions, concentrating along the southern coast of Zhejiang and the central-eastern coast of Taiwan, with maximum accumulations exceeding 250 mm in northeastern Taiwan. Precipitation was especially concentrated along mountain ridges and the windward slopes of Taiwan. In contrast, precipitation associated with Typhoon Mitag (Figure 3b) was mainly confined to central and northern Fujian, southern Zhejiang, and Taiwan. While the patterns of heavy rainfall were similar to those of Chanthu, they were smaller in spatial extent, and torrential rain occurred only in southern Zhejiang and northeastern Taiwan. Therefore, the main difference between the two cases was not a complete shift in the overall rainfall distribution, but rather the stronger intensity, broader coverage, and greater accumulated precipitation during Chanthu.
Figure 3.
Spatial distribution of cumulative precipitation (mm) in the study area during the impact periods of Typhoon Chanthu (a) and Typhoon Mitag (b). The shaded areas represent precipitation amounts.
3.2. Relative Position of Precipitation Zones and Typhoon Tracks
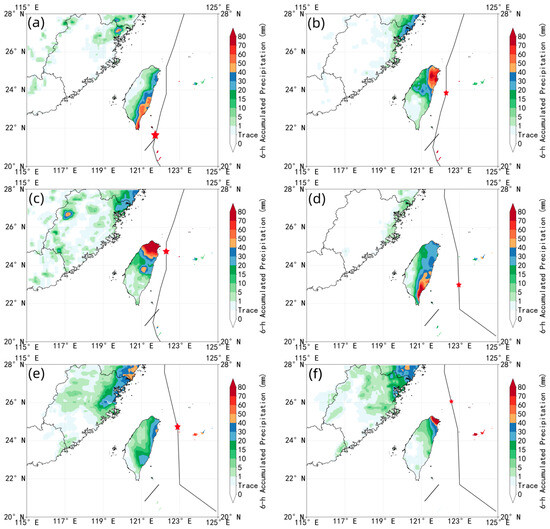
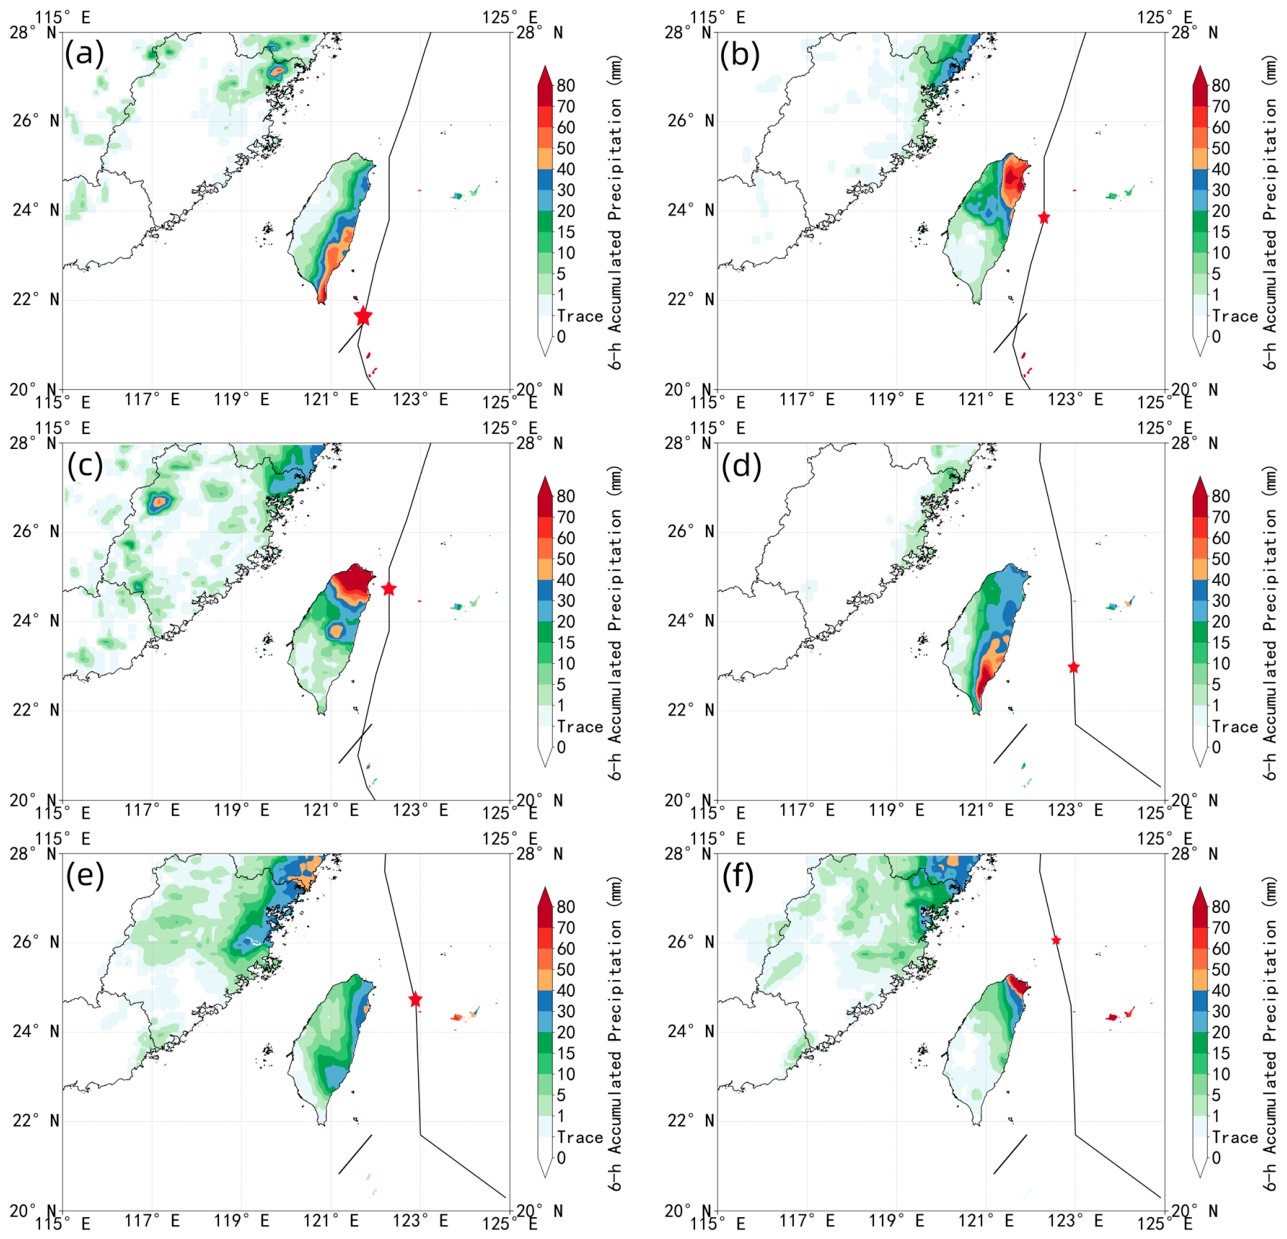
To further investigate the spatiotemporal evolution of precipitation associated with the two typhoons, this study analyzed the 6 h accumulated precipitation during their respective impact periods (Figure 4). For Typhoon Chanthu, short-term heavy precipitation was mainly concentrated on the left side of the typhoon track, particularly to the northwest of the typhoon center. As Chanthu progressed northward, the heavy precipitation area shifted correspondingly along the windward slopes of the Central Mountain Range in Taiwan, with precipitation intensity remaining sustained. In contrast, the short-term heavy precipitation associated with Typhoon Mitag was also located on the left side of the typhoon track but was more concentrated southwest of the typhoon center. As Mitag moved northward, the heavy precipitation area contracted toward the typhoon center, with overland precipitation weakening substantially and exhibiting a scattered and localized pattern.
Figure 4.
Distribution of 6 h accumulated precipitation during the impact periods of typhoons Chanthu and Mitag. For Chanthu: (a) 1200 UTC 11 September, (b) 0600 UTC 12 September, and (c) 1200 UTC 12 September 2021; for Mitag: (d) 0600 UTC, (e) 1200 UTC, and (f) 1800 UTC 30 September 2019, respectively. Shading indicates precipitation amount, with units of mm. The red star denotes the typhoon center at the corresponding time.
4. Identification of Key Factors
As shown in Figure 3 and Figure 4, typhoons Chanthu and Mitag followed broadly similar tracks and produced broadly similar rainfall-affected regions, mainly due to the common influence of Taiwan’s topography. However, their rainfall intensity, persistence, and short-term evolution differed substantially. Chanthu exhibited stronger, more extensive, and more continuous heavy precipitation, whereas Mitag produced weaker, more localized, and less persistent rainfall. Therefore, rather than focusing on a complete displacement of the rainfall area, the following analysis aims to explain why broadly similar rainfall patterns were associated with substantially different rainfall intensities and accumulated amounts.
4.1. Vertical Wind Shear
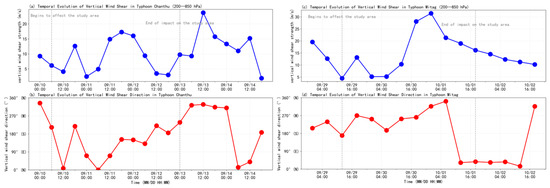
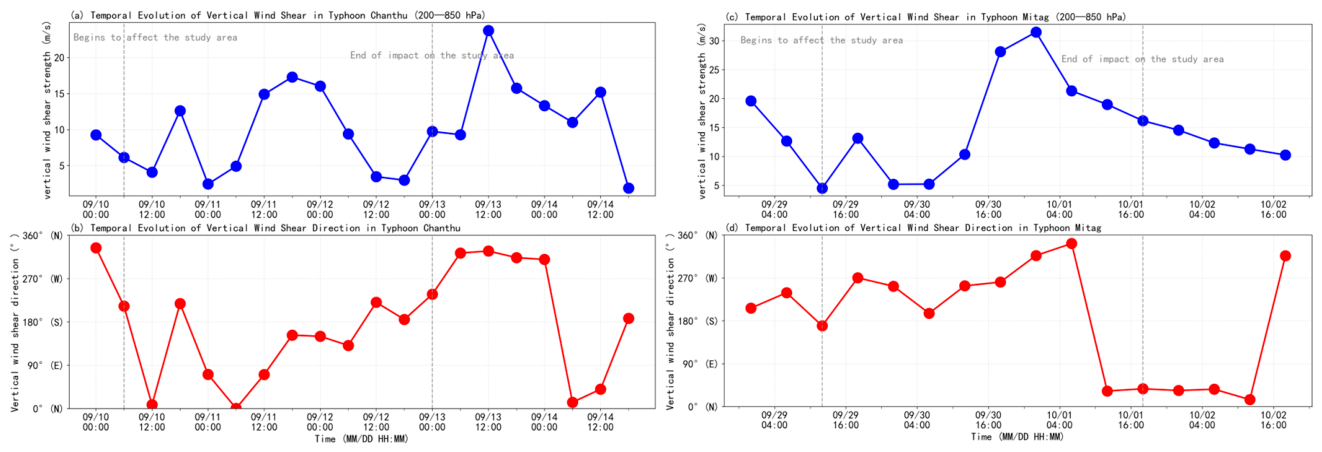
In terms of vertical wind shear intensity (Figure 5a,c), both typhoons exhibited clear phase-dependent variations during their respective impact periods, although their evolutionary characteristics differed markedly. After entering the study area, Typhoon Mitag experienced a rapid increase in vertical wind shear, reaching a peak of approximately 30 m/s or higher between 30 September and 1 October, and then gradually weakened. In contrast, Typhoon Chanthu exhibited relatively weaker shear throughout the period, generally ranging between 10–20 m/s, with only brief intensifications at isolated intervals. Overall, vertical wind shear associated with Mitag was stronger and more variable, whereas Chanthu displayed moderate intensity and relatively stable characteristics. The differences become even more pronounced when considering wind shear direction (Figure 5b,d). During its active phase, Chanthu’s vertical wind shear direction remained relatively stable, primarily within the southwest–west quadrant (approximately 200–300°), indicating a consistent directional difference between the lower and upper levels. This stability favored sustained organization and development of convection on one side of the typhoon track. In contrast, Mitag’s wind shear direction fluctuated dramatically, exhibiting an abrupt shift during the mid-to-late stages of its impact (around 1 October), rapidly changing from a westerly orientation (approximately 300°) to a northerly orientation (close to 0°), followed by further adjustments. Such rapid directional changes disrupted the stable organization of the convective system, making the precipitation area prone to displacement or even dispersion [49,50,51]. From a dynamical perspective, the magnitude of vertical wind shear mainly reflects the degree of vortex deformation, whereas the direction of vertical wind shear controls the preferred orientation of vortex tilt, low-level convergence, upward motion, and rainfall asymmetry. When the shear direction remains relatively stable, rainfall-producing convection and inner-core rainbands tend to be maintained in a quasi-stationary quadrant. This favors persistent heavy precipitation if the rainband orientation is aligned with moisture transport and topographic lifting. In contrast, rapid shifts in shear direction may continuously reorient the vortex tilt and rainband organization, causing the heavy-rainfall area to shift or become dispersed. Therefore, in the present cases, the relatively stable shear direction during Chanthu favored persistent rainfall organization, whereas the abrupt directional changes during Mitag likely reduced the persistence and spatial coherence of heavy precipitation.
Figure 5.
Vertical wind shear characteristics of typhoons Chanthu and Mitag. (a) Shear intensity (m/s) for Chanthu; (b) shear direction (°, where 0° indicates northerly wind and 90° indicates easterly wind) for Chanthu; (c) shear intensity (m/s) for Mitag; (d) shear direction (°) for Mitag. Gray vertical dashed lines indicate the respective impact periods of Chanthu and Mitag.
When considered together with the precipitation distribution, it becomes evident that vertical wind shear plays an important role in determining the location of rainfall. During Typhoon Chanthu, the wind shear direction remained relatively stable for an extended period, enabling the convective system to persist on one side of the typhoon track and form a highly organized, quasi-stationary band of heavy precipitation. In contrast, during Typhoon Mitag, frequent changes in wind shear direction caused convective development to shift continually, resulting in more dispersed precipitation zones without a well-defined area of sustained rainfall. These observations indicate that vertical wind shear not only regulates the convective environment through its magnitude but also critically controls the spatial organization of precipitation through directional changes. When the shear direction is relatively stable and well-aligned, convective systems tend to maintain coherence, allowing heavy precipitation to persist in specific areas; conversely, rapid directional shifts disrupt convective organization, leading to dispersed precipitation. Thus, the stability of wind shear direction emerges as a key factor governing the spatial distribution of rainfall. Thus, the stability of wind shear direction emerges as a key factor governing the spatial organization and persistence of rainfall because it regulates the orientation of vortex tilt, low-level convergence, and rainfall-producing rainbands.
4.2. Water Vapor and Heat Transport
4.2.1. Comparative Analysis of the Vertical Structure of Pseudo-Equivalent Potential Temperature
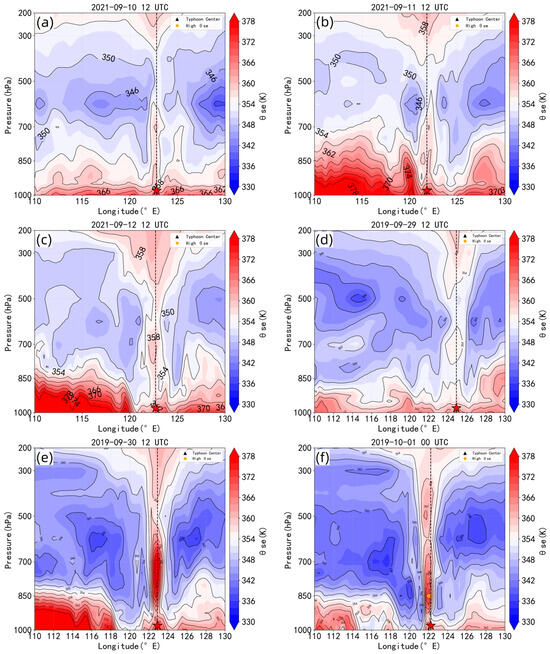
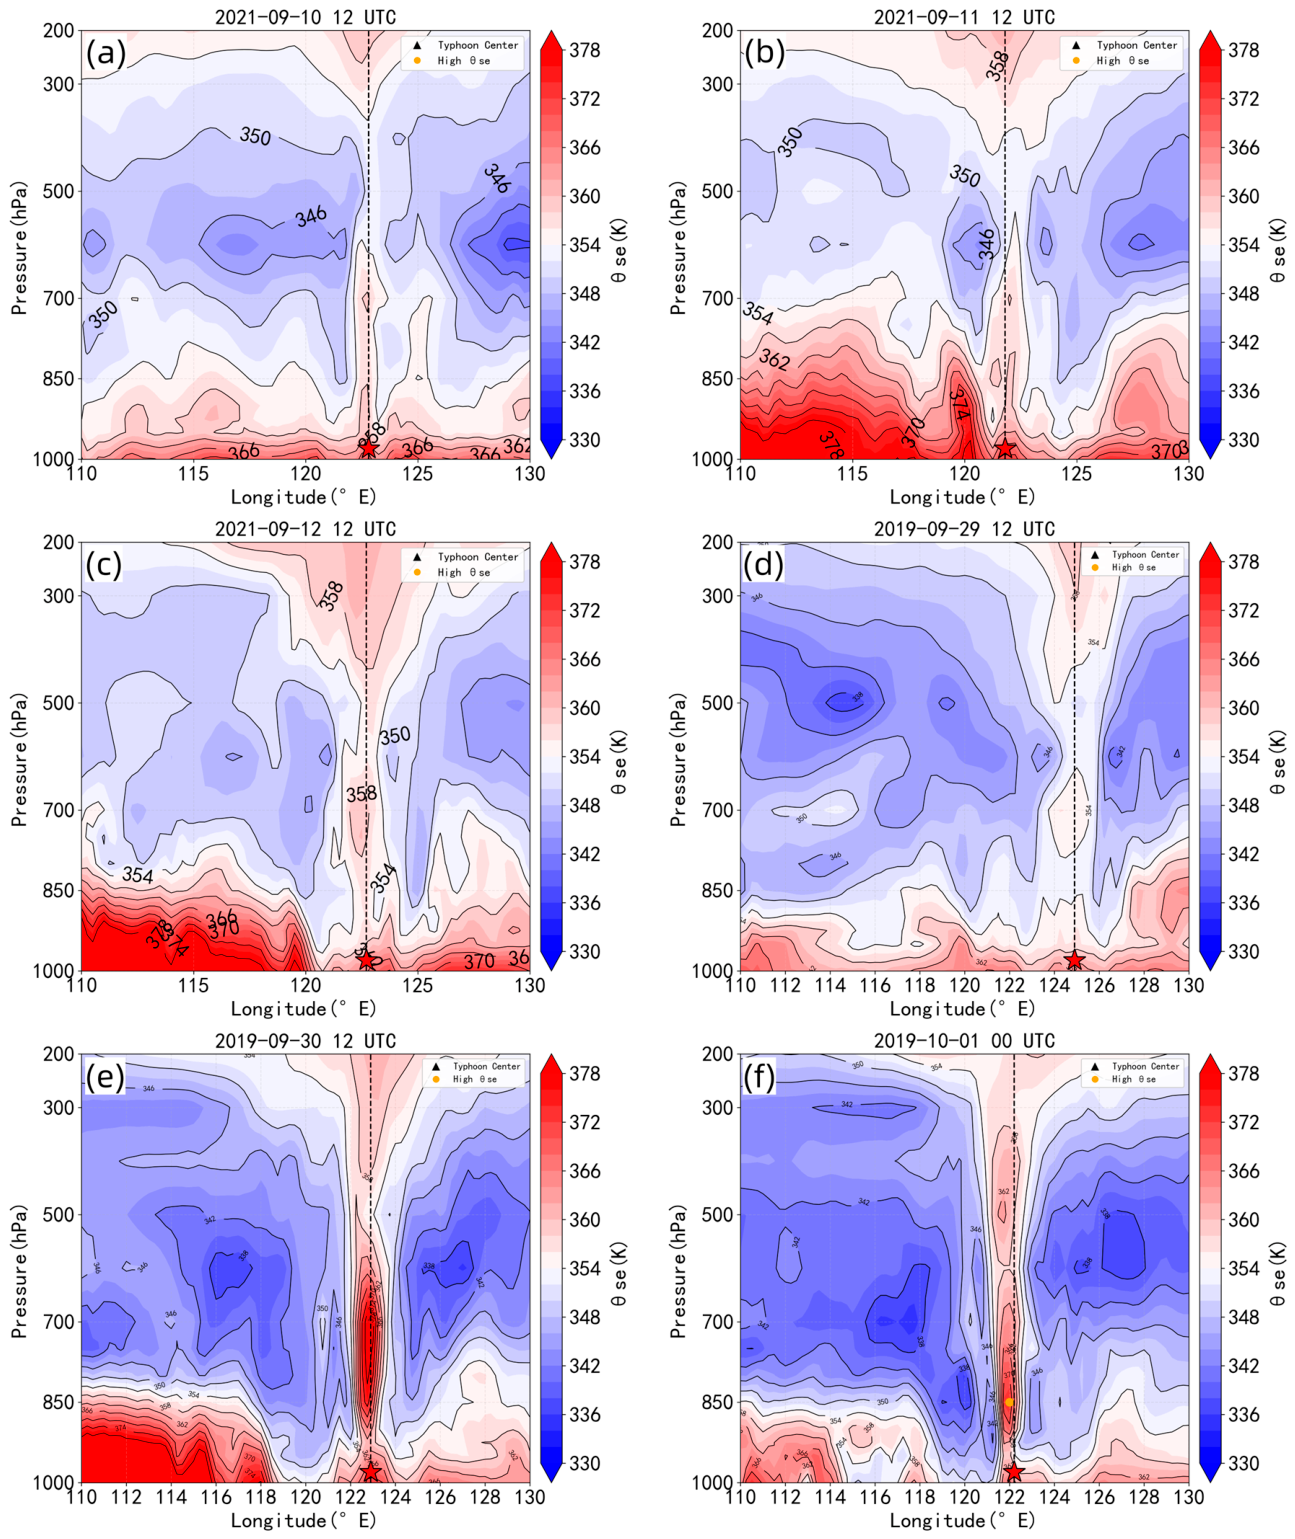
Figure 6 shows longitude–pressure cross-sections of pseudo-equivalent potential temperature (θse) passing through the typhoon centers at different stages of Chanthu and Mitag. For each panel, the cross-section is taken along the latitude of the typhoon center at the corresponding time, and the dashed line marks the longitude of the typhoon center. During the early stage of its impact (Figure 6a), Typhoon Chanthu exhibited a substantial accumulation of warm and moist energy in the lower troposphere. The pseudo-equivalent potential temperature (θse) in the 1000–850 hPa layer increased rapidly, exceeding 360 K, indicating that strong thermodynamic instability had already developed upon entering the study area. During the mature stage (Figure 6b), lower-level θse intensified further, reaching a maximum above 374 K. Near the typhoon-center longitude, the high-θse region extended upward from the lower troposphere to the middle and upper troposphere, forming a vertically continuous high-θse column. This vertically coherent structure indicates sustained upward transport of warm and moist energy near the typhoon center, providing favorable thermodynamic conditions for maintaining deep convection and prolonged heavy rainfall. In the late stage (Figure 6c), θse weakened overall, the warm core structure dissipated, and precipitation ceased. In contrast, Typhoon Mitag exhibited a significantly weaker and later-developing θse structure. In its early stage (Figure 6d), high θse was primarily located at 700–300 hPa, while lower-level θse remained low (<365 K), indicating that thermal instability had not yet fully developed. During the early mature stage (Figure 6e), although lower-level θse increased moderately (≥370 K), it extended upward only to approximately 600 hPa, producing a vertically limited high θse column of short duration. In the later phase (Figure 6f), θse rapidly weakened and contracted toward the lower levels, with the warm core in the middle and upper troposphere dissipating [52,53].
Figure 6.
Longitude–pressure cross-sections of pseudo-equivalent potential temperature (θse, K) through the typhoon centers of Chanthu and Mitag at different stages of their evolution. Panels (a–c) show Chanthu during the early, mature, and late stages, respectively; panels (d–f) show Mitag during the early, mature, and late stages, respectively. For each panel, the cross-section is taken along the latitude of the typhoon center at the corresponding time. The dashed line and the red five-pointed star indicate the longitude and location of the typhoon center, respectively.
A comparative analysis indicates that Typhoon Chanthu was characterized by a strong low-level energy supply, sustained vertical transport, and deep, well-coupled convection, whereas Typhoon Mitag experienced limited low-level energy, restricted upward transport, and a short-lived convective structure. These differences directly contributed to Chanthu producing deeper convection and more persistent precipitation compared with Mitag.
4.2.2. Water Vapor Transport
The development of precipitation relies on a continuous supply of water vapor, and the strength and persistence of that supply directly influence the extent and intensity of rainfall [54,55]. Previous studies have also emphasized the important role of moisture transport from the South China Sea and surrounding tropical oceans in modulating typhoon-related precipitation [56,57,58]. Building on these studies, the present study further examines how differences in the intensity, pathway, and persistence of moisture transport contributed to the contrasting precipitation characteristics of Chanthu and Mitag.
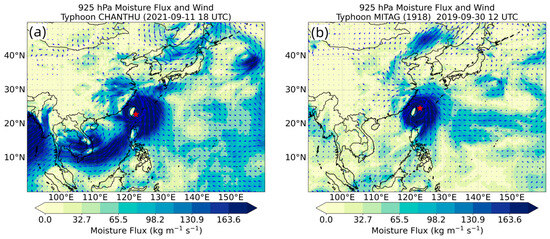
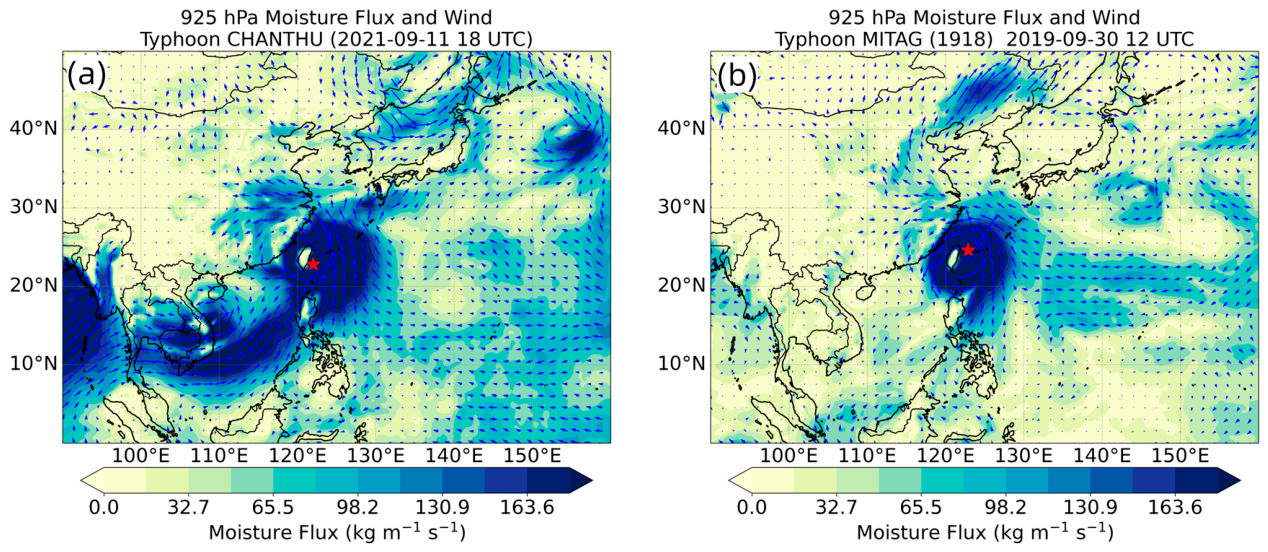
The moisture feeding Typhoon Chanthu primarily originated from the South China Sea and the northwestern Pacific. A stable southerly low-level jet on the eastern and southeastern sides of the typhoon continuously transported large amounts of moisture toward the typhoon center (Figure 7a). The maximum moisture flux reached 644 kg m−1 s−1 at 22.8° N, 123° E. A persistent moisture transport belt on the eastern side of the typhoon became closely coupled with its circulation as it moved northward, forming a sustained moisture convergence zone. This stable and continuous moisture pathway provided favorable conditions for prolonged heavy rainfall. In contrast, although Typhoon Mitag attained a peak moisture flux of 733 kg m−1 s−1 at 24.5° N, 123.5° E during certain periods (Figure 7b), its moisture transport was far less continuous. As Mitag moved northwestward, the transport belt rapidly weakened and contracted, and the spatial extent of the strong moisture flux zone shrank, making it difficult to sustain a stable supply of moisture. While Mitag’s moisture distribution was also asymmetric, with stronger activity on the eastern side, its overall behavior was characterized by “short-lived intensity and limited persistence”. Compared with the sustained moisture input for Chanthu, the instability of Mitag’s moisture supply constrained the intensity and duration of convective development, representing a key factor underlying its relatively weaker precipitation intensity and coverage. Although the two typhoons occurred within a broadly similar late-summer to early-autumn typhoon-season background, intraseasonal variations in the South China Sea–western North Pacific moisture environment may still influence the available moisture supply. Therefore, the differences in precipitation between Chanthu and Mitag are interpreted mainly in terms of moisture transport intensity, pathway, and persistence, while the possible influence of background moisture variability is also acknowledged.
Figure 7.
Water vapor flux at 925 hPa (shaded; kg m−1 s−1) and wind vectors (m/s) during the typhoon impact period: (a) Typhoon Chanthu; (b) Typhoon Mitag. The five-pointed star indicates the location of the typhoon center.
4.3. Kinematic and Thermal Structures
4.3.1. Warm-Core Structure (Temperature Anomalies)
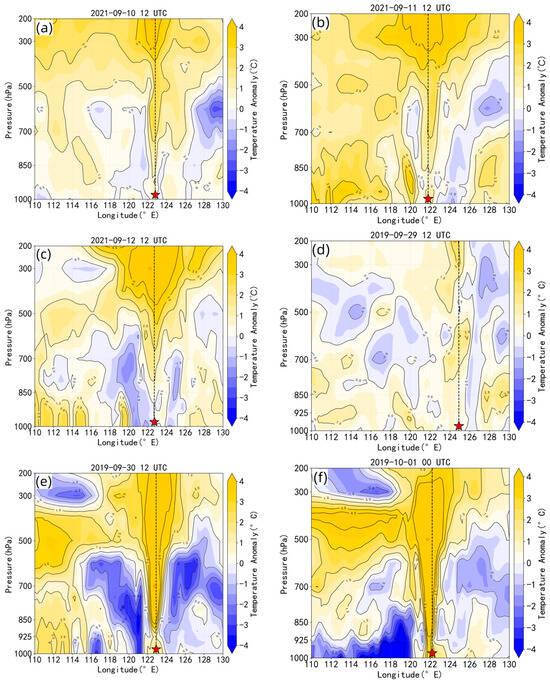
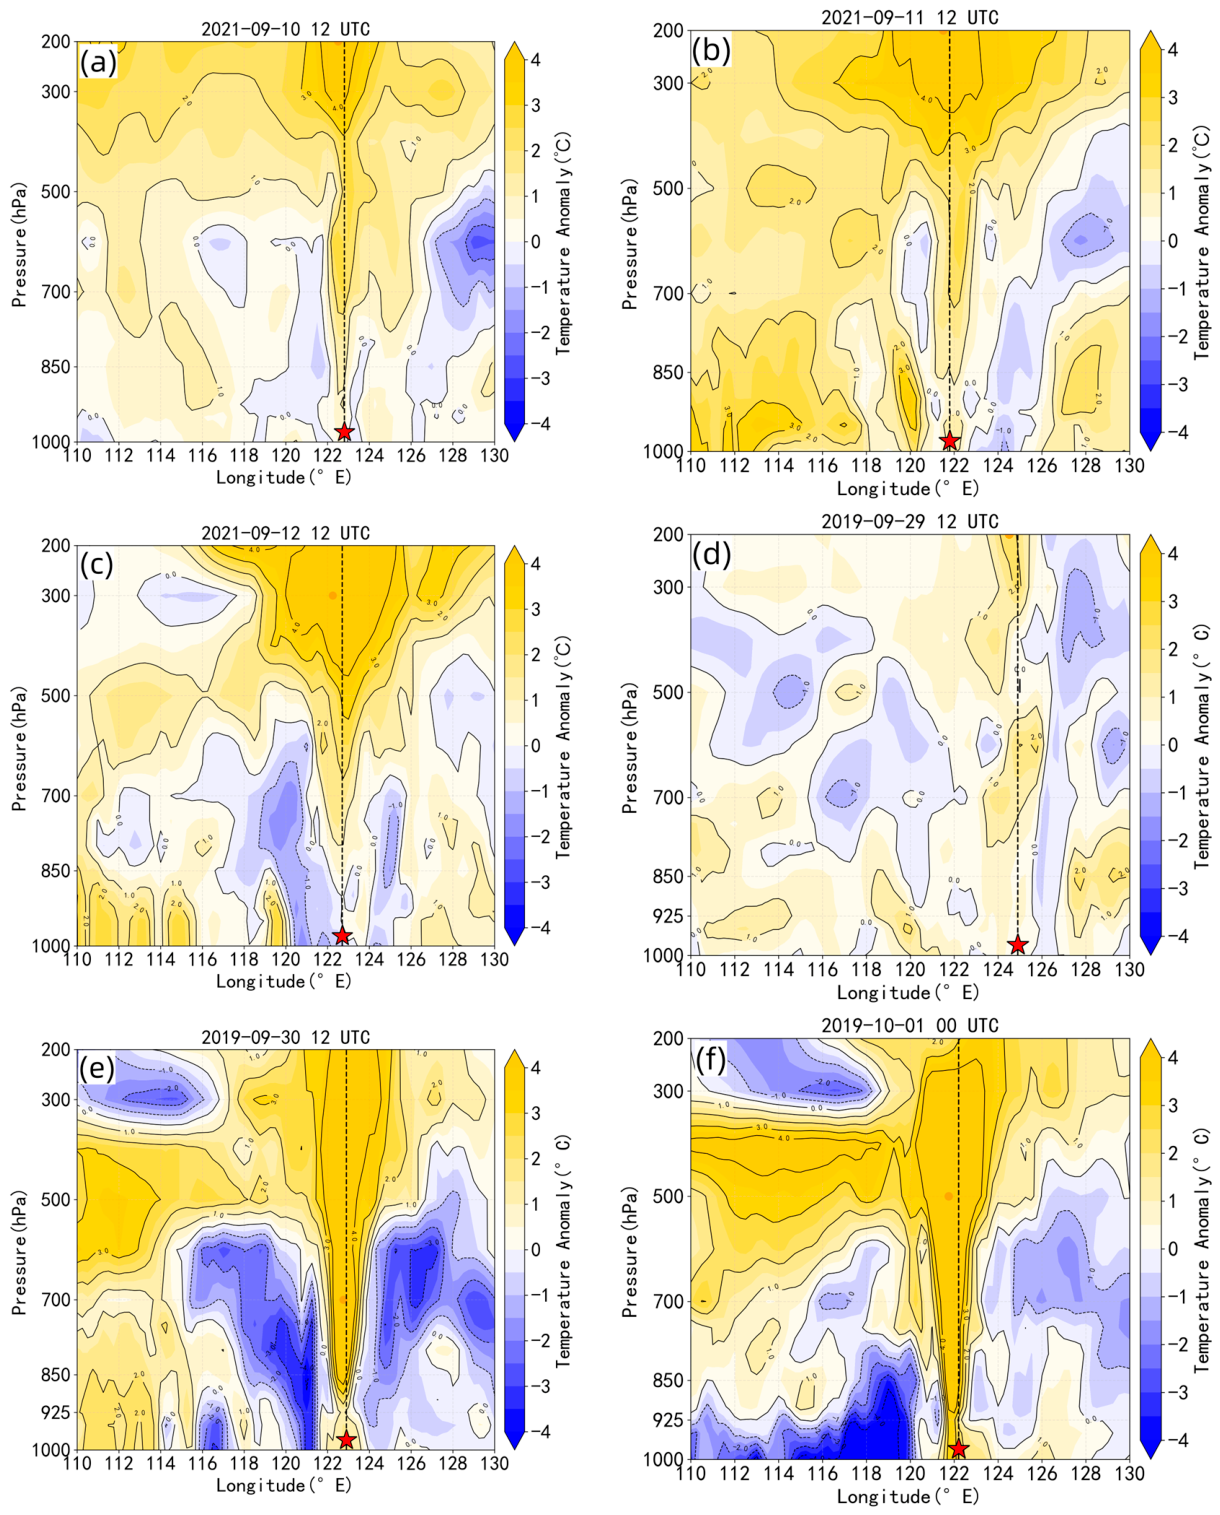
Figure 8 illustrates that Typhoon Chanthu developed a pronounced warm core in the middle and upper troposphere (500–300 hPa) early in its impact, accompanied by a positive temperature anomaly in the lower levels. This indicates strong thermal support in the lower troposphere, facilitating upward motion into the upper layers. During the mature stage, the warm core intensified markedly (>4 °C), forming a vertically continuous columnar structure. The persistent lower-level warm anomaly provided stable conditions for latent heat release, corresponding to widespread and intense precipitation. Although the warm core weakened somewhat during the later stages, it remained vertically continuous, consistent with the sustained precipitation observed. In contrast, Typhoon Mitag exhibited a relatively weak and dispersed warm core in the early stages, with near-neutral temperature anomalies in the lower levels that limited convective development. During its mature stage, the mid-level warm core strengthened moderately (2–4 °C), but insufficient lower-level support constrained the vertical extent of the warm core. In the later stages, the warm core shifted upward to the mid-to-upper troposphere and weakened rapidly, while the lower-level response remained relatively weak [59,60].
Figure 8.
Vertical cross-sections of temperature anomalies (°C) along the meridional transect through the typhoon centers at different stages of evolution. (a–c) Typhoon Chanthu during the early, mature, and late stages; (d–f) Typhoon Mitag during the early, mature, and late stages. The red five-pointed star indicates the locations of the typhoon centers.
Typhoon Chanthu was characterized by strong low-level thermal support and a deep, vertically persistent warm core, whereas Typhoon Mitag exhibited weak low-level support, an upward-shifted warm core, and a structurally unstable profile. These differences directly influenced the depth of convective development and the persistence of precipitation.
4.3.2. Vertical Motion and Vorticity Fields
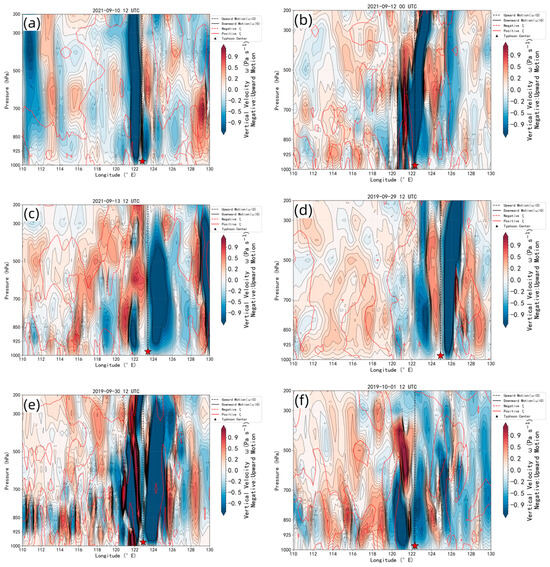
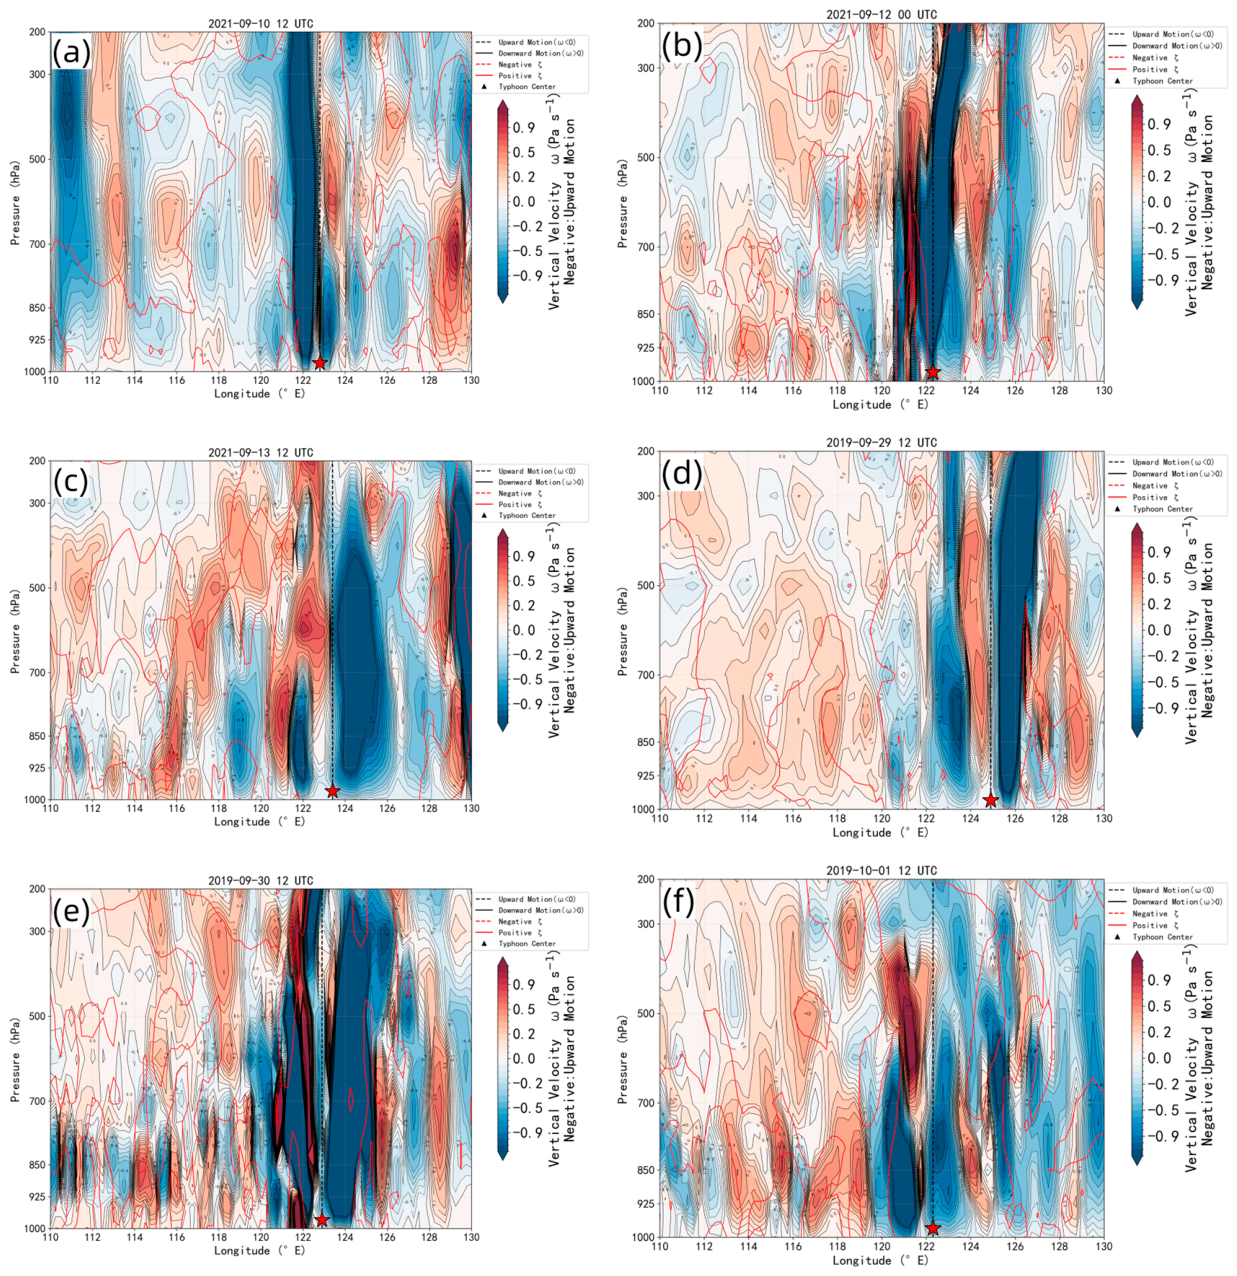
Figure 9 illustrates that, during the early stages of its impact, Typhoon Chanthu developed a deep column of upward motion extending from 1000 to 200 hPa. At its peak, this evolved into a stable updraft zone extending through the full depth of the troposphere on both sides of the typhoon center, which, together with compensating subsidence, formed a complete secondary circulation. Concurrently, relative vorticity exhibited a strong positive column extending upward from the lower levels, spatially aligned with both the updraft zone and the warm-core structure. This demonstrates effective vertical coupling between dynamic and thermal processes, facilitating sustained deep convection and intense precipitation. In contrast, Typhoon Mitag’s updraft was generally weak and discontinuous, disrupted from the outset by mid-level subsidence. At its peak, only short-lived, localized updraft zones formed, with limited spatial extent and duration, and they rapidly weakened and contracted to the lower- to mid-levels in the later stages. Correspondingly, its relative vorticity was weak and fragmented, lacking stable vertical coupling [61].
Figure 9.
Vertical cross-sections along the meridional transect through the typhoon centers showing vertical velocity and relative vorticity at different stages of typhoon evolution. (a–c) Typhoon Chanthu during the early, mature, and late stages; (d–f) Typhoon Mitag during the early, mature, and late stages. Vertical velocity is shown by red contours (m/s), with solid (dashed) lines indicating positive (negative) values, where negative values denote upward motion. Relative vorticity is shown by black contours (10−4 s−1), with solid (dashed) lines indicating positive (negative) values. The red five-pointed star indicates the locations of the typhoon centers.
Typhoon Chanthu exhibited a deep, vertically continuous updraft structure closely coupled with a well-developed vorticity column, whereas Typhoon Mitag was characterized by a shallow, fragmented updraft with weak coupling. This dynamic disparity represents a key factor underlying the differences in precipitation intensity and duration between the two typhoons.
4.3.3. Coupled Dynamic and Thermal Structures
Further comparison indicates that the centers of heavy precipitation for both typhoons were located in regions where warm-core structures, upward motion, and positive vorticity fields overlapped. This result highlights the close relationship between precipitation formation and the synergistic configuration of the typhoon’s core dynamical and thermal structures. For Typhoon Chanthu, these three elements exhibited a high degree of spatial coherence and relative structural stability, forming a sustained “warm core–updraft–vorticity” coupled system. This configuration facilitated the long-term maintenance of deep convection and the development of concentrated precipitation. In contrast, for Typhoon Mitag, the spatial alignment of these elements was weaker, with limited overlap and considerable temporal variability, resulting in poorly organized convection and a highly unstable precipitation pattern. These findings suggest that the coupling strength and stability of dynamic and thermal structures largely govern the intensity and spatial distribution of typhoon precipitation, representing a key intrinsic mechanism underlying the observed differences between the two typhoons.
4.4. Convective Instability
4.4.1. Comparative Analysis of Convective Instability
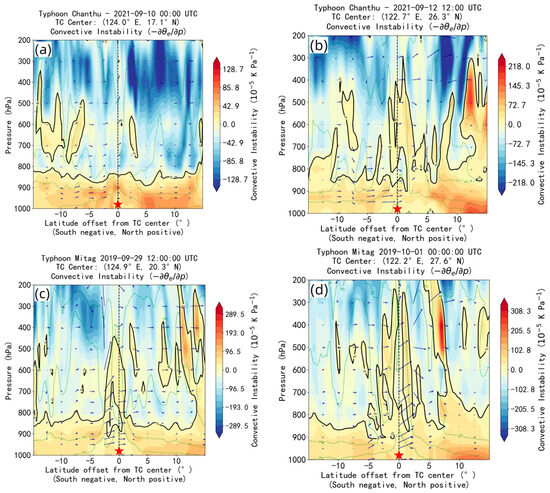
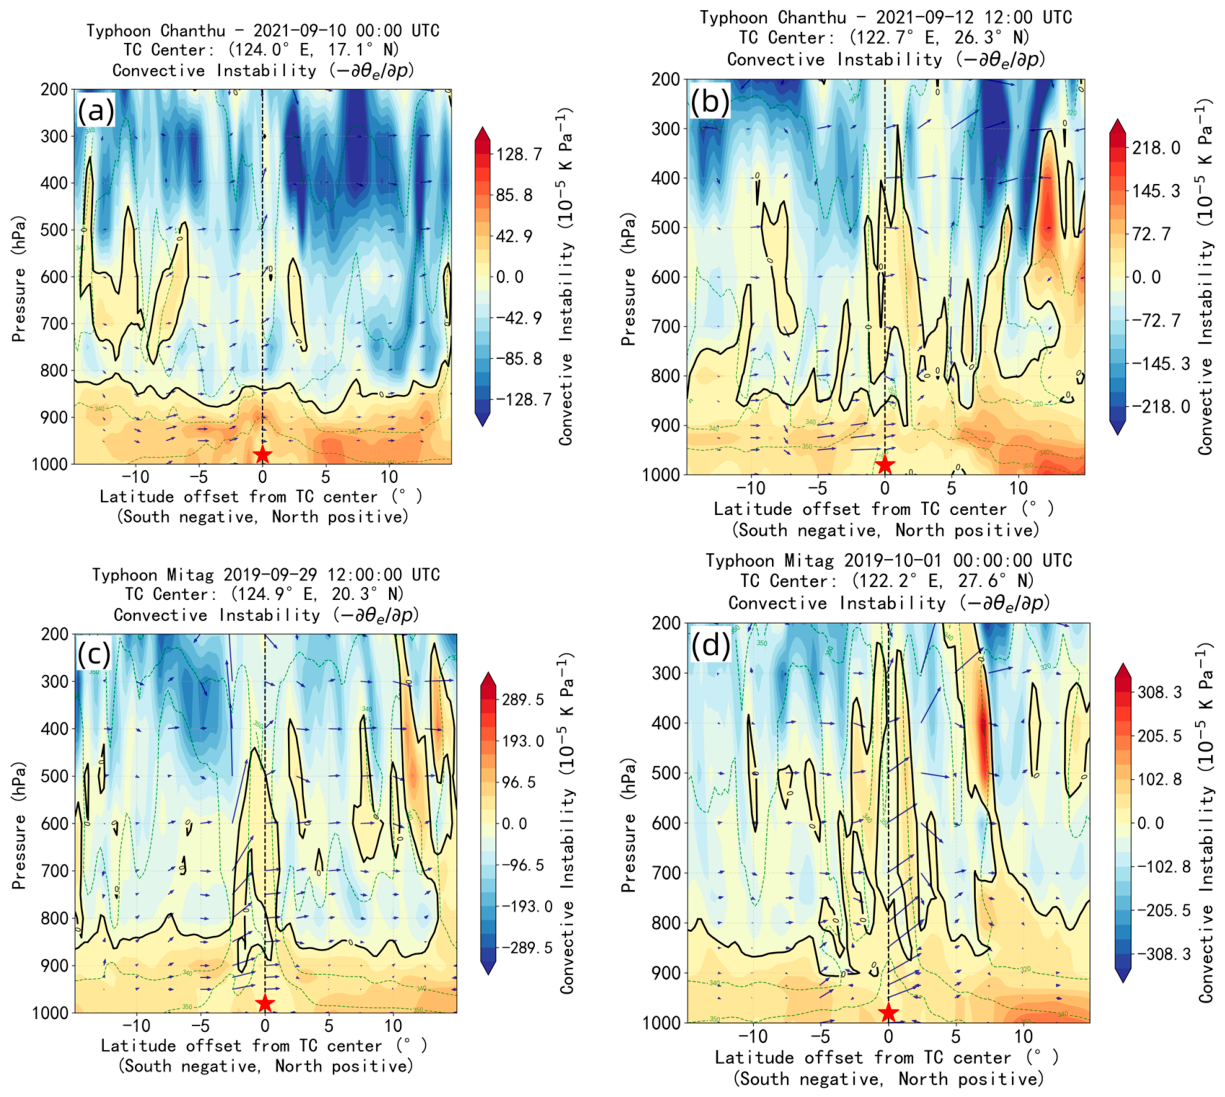
Figure 10 illustrates the temporal evolution of convective instability in the meridional cross-sections passing through the centers of typhoons Chanthu and Mitag during their impact periods. Comparison between the two typhoons reveals marked differences in the structure and vertical extent of convective instability:
Figure 10.
Vertical cross-sections of convective instability (shaded; 10−5 K Pa−1) and the composite meridional–vertical wind field (vectors) along the meridional sections through the typhoon centers. (a,b) Typhoon Chanthu during the early and late stages; (c,d) Typhoon Mitag during the early and late stages. The red five-pointed stars denote the typhoon centers.
During the period of Typhoon Chanthu, the lower and middle tropospheres over the study area exhibited pronounced convective instability. Warm, moist energy was strongly enhanced in the lower layers and extended upward, forming a deep high-θse layer that reached above 400 hPa and provided favorable thermodynamic conditions for convective development. Vertical velocity profiles indicate that upward motion developed rapidly from near the surface and peaked between 700 and 400 hPa, suggesting strong vertical coupling of convection. Simultaneously, relative vorticity maintained robust positive values from the lower to middle troposphere and increased with height, reflecting the coherence of the typhoon’s circulation and sustained dynamic lifting, which facilitated the maintenance and intensification of deep convection. This vertical configuration—characterized by enhanced warm-moist energy, sustained upward motion, and strengthened positive vorticity—supported the continuous formation and persistence of strong convective cells, representing the key dynamic and thermal foundation for the frequent heavy rainfall observed during Typhoon Chanthu [62,63,64].
In contrast, the convective instability associated with Typhoon Mitag was considerably weaker. Although the lower-level pseudo-equivalent potential temperature exhibited a modest positive anomaly, its vertical extent was limited, largely confined to the lower troposphere. The insufficient supply of warm and moist energy in the middle and upper levels created thermal conditions unfavorable for deep convective development. Vertical velocity profiles indicate that upward motion was generally weak and largely restricted to the 850–700 hPa layer, with minimal response in the upper troposphere, reflecting the shallow depth of convection. Simultaneously, although regions of positive relative vorticity existed in the lower and middle levels, their intensity was weak and vertical continuity was poor, preventing the formation of a stable, sustained dynamic support structure. As a result, convective activity was dominated by shallow and short-lived processes.
4.4.2. Linkage Between Convective Instability and Precipitation Intensity
Integrating the precipitation analysis from Section 3.1, it is evident that the period of heavy precipitation associated with Typhoon Chanthu coincided precisely with the presence of deep convective instability (θse values extending above 400 hPa), strong upward motion between 700 and 400 hPa, and robust vertical coupling of positive vorticity. In contrast, the weaker precipitation observed during Typhoon Mitag corresponded to shallow convective instability (θse values extending only to 700 hPa), weak upward motion confined to the 850–700 hPa layer, and poor vertical continuity of vorticity.
From a physical perspective, the vertical coupling of convection affects accumulated rainfall through its control on the intensity, organization, and duration of precipitation. When low-level warm and moist air, mid-tropospheric upward motion, and a vertically coherent positive-vorticity structure are well coupled, convective cells can be continuously regenerated and maintained. This process not only enhances short-term convective rainfall intensity but also favors the development of broader and more persistent stratiform precipitation surrounding the convective cores. Therefore, a deeper and more coherent vertical coupling structure can increase total accumulated precipitation by strengthening rainfall intensity, expanding rainfall coverage, and prolonging rainfall duration.
Therefore, differences in typhoon precipitation intensity depend not only on the presence of warm and moist conditions in the lower atmosphere, but also, more critically, on the vertical depth over which convective instability is released and its coupling with the dynamical structure. During Typhoon Chanthu, the instability layer was deep, and upward motion was well coupled with the positive-vorticity structure. This configuration enabled the sustained release of instability energy, continuous regeneration of convective cells, and maintenance of broader precipitation areas, thereby markedly enhancing both rainfall intensity and accumulated precipitation. In contrast, during Typhoon Mitag, the unstable layer was shallow, and the dynamic response was weak, preventing full utilization of the available instability energy. As a result, convection was less organized and less persistent, and the associated precipitation was weaker and more localized. This suggests that convective instability primarily functions as an “amplifier” of precipitation by modulating the intensity, organization, and duration of rainfall.
4.5. Analysis of the Synoptic Circulation Background
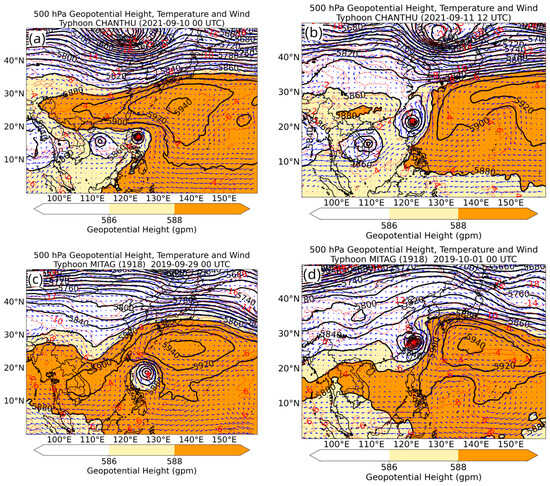
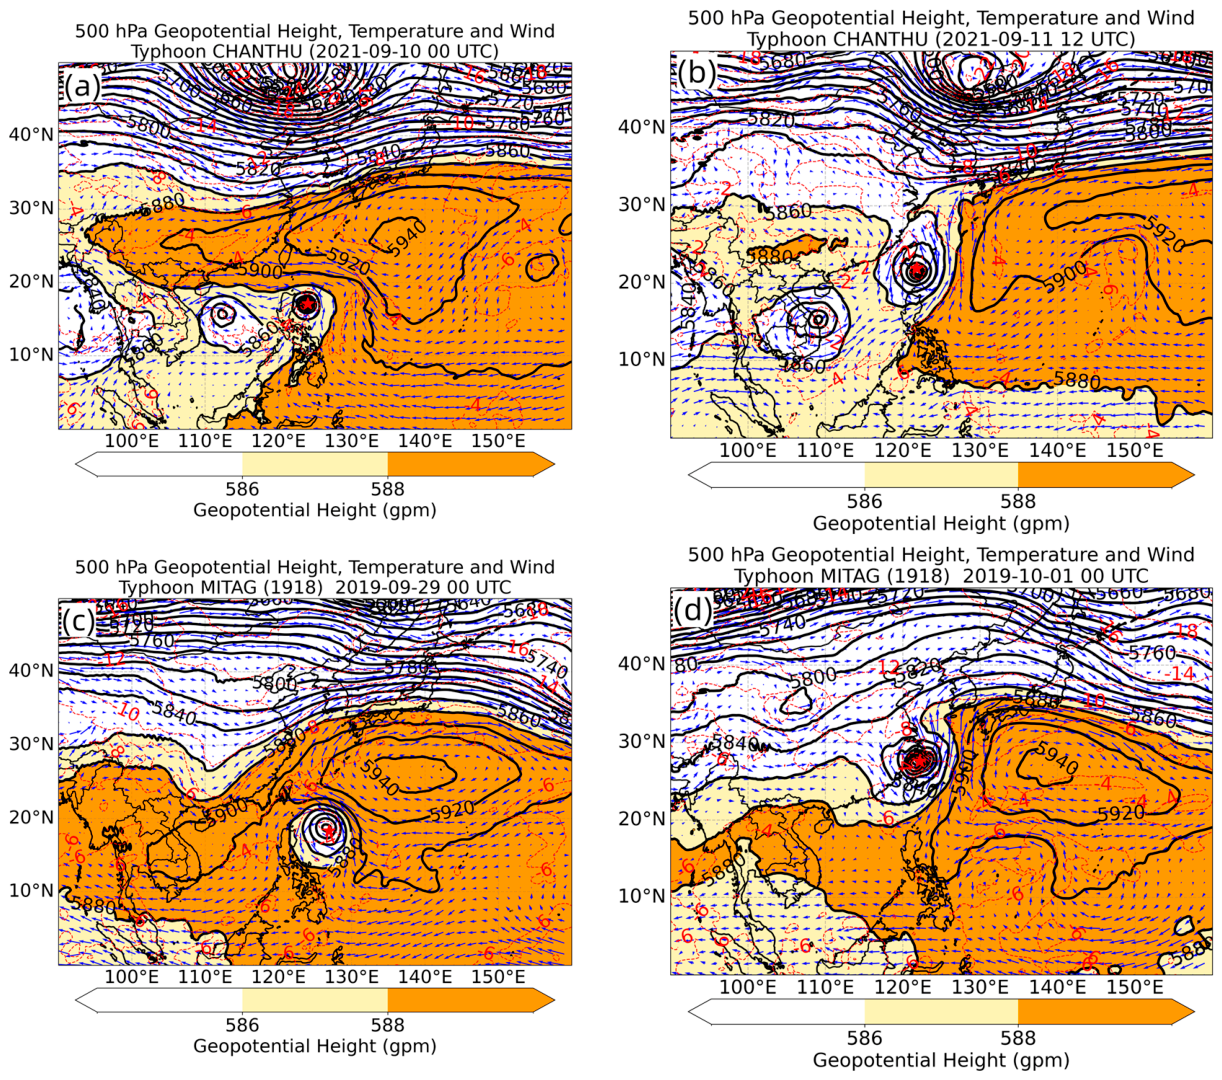
As shown in Figure 11. Typhoon Mitag (1918) and Typhoon Chanthu (2114), which are the focus of this study, followed similar tracks but exhibited distinct differences in precipitation distribution. In terms of large-scale circulation, during the period of Typhoon Chanthu, the upper-level trough was generally positioned farther north, with its base extending southward to just north of 32° N. The subtropical high exhibited a zonal, band-like configuration, with its ridge located near 25° N. As the typhoon moved northward, the subtropical high gradually split into two branches: the western branch near the Qinghai–Tibet Plateau, while the center of the eastern branch remained stable over the northwestern Pacific. In contrast, during the period of Typhoon Mitag, the upper-level trough was situated around 110° E, with its base extending southward to 22° N, and the center of the subtropical high was located near 26° N, 114° E. As Typhoon Mitag moved northward, the trough gradually shifted eastward, and the subtropical high weakened and retreated eastward, with its center remaining over the northwestern Pacific. The typhoon’s circulation eventually merged with the upper-level trough, leading to a gradual weakening of its impact. Overall, during Typhoon Chanthu, the configuration of the upper-level trough and subtropical high was relatively stable, and the typhoon’s northward movement was primarily guided by the southwestern flank of the subtropical high, resulting in a relatively regular circulation and a more uniform spatial precipitation distribution. In contrast, during Typhoon Mitag, the trough extended southward into lower latitudes, intensifying its influence and causing the typhoon’s circulation to interact prematurely with cold air and upper-level shear within the trough, thereby enhancing the spatial non-uniformity of precipitation. These differences indicate that large-scale circulation patterns provide an external environmental constraint for typhoon precipitation and constitute a critical background field modulating wind shear, moisture transport, and the dynamic–thermal structure [65,66].
Figure 11.
The geopotential height (contours, gpm), temperature (vectors, °C), and wind field (shaded, m/s; shading highlights divergence zones) at 500 hPa. (a,b) Typhoon Chanthu at 00:00 UTC on 10 September 2021 and 12:00 UTC on 11 September 2021, respectively; (c,d) Typhoon Mitag at 00:00 UTC on 29 September 2019 and 00:00 UTC on 1 October 2019, respectively. The red five-pointed star indicates the typhoon center.
During summer, the South Asian High in the 200–100 hPa layer is a major planetary-scale circulation system influencing typhoon development. Upper-level divergence plays a crucial role by enhancing lower-level convergence and promoting upward motion, thereby facilitating typhoon intensification [67,68].
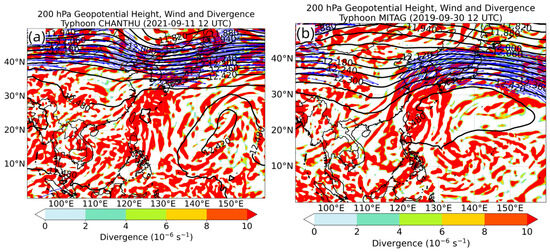
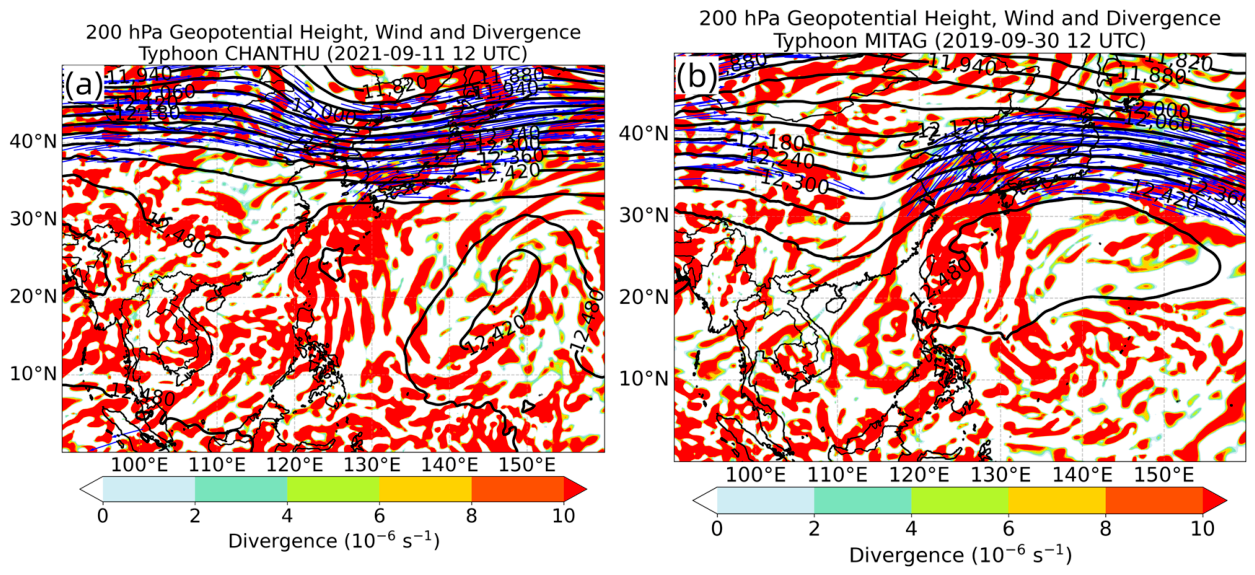
During the early stages of Typhoon Chanthu, the South Asian High was strong, with its ridge extending over the typhoon. The upper-level jet stream was located to the north of the typhoon (30–35° N), placing the typhoon to the right of the jet entrance region, which facilitated upper-level outflow. In the middle stage (Figure 12a), a zone of positive divergence stably covered the typhoon and expanded toward the northeast quadrant. The interaction between the jet stream’s secondary circulation and the typhoon’s circulation produced extensive and intense upper-level divergence, which helped sustain heavy precipitation. In the late stage, as the upper-level trough shifted southward, divergence weakened, and precipitation gradually ceased. In contrast, Typhoon Mitag was affected by the southward extension of the East Asian Trough, which disrupted the South Asian High. Although some upper-level divergence developed in the early stage, its spatial extent was limited. During the mid-phase (Figure 12b), the typhoon was located near the jet stream’s exit region, with the upper-level divergence center roughly coinciding with the typhoon; however, both its coverage and persistence were weaker than those of Chanthu. In the later stage, as the upper-level trough intensified and moved southward, divergence rapidly contracted, creating unfavorable conditions for sustaining precipitation.
Figure 12.
The geopotential height (contours, gpm), wind field (vectors, m/s), and divergence field (shaded, 10−4 s−1; shading highlights regions of divergence) at 200 hPa. (a) Typhoon Chanthu at 12:00 UTC on 11 September 2021; (b) Typhoon Mitag at 12:00 UTC on 30 September 2019. The five-pointed star denotes the typhoon center.
Overall, the upper-level divergence associated with Typhoon Chanthu was characterized by broad coverage and strong persistence, whereas that of Typhoon Mitag was strong but localized and unstable. This contrast closely corresponds to the observed differences in precipitation intensity and duration between the two typhoons. Consequently, large-scale circulation, by modulating the structure and stability of upper-level divergence, exerts a background influence on moisture transport and convective development, serving as a fundamental controlling factor in the formation of differences in typhoon precipitation.
5. Conclusions and Summary
To elucidate the mechanisms underlying differences in precipitation between typhoons with similar tracks, this study integrates the China Meteorological Administration’s tropical cyclone best-track dataset, ERA5 reanalysis data, ground-based observations, and GPM IMERGE half-hourly precipitation data. Typhoons Chanthu (2114) and Mitag (1918), which followed similar tracks but exhibited significant differences in precipitation, were selected for a comparative analysis over the study area (20–28° N, 115–123° E). This analysis examines precipitation distribution, circulation patterns, dynamic and thermodynamic structures, moisture transport, and convective instability, leading to the following preliminary conclusions:
- The two typhoons followed broadly similar tracks, yet their precipitation patterns differed markedly. Typhoon Chanthu produced an average precipitation of 51.9 mm, nearly twice that of Typhoon Mitag (27.2 mm). Its rainfall impacted a wide area over an extended period, with heavy precipitation forming a band along the windward slopes of Taiwan’s central mountains and the coastal regions of Fujian and Zhejiang. In contrast, Typhoon Mitag exhibited weaker rainfall, concentrated over a smaller area, and displayed pronounced localized characteristics.
- Large-scale circulation patterns and upper-level dynamic conditions are key external factors controlling variations in typhoon precipitation. During Typhoon Chanthu, the upper-level trough was positioned farther north, and the subtropical high remained stable, guiding the typhoon northward along a well-defined circulation path. Simultaneously, the favorable alignment of the South Asian High and the upper-level jet stream produced strong, persistent upper-level divergence, supporting prolonged heavy rainfall. In contrast, during Typhoon Mitag, the upper-level trough extended southward, the subtropical high weakened and retreated eastward, and the typhoon merged with the westerly trough relatively early. The combined influence of cold air and strong vertical wind shear rendered the upper-level divergence pattern unstable, causing the circulation structure to deteriorate rapidly and limiting both the intensity and spatial extent of precipitation.
- The interplay between moisture transport and the typhoon’s core dynamical and thermal structures is a critical factor in determining the intensity and persistence of precipitation. During Typhoon Chanthu, continuous moisture transport from both the South China Sea and the northwestern Pacific provided an abundant supply of low-level moisture. The typhoon’s core exhibited a deep warm-core structure, an extensive high θse region, and a well-coupled interaction between upward motion and the positive vorticity field, creating favorable conditions for the sustained development of intense convection. In contrast, Typhoon Mitag featured a single, relatively weak moisture transport channel, a shallow warm core and energy structure, a fragmented dynamical field, and insufficient dynamical–thermal coupling, which collectively limited both the intensity and spatial extent of precipitation.
From a meteorological perspective, variations in precipitation among typhoons following similar tracks are primarily governed by a combination of factors, including large-scale circulation patterns, vertical wind shear, moisture transport, and the internal dynamical and thermodynamic structure of the typhoon. Given the complexity of the mechanisms controlling typhoon precipitation, future studies should incorporate additional case analyses and high-resolution numerical simulations to further elucidate the specific roles of these factors in modulating precipitation under diverse environmental conditions.
Author Contributions
Conceptualization Y.H. (Yong Han); methodology, Y.H. (Yaoying Hong) and Y.H. (Yong Han); writing—original draft preparation, Y.H. (Yaoying Hong); editing and analysis, Y.H. (Yong Han), G.C., X.L., Q.L., X.X. and S.Z. All authors have read and agreed to the published version of the manuscript.
Funding
This work was supported by the National Natural Science Foundation of China (No. 42027804).
Institutional Review Board Statement
Not applicable.
Informed Consent Statement
Not applicable.
Data Availability Statement
The tropical cyclone best-track dataset was obtained from the China Meteorological Administration (CMA) (https://www.typhoon.org.cn, accessed on 9 July 2025). The GPM IMERG half-hourly precipitation product was obtained from NASA GES DISC (https://gpm1.gesdisc.eosdis.nasa.gov/data/GPM_L3/GPM_3IMERGHH.07/, accessed on 11 November 2025). The ERA5 reanalysis data were obtained from the Copernicus Climate Data Store (https://cds.climate.copernicus.eu/datasets/reanalysis-era5-single-levels, accessed on 19 February 2026), and for the site data used in this study, interested parties may contact the authors for application.
Acknowledgments
The authors acknowledge the use of ERA5 reanalysis data provided by the European Centre for Medium-Range Weather Forecasts (ECMWF), ground-based observational data and tropical cyclone best track data provided by the China Meteorological Administration (CMA), and GPM IMERG precipitation data from the National Aeronautics and Space Administration (NASA).
Conflicts of Interest
The authors declare no conflicts of interest.
References
- Fumin, R.; Gleason, B.; Easterling, D. Typhoon Impacts on China’s Precipitation during 1957–1996. Adv. Atmos. Sci. 2002, 19, 943–952. [Google Scholar] [CrossRef]
- Basconcillo, J.; Bangquiao, N. Recent Increase in the Number of Super Typhoons in the Philippines. Trop. Cyclone Res. Rev. 2025, 14, 340–350. [Google Scholar] [CrossRef]
- Huang, M.; Wang, Q.; Liu, M.; Lin, N.; Wang, Y.; Jing, R.; Sun, J.; Murakami, H.; Lou, W. Increasing Typhoon Impact and Economic Losses Due to Anthropogenic Warming in Southeast China. Sci. Rep. 2022, 12, 14048. [Google Scholar] [CrossRef]
- Feng, J.; Li, D.; Li, Y.; Zhao, L. Analysis of Compound Floods from Storm Surge and Extreme Precipitation in China. J. Hydrol. 2023, 627, 130402. [Google Scholar] [CrossRef]
- Liu, L.; Yang, B.; Jiang, X.; Luo, Y.; Ren, F. Changes in Tropical Cyclone–Induced Extreme Hourly Precipitation over China during 1975–2018. J. Clim. 2022, 35, 7339–7352. [Google Scholar] [CrossRef]
- Feng, X.; Yang, G.-Y.; Hodges, K.I.; Methven, J. Equatorial Waves as Useful Precursors to Tropical Cyclone Occurrence and Intensification. Nat. Commun. 2023, 14, 511. [Google Scholar] [CrossRef]
- Li, J.; Wang, J.; Dong, L.; Pathak, R.; Yim, S.H.L.; Lu, C.; Chen, J.; Wu, S.; Lin, P.; Yang, K. Rising Heavy Precipitation amid Decreasing Typhoon Contribution in Southeast Asia. Environ. Res. Lett. 2026, 21, 014021. [Google Scholar] [CrossRef]
- Li, Y.; Gao, J.; Yin, J.; Wu, S. Assessing the Potential of Compound Extreme Storm Surge and Precipitation along China’s Coastline. Weather Clim. Extrem. 2024, 45, 100702. [Google Scholar] [CrossRef]
- He, Y.; Gao, Z.; Ma, Y.; Zhou, P.; Yao, J.; Yang, X.; Li, L. Impacts of Diverse Urbanization Scenarios on Typhoon Precipitation Patterns in the Pearl River Delta: A Case Study of Typhoon Mangkhut. Atmos. Res. 2026, 335, 108831. [Google Scholar] [CrossRef]
- Bi, X.; Liu, J.; Duan, Y. Review of Artificial Intelligence Application in Typhoon Forecasting. Trop. Cyclone Res. Rev. 2025, 14, 230–236. [Google Scholar] [CrossRef]
- Rahman, S.; Sharmin, N.; Rahat, A.; Rahman, M.; Rahman, M. Tropical Cyclone Warning and Forecasting System in Bangladesh: Challenges, Prospects, and Future Direction to Adopt Artificial Intelligence. Comput. Urban Sci. 2024, 4, 4. [Google Scholar] [CrossRef]
- Wang, C.; Yoon, S.-K.; Chen, J.; Chen, H.; Xiong, L.; Kim, J.-S. Statistical Prediction of Typhoon-Induced Total Accumulated Rainfall in the Western North Pacific Using Typhoon Track Similarity Indices. Atmos. Res. 2023, 288, 106724. [Google Scholar] [CrossRef]
- Lodh, A.; Routray, A.; Dutta, D.; George, J.P.; Mitra, A.K. Improving the Prediction of Monsoon Depressions by Assimilating ASCAT Soil Moisture in NCUM-R Modeling System. Atmos. Res. 2022, 272, 106130. [Google Scholar] [CrossRef]
- Routray, A.; Lodh, A.; Dutta, D.; George, J.P.; Mitra, A.K. Influence of ASCAT Soil Moisture on Prediction of Track and Intensity of Landfall Tropical Cyclones. Int. J. Remote Sens. 2023, 44, 341–380. [Google Scholar] [CrossRef]
- Routray, A.; Lodh, A.; Dutta, D.; George, J.P. Study of an Extremely Severe Cyclonic Storm “Fani” over Bay of Bengal Using Regional NCUM Modeling System: A Case Study. J. Hydrol. 2020, 590, 125357. [Google Scholar] [CrossRef]
- Yuk, G.-M.; Zhu, J.; Yoon, S.-K.; Kim, J.-S.; Moon, Y.-I. Improving Typhoon-Induced Rainfall Forecasts Based on Similar Typhoon Tracks. Appl. Sci. 2025, 15, 11597. [Google Scholar] [CrossRef]
- Di, Y.; Lu, M.; Chen, M.; Chen, Z.; Ma, Z.; Yu, M. A Quantitative Method for the Similarity Assessment of Typhoon Tracks. Nat. Hazards 2022, 112, 587–602. [Google Scholar] [CrossRef]
- Tamamadin, M.; Lee, C.; Kee, S.-H.; Yee, J.-J. Regional Typhoon Track Prediction Using Ensemble K-Nearest Neighbor Machine Learning in the GIS Environment. Remote Sens. 2022, 14, 5292. [Google Scholar] [CrossRef]
- Hokson, J.A.; Kanae, S. The Use of Along-Track Central Pressure and Movement Speed in Similar Typhoon Identification for Rainfall Prediction. J. JSCE 2024, 12, 23-16036. [Google Scholar] [CrossRef]
- Che, J.; Liu, B.; Chen, L.; Ren, G.; Zhou, T. Typhoon-Related Changes in Moisture Pathways and Sources for Precipitation in Eastern China during the Three Major Rainy Seasons. Atmos. Res. 2023, 292, 106871. [Google Scholar] [CrossRef]
- Tang, J.-H.; Xu, X.-D.; Cai, W.-Y.; Wang, C.-Z. Water Vapour Multi-Vortex Structure under the Interactions of Typhoons and Mid-Low Latitude Systems during Extreme Precipitation in North China. Adv. Clim. Change Res. 2023, 14, 116–125. [Google Scholar] [CrossRef]
- Three Types of East Asian Summer Rainfall Associated with Monsoon Circulation and Tropical Cyclone Activities: Unique Features and Major Influential Factors/Climate Dynamics/Springer Nature Link. Available online: https://link.springer.com/article/10.1007/s00382-024-07120-6 (accessed on 22 March 2026).
- Dong, H.; Huang, S.; Wang, H.; Shi, H.; Singh, V.P.; She, D.; Huang, Q.; Leng, G.; Gao, L.; Wei, X.; et al. Effects of Interaction of Multiple Large-Scale Atmospheric Circulations on Precipitation Dynamics in China. Sci. Total Environ. 2024, 923, 171528. [Google Scholar] [CrossRef]
- Impact of Vertical Wind Shear in Modulating Tropical Cyclones Eye and Rainfall Structure/Natural Hazards/Springer Nature Link. Available online: https://link.springer.com/article/10.1007/s11069-022-05257-3 (accessed on 22 March 2026).
- Zeng, Z.; Xu, J.; Ye, G.; Shen, W. The Influence of Different Intensity of Monsoon on Typhoon Precipitation: A Comparative Study of Typhoons Soudelor and Maria. Front. Earth Sci. 2023, 11, 1251711. [Google Scholar] [CrossRef]
- Chen, S.; Li, W. A Review of Typhoon Inner Core Characteristics and Their Relationship with Intensity Changes. Atmosphere 2024, 15, 1522. [Google Scholar] [CrossRef]
- Chen, X.-Z.; Ma, Y.-L.; Lin, C.-Q.; Fan, L.-L. Assessment of Typhoon Precipitation Forecasts Based on Topographic Factors. Atmosphere 2023, 14, 1607. [Google Scholar] [CrossRef]
- Cheng, Y.; Shen, L.; Zhang, J.; He, H.; Gu, X.; Wang, S.; Ma, T. A Multi-Stage Deep Learning Framework for Multi-Source Cloud Top Height Retrieval from FY-4A/AGRI Data. Atmosphere 2025, 16, 1288. [Google Scholar] [CrossRef]
- Na, H.; Jung, W.-S. A Study on the Pre-Survey and Plan for the Establishment of the Korean Typhoon Impact-Based Forecast. Atmosphere 2024, 15, 1236. [Google Scholar] [CrossRef]
- Na, H.; Jung, W.-S. Administrative-District-Level Risk Indices for Typhoon-Induced Wind and Rainfall: Case Studies in Seoul and Busan, South Korea. Atmosphere 2025, 16, 1392. [Google Scholar] [CrossRef]
- Zhu, K.; Li, S.; Li, W.; Chen, G.; Gong, W.; Qin, Y. Analysis and Application of MST Radar Turbulence Data in Qinzhou, Guangxi, China. Atmosphere 2026, 17, 233. [Google Scholar] [CrossRef]
- Yuan, C.; Zhang, Y.; Zhou, Y.; Lin, J.; Zhang, J.; Lai, W. Analysis of Economic Losses and Comprehensive Impact Factors of Heatwave, Drought, and Heavy Rain Disasters in Hainan Island. Atmosphere 2025, 16, 1017. [Google Scholar] [CrossRef]
- Hersbach, H.; Bell, B.; Berrisford, P.; Hirahara, S.; Horányi, A.; Muñoz-Sabater, J.; Nicolas, J.; Peubey, C.; Radu, R.; Schepers, D.; et al. The ERA5 Global Reanalysis. Quart. J. R. Meteoro. Soc. 2020, 146, 1999–2049. [Google Scholar] [CrossRef]
- Measuring the Effects of Typhoon Trajectories on Dengue Outbreaks in Tropical Regions of Taiwan: 1998–2019/International Journal of Biometeorology/Springer Nature Link. Available online: https://link.springer.com/article/10.1007/s00484-023-02498-0 (accessed on 22 March 2026).
- Stelly, J.; Pokhrel, Y.; Tiwari, A.D.; Dang, H.; Lo, M.-H.; Yamazaki, D.; Lee, T.-Y. Reconstruction of Long-Term Hydrologic Change and Typhoon-Induced Flood Events over the Entire Island of Taiwan. J. Hydrol. Reg. Stud. 2024, 53, 101806. [Google Scholar] [CrossRef]
- Pandey, R.S.; Liou, Y.-A. Typhoon Strength Rising in the Past Four Decades. Weather Clim. Extrem. 2022, 36, 100446. [Google Scholar] [CrossRef]
- Ying, M.; Zhang, W.; Yu, H.; Lu, X.; Feng, J.; Fan, Y.; Zhu, Y.; Chen, D. An Overview of the China Meteorological Administration Tropical Cyclone Database. J. Atmos. Ocean. Technol. 2014, 31, 287–301. [Google Scholar] [CrossRef]
- Lu, X.; Yu, H.; Ying, M.; Zhao, B.; Zhang, S.; Lin, L.; Bai, L.; Wan, R. Western North Pacific Tropical Cyclone Database Created by the China Meteorological Administration. Adv. Atmos. Sci. 2021, 38, 690–699. [Google Scholar] [CrossRef]
- Yuan, Y.; Ma, Y.; Dai, L.; Zang, Y.; Ke, K.; Huang, X. Evaluation of Wind Field for ERA5 Reanalysis Data in Offshore East China Sea. Atmosphere 2026, 17, 310. [Google Scholar] [CrossRef]
- Nanda, K.; Mondal, D.; Sasmal, S.; Hobara, Y.; Maurya, A.K.; Hayakawa, M.; Potirakis, S.M.; Datta, A. Atmospheric Impact of Typhoon Hagibis: A Multi-Layer Investigation of Stratospheric and Ionospheric Responses. Atmosphere 2026, 17, 167. [Google Scholar] [CrossRef]
- Song, G.; Mantravadi, V.S.; Wang, C.; Liao, X.; Li, Y.; Nurulloyev, S. Dynamic Ocean–Atmosphere Processes of Typhoon Chan-Hom and Their Impact on Intensity, Rainfall and SST Cooling. Atmosphere 2026, 17, 91. [Google Scholar] [CrossRef]
- Fan, N.; Lin, X.; Guo, H. An Analysis for the Applicability of Global Precipitation Measurement Mission (GPM) IMERG Precipitation Data in Typhoons. Atmosphere 2023, 14, 1224. [Google Scholar] [CrossRef]
- Li, X.; Chen, L.; Chen, Y.; Zhang, R.; Zhu, Z.; Yin, H.; Jiang, B. Assessing the Use of GPM DPR and IMERG Products for Typhoon Mujigae over the Southern Coastal Provinces of China. Atmos. Res. 2025, 315, 107873. [Google Scholar] [CrossRef]
- Chen, P.; Yu, H.; Xu, M.; Lei, X.; Zeng, F. A Simplified Index to Assess the Combined Impact of Tropical Cyclone Precipitation and Wind on China. Front. Earth Sci. 2019, 13, 672–681. [Google Scholar] [CrossRef]
- Lee, T.-C.; Knutson, T.R.; Nakaegawa, T.; Ying, M.; Cha, E.J. Third Assessment on Impacts of Climate Change on Tropical Cyclones in the Typhoon Committee Region–Part I: Observed Changes, Detection and Attribution. Trop. Cyclone Res. Rev. 2020, 9, 1–22. [Google Scholar] [CrossRef]
- Chen, S.S.; Knaff, J.A.; Marks, F.D. Effects of Vertical Wind Shear and Storm Motion on Tropical Cyclone Rainfall Asymmetries Deduced from TRMM. Mon. Weather Rev. 2006, 134, 3190–3208. [Google Scholar] [CrossRef]
- Wang, J.; Rong, Y. The Long-Delayed Response of a Cyclonic Ocean Eddy to the Passage of Typhoons Hinnamnor and Muifa. Atmosphere 2025, 16, 601. [Google Scholar] [CrossRef]
- Li, F.; Zheng, Q.; Jiang, Y.; Xun, A.; Zhang, J.; Zheng, H.; Wang, H. Impact Analysis of Super Typhoon 2114 ‘Chanthu’ on the Air Quality of Coastal Cities in Southeast China Based on Multi-Source Measurements. Atmosphere 2023, 14, 380. [Google Scholar] [CrossRef]
- Dong, Y.; Li, Q. Inner-Core Humidification and Prelandfall Rapid Intensification of Typhoon Mekkhala (2020) in Strong Vertical Wind Shear. Mon. Weather Rev. 2024, 152, 2697–2716. [Google Scholar] [CrossRef]
- Lu, W.; Liang, X.S. Rapid Intensification of Typhoon Rammasun (2014) with Strong Vertical Wind Shear. Atmosphere 2025, 16, 297. [Google Scholar] [CrossRef]
- Wang, C.; Fang, J.; Ma, Y. Structural Changes Preceding the Rapid Intensification of Typhoon Lekima (2019) Under Moderate Vertical Wind Shear. J. Geophys. Res. Atmos. 2022, 127, e2022JD036544. [Google Scholar] [CrossRef]
- Liu, L.; Han, Y.; Xia, Y.; Guo, Q.; Gao, W. Investigation of Atmospheric Dynamic and Thermodynamic Structures of Typhoon Sinlaku (2020) from High-Resolution Dropsonde and Two-Way Rawinsonde Measurements. Remote Sens. 2022, 14, 2704. [Google Scholar] [CrossRef]
- Zhou, G.; Du, H. The Diagnostic Analysis of the Thermodynamic Characteristics of Typhoon “Maysak” during Its Transformation Process. Atmosphere 2024, 15, 1058. [Google Scholar] [CrossRef]
- Liang, J.; Liu, Y.; Wang, H. Multi-Timescale Water Vapor Transport for an Extraordinary Rainstorm in Zhengzhou, China, Impacted by Remote Tropical Cyclones on 20 July 2021. Adv. Atmos. Sci. 2025, 42, 2305–2317. [Google Scholar] [CrossRef]
- Zuo, H.; Chen, Y.; Chen, S.; Li, W.; Zhang, A. The Effect of the Water Tower of Typhoon Mangkhut (2018). Atmosphere 2022, 13, 636. [Google Scholar] [CrossRef]
- Hegde, A.K.; Kawamura, R.; Kawano, T. Evidence for the significant Role of Sea Surface Temperature Distributions over Remote Tropical Oceans in Tropical Cyclone Intensity. Clim. Dyn. 2016, 47, 623–635. [Google Scholar] [CrossRef]
- Fujiwara, K.; Kawamura, R.; Hirata, H.; Kawano, T.; Kato, M.; Shinoda, T. A Positive Feedback Process Between Tropical Cyclone Intensity and the Moisture Conveyor Belt Assessed with Lagrangian Diagnostics. JGR Atmos. 2017, 122, 12502–12521. [Google Scholar] [CrossRef]
- Yoshida, N.; Kawamura, R.; Kawano, T.; Mochizuki, T.; Iizuka, S. Remote Dynamic and Thermodynamic Effects of Typhoons on Meiyu–Baiu Precipitation in Japan Assessed with Bogus Typhoon Experiments. Weather Clim. Extrem. 2023, 41, 100578. [Google Scholar] [CrossRef]
- He, Y.; Chen, T.; Tang, J. Thermodynamic and Kinematic Structures in the Rainband Region of Typhoon Lekima (2019) at Landfall. Atmosphere 2022, 13, 312. [Google Scholar] [CrossRef]
- Li, X.; Cheng, X.; Fei, J.; Huang, X.; He, S. Evolution of the Double Warm-Core Structure in the Eyewall Replacement Cycle of Typhoon Trami (2018). J. Geophys. Res. Atmos. 2024, 129, e2024JD041371. [Google Scholar] [CrossRef]
- Brizuela, N.G.; Johnston, T.M.S.; Alford, M.H.; Asselin, O.; Rudnick, D.L.; Moum, J.N.; Thompson, E.J.; Wang, S.; Lee, C.-Y. A Vorticity-Divergence View of Internal Wave Generation by a Fast-Moving Tropical Cyclone: Insights From Super Typhoon Mangkhut. J. Geophys. Res. Ocean. 2023, 128, e2022JC019400. [Google Scholar] [CrossRef]
- Zuhang, W.; Zhang, Y.; Zhang, L.; Zheng, H.; Huang, X. A Comparison of Convective and Stratiform Precipitation Microphysics of the Record-Breaking Typhoon In-Fa (2021). Atmosphere 2022, 14, 344. [Google Scholar]
- Li, Z.; Zheng, Z.; Wang, Z.; Ju, X.; Song, Z.; Su, R.; Sun, K.; Hu, X.; Sun, J. Upper-Ocean Thermal Rejuvenation Within the Typhoon Inactivity Duration Influences Subsequent Typhoon Development. Atmosphere 2026, 17, 225. [Google Scholar] [CrossRef]
- Ruan, T.; Chen, G.; Bai, L. Outer Rainband Formation on Land Ahead of Typhoon Hato (2017). J. Geophys. Res. Atmos. 2023, 128, e2022JD038051. [Google Scholar] [CrossRef]
- Fang, Z.; Cheung, K.K.W.; Yang, Y. Contribution from the Western Pacific Subtropical High Index to a Deep Learning Typhoon Rainfall Forecast Model. Atmosphere 2024, 16, 2207. [Google Scholar] [CrossRef]
- Rao, C.; Chen, G.; Ran, L. Effects of Typhoon In-Fa (2021) and the Western Pacific Subtropical High on an Extreme Heavy Rainfall Event in Central China. J. Geophys. Res. Atmos. 2023, 128, e2022JD037924. [Google Scholar] [CrossRef]
- Analysis on Cause of Rapid Intensification of Asymmetrical Typhoon Hato (1713) over the Offshore of China. Available online: http://www.byzh.org.cn/en/article/doi/10.3969/j.issn.1004-9045.2019.03.003 (accessed on 22 March 2026).
- Zang, Y.; Zhao, H.; Klotzbach, P.J.; Wang, C.; Cao, J. Relationship between the South Asian High and Western North Pacific Tropical Cyclone Genesis. Atmos. Res. 2023, 281, 106491. [Google Scholar] [CrossRef]
Disclaimer/Publisher’s Note: The statements, opinions and data contained in all publications are solely those of the individual author(s) and contributor(s) and not of MDPI and/or the editor(s). MDPI and/or the editor(s) disclaim responsibility for any injury to people or property resulting from any ideas, methods, instructions or products referred to in the content. |
© 2026 by the authors. Licensee MDPI, Basel, Switzerland. This article is an open access article distributed under the terms and conditions of the Creative Commons Attribution (CC BY) license.