


Abstract
Health impact assessments of ambient particulate matter remain far less developed in sub-Saharan African cities, despite fine particulate matter (PM2.5) being a significant contributor to premature mortality globally. This study quantified the public health burdens of adult mortality associated with long-term PM2.5 exposure in Addis Ababa, Ethiopia, under different counterfactual air quality scenarios. Hourly PM2.5 data were collected across nine monitoring stations from 2022 to 2023. AirQ+ tool was utilized to estimate attributable natural-cause and cardiovascular disease (CVD) mortality among adults aged ≥ 30 years. Spatial analysis showed mean concentrations ranging from 15 µg/m3 to 33 µg/m3, with an overall mean of 26.74 µg/m3, exceeding the WHO annual guideline by more than fivefold. Seasonal peaks occurred from June to August and diurnal maxima at 7:00 AM. In 2022, attributable natural-cause deaths ranged from 1489 (6.16%) at the less stringent WHO Interim Target 3 (15 µg/m3) to 3169 (13.11%) at the WHO Air Quality Guidelines (5 µg/m3). In 2023, the range was 1544 (6.40%) to 3218 (13.33%). For specific chronic endpoints, PM2.5 concentration level was responsible for between 509 and 1071 CVD deaths in 2022, and between 535 and 1126 CVD deaths in 2023 across the counterfactual scenario. These results highlight the substantial health burden posed by ambient PM2.5 in Addis Ababa and emphasize the urgent need for targeted interventions.
1. Introduction
Air pollution is the most significant global environmental health threat, contributing to substantial morbidity and mortality worldwide. According to the State of Global Air 2025 report by the Health Effects Institute and the Institute for Health Metrics and Evaluation, air pollution was responsible for an estimated 7.9 million deaths globally in 2023, making it the leading environmental risk factor for mortality [1,2,3]. The majority of these deaths (86%) were attributable to non-communicable diseases, including ischemic heart disease, stroke, chronic obstructive pulmonary disease (COPD), and lung cancer, with emerging evidence also linking exposure to dementia [1].
Fine particulate matter (PM2.5) remains the dominant contributor, accounting for approximately 4.9 million deaths, followed by household air pollution (2.8 million) and tropospheric ozone pollution (470,000) [1]. These findings underscore the pervasive and multisystem health impacts of air pollution.
The burden of air pollution is disproportionately concentrated in low- and middle-income countries (LMICs), where rapid urbanization, industrial growth, and limited regulatory capacity contribute to elevated pollution levels. In Africa, ambient air pollution alone was responsible for an estimated 394,000 deaths in 2019, reflecting a marked increase from 2015 [4]. Household air pollution further exacerbates this burden, particularly in settings reliant on solid fuels for cooking and heating [4]. Beyond health impacts, air pollution imposes significant economic costs, with losses exceeding 1% of gross domestic product in countries such as Ethiopia, Ghana, and Rwanda [4,5]. Moreover, PM2.5 exposure has been associated with substantial losses in cognitive potential among children, posing long-term challenges for human capital development [4].
The causal relationship between long-term exposure to PM2.5 and adverse health outcomes is well established. A comprehensive systematic review and meta-analysis conducted in support of the World Health Organization Air Quality Guidelines synthesized evidence from over 100 cohort studies and demonstrated consistent, statistically significant associations between PM2.5 pollution level and all-cause, cardiovascular, and respiratory mortality [6,7,8,9,10,11]. These findings informed the 2021 revision of the WHO Air Quality Guidelines, which reduced the recommended annual mean PM2.5 concentration from 10 µg/m3 to 5 µg/m3, reflecting growing consensus that no safe PM2.5 pollution level threshold exists [12].
Health impact assessment (HIA) tools, particularly AirQ+, have become standard methods for quantifying the public health burden of air pollution. Developed by the WHO, AirQ+ applies concentration–response functions derived from epidemiological evidence to estimate attributable mortality and morbidity [13,14]. A global review identified 286 studies across 69 countries using AirQ/AirQ+, demonstrating its widespread application; however, significant gaps remain in the African context, particularly regarding data quality, spatial coverage, and uncertainty characterization [15].
Recent studies across African cities have reported consistently high PM2.5 concentrations and substantial associated health burdens. In Kinshasa, annual mean PM2.5 concentrations of 43.5 µg/m3 were reported, with a large proportion of respiratory and cancer-related deaths attributable to air pollution [13]. Similarly, in Nairobi, personal exposure studies have documented high PM2.5 levels, particularly among households using biomass fuels [16,17]. Despite these advances, the evidence base across sub-Saharan Africa remains limited, with relatively few studies providing high-resolution pollution level assessments [18].
Advances in air quality monitoring technologies provide new opportunities to address data gaps in resource-constrained settings. Satellite-derived estimates have improved understanding of regional trends but lack sufficient resolution for local health assessments. In contrast, low-cost PM2.5 sensors enable expanded multi-site monitoring networks at relatively low cost and, when properly calibrated, can produce reliable data comparable to reference-grade instruments [17,19,20,21,22,23]. Validation studies in Ethiopia have demonstrated strong agreement between low-cost sensors and gravimetric methods, supporting their application in urban air quality assessment [24].
In Addis Ababa, PM concentration measurement has been limited by sparse monitoring infrastructure. However, several groups, including the city administration, have recently been installing low-cost sensors in different parts of the city, while functional reference-grade monitors are only available at the US Embassy. A foundational health impact assessment reported mean PM2.5 concentrations of 42.4 µg/m3 and estimated a substantial attributable mortality burden; however, the analysis relied on a single monitoring site, leaving it highly vulnerable to localized source biases [25]. Subsequent studies have similarly been constrained by limited monitoring coverage [26,27,28]. While establishing a perfectly uniform, high-density city-wide sensor network remains a logistical challenge in Addis Ababa, moving beyond single-site data to a distributed multi-site network is a critical next step to capture a more representative urban baseline for cumulative health assessments.
Given these limitations, there is a critical need for multi-site monitoring networks that capture diverse urban microenvironments to support more representative city-wide spatiotemporal assessments incorporating calibrated low-cost sensors along with two reference-grade monitors for robust health impact estimations. Integrating an expanded network of low-cost sensors offers a feasible approach to minimize the single-station biases of previous studies, providing a more robust, aggregated exposure baseline for public health interventions and air quality management.
Accordingly, the aim of this study was to characterize the spatiotemporal patterns of PM2.5 across an expanded, multi-site sensor footprint and quantify the cumulative public health impacts in Addis Ababa, Ethiopia, using integrated monitoring data and the WHO AirQ+ model.
2. Materials and Methods
2.1. Description of Study Area
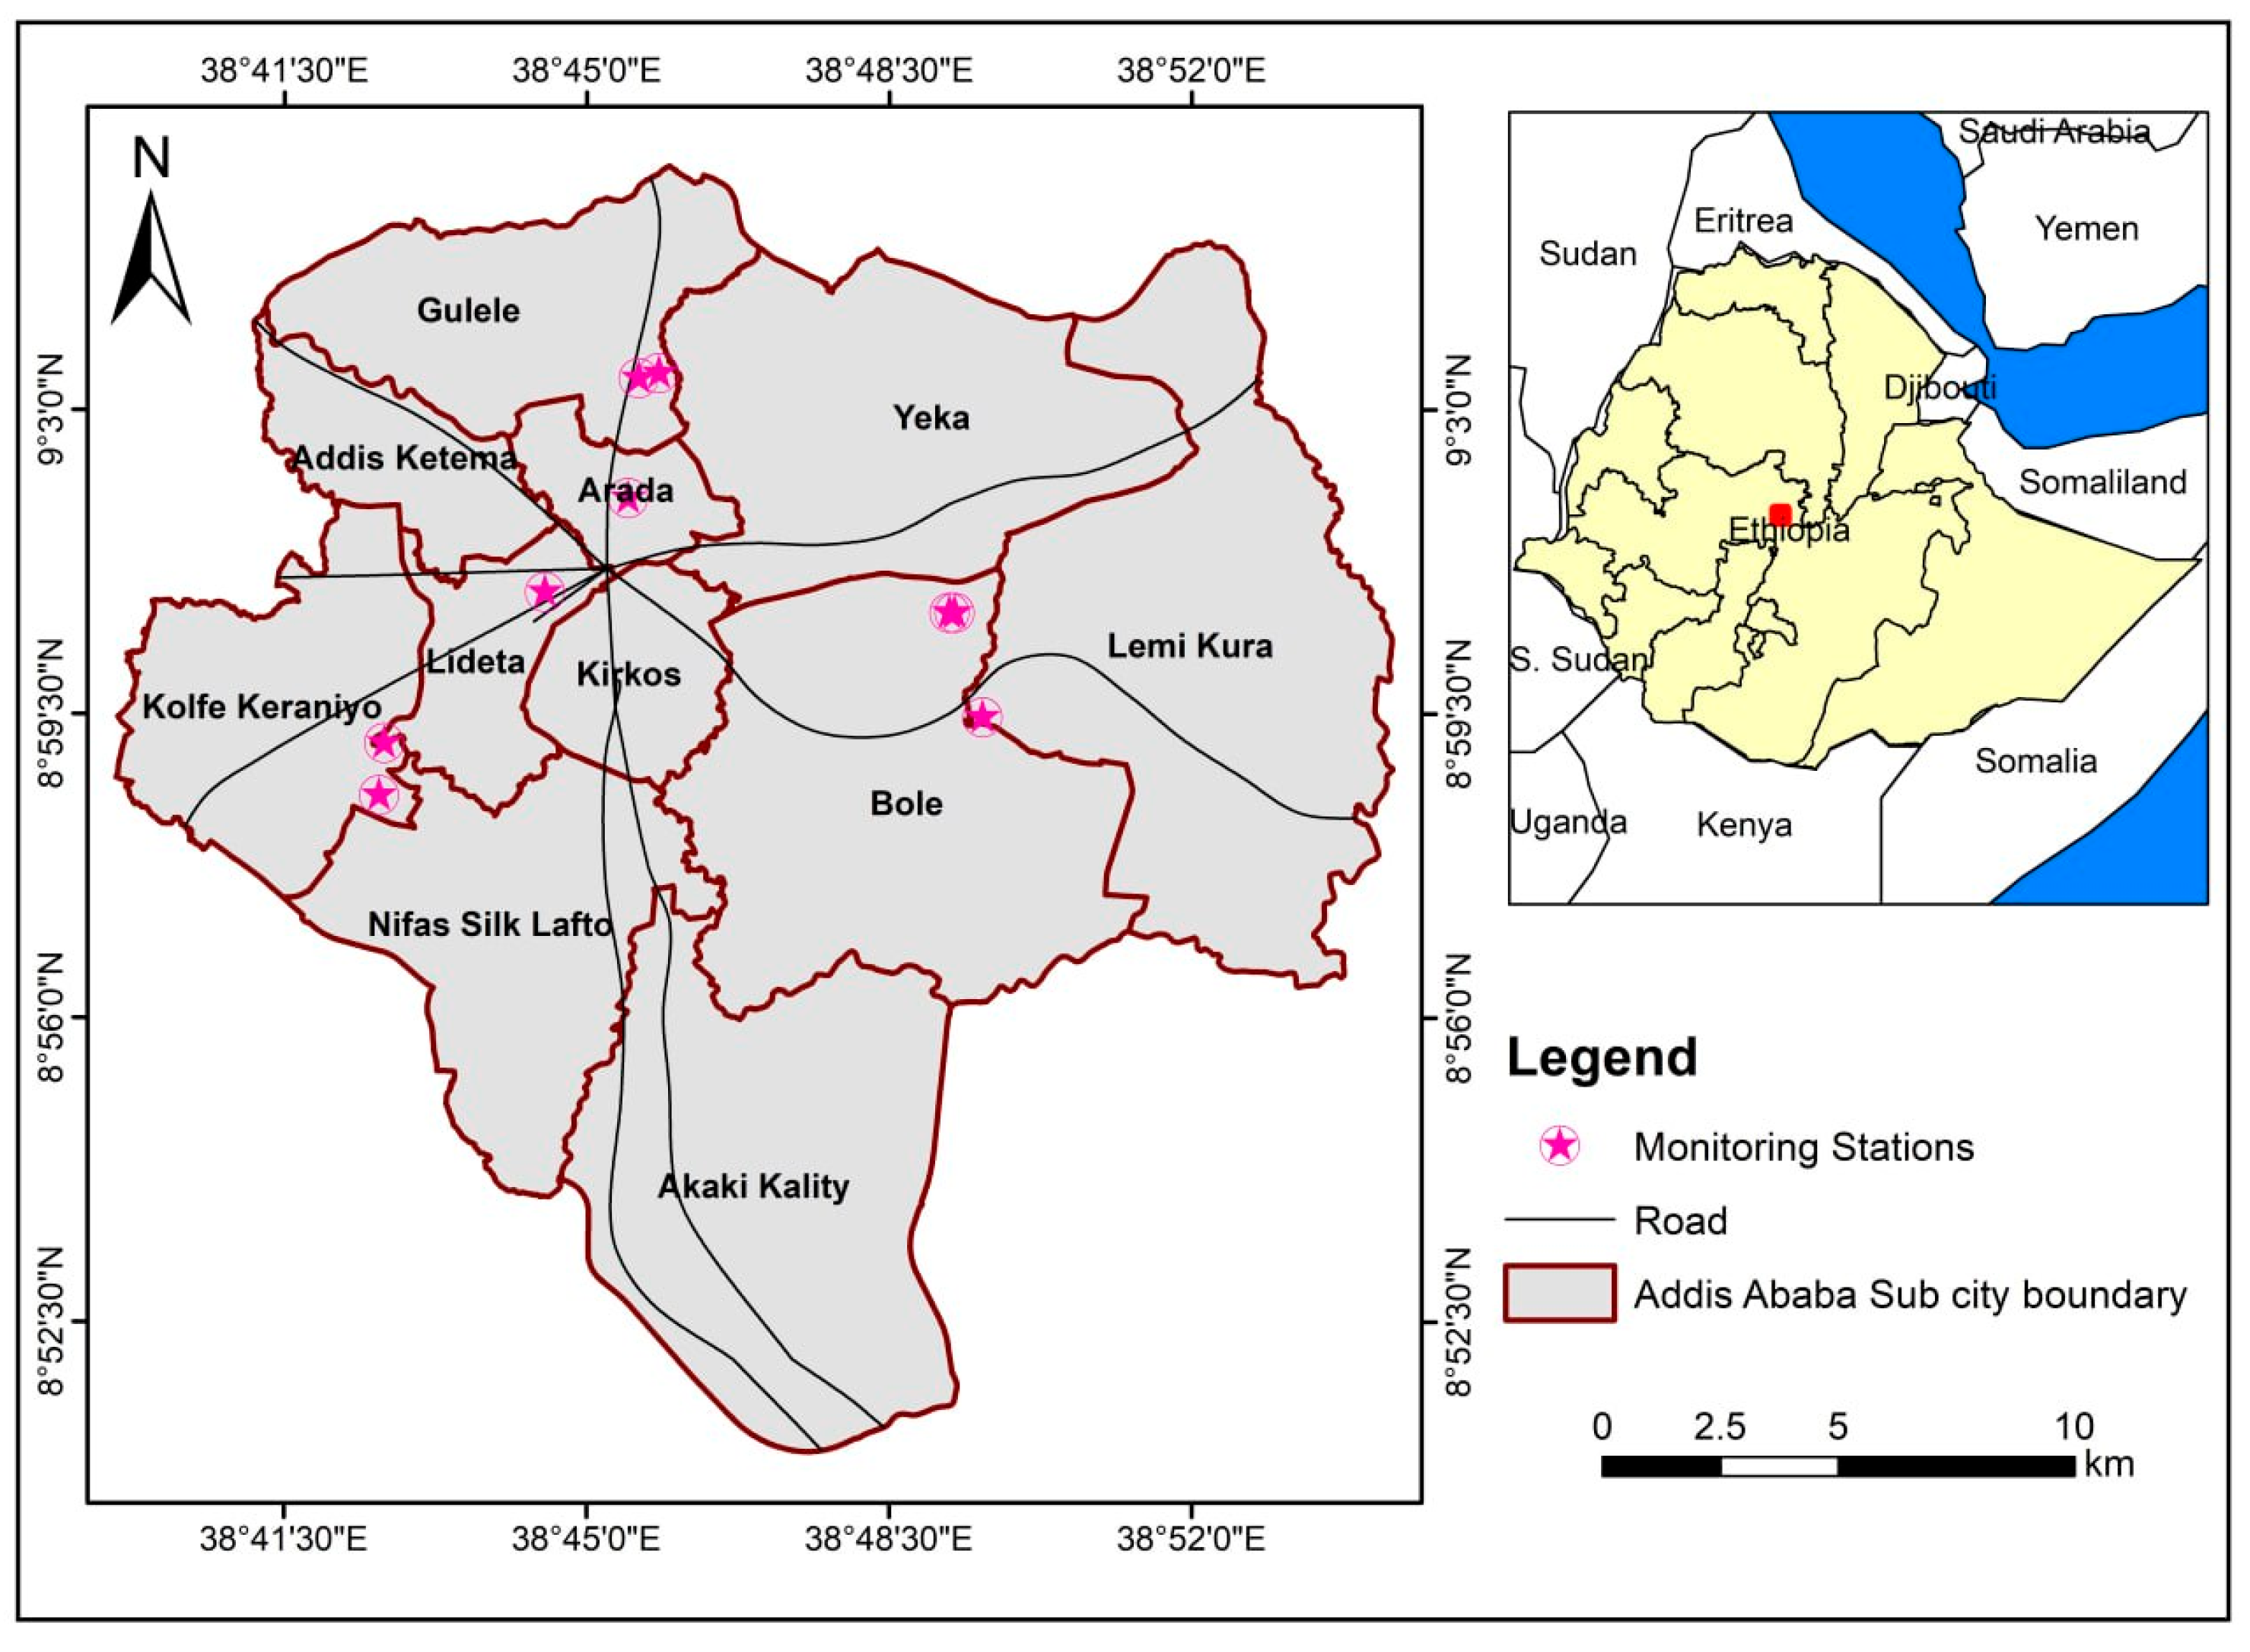
This study was conducted in Addis Ababa city in Ethiopia. The city is geographically situated between latitude 8.85° N and 9.05° N and longitudes 38.65° E and 38.90° E (Figure 1). It covers an area of about 540 km2. According to the Ethiopian Statistical Service (ESS), the total population of the city was estimated to be 3,859,999 in 2022, reflecting a modest increase to 3,945,000 in 2023. The city is administratively divided into eleven sub-cities: Addis Ketema, Akaki Kaliti, Arada, Bole, Gullele, Kirkos, Kolfe Keranio, Ledeta, Nifas Silk Lafto, Yeka, and Lemi Kura.
Figure 1.
Description of the study area across the sub-cities of Addis Ababa, showing the road network and the spatial distribution of the nine air quality monitoring stations.
The city has an average altitude of 2400 m above sea level, with its highest point being Entoto Hill to the north, which rises to 3200 m. The city experiences a subtropical highland climate, with temperatures ranging from mild to cool. The long-term mean annual maximum and minimum temperatures of Addis Ababa are 25.8 °C and 12.6 °C, respectively. Over the past decades, the maximum temperature has increased by about 2.7 °C, while the minimum temperature shows smaller variations.
2.2. Air Pollution Data
Hourly PM2.5 concentration data were downloaded directly from the PurpleAir online platform (www.purpleair.com) accessed on 15 June 2026 and the AirNow platform (www.airnow.gov) accessed on 15 June 2026 for the period 1 January 2022 to 31 December 2023 (Table 1). Data were cleaned by removing negative PM2.5 values. Hourly PM2.5 concentrations were retained only for days with at least 75% data availability (≥18 h). No additional calibration or correction factors were applied to the PurpleAir data; the spatiotemporal analysis was conducted using the raw data to capture broader spatial variability. However, health impact estimates were derived exclusively from reference-grade BAM data to ensure toxicological and epidemiological robustness.
Table 1.
Locations and land-use characteristics of the selected air quality monitoring sites.
This study employed a two- tiered approach to assess air quality in Addis Ababa. Low-cost PurpleAir sensors (Purple Air LLC, Draper, Utah) captured spatiotemporal variations across urban microenvironments, while peer-reviewed calibration equations linked to reference-grade Beta Attenuation Monitor (BAM) standards were applied for the health impact assessment. This ensured reference equivalency.
PM2.5 concentrations for the AirQ+ model minimized bias in mortality estimates.
2.3. Population and Mortality Data
The baseline demographic profile of Addis Ababa was structured using official government census data. The primary population datasets were obtained from the Population Projections for Ethiopia 2007–2037 report, published by the Central Statistical Agency (CSA) of Ethiopia [29] (historically referenced as the 2013 CSA report and subsequently restructured as the Ethiopian Statistics Service [ESS]).
Age-specific populations for 2023 were estimated via linear interpolation between the 2022 and 2027 ESS medium variant projections following standard demographic techniques (United Nations, Department of Economic and Social Affairs, Population Division (2022); World Population Prospects 2022: Methodology of the United Nations population estimates and projections [30]).
Due to the absence of empirical census or projection tables specifically for the year 2023, a linear interpolation model was executed using the medium-variant projection tracks from 1 July 2022 and 1 July 2027 to simulate the mid-interval demographic growth. The population for each specific age classification cohort in 2023 was determined using the following formula [31]:
- P 2023 = target population for 1 July 2023 (mid-interval year);
- P 2022 = 3,859,638 (ESS medium variant, 1 July 2022);
- P 2027 = 4,281,394 (ESS medium variant, 1 July 2027);
- 5 = number of years in the projection interval (2022 → 2027);
- 1 = forward step of exactly one year from the 2022 baseline.
Mortality data for Addis Ababa were obtained from the Global Burden of Disease (GBD) database developed by the Institute for Health Metrics and Evaluation (IHME). According to GBD estimates, the total population of Addis Ababa was approximately 3,859,638 during the study period. For the health impact assessment, the analysis focused on adults aged 30 years and older, as the exposure–response functions implemented in the AirQ+ model are derived from cohort studies conducted in this age group (Global Burden of Disease Study 2022 and 2023, retrieved from [32]). Detailed population and mortality data used in the analysis are presented in Table A1 (Appendix A).
2.4. Health Impact Assessment Using AirQ+
The public health burden of long-term ambient PM2.5 exposure was quantified using the World Health Organization’s AirQ+ software (version 2.2). This tool applies mathematically integrated concentration–response functions derived from global epidemiological cohort studies to estimate attributable mortality and morbidity fractions.
2.4.1. Model and Scenario Selection
For the present analysis, a log-linear model was selected to calculate the attributable proportion of mortality. This functional form is highly recommended for ambient exposure assessments across wide concentration fields where changes in relative risk follow a non-linear trajectory. The health impact of long-term ambient PM2.5 exposure was estimated using the World Health Organization’s AirQ+ software (version 2.2). AirQ+ is a quantitative tool that estimates the burden of disease attributable to air pollution using integrated exposure–response functions derived from epidemiological studies [13,33]. The software facilitates the calculation of PM2.5 health impacts in accordance with the WHO Air Quality Guidelines [12], including interim targets, allowing for scenario-based assessments using different counterfactual concentrations [12].
For the present analysis, a log-linear model was employed to calculate the attributable proportion of mortality, as this functional form is recommended for long-term ambient PM2.5 concentration assessments where the concentration–response relationship follows a non-linear pattern across a wide exposure range [13,34]. According to the AirQ+ glossary (August 2022 version), the log-linear function is expressed as
where
RR = relative risk at exposure concentration; X = observed PM2.5 concentration (µg/m3); X0 = counterfactual (cut-off) concentration (µg/m3); β = coefficient representing the change in log relative risk per unit change in log-transformed exposure; and α is the intercept (constant term) in the log-linear model
In the log-linear model, the coefficient β quantifies the extent to which a one-unit increase in log-transformed exposure (log[X + 1]) is associated with an expected change in log relative risk by β units. For this analysis, β was derived from the integrated exposure–response (IER) functions embedded within AirQ+, which are based on a meta-analysis of global cohort studies [7].
For the present analysis, a log-linear model was employed to calculate the attributable proportion of mortality for long-term ambient PM2.5 concentrations (2-year average). While this period is shorter than lifetime exposure assessments, it aligns with the integrated exposure–response functions in AirQ+ and captures near-term mortality burden.
The AirQ+ software enables users to calculate PM2.5 impacts based on the WHO Air Quality Guidelines (2021) [35] including intermediate target values (Interim Target 3 = 15 µg/m3, Interim Target 4: 10 µg/m3, and the Air Quality Guideline (AQG): 5 µg/m3). For specific calculations where impacts are quantified by selecting different cut-off points, the log-linear function is more appropriate than alternative models (e.g., linear or linear-log), particularly in the case of air pollution concentrations that are neither too low nor too high [12].
2.4.2. Attributable Proportion Calculation
The attributable fraction (AF) of health outcomes due to PM2.5 exposure was calculated using [36]
where
RR(c) is the relative risk for the health outcome at exposure level cc, and P(c) is the proportion of the population exposed to level c.
Relative risk values were derived from the integrated exposure–response functions integrated into AirQ+, based on meta-analyses of global epidemiological studies.
2.4.3. Attributable Deaths Calculation
The number of attributable deaths (AD) per unit population was calculated as [13]
where B is the baseline reference frequency (number of deaths) for the health outcome in the population.
AD = B × AF
2.4.4. Air Pollution Reduction Scenarios
We modeled scenarios to estimate the potential health benefits of reducing PM2.5 concentrations, focusing on two key targets. The WHO Air Quality Guidelines (AQG) of 5 µg/m3 represents the optimal annual mean concentration for minimizing health risks, while the WHO Interim Target 3 (IT-3) of 15 µg/m3 provides a more achievable intermediate goal. Comparing these levels allows assessment of both ideal and realistic reductions in air pollution and their corresponding health impacts.
3. Results
3.1. Spatial Variation in PM 2.5 Concentrations
Hourly PM2.5 measurements were collected from nine monitoring stations across Addis Ababa, including seven PurpleAir low-cost public sensors for high spatial coverage and two reference-grade Beta Attenuation Monitors (BAMs) to provide benchmark-quality data for health impact assessment. A statistical summary of PM2.5 concentrations recorded at nine monitoring stations in 2022 and 2023 is presented in Table 2. The Shapiro–Wilk test results showed that PM2.5 concentrations were not normally distributed at all monitoring stations (p < 0.05).
Table 2.
A statistical summary of PM2.5 concentrations recorded at 9 monitoring sites.
The mean PM2.5 concentrations ranged from 9.15 µg/m3 at S7 in 2023 to 34.30 µg/m3 at S9 in 2023, indicating substantial spatial heterogeneity. In 2022, the highest mean concentration was observed at S6 (32.55 µg/m3), followed by S4 (32.53 µg/m3) and S9 (31.87 µg/m3), whereas S7 recorded the lowest mean (18.44 µg/m3). In 2023, S9 showed the highest mean (34.31 µg/m3), followed by S6 (33.54 µg/m3) and S4 (32.75 µg/m3), with S7 again exhibiting the lowest value (9.15 µg/m3). Overall, the mean PM2.5 concentration across all sites was 26.79 µg/m3 in 2022 and 26.79 µg/m3 in 2023.
Variability, reflected by the standard deviation, differed among stations and years. In 2022, S6 (18.07 µg/m3), S4 (16.77 µg/m3), and S8 (15.44 µg/m3) exhibited higher fluctuations, while S7 (9.64 µg/m3) showed moderate variability. In 2023, variability increased at several sites, notably S6 (20.42 µg/m3) and S4 (18.34 µg/m3), while S7 decreased (6.82 µg/m3), indicating a sharper drop in mean PM2.5. Comparison of mean and median values shows right-skewed distributions at S4, S6, S8, and S9, suggesting occasional high PM2.5 spikes.
The spatial distribution of PM2.5 concentrations appears closely linked to surrounding land use and anthropogenic activities. Stations with higher PM2.5 levels, such as S4, S6, and S9, are in areas dominated by heavy traffic, commercial zones, high-income residential areas, waste disposal sites, and built-up infrastructure. For example, S6 includes traffic and building zones and hospital parking, while S9 is adjacent to major roads, commercial areas, and densely built high-income neighborhoods, which likely contribute to elevated emissions. S8, with moderate but still elevated concentrations, shares some of these urban characteristics.
In contrast, stations with lower PM2.5 levels, particularly S7, are in areas with relatively more open spaces and pedestrian paths; reduced vehicular density may mitigate particulate concentrations. Similarly, S3 and S1, though urbanized, include green areas and riverine zones, which may help lower PM2.5 through deposition and dispersion mechanisms.
Comparison of mean and median values indicates right-skewed distributions at most stations, particularly S4, S6, S8, and S9, suggesting occasional high PM2.5 pollution episodes.
3.2. Temporal Variation in PM2.5 Concentration
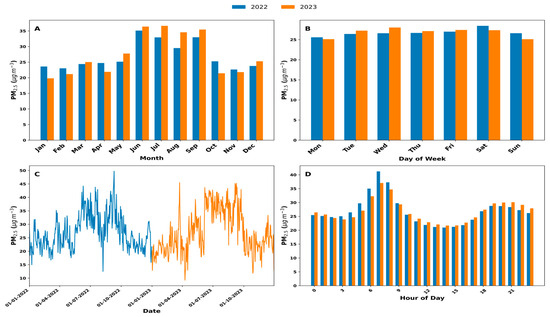
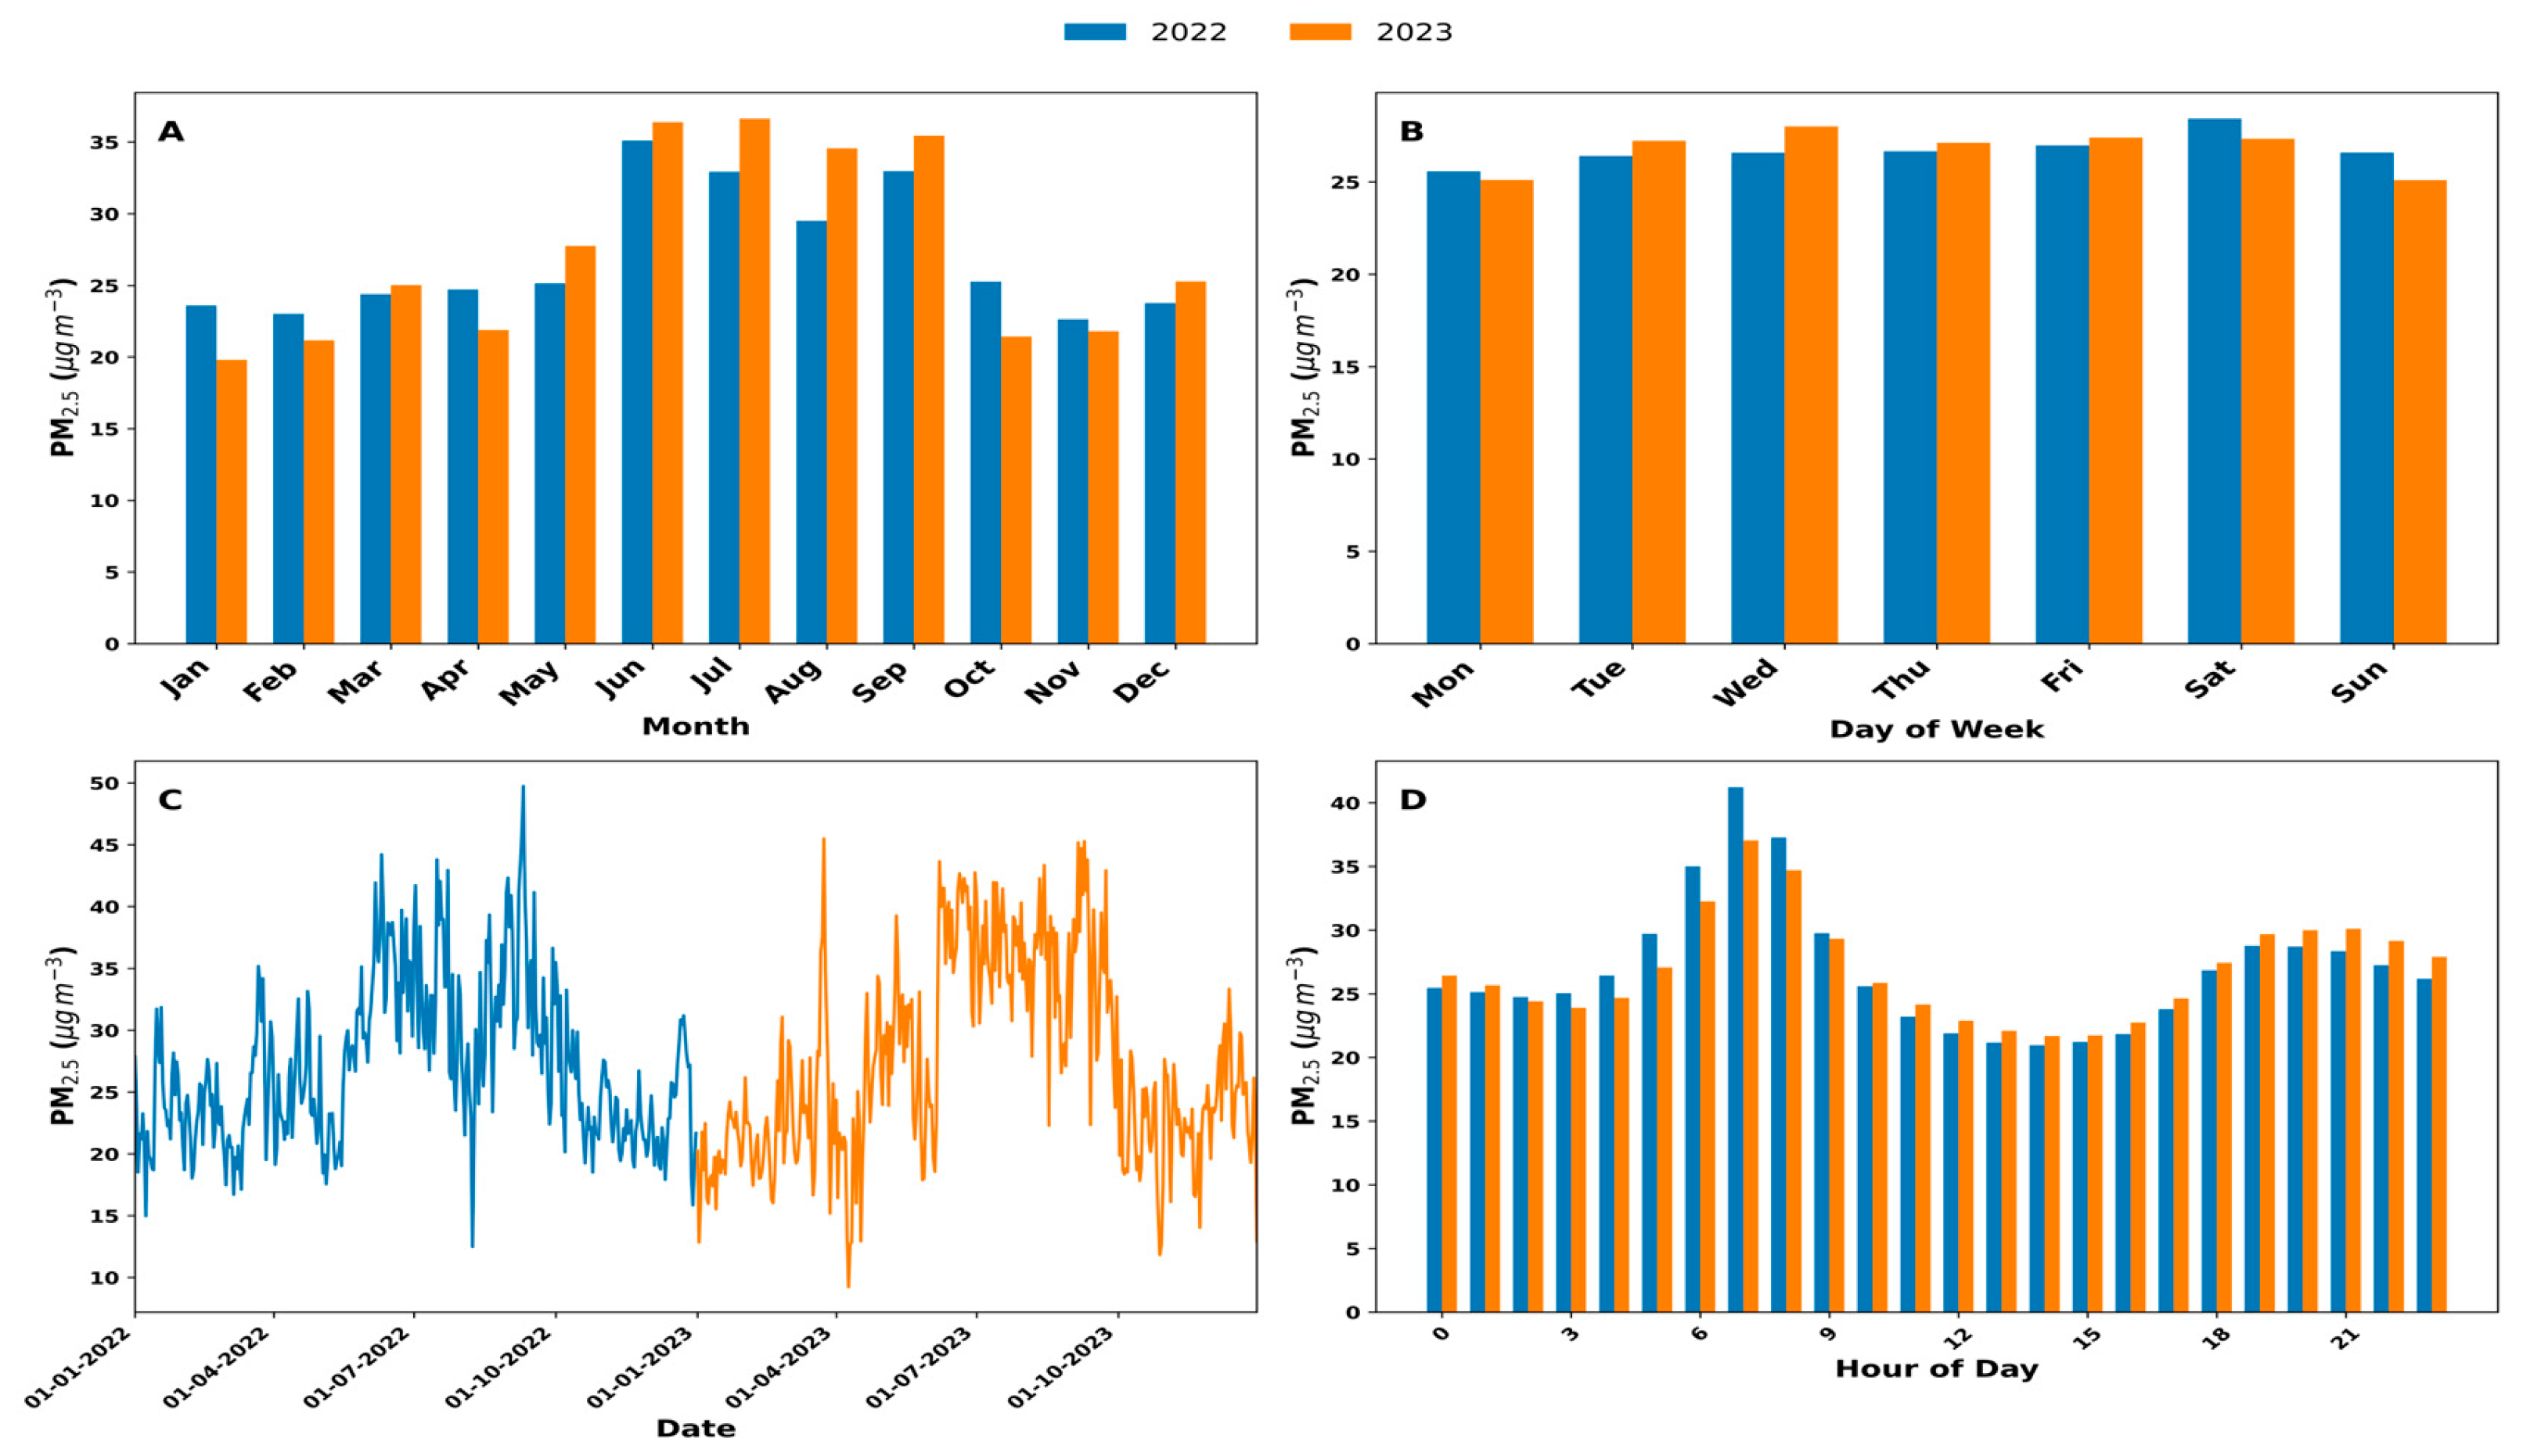
The overall mean PM2.5 concentration was 26.73 µg/m3 in 2022 and 26.76 µg/m3 in 2023. The analysis of monthly mean PM2.5 concentrations over the 2022–2023 period revealed a pronounced and consistent seasonal pattern (Figure 2A). Concentrations were relatively lower and stable during the months from October/November through May, with values ranging from 19 to 27 µg/m3. A sharp and sustained increase was observed from June through September, forming a distinct peak period where monthly averages ranged from 29.53 to 36.61 µg/m3.
Figure 2.
(A) Monthly average PM2.5 concentration, (B) day-of-week average PM2.5 concentration, (C) daily average PM2.5 concentration, (D) hourly average PM2.5 concentration.
This peak season was more severe and prolonged in 2023. Every month from June to September 2023 recorded a higher mean concentration than its 2022 counterpart. The highest single monthly mean of the study period was recorded in July 2023 (36.61 µg/m3). In contrast, the lowest monthly mean was observed in January 2023 (19.85 µg/m3).
A clear weekly cycle in PM2.5 concentrations was evident (Figure 2B). In both years, the lowest mean concentrations occurred on Sundays (e.g., 24.88 µg/m3 in 2023). Concentrations increased through the weekdays. A notable inter-annual shift in the peak pollution day was observed: the highest mean occurred on Saturday in 2022 (28.40 µg/m3) but shifted to Wednesday in 2023 (28.08 µg/m3).
The annual monthly mean values for both 2022 and 2023 are shown in Figure 2. In 2022, PM2.5 concentrations varied across different stations, with notable peaks in the summer months. The highest PM2.5 concentration was recorded as 47.17 µg/m3 at station S6 in August, followed by station S9, which recorded a concentration of 40.81 µg/m3 in September. In contrast, station S7 reported a comparatively lower PM 2.5 concentration of 12.95 µg/m3. Similarly, there was a general increase in PM2.5 concentration across most monitoring stations in 2023 during the wet season. The highest concentration was recorded at station S4 with a value of 47.00 µg/m3 in September, followed by station S6 (42.98 µg/m3). The highest value in July was recorded at station S9 (42.75 µg/m3) followed by station S1 (37.64 µg/m3). On the other hand, the lowest was recorded at station S7 in February (5.53 µg/m3) and January (7.27 µg/m3), which reflects a substantial reduction in pollution compared to the previous year.
3.3. Diurnal Variation in PM2.5 Concentrations
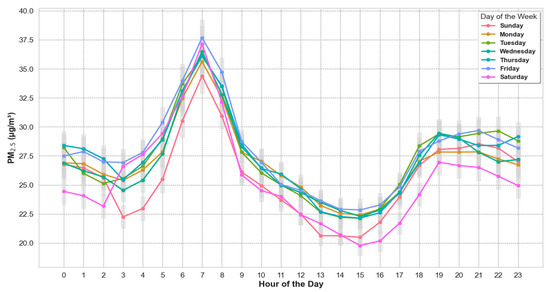
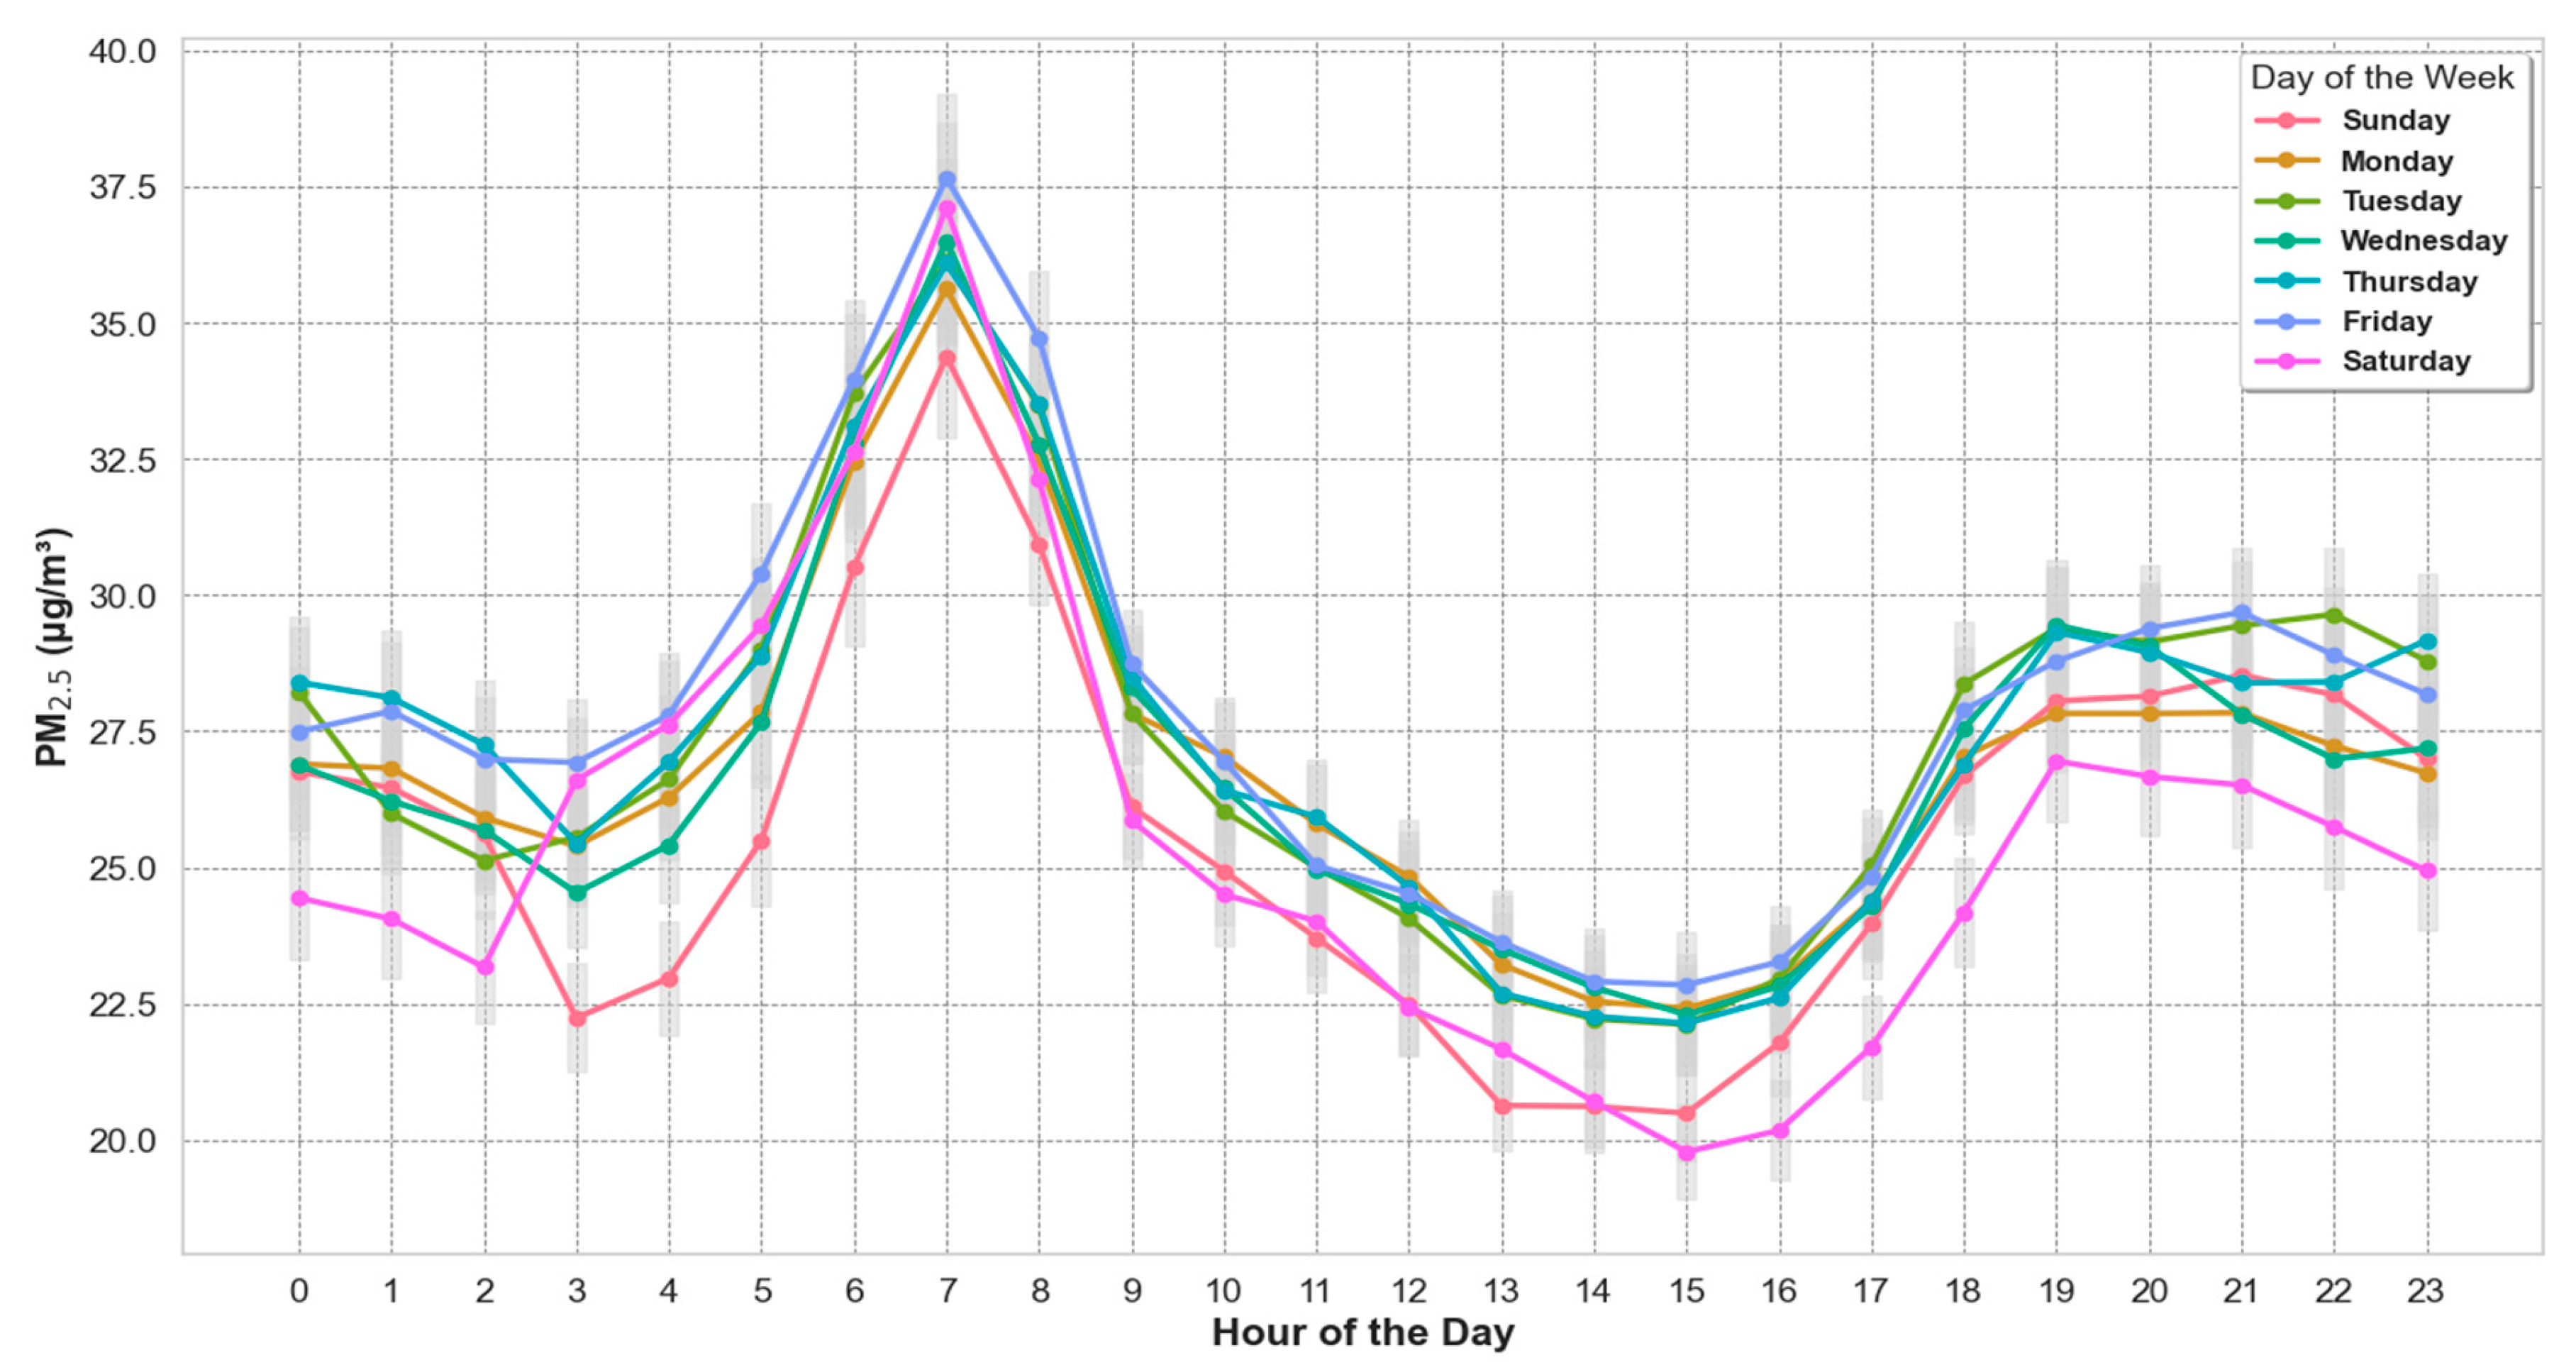
The diurnal variation among all the monitoring stations showed a similar pattern in PM2.5 concentrations, as shown in Figure 3. The results show generally higher concentrations in the early morning hours, particularly between 6.00 a.m and 8.00 a.m with a peak concentration observed at 7.00 a.m. The highest peak concentration of 37.67 μg/m3 occurred on Friday, while the lowest relative concentration of 35.63 μg/m3 was observed on Monday.
Figure 3.
Average diurnal pattern of PM2.5 concentration across all monitoring stations, aggregated by day of the week. Grey lines are error bars.
Following the morning peak, a noticeable decline in PM2.5 concentrations was observed during the midday hours, specifically between 12:00 PM and 2:00 PM. On Monday, the concentration dropped to 24.83 μg/m3 at 12:00 PM, while a similar concentration of 22.48 μg/m3 was observed at the same time on Tuesday. In the evening, PM2.5 concentrations typically increased, beginning around 5:00 PM and peaking between 7:00 PM and 8:00 PM. The minimum PM2.5 concentration of 26.95 μg/m3 was observed at 7:00 PM on Saturday, while the maximum value reached approximately 29.45 μg/m3 by 7:00 PM on Wednesday. Significant differences in P2.5 concentrations were observed across different hours of the day (p < 0.05).
3.3.1. Burden of Adult Mortality Attributable to Ambient PM2.5 Level in 2022
Table 3 presents the estimated health impact attributable to health impacts attributable to ambient PM2.5 concentrations among adults aged 30 years and older in 2022. The estimation was based on an annual mean PM2.5 concentration of 23.26 µg/m3 and a total population of 1,965,169. Assuming a cut-off of 5.0 µg/m3 as recommended by the WHO Air Quality Guidelines, an estimated 13.11% (95%CL: 10.09–14.56%) of natural-cause mortality was attributed to PM2.5 levels. This corresponded to approximately 3169 attributable deaths (95% CL: 2439–3519), equivalent to 161 deaths per 100,000 population (95%CL: 124–179).
Table 3.
Estimated health impact attributable to long-term health impacts attributable to ambient PM2.5 concentrations among adults (Aged 30+ Years) in Addis Ababa, 2022 (BAM Monitor Data: S2 and S3).
When counterfactual concentration was increased to 10.0 µg/m3, the attributable proportion decreased to 9.70% (95% CI: 7.44–10.80%), which corresponds to 2345 attributable deaths (95% CI: 1797–2610) or 119 cases per 100,000 population (95% CI: 91–133).
At a cut-off of 15.0 µg/m3, the estimated attributable proportion was 6.16% (95% CI: 54.70–6.87%), equivalent to 1489 attributable deaths (95% CI: 1136–1661) or 76 cases per 100,000 population (95% CI: 58–84).
3.3.2. Burden of Adult Mortality Attributable to Health Impacts Attributable to Ambient PM2.5 Concentrations in 2023
In 2023, the health impact of long-term health impacts attributable to ambient PM2.5 concentrations was assessed among adults aged 30 years and older. The assessment used an annual mean PM2.5 concentration of 23.59 µg/m3 and a total population of 20,019,691. The AIRQ+ tool was applied to estimate natural-cause mortality attributable to PM2.5 using a log-linear model across three counterfactual scenarios (Table 4).
Table 4.
Estimated health impact attributable to ambient PM2.5 concentrations among adults (age 30+ years) in Addis Ababa, 2023 (BAM Monitor Data: S2 and S3).
At a cut-off of 5.0 µg/m3, an estimated 13.33% (95% CI: 10.27–14.80%) of natural-cause mortality was attributable to ambient PM2.5 concentrations, corresponding to 3218 deaths (95% CI: 2478–3573), or 159 cases per 100,000 population (95% CI: 123–177). In contrast, at a cut-off of 10.0 µg/m3 (Scenario B), the attributable fraction was 9.93% (95% CI: 7.61–11.05%), representing 2397 deaths (95% CI: 1838–2668), or 119 cases per 100,000 population (95% CI: 91–132%).
At a cut-off of 15.0 µg/m3 (Scenario C), the estimated attributable proportion was 6.40% (95% CI: 4.88–7.14%), equating to 1544 deaths (95% CI: 1178–1722%), or 76 cases per 100,000 population (95% CI: 58–85). These results indicate that a substantial proportion of natural-cause mortality among adults in Addis Ababa is associated with long-term health impacts attributable to ambient PM2.5 concentrations, with the largest burden observed when compared to the WHO guideline of 5 µg/m3. The findings emphasize the public health importance of reducing ambient PM2.5 to prevent premature deaths and highlight the potential benefits of air quality interventions in the city.
3.3.3. Attributable Cardiovascular Mortality Burden and Threshold Sensitivity (2022–2023)
The environmental health impact assessment evaluated the long-term ambient effects of fine particulate matter PM2.5 on cardiovascular mortality among adults aged 30 and older in Addis Ababa across consecutive observation years. Based on projections in 2022, the number of adults in Addis Ababa (age ≥ 30 years) was about 1,965,169, including 6174.88 baseline cardiovascular deaths (mortality rate of 314.22 per 100,000). According to health impact assessment results, there was a significant health burden caused by environmental ambient PM2.5 concentration in Addis Ababa under all counterfactual scenarios (Table 5).
Table 5.
Health impact assessment of ambient PM2.5 on cardiovascular mortality (adults ≥30 Years), Addis Ababa (2022).
In Scenario A, for instance, the attributable fraction was 17.35% (95% CI: 14.56–21.28), which accounted for 1071 deaths (95% CI: 899–1314) or 42.8 per 100,000 (95% CI: 36.0–52.6). In Scenario B, PM2.5 was responsible for 12.92% (95% CI: 10.80–15.95) of baseline deaths amounting to 798 deaths (95% CI: 667–985) or 31.9 per 100,000 (95% CI: 26.7–39.4), while Scenario C indicated that the attributable proportion was 8.25% (95% CI: 6.87–10.31) which led to 509 deaths (95% CI: 424–637) or 20.4 per 100,000 (95% CI: 17.0–25.5).
In 2023, the estimated adult population (≥30 years) increased to 2,019,691, with total baseline cardiovascular deaths rising to 6489.90 (mortality rate: 321.33 per 100,000). Table 6 summarizes the findings for 2023 regarding the health impact of ambient PM2.5 on cardiovascular mortality (adults ≥ 30 years). In Addis in 2023, there was an increase in the total adult population to 2,019,691, along with the number of cardiovascular deaths being 6489.90 (mortality rate: 321.33/100,000). The findings were similar in terms of PM2.5-attributable cardiovascular mortality cases, but the total burdens were slightly higher compared to 2022. Using Scenario A, 17.35% (95% CI: 14.56–21.28) of the deaths were attributed to PM2.5, accounting for 1126 deaths (95%CI: 945–1381) or 45.0 per 100,000 (95% CI: 37.8–55.2). Similarly, Scenario B generated 12.92% (95% CI: 10.80–15.95) of deaths due to PM2.5 exposure, which translates to 838 deaths (95% CI: 701–1035) and 33.5 per 100,000 (95% CI: 28.0–41.4), and finally while Scenario C produced 8.25% (95% CI: 6.87–10.31), corresponding to 535 deaths (95% CI: 446–669) or 21.4 per 100,000 (95% CI: 17.8–26.8).
Table 6.
Health impact assessment of ambient PM2.5 on cardiovascular mortality (adults ≥ 30 Years), Addis Ababa (2023).
4. Discussion
This study presented air quality data collected from a total of nine monitoring stations distributed across Addis Ababa, including seven low-cost sensors (PurpleAir) and two BAM stations owned by the U.S. Embassy. For the spatiotemporal analysis, data from all available monitoring stations were utilized to accurately capture the spatial and temporal variability of PM2.5 concentrations across the city. The inclusion of multiple monitoring sites allowed for enhanced characterization of urban air pollution patterns, which is particularly important in rapidly growing cities with diverse emission sources.
Across the entire study period, the overall mean PM2.5 concentration was 26.76 µg/m3, representing an exposure level 5.35 times higher than the WHO Air Quality Guidelines (AQG) of 5 µg/m3. On an annual basis, air quality remained consistent, with an overall mean of 26.74 µg/m3 in 2022 and 26.76 µg/m3 in 2023. Considerable spatial variation was observed, with concentrations ranging from 15.23 to 33.14 µg/m3. Although PM2.5 levels in Addis Ababa remain above WHO standards, the mean concentration recorded in this study is lower than 42.4 µg/m3 reported in the previous assessment [25]. The observed concentration is consistent with previous studies conducted in Addis Ababa. For instance, Sarath K. Guttikunda [37] reported annual ambient PM2.5 concentrations ranging between 20 and 60 µg/m3 across Addis Ababa using the WRF-CAMx chemical transport modeling system [37]. However, it remains slightly higher than the 23.6 µg/m3 reported by Bulto and Berkessa [27]. A recent study conducted in Kinshasa, the Democratic Republic of Congo, another rapidly growing sub-Saharan African city, reported an annual mean PM2.5 concentration of 43.5 µg/m3 in 2019, which is nearly double the levels observed in Addis Ababa during our study period [13].
Stations located near hospitals (S4, S6), waste disposal areas (S8), and commercial corridors (S9) recorded the highest PM2.5 concentrations, highlighting the strong influence of surrounding land use patterns. Sites adjacent to hospitals are typically situated along high-traffic roads with frequent vehicle movement, while commercial corridors are characterized by congestion and intensive fuel combustion. At the waste disposal site (S8), open burning and waste decomposition further contribute to elevated particulate levels. Similar spatial patterns have been reported in other urban studies such as Arba Minch, where PM2.5 concentrations are significantly higher near roads, commercial centers, and waste-related activities due to localized emissions [38,39,40,41].
Our assessment revealed a peak in PM2.5 concentrations during the wet season (June–August), consistent with a previous study conducted in Addis Ababa [25,26,42]. This seasonal increase can be attributed to low wind speeds, reduced pollutant dispersion, and enhanced secondary particle formation, which facilitate the accumulation of pollutants in the atmosphere [43]. In addition, increased reliance on biomass fuels such as charcoal and wood for cooking further elevates emissions [41,44]. Source apportionment evidence supports this pattern, showing that biomass burning contributions increase to 21.5% during the wet season (from 14% in the dry season), while vehicular emissions account for 31% of total PM2.5 mass [41].
In contrast, studies from some Asian regions, such as India, report lower PM2.5 concentrations during the monsoon season due to rainfall and stronger atmospheric mixing that remove particles from the air [45,46,47,48]. In a similar study in China, the summer wet season was associated with the lowest concentrations due to enhanced atmospheric diffusion and precipitation [49].
The persistence of elevated PM2.5 levels in Addis Ababa during the wet season may be attributed to localized urban and infrastructural factors, including frequent flooding, inadequate drainage, and traffic congestion that sustain emissions despite rainfall. At the same time, the use of solid fuels remains widespread, as shown by Azanaw and Sisay Chanie [50], who reported that 87.1% of Ethiopian households rely on solid fuels, with 18.6% in urban areas. This emphasizes the continuing contribution of household energy practices to ambient air pollution. These findings suggest that urban infrastructure, energy consumption patterns, and local meteorological conditions interact to maintain elevated PM2.5 levels during the wet season.
Average diurnal pattern of PM2.5 concentration across all monitoring stations, aggregated by day of the week. The result showed a distinct diurnal bimodal profile, with a primary peak at approximately 7:00 AM. The observed morning peak in PM2.5 concentrations is consistent with previous observations in Addis Ababa reported by Redi [43], where elevated pollutant levels during the early morning were associated with reduced atmospheric mixing and stable meteorological conditions [43,51]. This morning peak is highly indicative of the combined effects of morning traffic rush hours, domestic cooking activities, and a lower, stable atmospheric boundary layer height that limits pollutant dispersion early in the day.
Our analysis revealed that a significant proportion of natural-cause mortality among adults in Addis Ababa is attributable to ambient PM2.5 concentrations. Under the strictest baseline counterfactual (5 µg/m3), the PM2.5 pollution concentration was responsible for 13.11% of natural-cause adult deaths in 2022 (3169 premature deaths) and 13.33% in 2023 (3218 premature deaths) (Table 3 and Table 4), imposing an annual economic toll of over $2.04 billion and $2.07 billion. When evaluated against a moderate counterfactual threshold (Scenario B: 10 µg/m3), the attributable proportion shifts to 9.70% in 2022 (2345 deaths) and 9.93% in 2023 (2397 deaths). This aligns closely with, but is slightly higher than, the 2043 deaths estimated by Kumie, Worku [25] the same threshold (10 µg/m). The escalation in absolute attributable deaths over time despite our slightly lower monitored PM2.5 concentrations can be attributed to Addis Ababa’s rapid demographic expansion and aging population (adults aged 30+ years rising to over 2 million by 2023). This demonstrates that population growth and urbanization can amplify the public health burden even during periods of modest ambient air quality stabilization.
At the least stringent counterfactual target (Scenario C: 15 µg/m3), which corresponds to the WHO Interim Target 3, the model indicated that PM2.5 still accounts for 6.16% (1489 deaths) and 6.40% (1544 deaths) of natural adults’ mortality for 2022 and 2023, respectively.
The results from Addis Ababa are comparable to findings from other sub-Saharan African cities. A study conducted in Kampala, Uganda, using the WHO AirQ+ tool reported attributable proportions of approximately 18–20% for all-cause mortality associated with long-term PM2.5 exposure, at annual concentrations near 39 µg/m [52]. The slightly lower attributable fraction in Addis Ababa is consistent with its lower PM2.5 concentration (approximately 23 µg/m3 compared to 34.9 µg/m3 in Kampala), reflecting the concentration–response function embedded in the AirQ+ model [21].
Our findings are also in line with the results from Kinshasa, the Democratic Republic of Congo, where an attributable proportion of 25.64% for all-cause mortality was reported at a much higher PM2.5 concentration of 43.5 µg/m3 [13]. The lower concentration in Addis Ababa (24–25 µg/m3) logically results in a lower attributable proportion (13.1–13.5%). This gradient highlights the direct relationship between pollution levels and health impacts, suggesting that even the moderately high levels observed in Addis Ababa are associated with a considerable health burden.
Furthermore, a previous study in Addis Ababa using AirQ+ reported an attributable proportion of 17.7% for an annual PM2.5 concentration of 42.4 µg/m3 [25]. Our study, which uses more recent data and a lower baseline concentration, shows a lower attributable fraction, which is consistent with the expected non-linear relationship between exposure and health outcomes, especially when using the log-linear model recommended for such concentration ranges.
Quantitative health impact assessments, such as those performed using AirQ+, facilitate the estimation of potential benefits from improved air quality. Our analysis across different counterfactual scenarios demonstrates that adhering to stricter air quality guidelines would yield substantial health gains. Achieving the WHO’s annual Air Quality Guideline of 5 µg/m3 in Addis Ababa could prevent 13.1–13.5% of current adult deaths—representing over 3100 premature deaths annually. Even a more modest reduction to 15 µg/m3 (WHO Interim Target 3) could prevent 6.2–6.6% of deaths, or approximately 1500 premature deaths each year.
Our specific assessment of cardiovascular mortality reveals that PM2.5 exposure accounts for 17.35% of all baseline cardiovascular deaths in adults under 5 µg/m3. This heavy cardiovascular burden strongly reinforces findings by Getachew, Mekonnen [52] who demonstrated that reducing PM2.5 yields the highest absolute drop in mortality specifically for cardiovascular and ischemic heart diseases in Addis Ababa.
5. Limitations and Novelty
This study has several key strengths. It is one of the few studies in sub-Saharan Africa to utilize two consecutive years of reference-grade (BAM-1020) PM2.5 monitoring data, which provides robust exposure estimates. The use of the WHO AirQ+ software ensures standardized, internationally comparable results, while the application of multiple counterfactual scenarios offers a nuanced assessment of potential health benefits arising from progressive air quality improvements.
Nevertheless, some limitations should be acknowledged. This study is limited by the use of low-cost PM2.5 sensors, which have inherent measurement uncertainties compared to reference-grade instruments and can be influenced by environmental conditions such as temperature and relative humidity. The concentration–response functions embedded in AirQ+ are derived from North American and European cohorts and may not fully capture the exposure-disease relationship in Ethiopian populations. The absence of local cause-specific mortality data restricted the analysis to all-cause mortality, preventing detailed examination of respiratory disease-specific burdens. Moreover, the use of a city-wide annual mean PM2.5 concentration obscures intra-urban exposure heterogeneity, which may result in exposure misclassification. Furthermore, the use of city-wide annual mean PM2.5 concentrations may mask intra-urban exposure variability and introduce exposure misclassification. The ecological study design precludes causal inference at the individual level. Finally, the reliance on a two-year monitoring period may not fully capture long-term inter-annual meteorological variability and broader climatic influences on particulate matter dispersion within the Addis Ababa airshed.
5.1. Implications for Policy
The findings demonstrate that ambient PM2.5 is a major contributor to premature adult mortality in Addis Ababa, with over 3100 attributable deaths annually. For policymakers, this evidence supports the urgent need to establish permanent air quality monitoring networks, enforce national ambient air quality standards in line with WHO guidelines, and implement targeted interventions in key sectors such as transportation, industry, waste management, and road infrastructure. Importantly, even incremental reductions in PM2.5 concentrations can yield substantial health benefits, supporting a phased approach to policy implementation.
5.2. Future Research
Future research should prioritize the development of Ethiopia-specific concentration–response functions through local epidemiological cohort studies. Strengthening health information systems to capture cause-specific mortality and morbidity data is essential for more comprehensive burden assessments. High-resolution spatial exposure modeling would facilitate the identification of pollution hotspots and vulnerable subpopulations. Finally, evaluations of the health co-benefits of existing urban development and transportation policies would provide critical evidence for integrating health impact assessments into environmental decision-making frameworks.
6. Conclusions
This study demonstrates that long-term ambient exposure to PM2.5 is responsible for a substantial and persistent burden of premature mortality among adults in Addis Ababa, with an estimated 13.1–13.5% of all-cause deaths attributable to air pollution, representing over 3100 preventable deaths annually. Progressive reductions in PM2.5 concentrations would yield corresponding health benefits, with adherence to the WHO guideline of 5 µg/m3 representing the optimal target. These findings add to the growing evidence across sub-Saharan African cities that air pollution constitutes a critical but modifiable public health priority. For policymakers, this study provides locally relevant, quantifiable evidence to support the development and implementation of air quality management strategies aimed at reducing the substantial health burden associated with urban air pollution.
Author Contributions
Conceptualization, A.A.M. and A.M.H. and S.B.; methodology, A.A.M.; E.B.T. software, A.A.M., M.N.F.; validation, S.B.; formal analysis, A.A.M. and M.N.F.; investigation, A.A.M.; resources, S.B.; data curation, A.A.M.; writing—original draft preparation, A.A.M., S.B.; E.B.T., writing—review and editing, A.M.H., S.B., M.N.F.; visualization, M.N.F.; supervision, S.B., A.M.H., E.B.T.; project administration, S.B.; funding acquisition, S.B. All authors have read and agreed to the published version of the manuscript.
Funding
S.B. gratefully acknowledges financial support by the Fulbright U.S. Scholar Program, which is sponsored by the U.S. Department of State and the Host Institute of Geophysics, Space Science and Astronomy of Addis Ababa University in Ethiopia. The contents of this publication are solely the responsibility of the author and do not necessarily represent the official views of the Fulbright Program or the Government of the United States.
Institutional Review Board Statement
Not applicable.
Informed Consent Statement
Not applicable.
Data Availability Statement
The PM2.5 datasets analyzed in this study are publicly available. Hourly PM2.5 data from Addis Ababa were obtained from the PurpleAir Community API (Historical API endpoint, bulk downloads) and are accessible at (www.purpleair.com) accessed on 15 June 2026. BAM data were obtained from AirNow and are available at (www.airnow.gov) accessed on 15 June 2026. The processed datasets used for analysis in this study, including hourly averages and spatial summaries, are available from the corresponding author upon reasonable request.
Acknowledgments
The authors gratefully acknowledge PurpleAir, Inc. for providing access to publicly available PM2.5 data through the PurpleAir Community platform and API.
Conflicts of Interest
The authors declare no conflicts of interest.
Appendix A
Table A1.
Baseline characteristics of the study population and exposure levels in Addis Ababa, Ethiopia, 2022–2023.
Figure A1.
Analysis properties window in AirQ+ software illustrating the configuration for estimating all-cause mortality attributable to long-term ambient PM2.5 exposure among adults aged 30+ years in Addis Ababa, Ethiopia (2022 data; counterfactual concentration: 5 µg/m3).
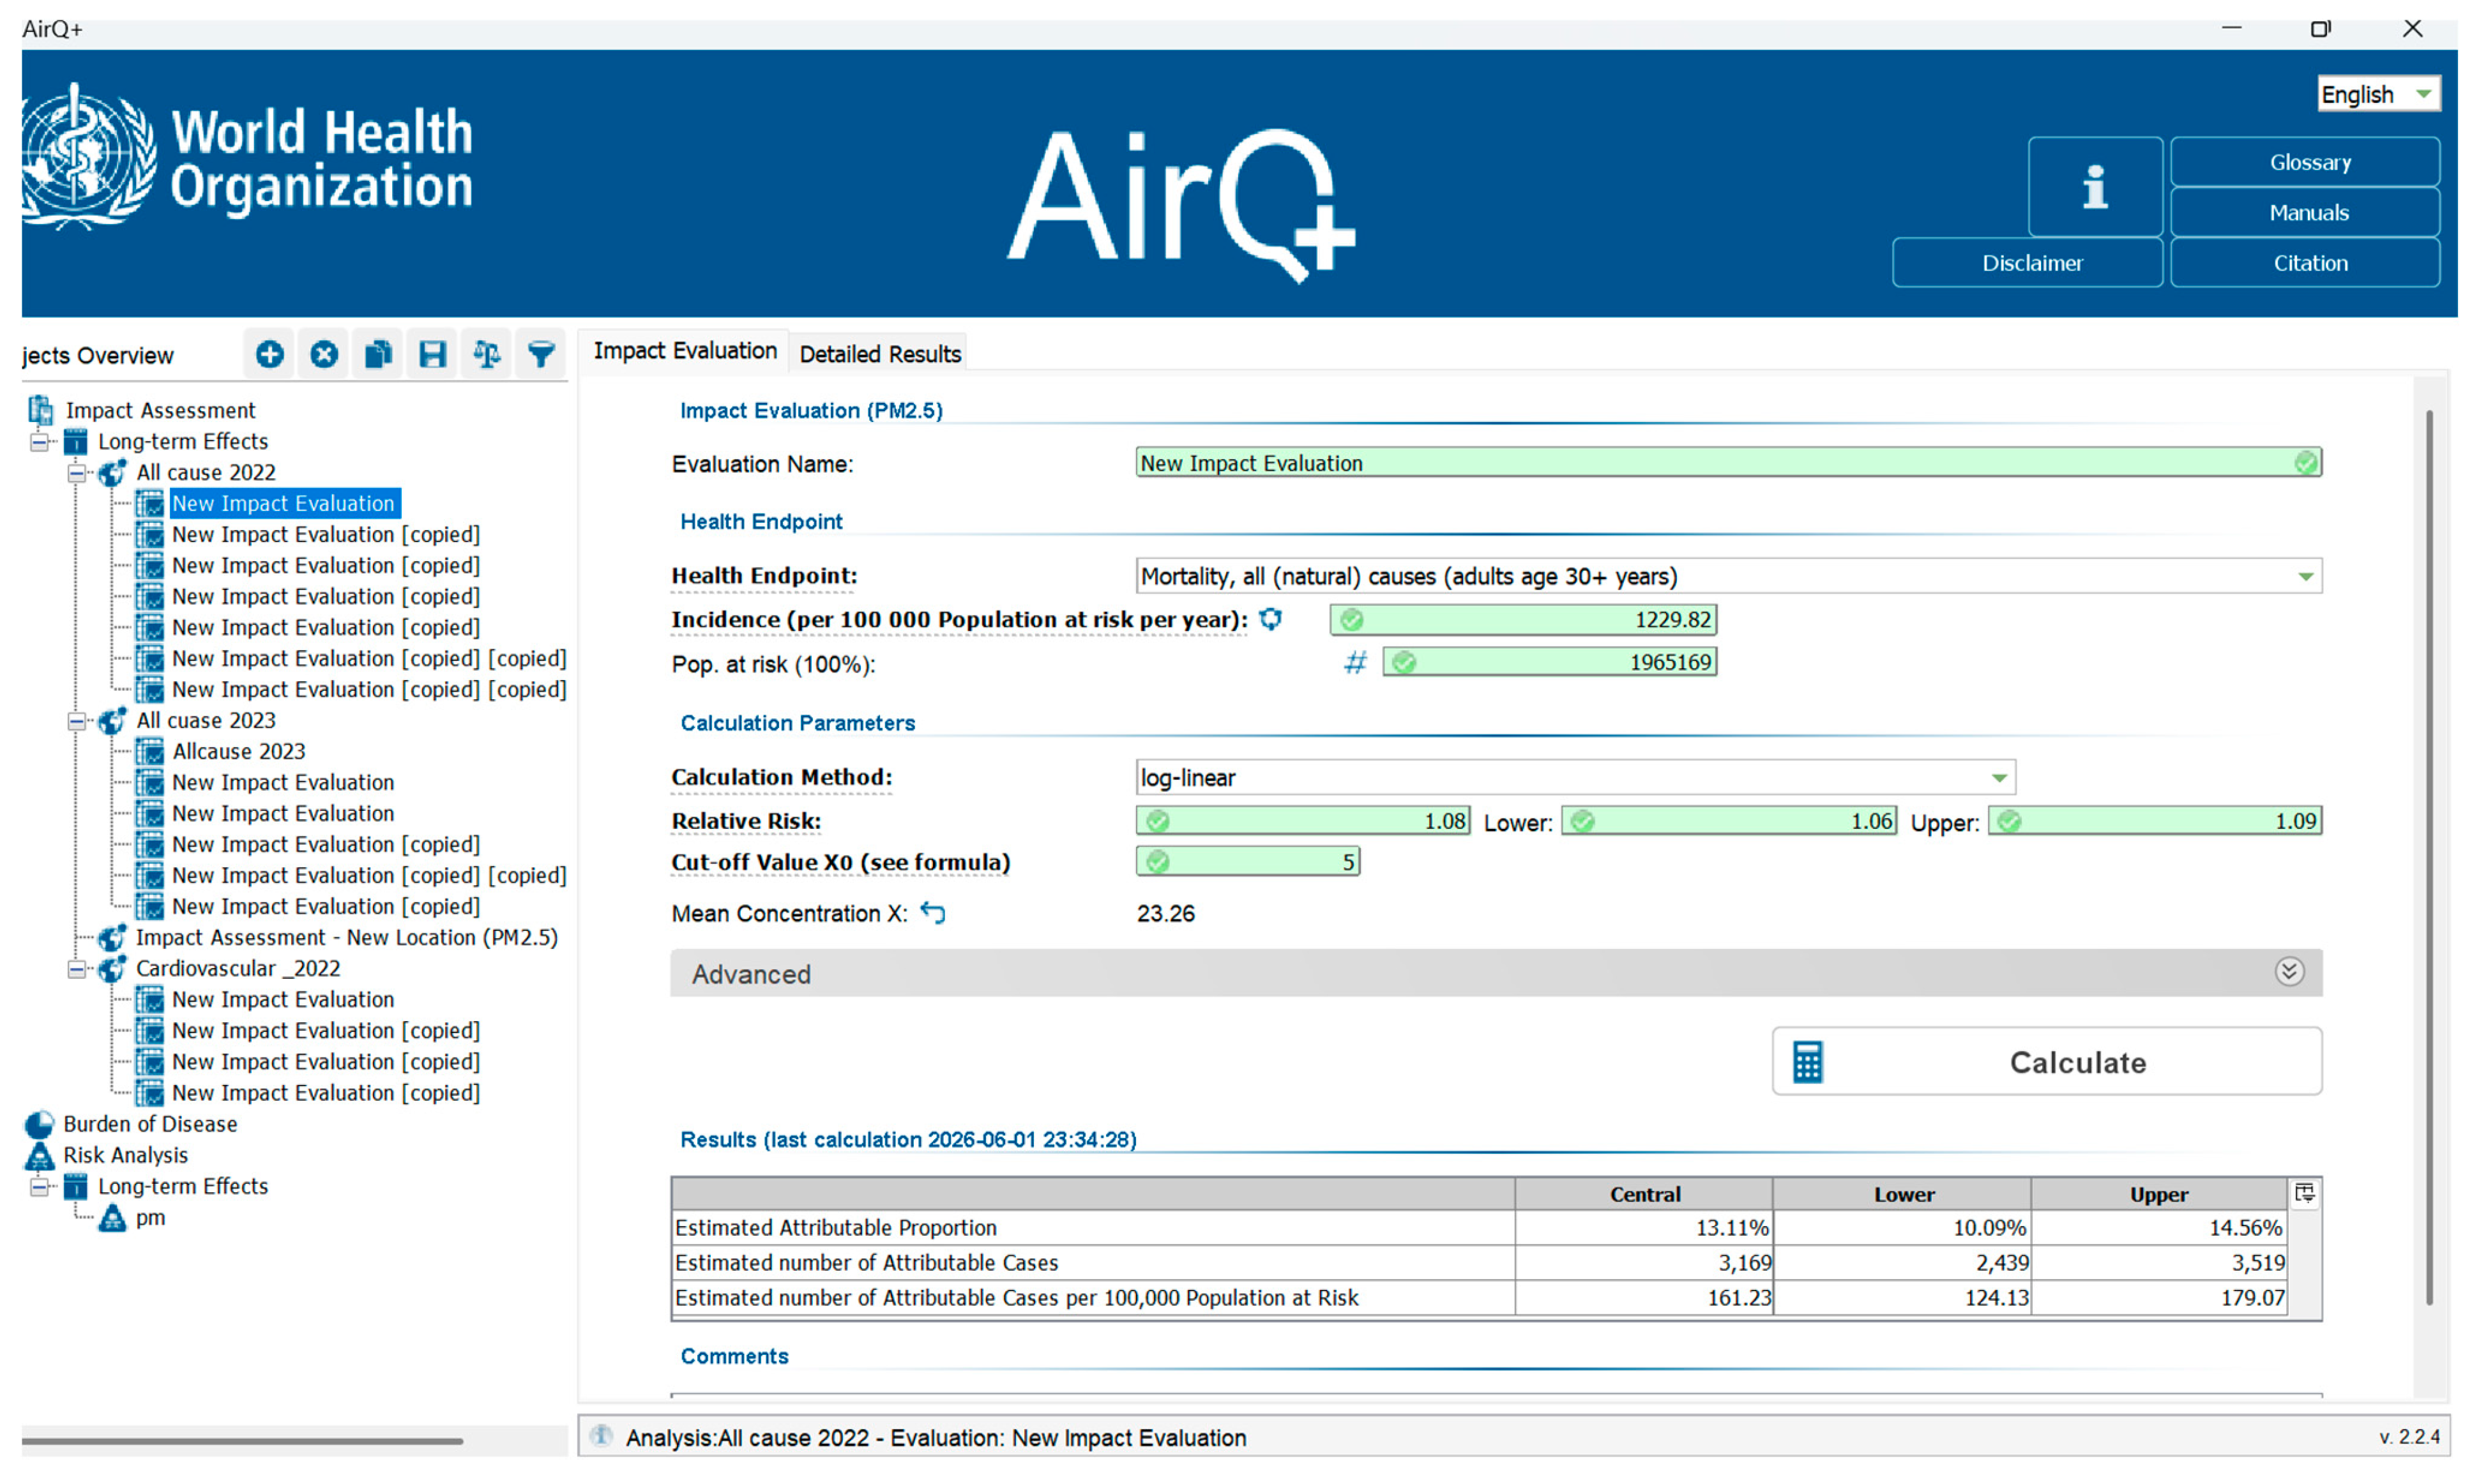
Figure A2.
Analysis properties window in AirQ+ software illustrating the configuration for estimating all-cause mortality attributable to long-term ambient PM2.5 exposure among adults aged 30+ years in Addis Ababa, Ethiopia (2022 data; counterfactual concentration: 10 µg/m3).
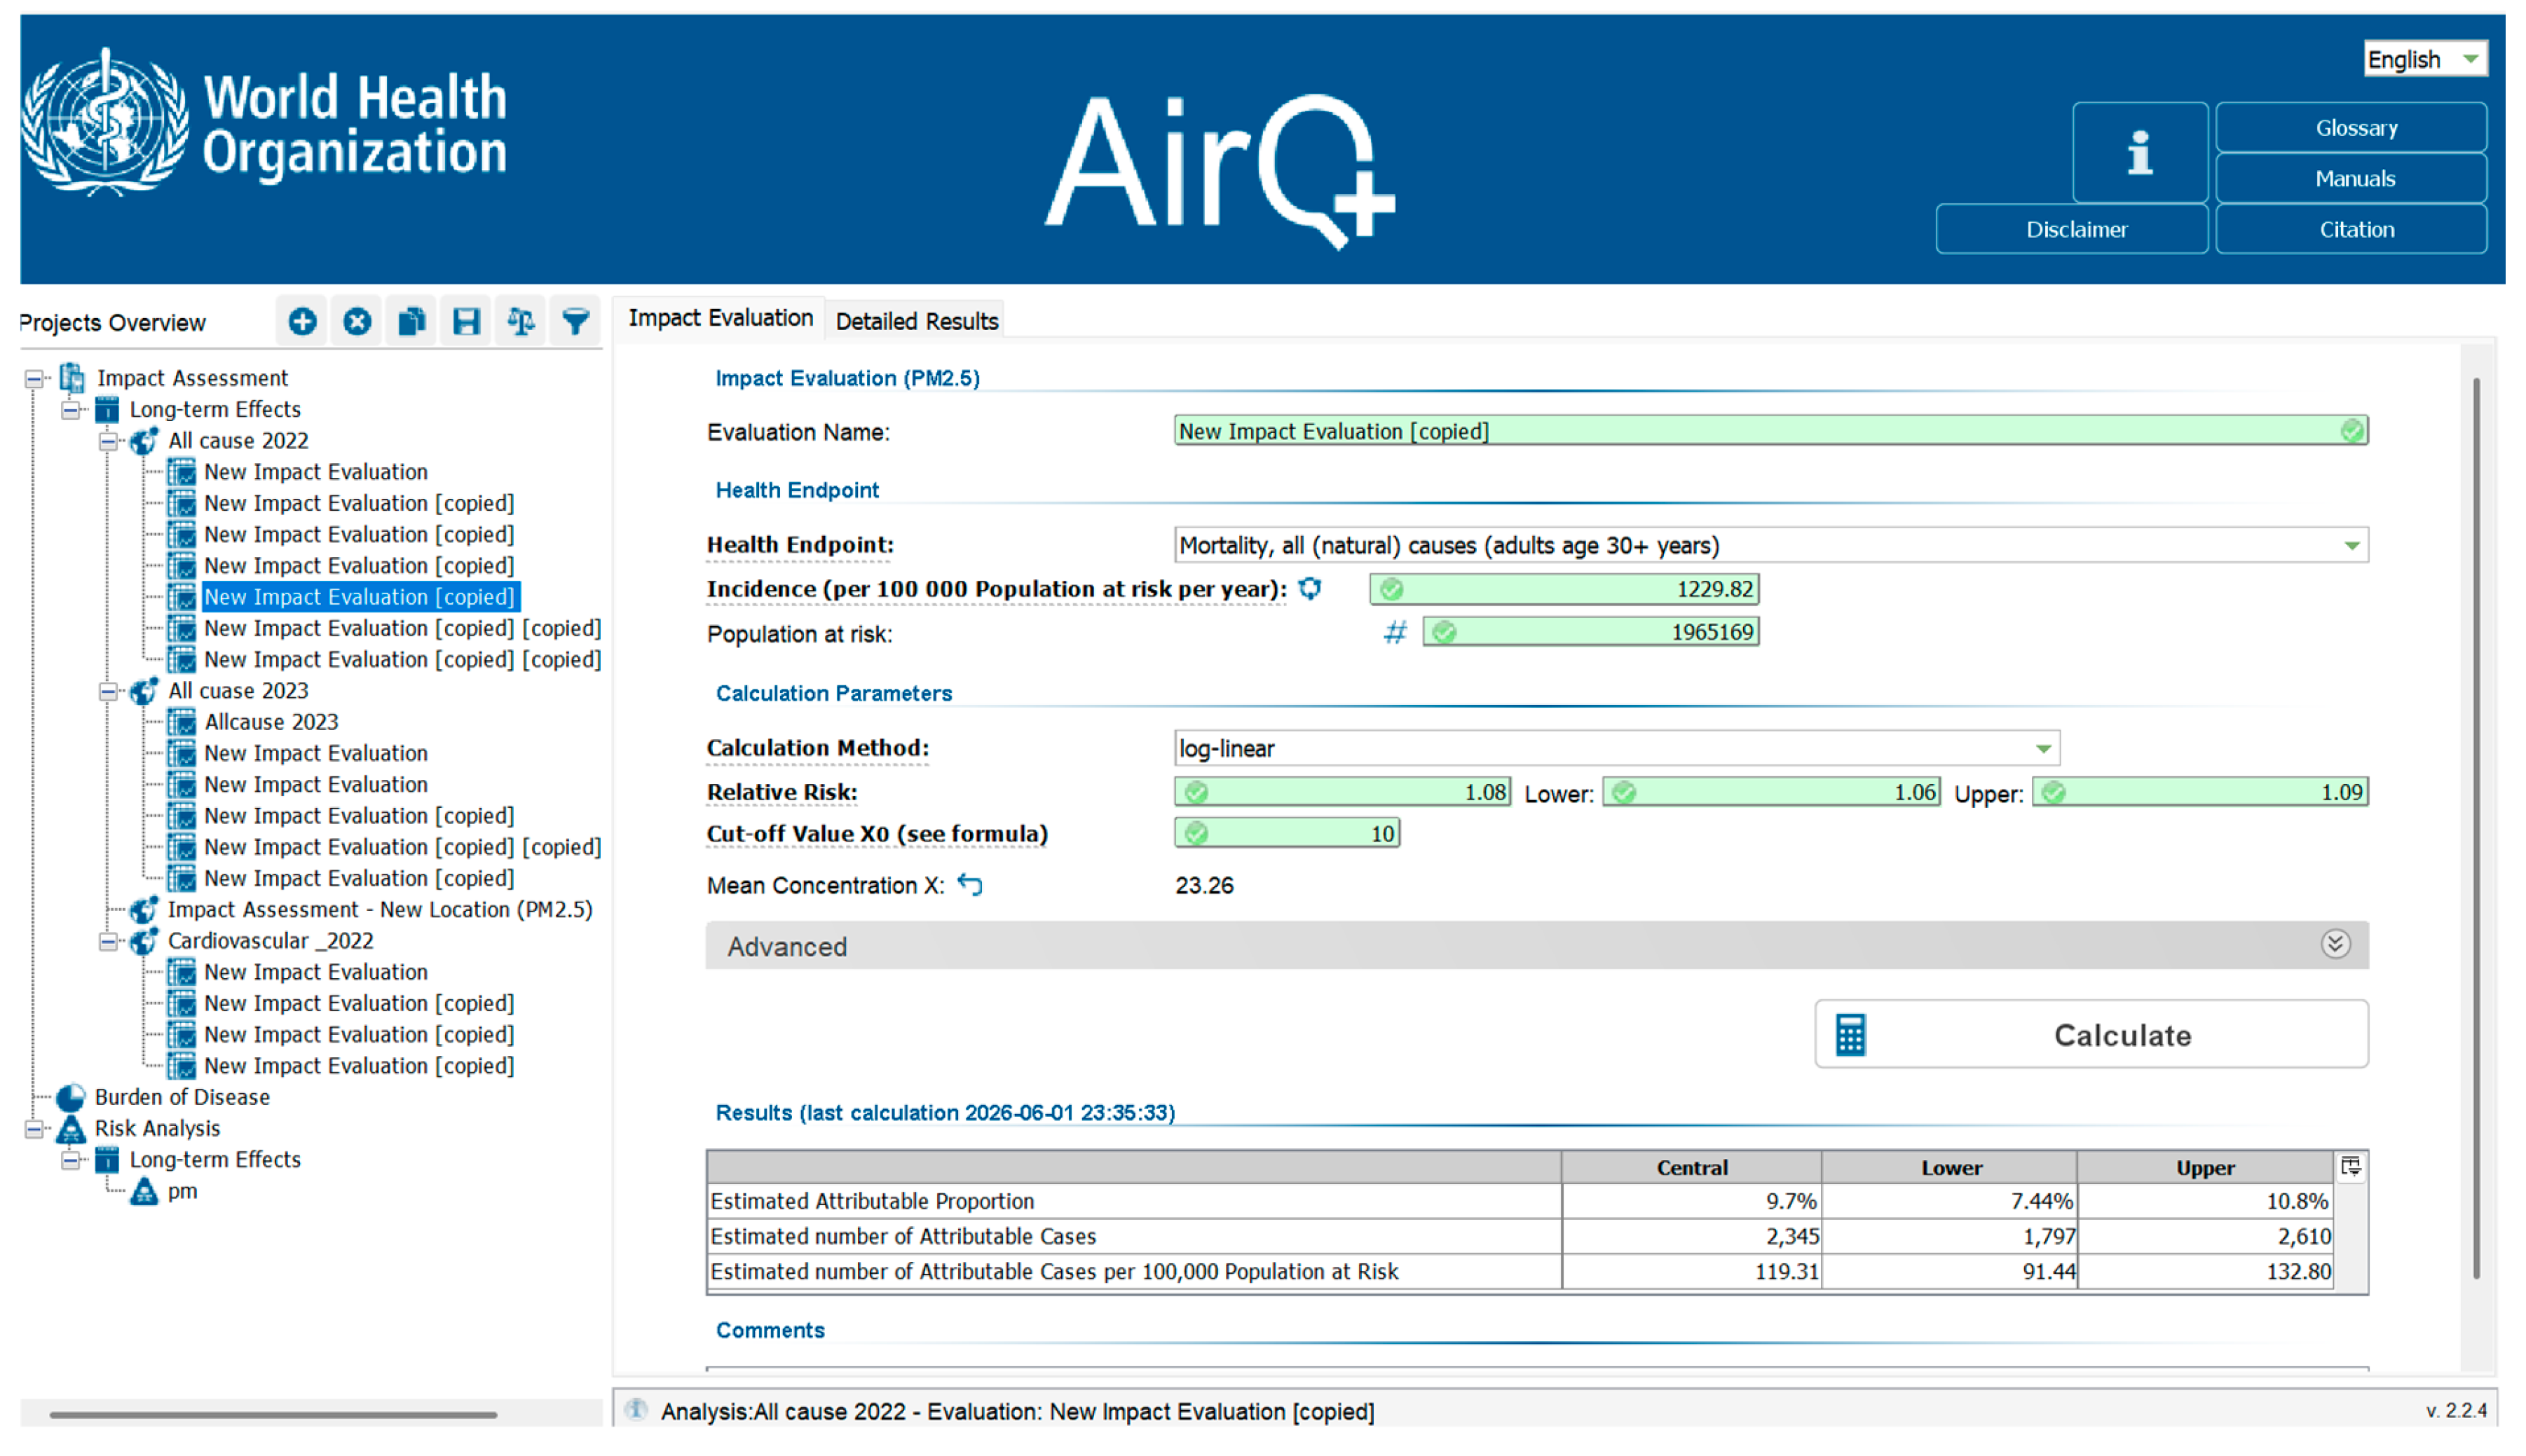
Figure A3.
Analysis properties window in AirQ+ software illustrating the configuration for estimating all-cause mortality attributable to long-term ambient PM2.5 exposure among adults aged 30+ years in Addis Ababa, Ethiopia (2022 data; counterfactual concentration: 15 µg/m3).
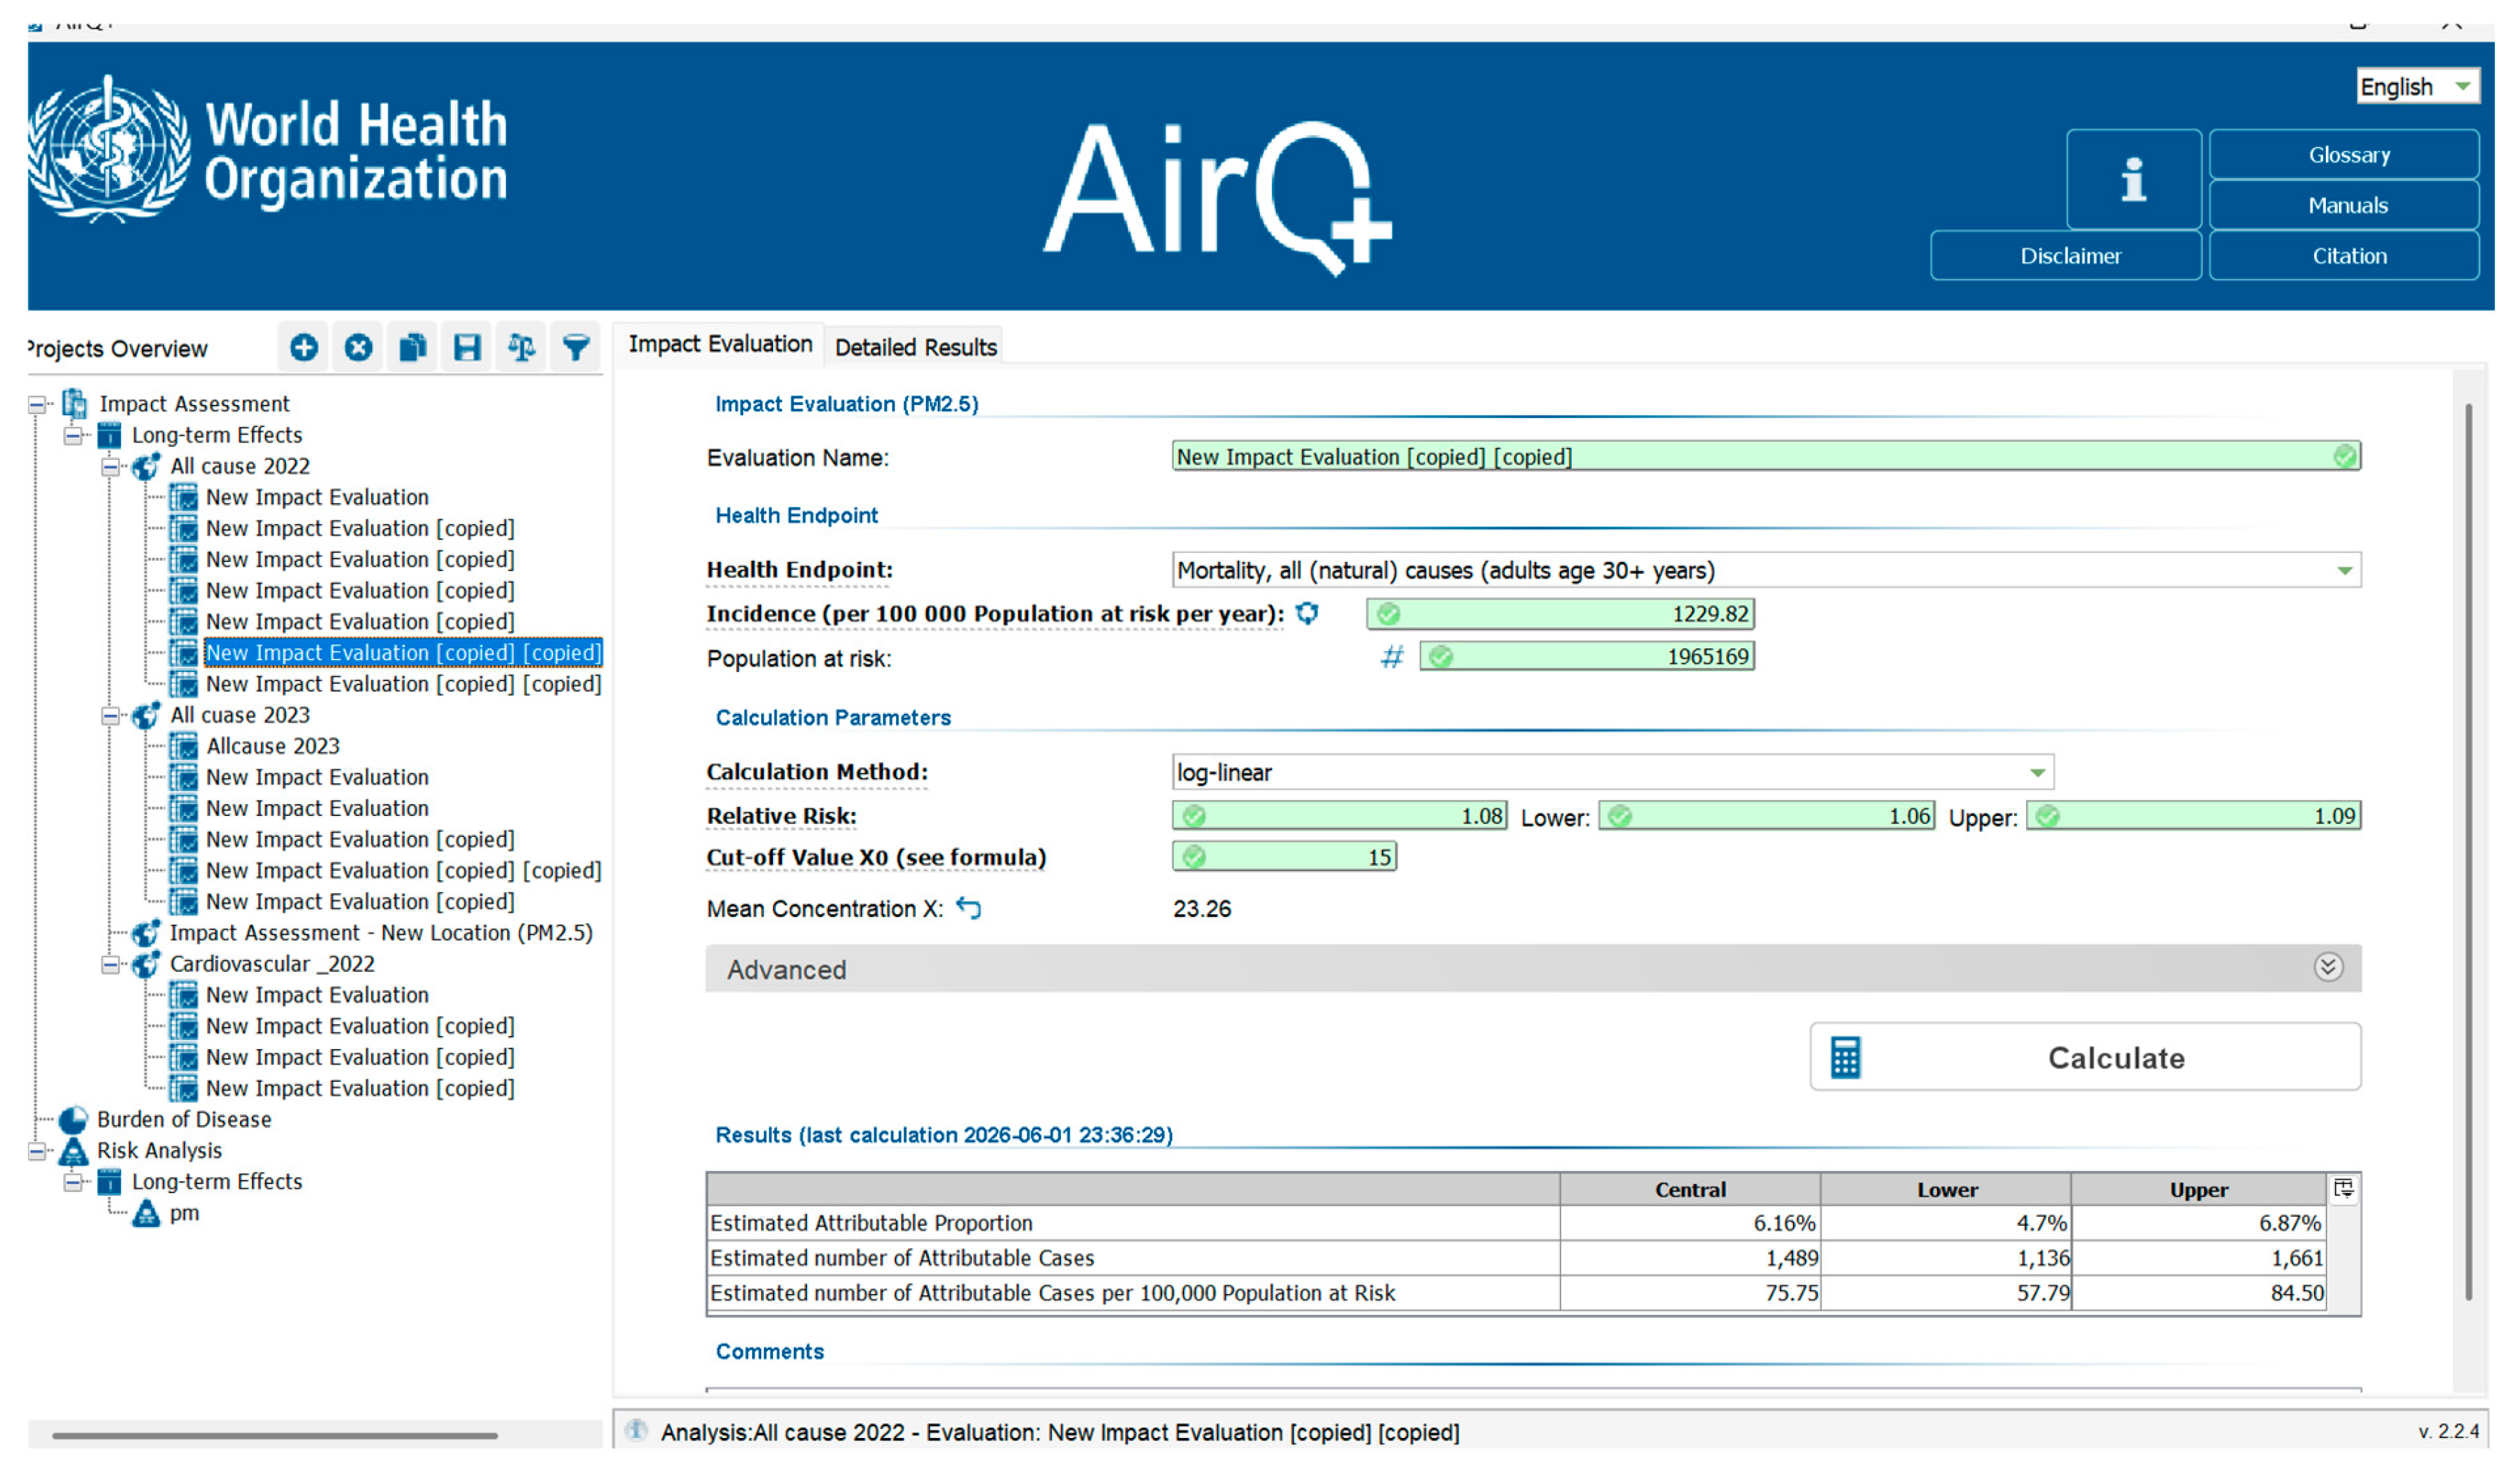
Figure A4.
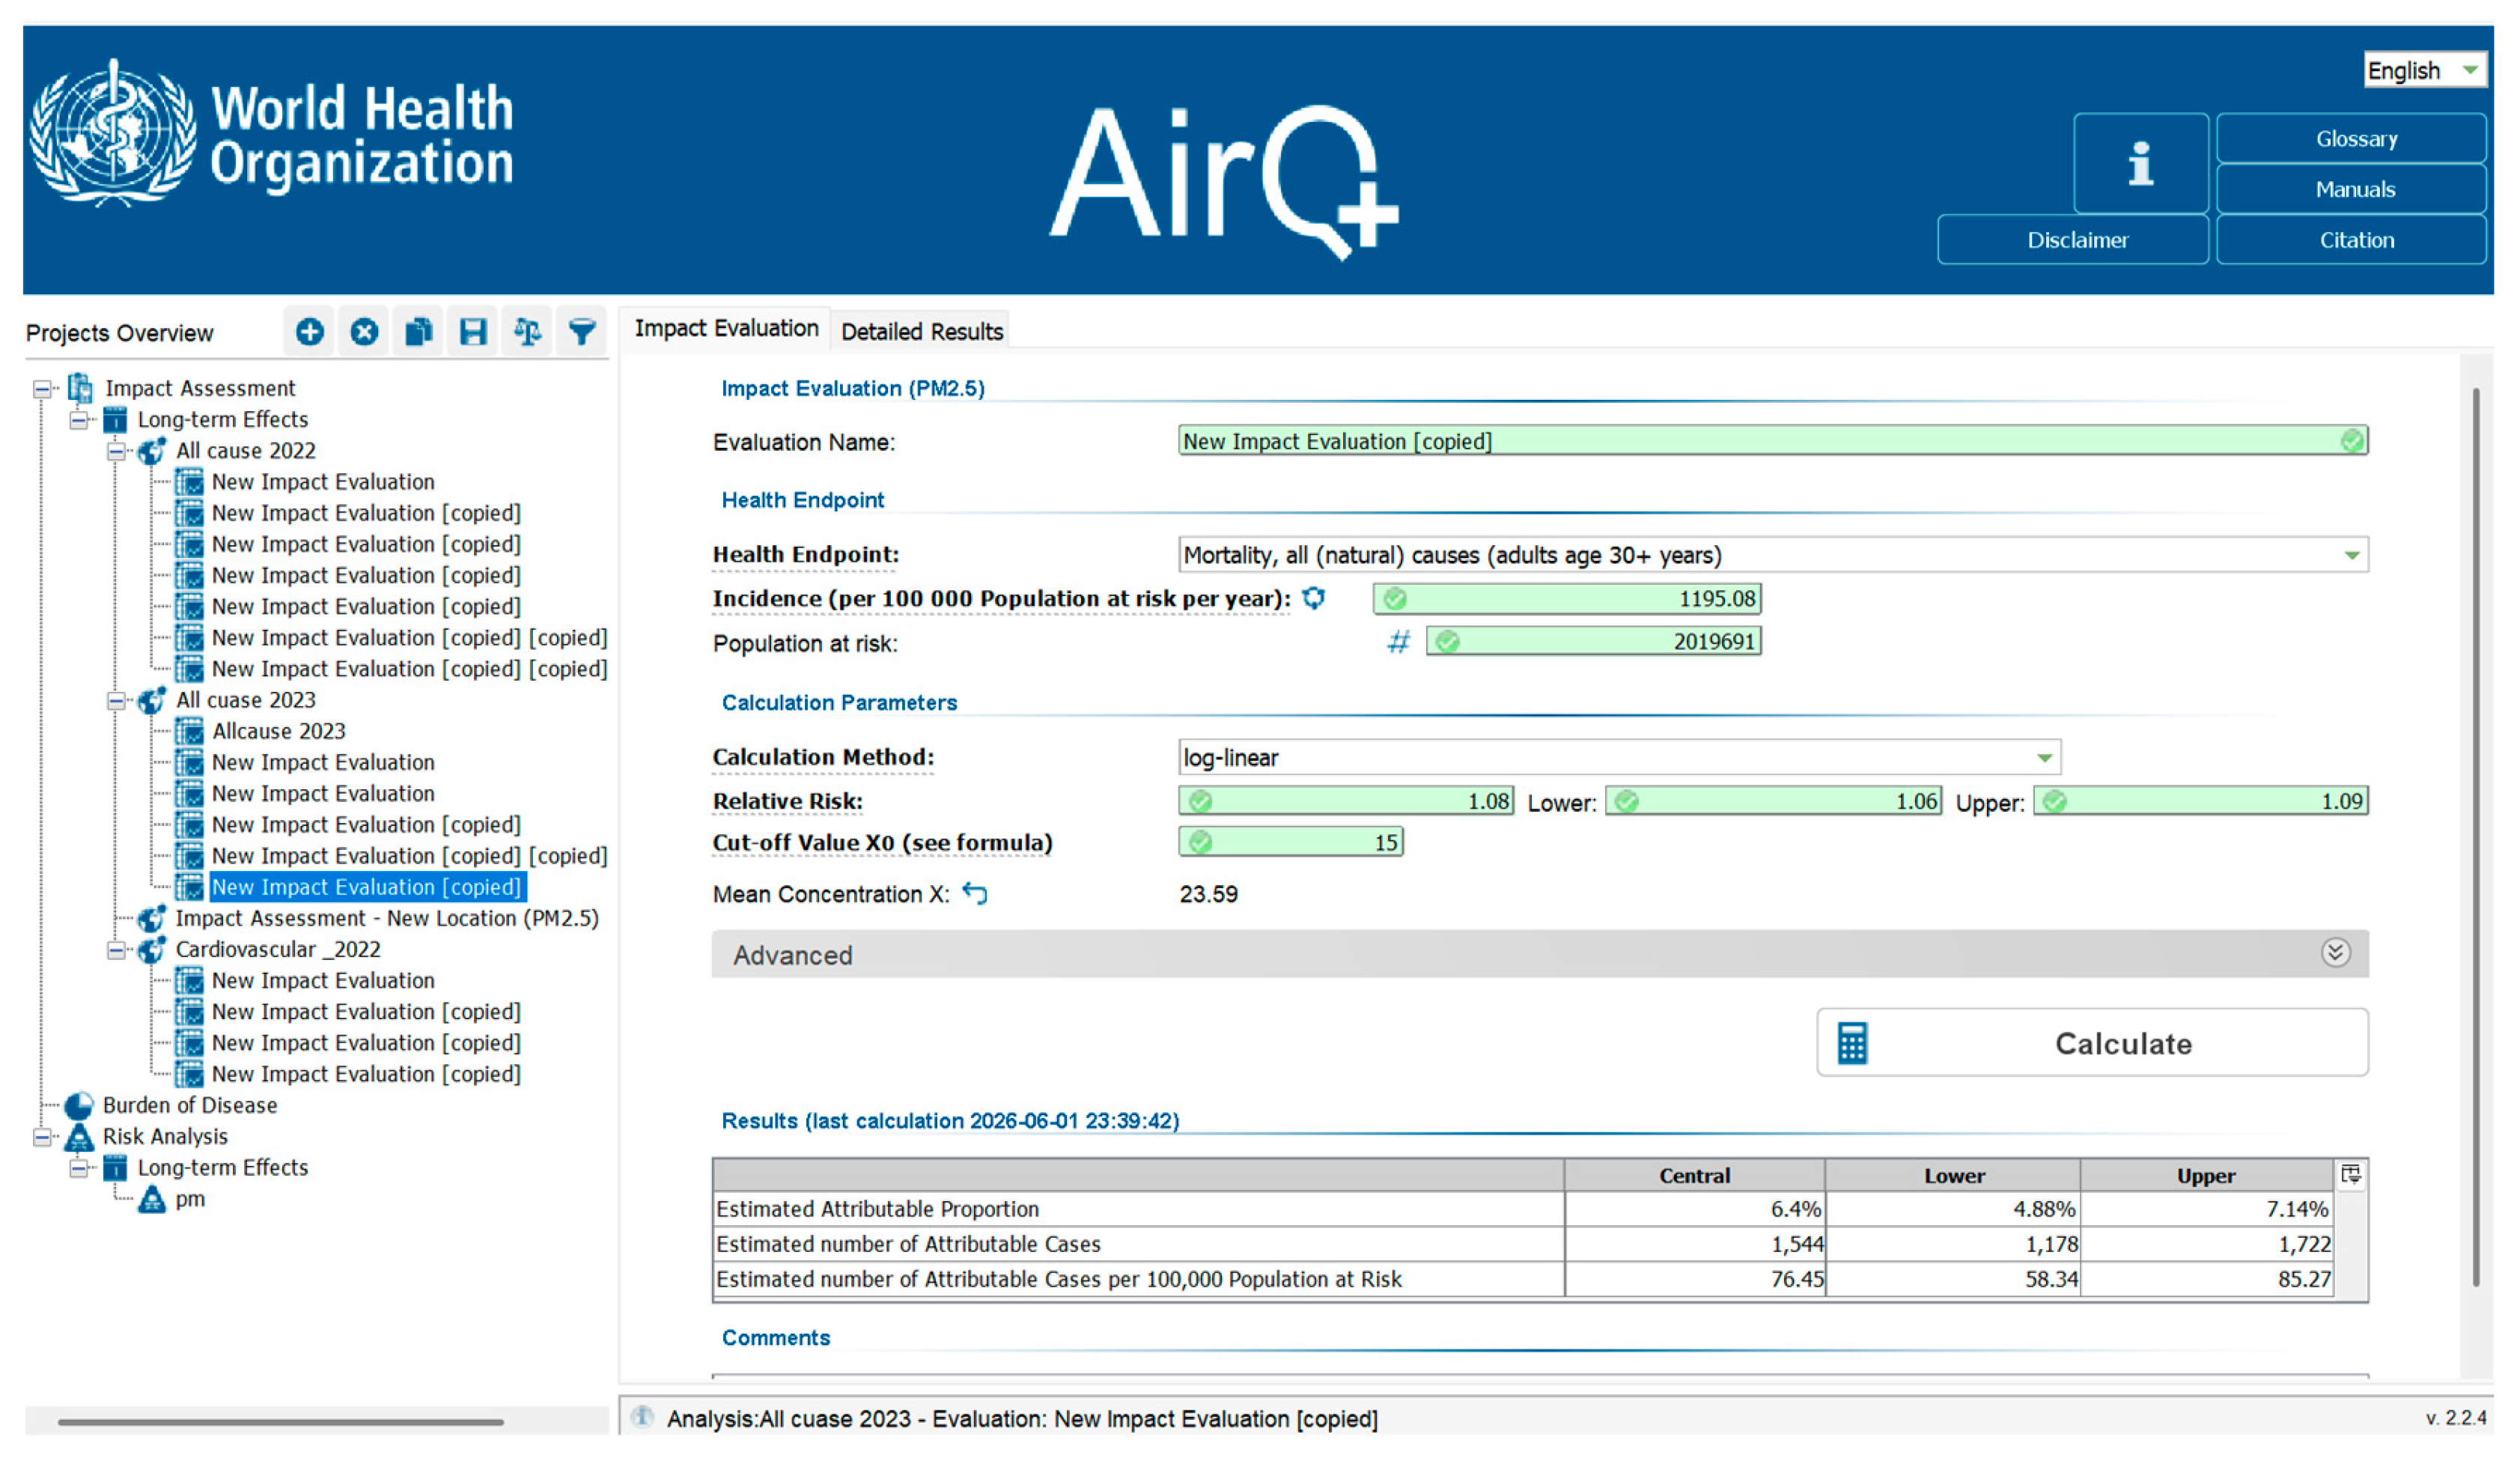
Analysis properties window in AirQ+ software illustrating the configuration for estimating all-cause mortality attributable to long-term ambient PM2.5 exposure among adults aged 30+ years in Addis Ababa, Ethiopia (2023 data; counterfactual concentration: 5 µg/m3).
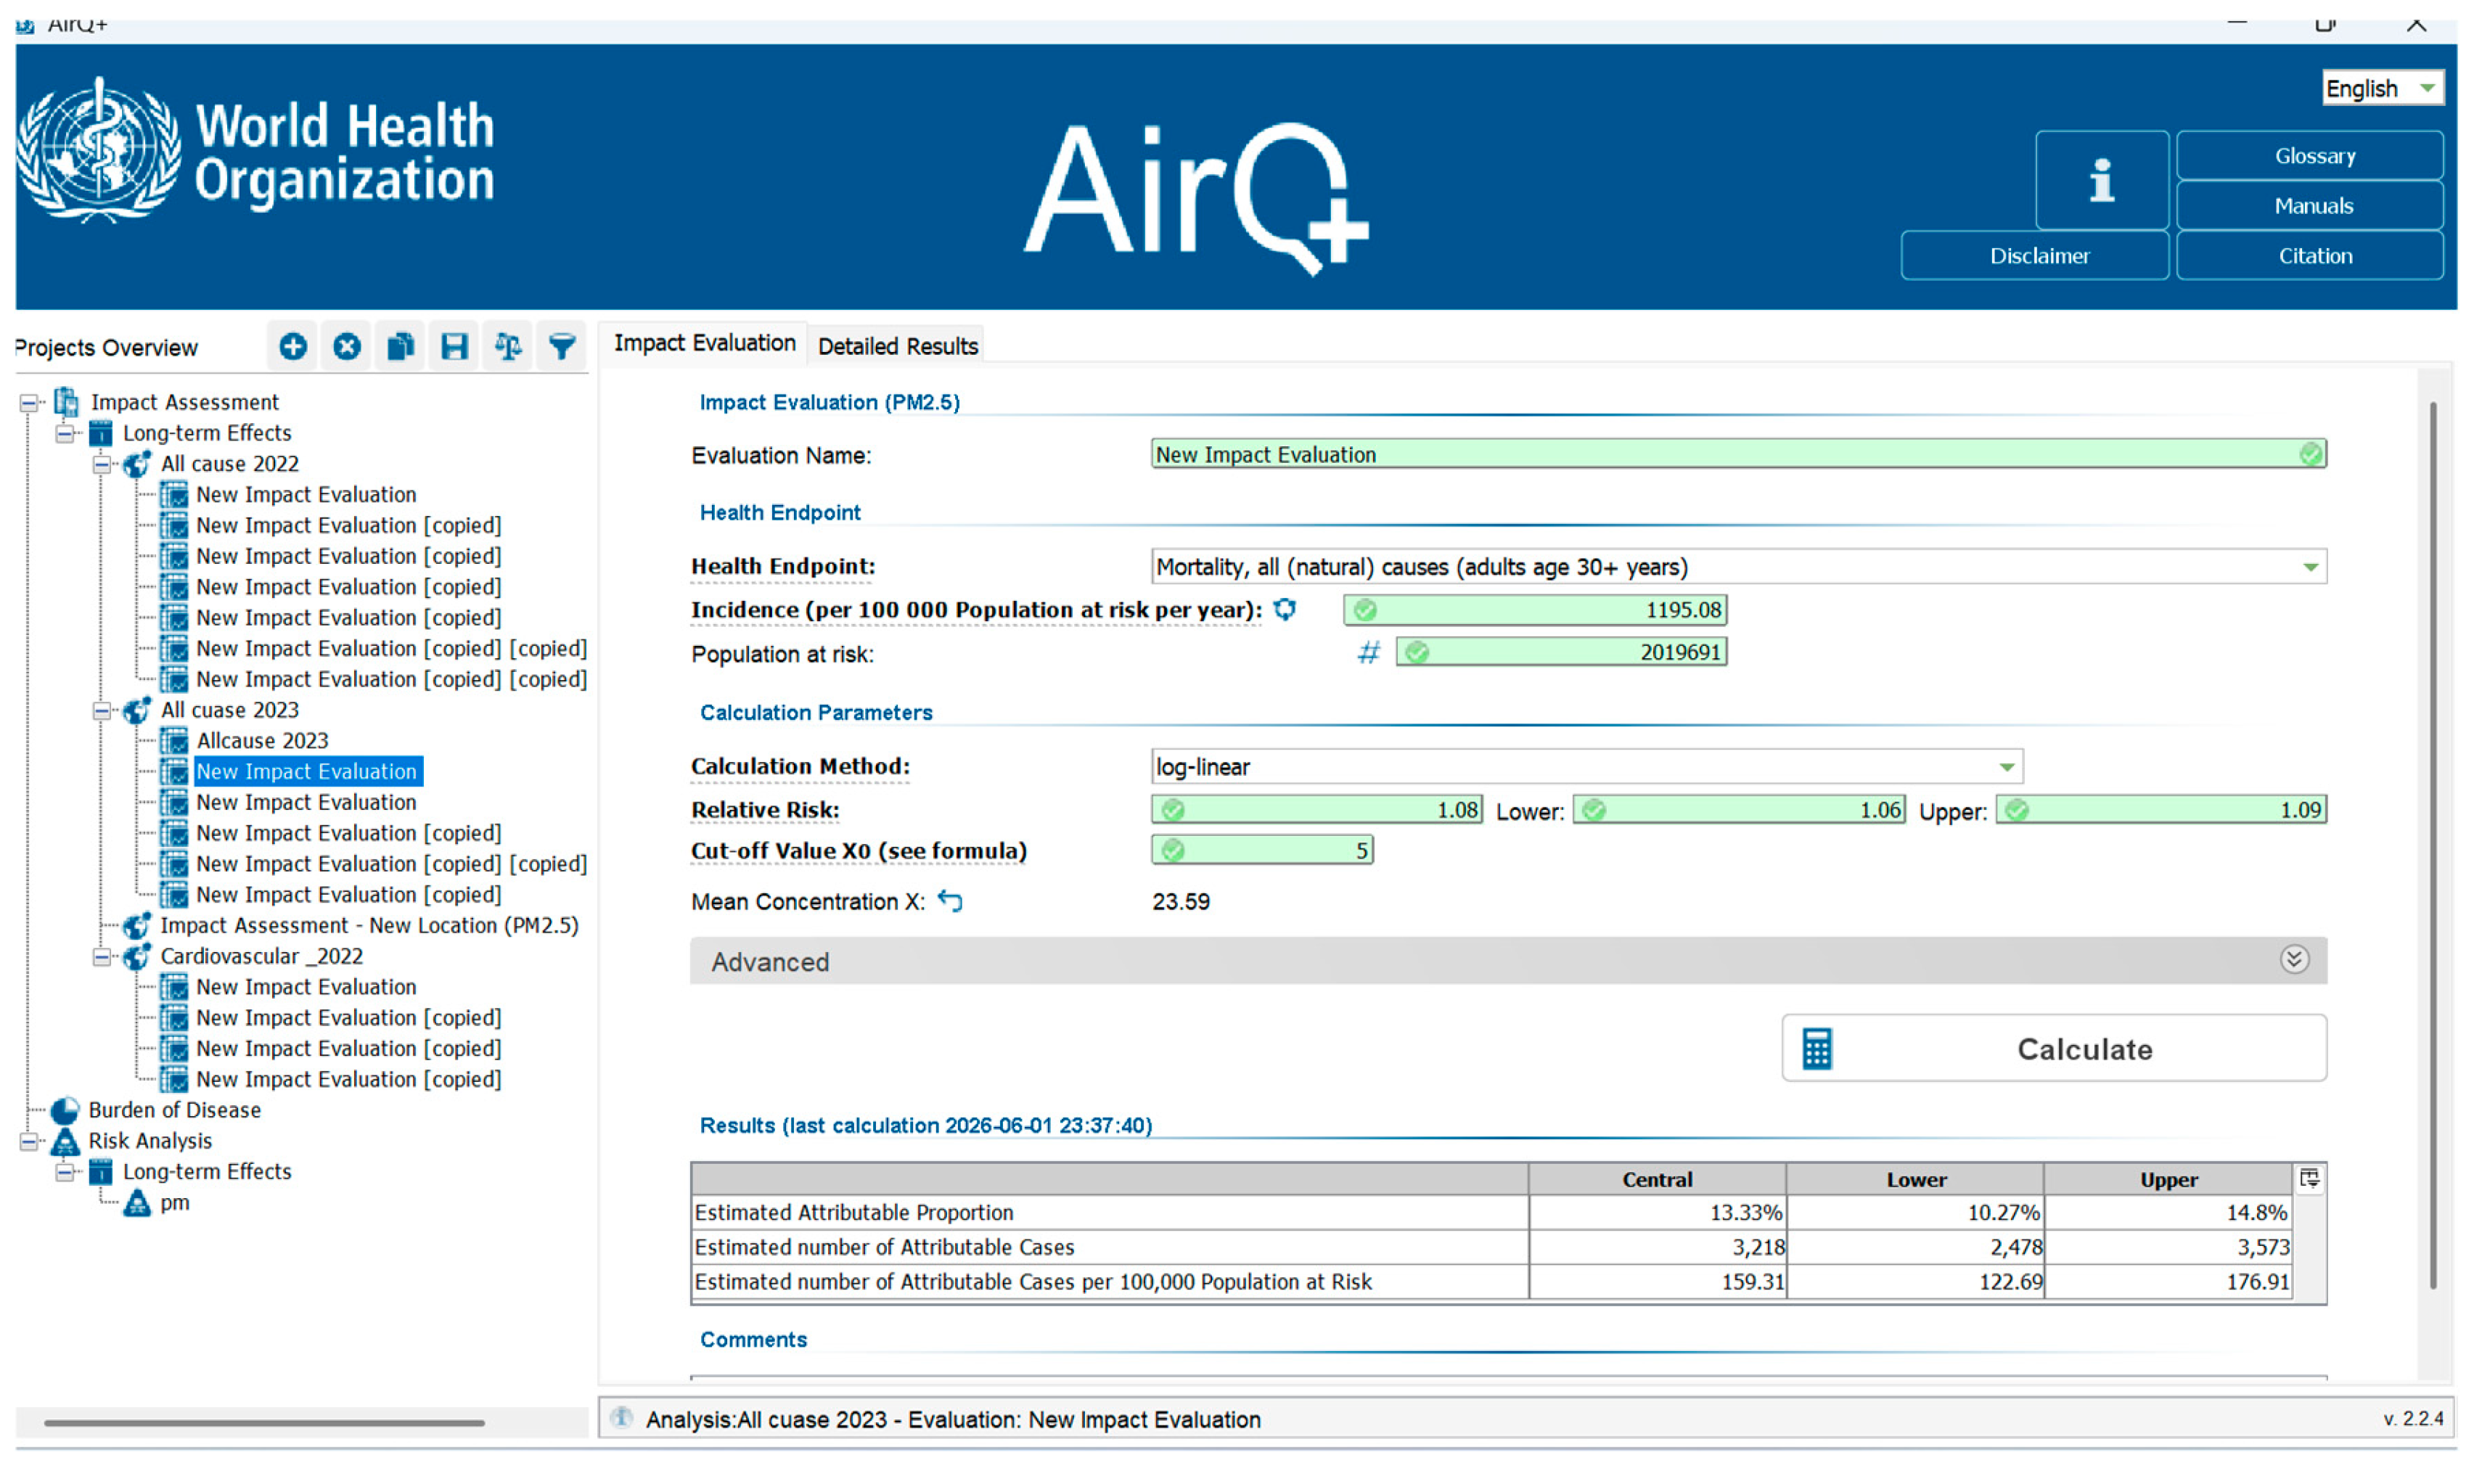
Figure A5.
Analysis properties window in AirQ+ software illustrating the configuration for estimating all-cause mortality attributable to long-term ambient PM2.5 exposure among adults aged 30+ years in Addis Ababa, Ethiopia (2023 data; counterfactual concentration: 10 µg/m3).
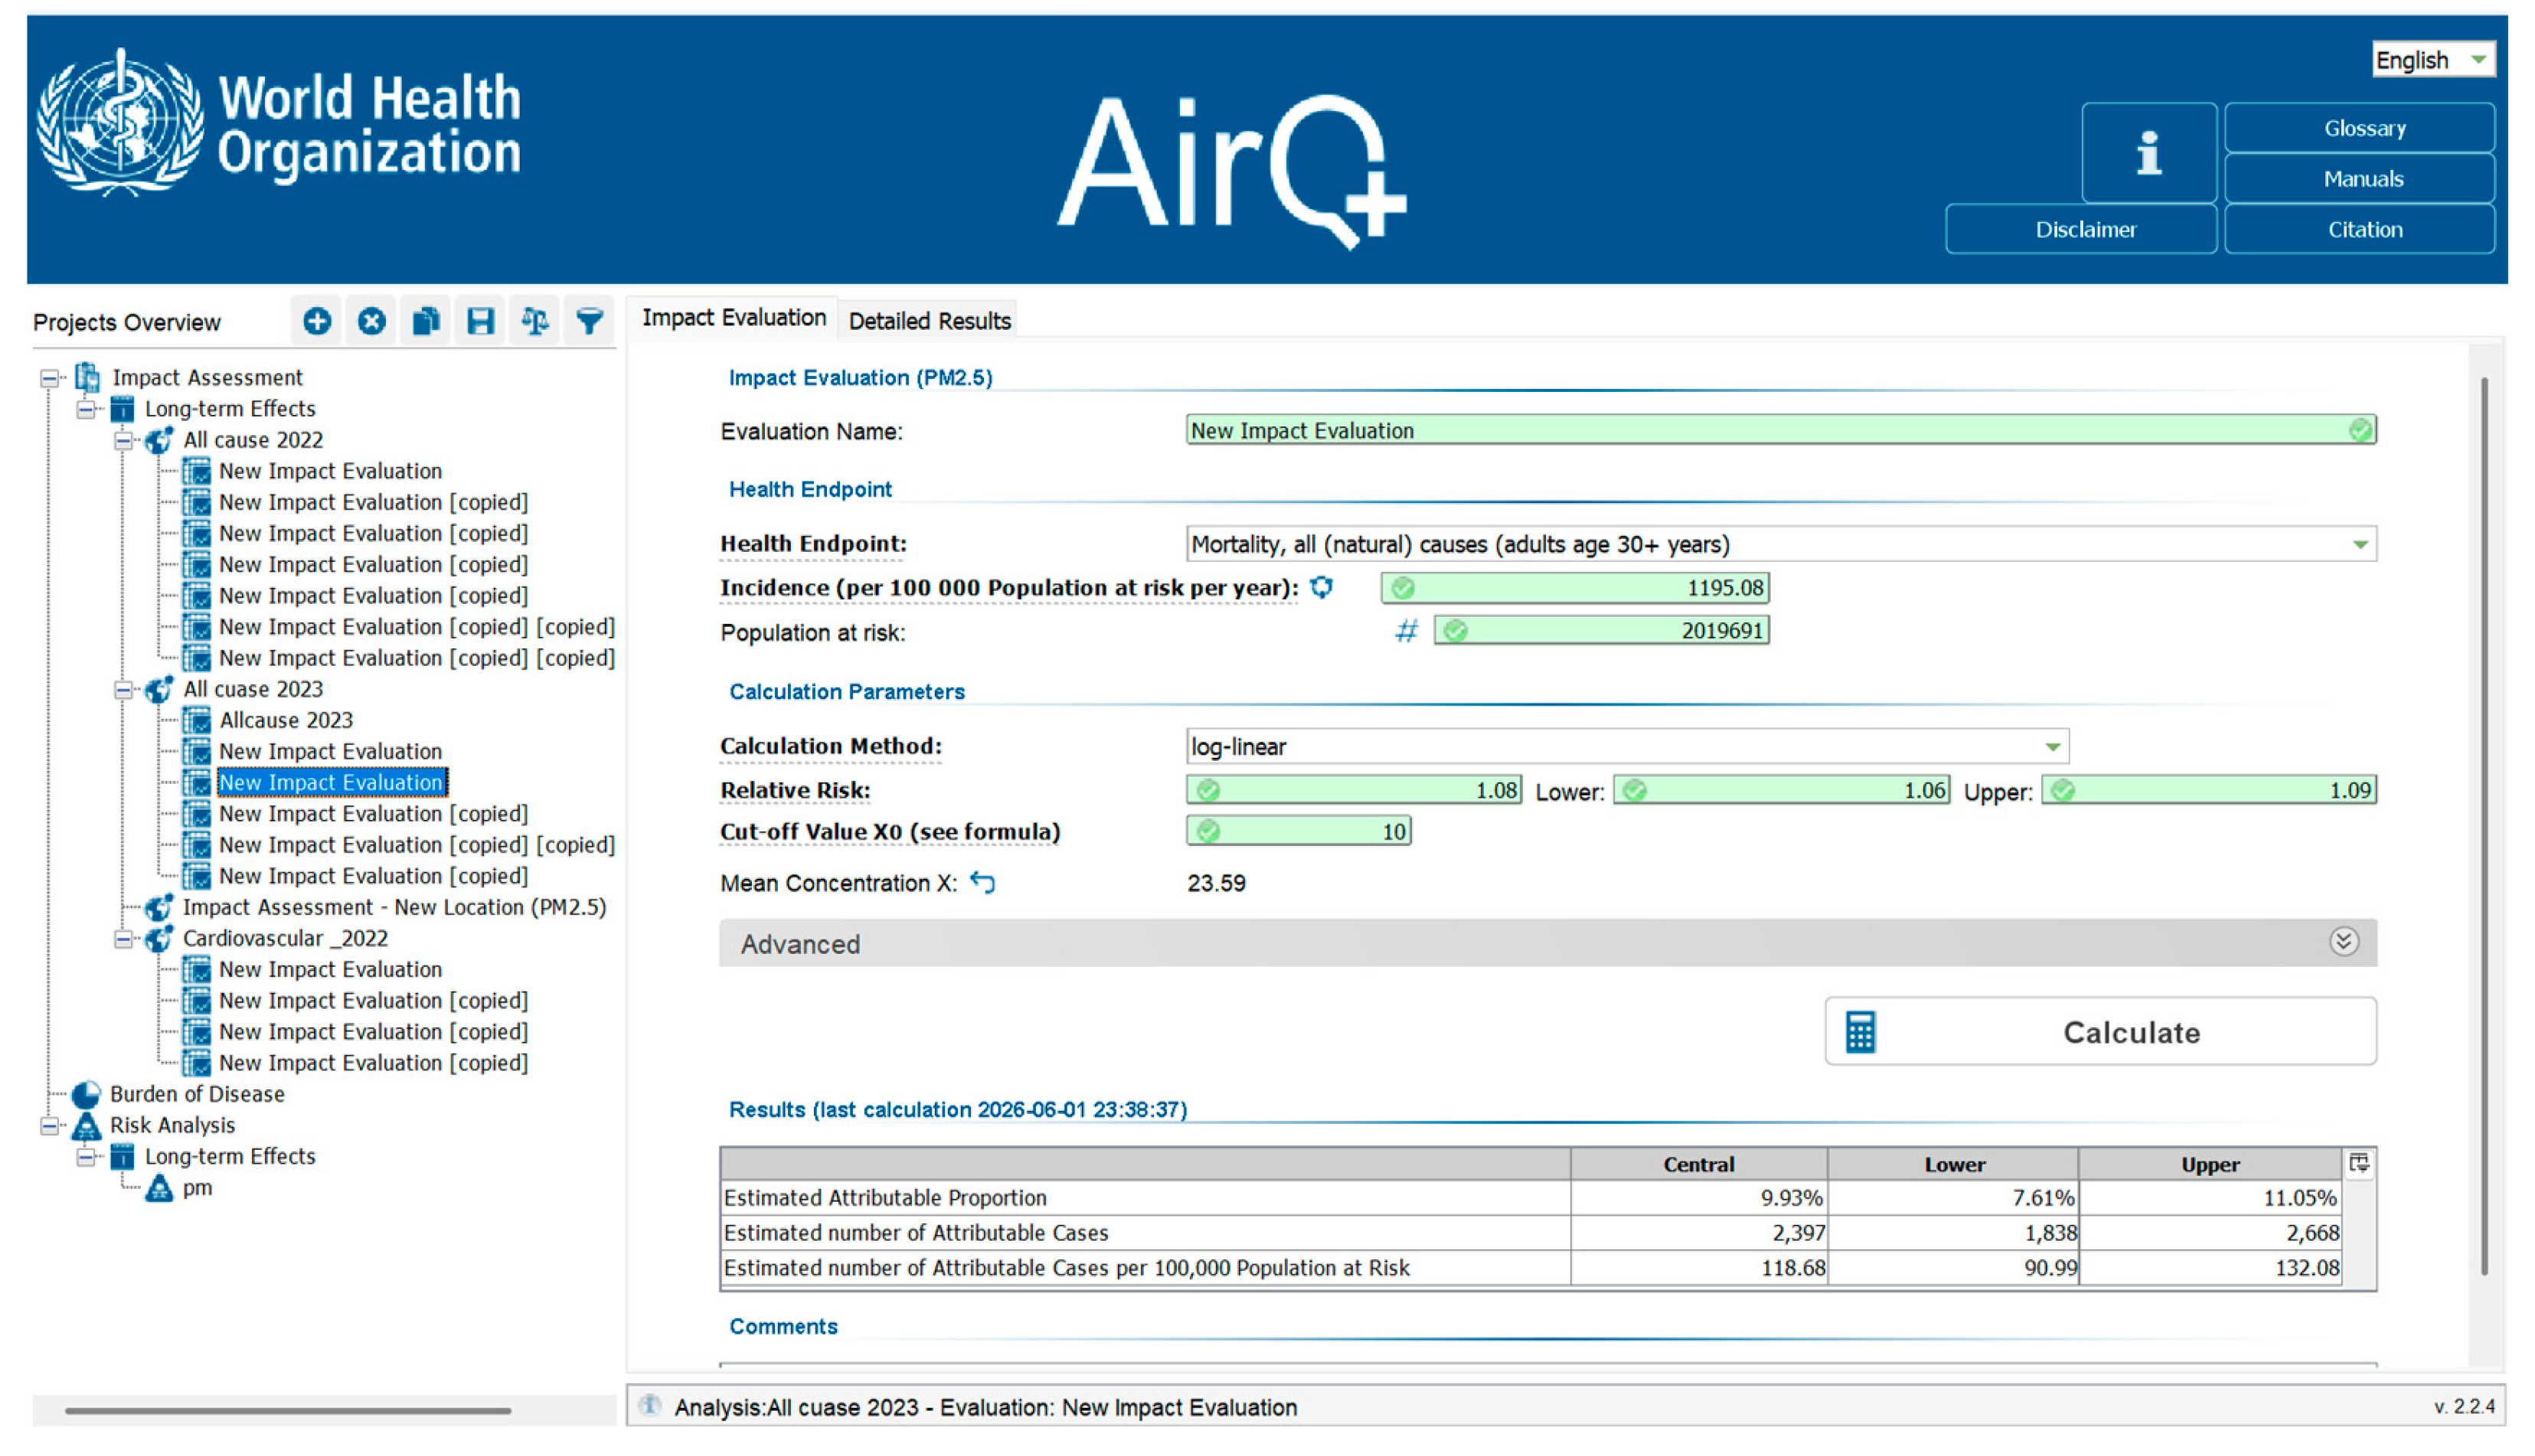
Figure A6.
Analysis properties window in AirQ+ software illustrating the configuration for estimating all-cause mortality attributable to long-term ambient PM2.5 exposure among adults aged 30+ years in Addis Ababa, Ethiopia (2023 data; counterfactual concentration: 15 µg/m3).
References
- HEI. State of Global Air 2025; Health Effects Institute: Boston, MA, USA, 2025. [Google Scholar]
- HEI. State of Global Air, 2024; Special Report; Health Effects Institute: Boston, MA, USA, 2024. [Google Scholar]
- HEI. Health Effects of Air Pollution in East Africa Current Evidence and Priorities for Future Action; Health Effects Institute: Boston, MA, USA, 2025. [Google Scholar]
- Fisher, S.; Bellinger, D.C.; Cropper, M.L.; Kumar, P.; Binagwaho, A.; Koudenoukpo, J.B.; Park, Y.; Taghian, G.; Landrigan, P.J. Air pollution and development in Africa: Impacts on health, the economy and human capital. Lancet Planet Health 2021, 5, E681–E688. [Google Scholar] [CrossRef] [PubMed]
- Bililign, S.; Brown, S.S.; Westervelt, D.M.; Kumar, R.; Tang, W.; Flocke, F.; Vizuete, W.; Ture, K.; Pope, F.D.; Demoz, B.; et al. East African Megacity Air Quality: Rationale and Framework for a Measurement and Modeling Program. Bull. Am. Meteorol. Soc. 2024, 105, E1584–E1602. [Google Scholar] [CrossRef]
- Pérez Velasco, R.; Jarosińska, D. Update of the WHO global air quality guidelines: Systematic reviews—An introduction. Environ. Int. 2022, 170, 107556. [Google Scholar] [PubMed]
- Orellano, P.; Kasdagli, M.I.; Pérez Velasco, R.; Samoli, E. Long-Term Exposure to Particulate Matter and Mortality: An Update of the WHO Global Air Quality Guidelines Systematic Review and Meta-Analysis. Int. J. Public Health 2024, 69, 1607683. [Google Scholar] [CrossRef] [PubMed]
- Chen, J.; Hoek, G. Long-term exposure to PM and all-cause and cause-specific mortality: A systematic review and meta-analysis. Environ. Int. 2020, 143, 105974. [Google Scholar] [CrossRef] [PubMed]
- Oh, J.; Hevia-Ramos, G.; Ha, E.; Hong, Y.C.; Kim, H.; Lim, Y.H. A Systematic Review and Meta-Analysis on Long-Term Exposure to Particulate Matter and All-Cause and Cause-Specific Mortality in the Asia-Pacific States. J. Korean Med. Sci. 2025, 40, e156. [Google Scholar] [PubMed]
- Forastiere, F.; Orru, H.; Krzyzanowski, M.; Spadaro, J.V. The last decade of air pollution epidemiology and the challenges of quantitative risk assessment. Environ. Health 2024, 23, 98. [Google Scholar] [CrossRef] [PubMed]
- Horne, B.D.; Johnson, M.M.; Blagev, D.P.; Haddad, F.; Knowlton, K.U.; Bride, D.; Bair, T.L.; Joy, E.A.; Nadeau, K.C. Association of Short-Term Increases in Ambient Fine Particulate Matter With Hospitalization for Asthma or COPD During Wildfire Season and Other Time Periods. Chest Pulm. 2024, 2, 100053. [Google Scholar] [CrossRef] [PubMed]
- WHO. WHO Global Air Quality Guidelines. Particulate Matter (PM2.5 and PM10), Ozone, Nitrogen Dioxide, Sulfur Dioxide and Carbon Monoxide; World Health Organization: Geneva, Switzerland, 2021. [Google Scholar]
- Ngutuka Kinzunga, M.; Westervelt, D.M.; Matondo Masisa, D.; Bangelesa, F.; Kasereka Isevulambire, P.; Tangou Tabou, T.; Kabengele Obel, B.; Kiyombo Mbela, G.; Kayembe Ntumba, J.M. Assessment of Respiratory Health Impacts of PM2.5 by AirQ+ Software in a Sub-Saharan African Urban Setting. Atmosphere 2024, 15, 1518. [Google Scholar] [CrossRef]
- Fouladi-Fard, R.; Bayat, M.; Karami, M.; Rahimi, N.R.; Azimi, F.; Kamarahie, B. Long-term trends, health impacts, and economic costs of PM2.5; in Khorramabad, Iran (2014–2023). BMC Public Health 2026, 26, 445. [Google Scholar] [CrossRef] [PubMed]
- Amini, H.; Yousefian, F.; Faridi, S.; Andersen, Z.J.; Calas, E.; Castro, A.; Cervantes-Martínez, K.; Cole-Hunter, T.; Corso, M.; Dragic, N.; et al. Two Decades of Air Pollution Health Risk Assessment: Insights From the Use of WHO’s AirQ and AirQ+ Tools. Public. Health Rev. 2024, 45, 1606969. [Google Scholar] [CrossRef] [PubMed]
- Johnson, M.A.; Abuya, T.; Wickramanayake, A.; Miller, H.; Sambu, D.; Mwanga, D.; Odwe, G.; Ndwiga, C.; Piedrahita, R.; Rossanese, M.; et al. Patterns and drivers of maternal personal exposure to PM2.5 in informal settlements in Nairobi, Kenya. Environ. Sci. Atmos. 2024, 4, 578–591. [Google Scholar] [CrossRef]
- Nimo, J.; Borketey, M.A.; Appoh, E.K.E.; Morrison, A.K.; Ibrahim-Anyass, Y.; Owusu Tawiah, A.; Arku, R.E.; Amoah, S.; Tetteh, E.N.; Brown, T.; et al. Low-Cost PM2.5 Sensor Performance Characteristics against Meteorological Influence in Sub-Saharan Africa: Evidence from the Air Sensor Evaluation and Training Facility for the West Africa Project. Environ. Sci. Technol. 2025, 59, 6623–6635. [Google Scholar] [CrossRef] [PubMed]
- Glenn, B.E.; Espira, L.M.; Larson, M.C.; Larson, P.S. Ambient air pollution and non-communicable respiratory illness in sub-Saharan Africa: A systematic review of the literature. Environ. Health 2022, 21, 40. [Google Scholar] [CrossRef] [PubMed]
- Giordano, M.R.; Malings, C.; Pandis, S.N.; Presto, A.A.; McNeill, V.F.; Westervelt, D.M.; Beekmann, M.; Subramanian, R. From low-cost sensors to high-quality data: A summary of challenges and best practices for effectively calibrating low-cost particulate matter mass sensors. J. Aerosol Sci. 2021, 158, 105833. [Google Scholar] [CrossRef]
- Gómez, R.; Rodríguez, J.; Ferro, R. Calibration of Low-Cost Sensors for PM(10) and PM(2.5) Based on Artificial Intelligence for Smart Cities. Sensors 2026, 26, 796. [Google Scholar] [PubMed]
- Raheja, G.; Nimo, J.; Appoh, E.K.E.; Essien, B.; Sunu, M.; Nyante, J.; Amegah, M.; Quansah, R.; Arku, R.E.; Penn, S.L.; et al. Low-Cost Sensor Performance Intercomparison, Correction Factor Development, and 2+ Years of Ambient PM2.5 Monitoring in Accra, Ghana. Environ. Sci. Technol. 2023, 57, 10708–10720. [Google Scholar] [CrossRef] [PubMed]
- Barkjohn, K.K.; Gantt, B.; Clements, A.L. Development and application of a United States-wide correction for PM2.5 data collected with the PurpleAir sensor. Atmos. Meas. Tech. 2021, 14, 4617–4637. [Google Scholar] [CrossRef] [PubMed]
- Ko, K.; Cho, S.; Rao, R.R. Evaluation of calibration performance of a low-cost particulate matter sensor using collocated and distant NO2. Atmos. Meas. Tech. 2024, 17, 3303–3322. [Google Scholar] [CrossRef]
- Dingemanse, J.D.; Kimo, I.G.; Ibrahim, A.H.; Demeke, Y.G.; Kalbe, N.S.; Isaxon, C.; Eriksson, A.C. SPS30 and SEN55 PM2.5 Sensor Intercomparison and Validation Through Indoor and Outdoor Measurements in Arba Minch, Ethiopia; EGUsphere: Munich, Germany, 2026; pp. 1–60. [Google Scholar]
- Kumie, A.; Worku, A.; Tazu, Z.; Tefera, W.; Asfaw, A.; Boja, G.; Mekashu, M.; Siraw, D.; Teferra, S.; Zacharias, K.; et al. Fine particulate pollution concentration in Addis Ababa exceeds the WHO guideline value: Results of 3 years of continuous monitoring and health impact assessment. Environ. Epidemiol. 2021, 5, e155. [Google Scholar] [CrossRef] [PubMed]
- Bulto, T.W. Impact of Open Burning Refuse on Air Quality: In the Case of “Hidar Sitaten” at Addis Ababa, Ethiopia. Environ. Health Insights 2020, 14, 1178630220943204. [Google Scholar] [CrossRef] [PubMed]
- Bulto, T.W.; Berkessa, Y.W. The Effects of Particulate Matter Pollution on Human Health in Addis Ababa, Beijing, and New Delhi Cities. Aerosol Sci. Eng. 2022, 6, 323–334. [Google Scholar] [CrossRef]
- Xie, J.; Jia, W.; Croitoru, L.; Guttikunda, S.; Grutter, J. Safe to Breathe? Analyses and Recommendations for Improving Ambient Air Quality Management in Ethiopia; World Bank: Washington, DC, USA, 2021. [Google Scholar]
- Central Statistical Agency. Population Projections for Ethiopia 2007–2037; Central Statistical Agency. ess.gov.et: Addis Ababa, Ethiopia, 2013.
- UNDE. World Population Prospects 2022: Summary of Results; UN DESA/POP/2022/TR/NO. 3; United Nations Department of Economic and Social Affairs, Population Division: New York, NY, USA, 2022. [Google Scholar]
- Stanley, K.; Smith, J.T.; David, A.; Swanson, A. Practitioner’s Guide to State and Local Population Projections; Springer: Dordrecht, The Netherlands, 2013. [Google Scholar]
- IHME Global Burden of Disease. Available online: https://www.healthdata.org/research-analysis/gbd (accessed on 31 March 2026).
- World Health Organization; Regional Office for Europe; Mudu; Pierpaolo; Gapp, C.; Dunbar, M. AirQ+ 1.0 Example of Calculations (April 2016); WHO Regional Office for Europe: Bonn, Germany, 2016. [Google Scholar]
- WHO Regional Office for Europe Centre for Environment and Health. AirQ+: Software Tool for Health Risk Assessment of Air Pollution 2022; WHO Regional Office for Europe: Bonn, Germany, 2022. [Google Scholar]
- WHO. Health Impact Assessment of Air Pollution: Introductory Manual to AirQ+; WHO: Geneva, Switzerland, 2021. [Google Scholar]
- Asl, F.B.; Leili, M.; Vaziri, Y.; Salahshour Arian, S.; Cristaldi, A.; Oliveri Conti, G.; Ferrante, M. Health impacts quantification of ambient air pollutants using AirQ model approach in Hamadan, Iran. Environ. Res. 2018, 161, 114–121. [Google Scholar] [CrossRef] [PubMed]
- Guttikunda, S.K.; Dammalapati, S.K.; Tefera, W.; Xie, J. Modelling particulate matter (PM2.5) source contributions for air pollution management in Addis Ababa, Ethiopia. Heliyon 2025, 11, e43112. [Google Scholar] [CrossRef]
- Dingemanse, J.D.; Tademe, A. Developing and testing a PM2.5 low-cost sensor in Ethiopia under ambient and indoor air pollution conditions. Clean. Air J. 2023, 33, 1–15. [Google Scholar] [CrossRef]
- Dingemanse, J.D. Low-cost PM2.5 data collection with sensors and students in Ethiopia. In Proceedings of the CLEAN-Air Forum, Nairobi, Kenya, 15–17 July 2025. [Google Scholar]
- Tefera, W.; Kumie, A.; Berhane, K.; Gilliland, F.; Lai, A.; Sricharoenvech, P.; Patz, J.; Samet, J.; Schauer, J.J. Source Apportionment of Fine Organic Particulate Matter (PM2.5) in Central Addis Ababa, Ethiopia. Int. J. Environ. Res. Public. Health 2021, 18, 11608. [Google Scholar] [CrossRef] [PubMed]
- Shiferaw, A.B.; Kumie, A.; Tefera, W. Fine particulate matter air pollution and the mortality of children under five: A multilevel analysis of the Ethiopian Demographic and Health Survey of 2016. Front. Public Health 2023, 11, 1090405. [Google Scholar] [CrossRef] [PubMed]
- Redi, T. Influence of meteorology on atmospheric fine particulate matter (PM2.5) dispersion over Addis Ababa, Ethiopia. Discov. Atmos. 2026, 4, 3. [Google Scholar] [CrossRef]
- Ararsa, F.; Taye, S.; Debele, C. Seasonal variation and source attribution of ambient air pollution in an industrial sub-city of Addis Ababa, Ethiopia. Discov. Environ. 2025, 3, 253. [Google Scholar] [CrossRef]
- Henderson, S.B.; Beckerman, B.; Jerrett, M.; Brauer, M. Application of Land Use Regression to Estimate Long-Term Concentrations of Traffic-Related Nitrogen Oxides and Fine Particulate Matter. Environ. Sci. Technol. 2007, 41, 2422–2428. [Google Scholar] [PubMed]
- Zhao, X.; Zhang, X.; Xu, X.; Xu, J.; Meng, W.; Pu, W. Seasonal and diurnal variations of ambient PM2.5 concentration in urban and rural environments in Beijing. Atmos. Environ. 2009, 43, 2893–2900. [Google Scholar] [CrossRef]
- Eeftens, M.; Beelen, R.; de Hoogh, K.; Bellander, T.; Cesaroni, G.; Cirach, M.; Declercq, C.; Dėdelė, A.; Dons, E.; de Nazelle, A.; et al. Development of Land Use Regression Models for PM2.5, PM2.5 Absorbance, PM10 and PMcoarse in 20 European Study Areas; Results of the ESCAPE Project. Environ. Sci. Technol. 2012, 46, 11195–11205. [Google Scholar] [CrossRef] [PubMed]
- Verma, G.V.; Das, R.M. Influence of Temperature and Relative Humidity on PM(2.5) Concentration over Delhi. Mapan 2023, 38, 759–769. [Google Scholar] [CrossRef]
- Zhang, J.; Ma, X.; Li, M.; Wang, Z.; Jiang, N.; Liu, Y.; Wu, F. Characteristics, main sources, health risks of PM2.5-bound polyfluoroalkyl substances (PFAS) in Zhengzhou, central China: From seasonal variation perspective. Atmos. Chem. Phys. 2025, 25, 14735–14745. [Google Scholar] [CrossRef]
- Azanaw, J.; Sisay Chanie, G. Spatial variation and determinants of solid fuel use in Ethiopia; Mixed effect and spatial analysis using 2019 Ethiopia Mini Demographic and Health Survey dataset. PLoS ONE 2023, 18, e0294841. [Google Scholar] [CrossRef] [PubMed]
- Shi, Y.; Liu, L.; Hu, F.; Fan, G.; Huo, J. Nocturnal Boundary Layer Evolution and Its Impacts on the Vertical Distributions of Pollutant Particulate Matter. Atmosphere 2021, 12, 610. [Google Scholar] [CrossRef]
- Atuyambe, L.M.; Etajak, S.; Walyawula, F.; Kasasa, S.; Nyabigambo, A.; Bazeyo, W.; Wipfli, H.; Samet, J.M.; Berhane, K.T. Air quality and attributable mortality among city dwellers in Kampala, Uganda: Results from 4 years of continuous PM2.5 concentration monitoring using BAM 1022 reference instrument. J. Expo. Sci. Environ. Epidemiol. 2025, 35, 288–293. [Google Scholar] [PubMed]
- Getachew, M.; Mekonnen, A.; Fitsum, D. Health and Economic Impact Estimation of Ambient Air Particulate Matter (PM2.5) Pollution in Addis Ababa Using BenMAP-CE Model. Environ. Health Insights 2025, 19, 11786302241312061. [Google Scholar] [CrossRef] [PubMed]

Disclaimer/Publisher’s Note: The statements, opinions and data contained in all publications are solely those of the individual author(s) and contributor(s) and not of MDPI and/or the editor(s). MDPI and/or the editor(s) disclaim responsibility for any injury to people or property resulting from any ideas, methods, instructions or products referred to in the content. |
© 2026 by the authors. Licensee MDPI, Basel, Switzerland. This article is an open access article distributed under the terms and conditions of the Creative Commons Attribution (CC BY) license.