


Abstract
Climate, and especially cities with hot climatic conditions, directly impact human life. In this study, hourly datasets from the central meteorological station in Diyarbakır city center for the years 1990–2022 were utilized. These data were analyzed using RayMan Pro-2.1 software, and Physiological Equivalent Temperature values were derived. The obtained Physiological Equivalent Temperature values were analyzed using the SARIMAX model implemented on a machine learning infrastructure to uncover the changes between 2022 and 2050. According to the results obtained, the Physiological Equivalent Temperature value, which was 15.42 °C in 1990 in real terms, increased by 21.3% to 18.66 °C in 2022. According to the SARIMAX model predictions, Physiological Equivalent Temperature values in 2022 are estimated to rise to 21.42 °C by 2050, reflecting an increase of 14.79%. The aim of this study is to examine the temporal variations in human bioclimatic comfort values and provide a foundation for future predictions. This will contribute to the development of urban master plans by local and administrative authorities.
1. Introduction
Global population growth and rural-to-urban migration have accelerated urbanization and population growth. In rapidly increasing cities, urban heat island (UHI) zones and poor land-use planning create localized microclimates that can harm public health [1]. Since rising temperatures may limit physical activity, people with pre-existing health issues are more vulnerable [2]. Other researchers have shown similar effects of rising temperatures on vulnerable groups [3]. Air temperature, humidity, wind speed, sun radiation, clothing, and activity level affect human thermal comfort [4]. Temperatures between 21 and 27.5 °C, relative humidity between 30 and 65%, and wind velocity below 5 m/s provide bioclimatic comfort. PET is a comprehensive thermal index based on human energy balance and includes ambient temperature, humidity, wind speed, and sun radiation. PET evaluates thermal comfort well, according to multiple studies [5]. Because it incorporates several environmental elements that affect human thermal reactions, PET gives a more accurate assessment of perceived thermal conditions than air temperature alone [6]. Studies under other climates have reached similar conclusions [7].
PET is commonly acknowledged as an effective year-round outdoor thermal comfort indicator [8]. Researchers like it because it works in hot and cold temperatures [9]. Thus, PET has been used to evaluate urban bioclimatic comfort in several climates [10]. It has been shown to assess human heat perception in various metropolitan settings [11,12]. PET has been used to study urban shape and land-use effects on thermal comfort [12]. Studies on climate-sensitive urban design [13], outdoor thermal settings [14], urban heat stress assessment [15], and sustainable city development strategies [16] used similar methods.
Weather station long-term hourly meteorological observations are used to calculate PET values. Urban planning and climate adaption strategies that improve public well-being and environmental sustainability benefit from such evaluations [17]. Climate data has always been difficult to analyze and comprehend due to its volume and complexity. Advances in machine learning and data analytics have helped academics process vast datasets and find trends in climate records. Artificial intelligence’s machine learning branch develops algorithms that can learn from data and make predictions or judgments without programming. The literature has thoroughly discussed its theoretical foundations and practical applications [18]. Machine learning algorithms find variable correlations and make accurate future predictions by training on previous datasets [19].
Machine learning has enhanced difficult time-series dataset analysis and forecasting in climate research [20]. Numerous studies have shown their climate predicting accuracy [21]. Recent research has shown their ability to find nonlinear correlations in meteorological datasets [22]. More research has demonstrated they can improve predicting under different climates [23,24]. Machine learning methods have higher predictive accuracy [25] and fewer forecasting errors [26] than statistical and physical models [27]. These benefits have increased machine learning’s use in climate science [28], improving predictive capabilities [29], supporting climate adaptation planning [30], improving environmental decision-making [31], facilitating urban resilience studies [32] and promoting sustainable climate management [33].
Turkish climate research have integrated AI and machine learning analysis alongside global breakthroughs [34]. Recently published national studies show increased interest in data-driven climate research [35,36]. Most studies predict individual meteorological fac-tors like temperature, humidity, and wind speed, but few have predicted Physiological Equivalent Temperature (PET), which is crucial for assessing human thermal comfort. This study intends to assess historical variations in PET conditions in Diyarbakır through hourly meteorological data gathered from 1990 to 2022 and to project future PET trends till 2050 utilizing a SARIMAX-based forecasting methodology. This study enhances the literature by integrating long-term PET analysis with machine-learning-based time-series forecasting, offering insights that could inform urban planning and climate adaption strategies in arid towns. The research seeks to predict the long-term temporal dynamics of human thermal comfort using PET, which consolidates several meteorological factors into a singular biometeorological index.
2. Material
This section describes the study area, meteorological dataset, and the main input variables used for PET calculation and subsequent time-series modeling. The materials are organized to ensure a clear understanding of the data sources and their role in both bioclimatic analysis and forecasting stages.
2.1. Study Area
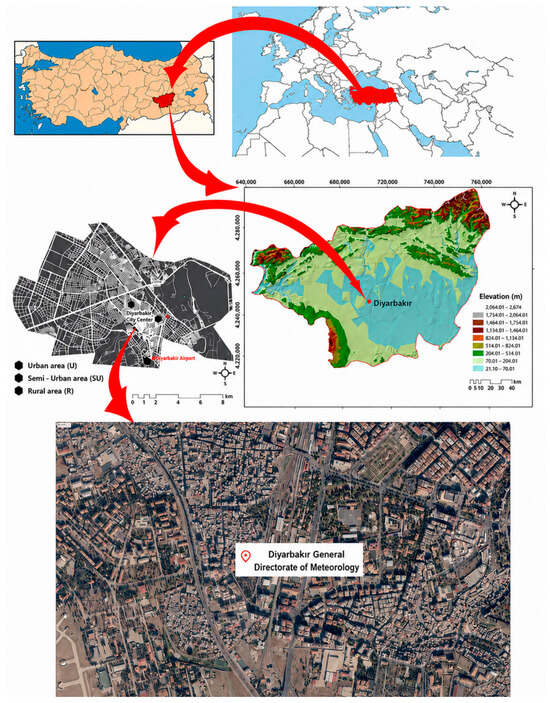
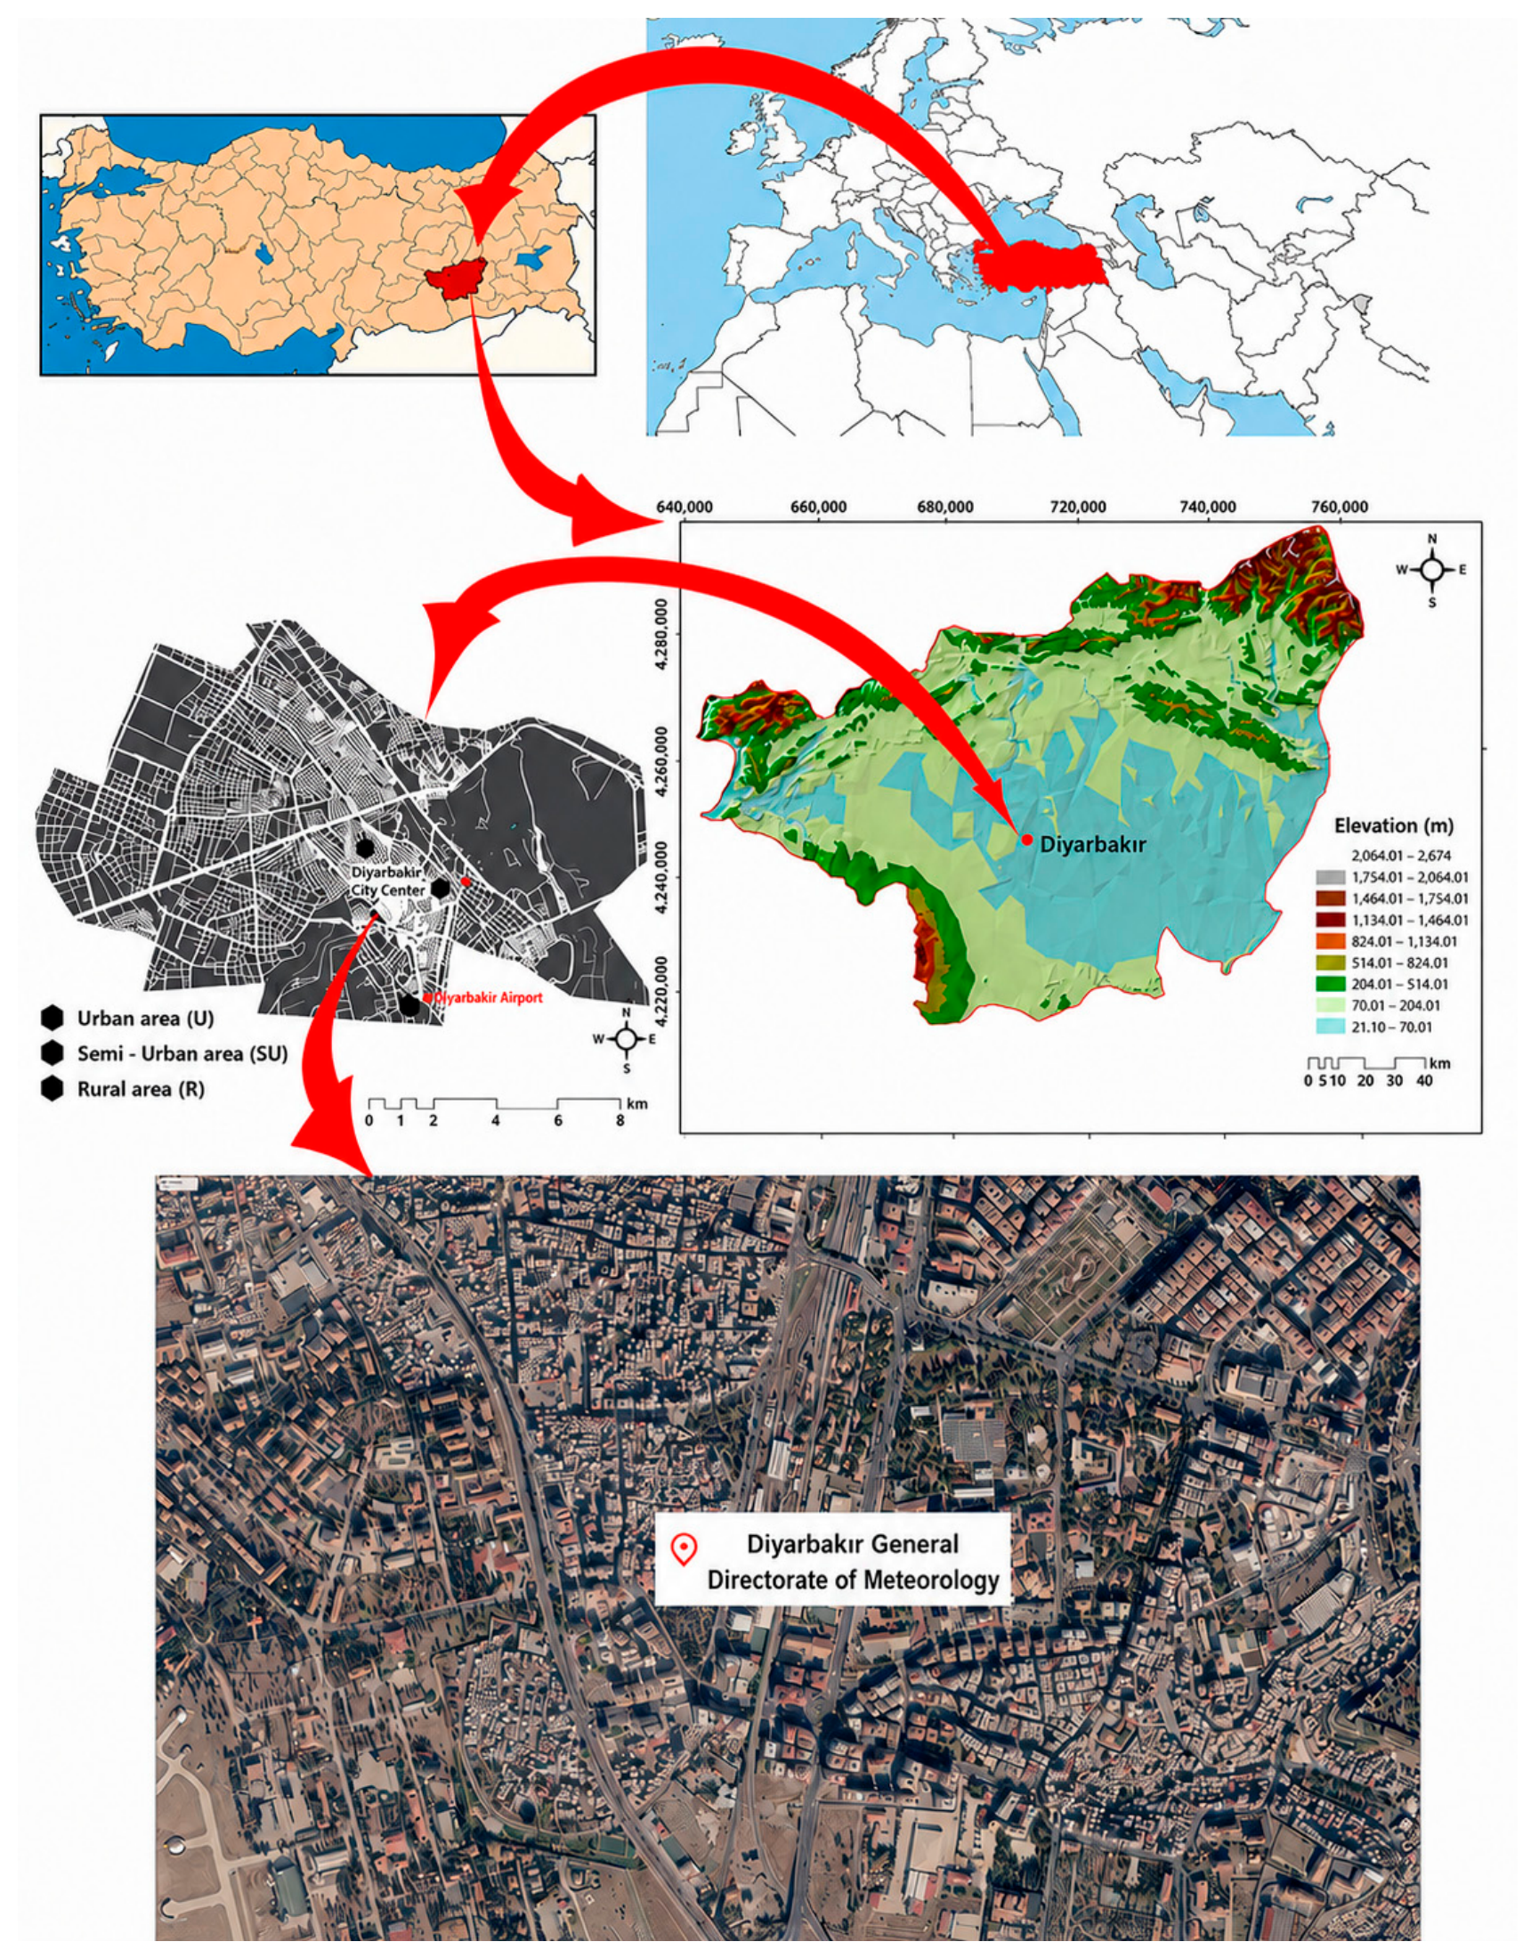
Diyarbakır Province, located in the Southeastern Anatolia Region of Türkiye, was selected as the study area due to its strong continental climate characteristics and rapid urbanization processes (Figure 1). The province is situated between 37.52° N latitude and 40.13° E longitude, while meteorological observations were obtained from Bağlar Meteorological Station No. 19268 (37.80° N, 39.55° E).
Figure 1.
Location of the study area.
Covering an area of approximately 15,168 km2, Diyarbakır is one of the major urban centers in the region. According to recent demographic statistics, the city has experienced continuous population growth driven by migration and urban expansion. The annual population growth rate is reported as 0.45% [37], and the total population increased from 1,362,718 in 2020 to 1,818,133 in recent years [38].
These demographic changes were included to emphasize the role of urbanization and population growth in shaping local thermal environments and increasing heat exposure risk.
The city experiences a continental climate characterized by hot, dry summers and cold winters. Mean monthly temperatures range from 1.8 °C in winter to 31 °C in summer [39]. Annual precipitation averages 491 mm, with only about 2% occurring during summer months [40].
From a geographical perspective, Diyarbakır is located at an elevation of approximately 600–650 m above sea level on the eastern basalt plateau extending toward the Tigris Valley. This geographical setting plays a critical role in shaping local microclimatic conditions due to topographic and atmospheric interactions.
2.2. Data Collection
This study utilized hourly meteorological data received from the Diyarbakır Meteorological Station. The dataset encompasses a 32-year span from 1990 to 2022, with recordings of air temperature (°C), relative humidity (%), wind speed (m s−1), and cloud cover (octa). The extensive and high-temporal-resolution dataset offers a solid foundation for assessing climatic variability, thermal comfort conditions, and temporal trends in the region under investigation [41,42,43,44,45]. Before analysis, the data underwent quality control methods to detect and remove missing, inconsistent, or erroneous records.
3. Method
3.1. Methodological Framework
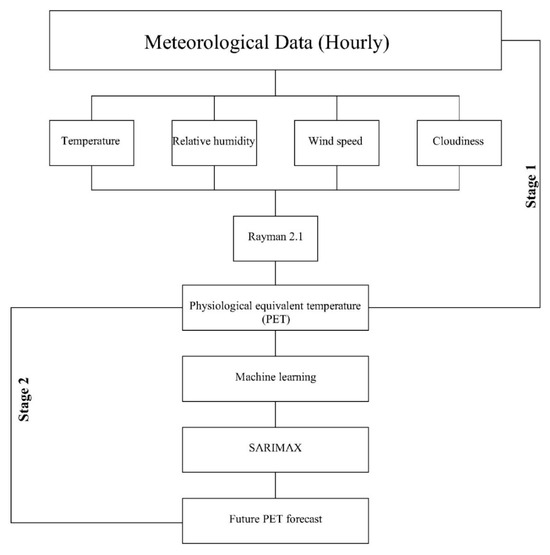
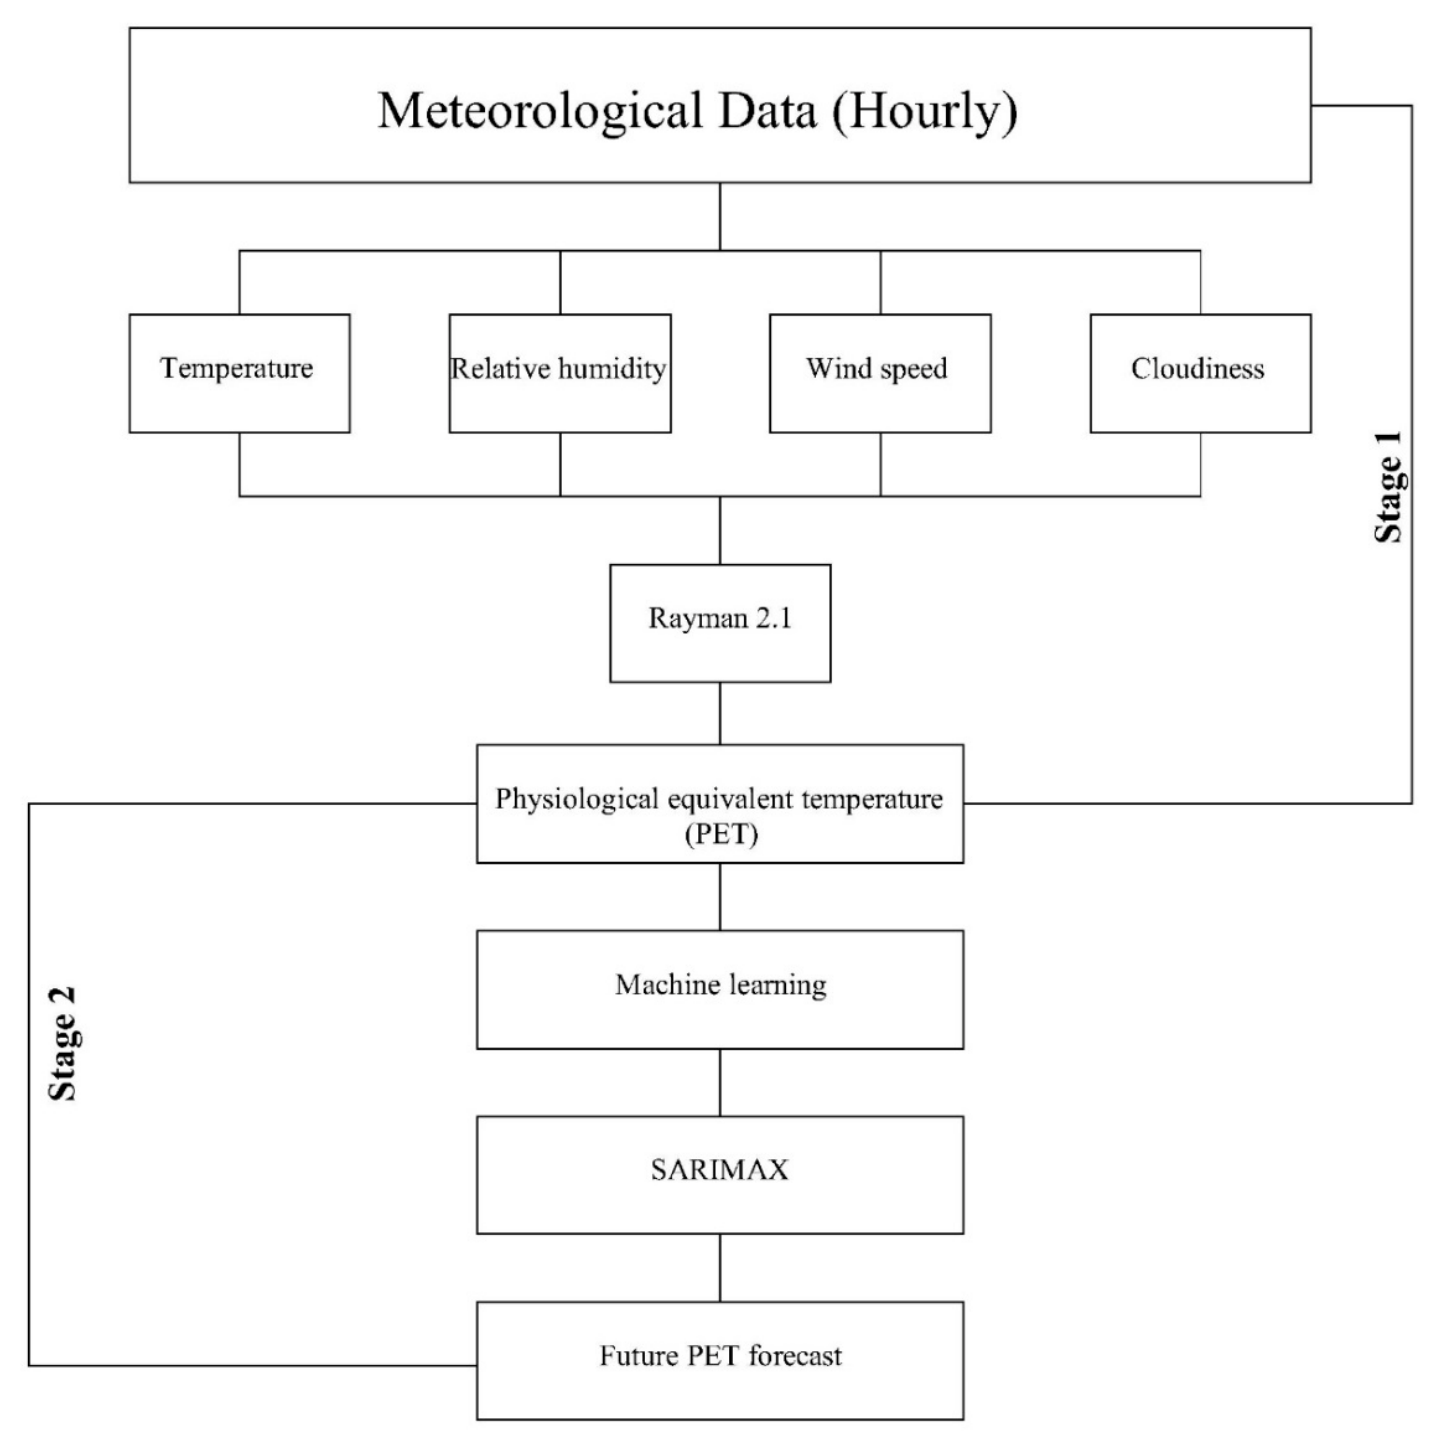
This study adopts a two-stage methodological framework designed to integrate bioclimatic modeling with statistical forecasting. In the first stage, Physiological Equivalent Temperature PET values were calculated using the RayMan model based on 32 years of hourly meteorological observations [46,47,48]. In the second stage, the resulting PET time series was analyzed and forecasted using a SARIMAX-based time-series model. This separation of modeling stages ensures that the bioclimatic calculation process and the forecasting procedure are clearly distinguished, thereby improving methodological transparency and interpretability.
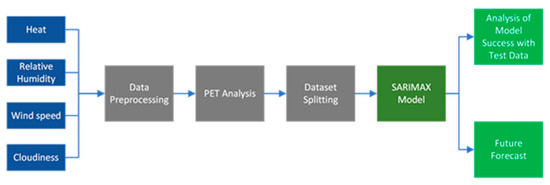
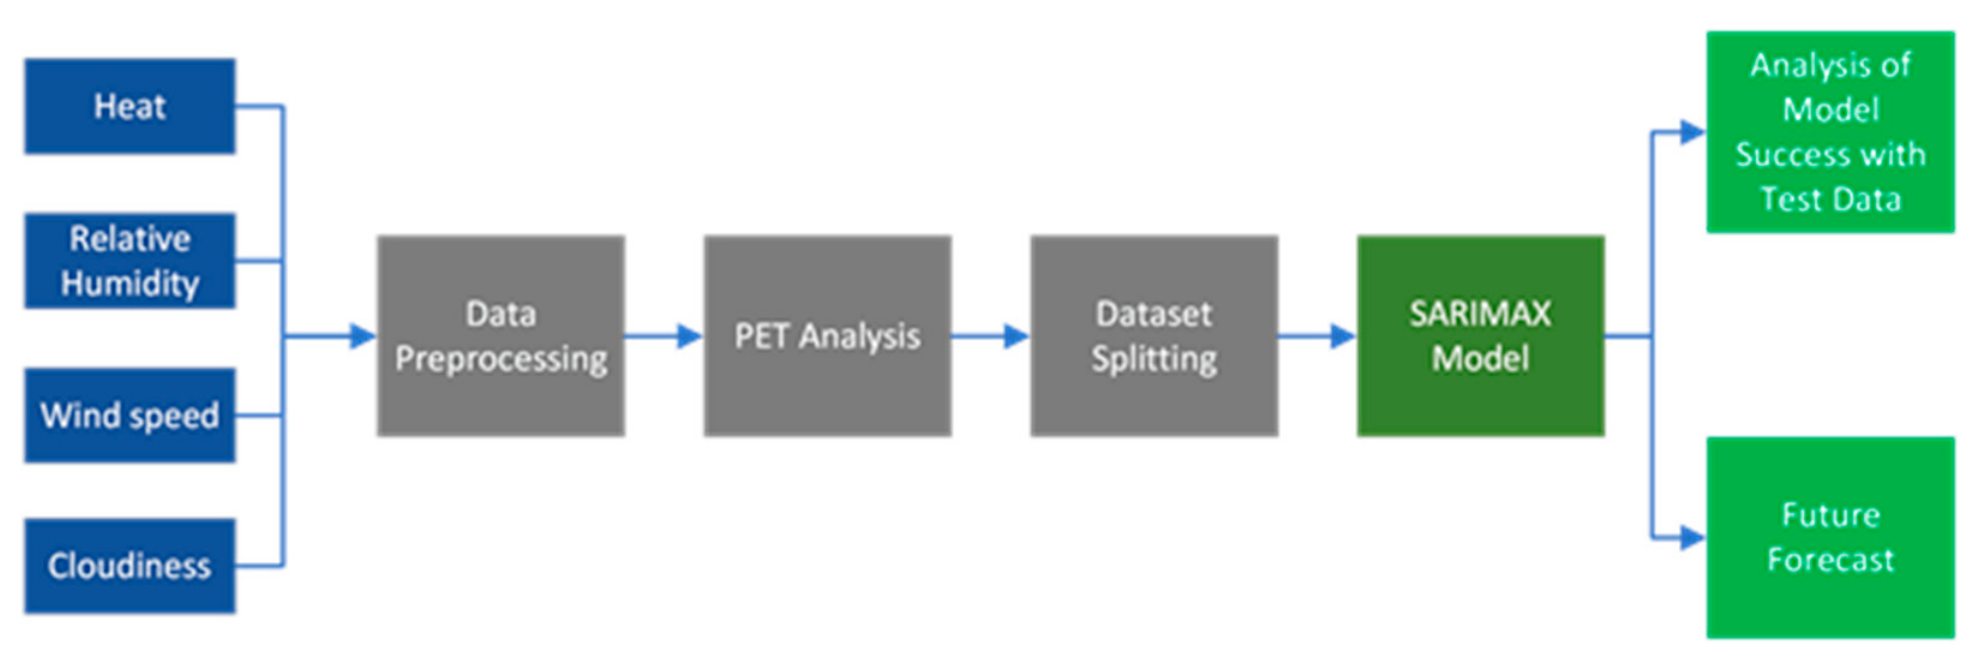
The methodological workflow of the study is summarized in Figure 2. As shown in the figure, the process begins with long-term meteorological data collection, continues with PET computation using RayMan, and concludes with time-series forecasting using SARIMAX. This structure provides a clear transition from raw climatic inputs to predictive bioclimatic outputs.
Figure 2.
Workflow diagram.
Figure 2 illustrates the complete methodological pathway of the study. The diagram highlights the sequential structure of the analysis and clearly separates the deterministic bioclimatic modeling phase from the statistical forecasting phase. This structure was designed to improve reproducibility and conceptual clarity.
3.2. Stage 1: PET Calculation Using RayMan Model
In the first stage, Physiological Equivalent Temperature PET values were calculated using RayMan 2.1, a widely used biometeorological model designed to evaluate outdoor thermal comfort conditions [46,48]. The model integrates key meteorological variables such as air temperature, relative humidity, wind speed, and cloud cover. These variables are essential for calculating both PET and mean radiant temperature MRT.
In addition to meteorological inputs, radiation fluxes, surface characteristics, and geometric factors were included to improve the representation of urban environmental conditions. Geographic parameters such as latitude and altitude were also considered to increase the accuracy of local climate representation.
3.2.1. Data Preparation and PET Computation
PET calculations were performed using 32 years of hourly meteorological data obtained from the Diyarbakır State Meteorological Service. The dataset includes air temperature, wind speed, relative humidity, and cloud cover variables. Prior to analysis, all datasets were cleaned, standardized, and formatted to ensure compatibility with RayMan input requirements. This preprocessing step was essential to maintain temporal consistency and to avoid biases in long-term PET estimation.
The PET index is based on the human energy balance concept proposed by Höppe, which describes the equilibrium between metabolic heat production and environmental heat exchange. Within this framework, PET represents the equivalent indoor air temperature that produces the same physiological thermal load as observed in outdoor conditions [48]. The human energy balance equation is expressed as M plus W0 plus R plus C plus Esk plus Eres plus Esw plus S equals zero, where each term represents a component of heat exchange between the human body and the environment, as shown in Equation (1). The human energy balance formulation is expressed as follows:
M + W0 + R + C + Esk + Eres + Esw + S = 0
In this formulation, M represents metabolic heat production, W0 mechanical work, R radiative heat exchange, C sensible heat transfer, Esk latent heat loss through skin evaporation, Eres respiratory heat exchange, Esw sweat evaporation, and S thermal storage. This balance assumes steady-state conditions where total heat storage is zero.
Table 1 was used to interpret PET results in terms of human thermal perception. As shown in Table 1, PET values are categorized into thermal stress levels ranging from extreme cold stress to extreme heat stress. This classification allows direct translation of numerical outputs into physiologically meaningful thermal comfort categories, which is essential for bioclimatic assessment studies [42,49,50,51].
Table 1.
PET categories representing thermal stress levels and thermal sensation ranges [46,52].
The PET classification was used throughout the study to evaluate temporal changes in thermal comfort conditions and to interpret seasonal variations in human thermal exposure. Standard physiological assumptions were applied in the PET calculations, representing a reference individual: a 35-year-old male with a height of 175 cm, metabolic rate of 80 W, and clothing insulation value of 0.90 clo. These standardized parameters ensure comparability across the full 32-year dataset and maintain consistency in bioclimatic interpretation.
3.2.2. RayMan Model Description and Interpretation
RayMan is a microscale radiation and bioclimate model developed at the Albert Ludwigs University of Freiburg. It is widely used in thermal comfort research due to its ability to simulate both shortwave and longwave radiation exchange in complex urban environments. The model accounts for cloud cover, shading effects, and surrounding obstacles, making it particularly suitable for urban climate applications.
The PET values generated by RayMan are derived from human energy balance calculations and are classified according to bioclimatic comfort criteria defined by Matzarakis. These classifications enable interpretation of thermal stress conditions in relation to human physiological response, as supported in previous studies [49,53].
RayMan was selected in this study because it integrates environmental geometry with physiological heat balance principles, allowing a realistic representation of outdoor thermal conditions in urban environments [46,53,54,55].
3.2.3. Interpretation of Workflow Structure
The methodological workflow presented in Figure 2 demonstrates the integration of two complementary modeling approaches. The first stage focuses on physically based bioclimatic modeling using RayMan, while the second stage applies statistical forecasting using SARIMAX. This combination enables both retrospective analysis and future projection of PET dynamics.
Figure 2 highlights that raw meteorological data are transformed into bioclimatic indicators before being processed in a forecasting framework. This sequential transformation improves analytical transparency and ensures methodological traceability across all stages of the study.
3.3. Stage 2: SARIMAX Forecasting Model
In the second stage, the SARIMAX Seasonal AutoRegressive Integrated Moving Average with Exogenous Variables model was applied to forecast PET time-series data. The model captures trend, seasonality, and autocorrelation structures within the dataset, making it suitable for long-term climatic forecasting applications [56].
This stage focuses on predicting future PET values derived from RayMan outputs rather than raw meteorological variables. By using PET as the dependent variable, the model directly reflects changes in human thermal comfort conditions over time.
3.3.1. Data Processing and Model Training
The PET dataset obtained from RayMan was transformed into a structured time-series format suitable for SARIMAX modeling. The dataset was divided chronologically into training, validation, and testing subsets with proportions of 60 percent, 20 percent, and 20 percent respectively. This temporal splitting approach preserves the sequential nature of the data and prevents information leakage during model training.
The modeling process was implemented in Python version 3.12.13. using Google Colab Pro, which provides high computational efficiency for large-scale time-series analysis. Libraries such as statsmodels, TensorFlow, scikit-learn, and matplotlib were used for data preprocessing, model construction, and visualization of results.
Figure 3 presents the complete modeling pipeline including preprocessing, training, validation, and testing phases. The structured workflow ensures reproducibility and transparency in model development.
Figure 3.
SARIMAX model implementation steps.
3.3.2. Parameter Optimization
The SARIMAX model parameters were optimized using a grid search approach based on the Akaike Information Criterion AIC. This method evaluates different parameter combinations and selects the configuration that minimizes information loss while avoiding overfitting.
The optimal parameter set was determined as 1, 1, 1 multiplied by 1, 1, 1, 12. This configuration was found to best capture both seasonal and non-seasonal structures in the PET time series.
3.3.3. SARIMAX Model Equation
The SARIMAX model formulation is expressed in Equation (2), where Xt represents the PET time series, ykt represents exogenous variables, and et denotes the error term. Equation (2), the SARIMAX model formulation, is expressed as follows:
This formulation combines autoregressive, integrated, and moving average components with seasonal effects and external variables. In this study, the model was used to capture long-term temporal dynamics of PET and to generate future projections of thermal comfort conditions.
4. Result
4.1. Evaluation of Available Data
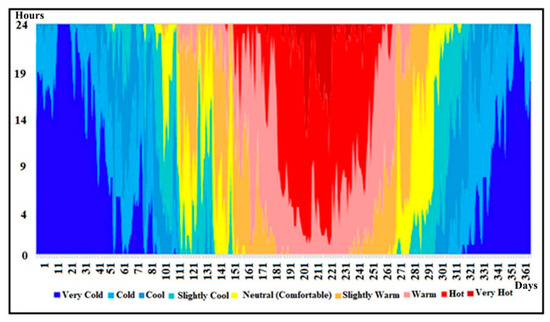
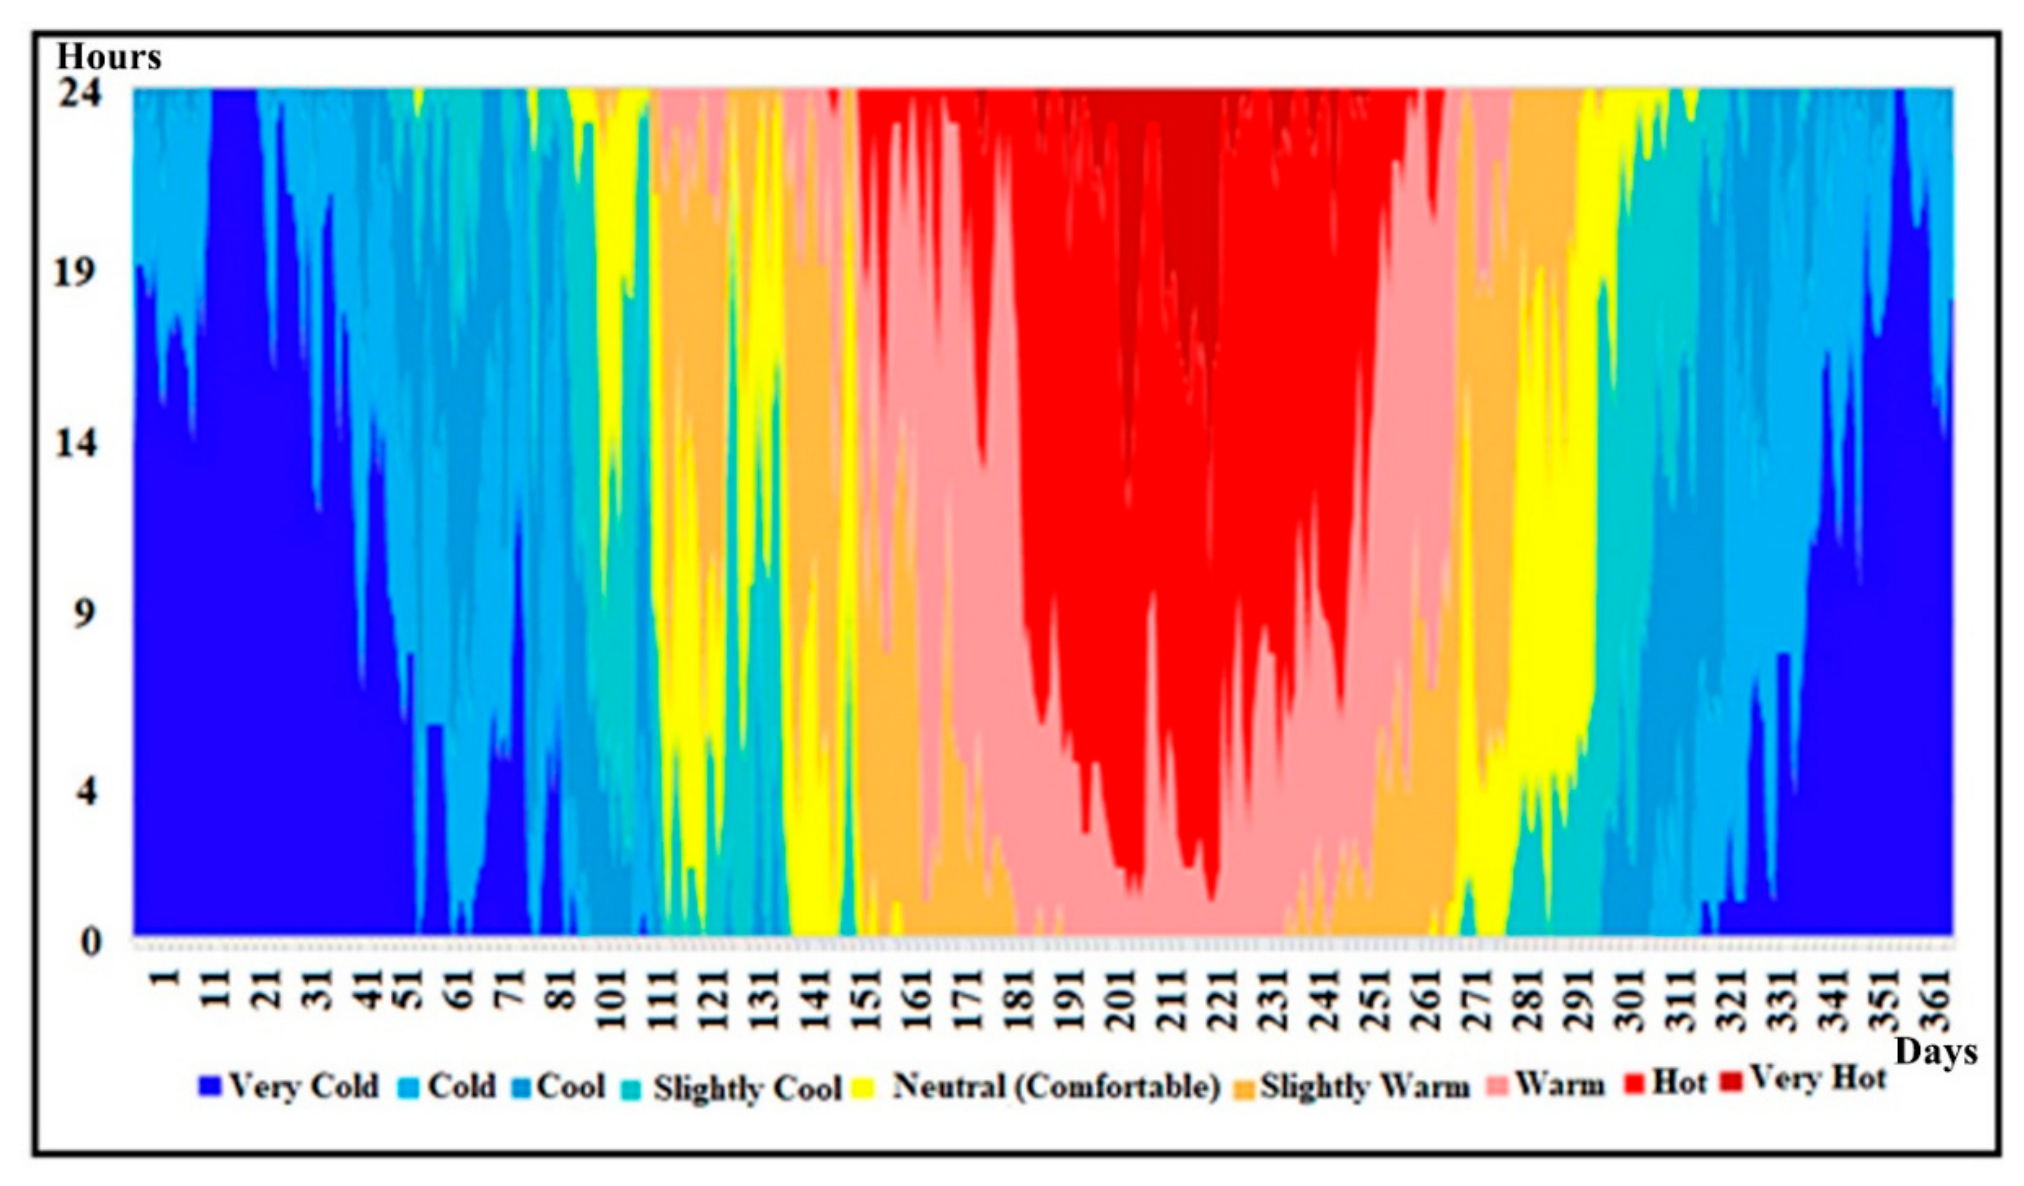
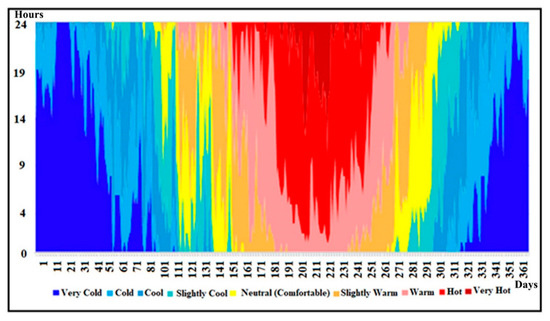
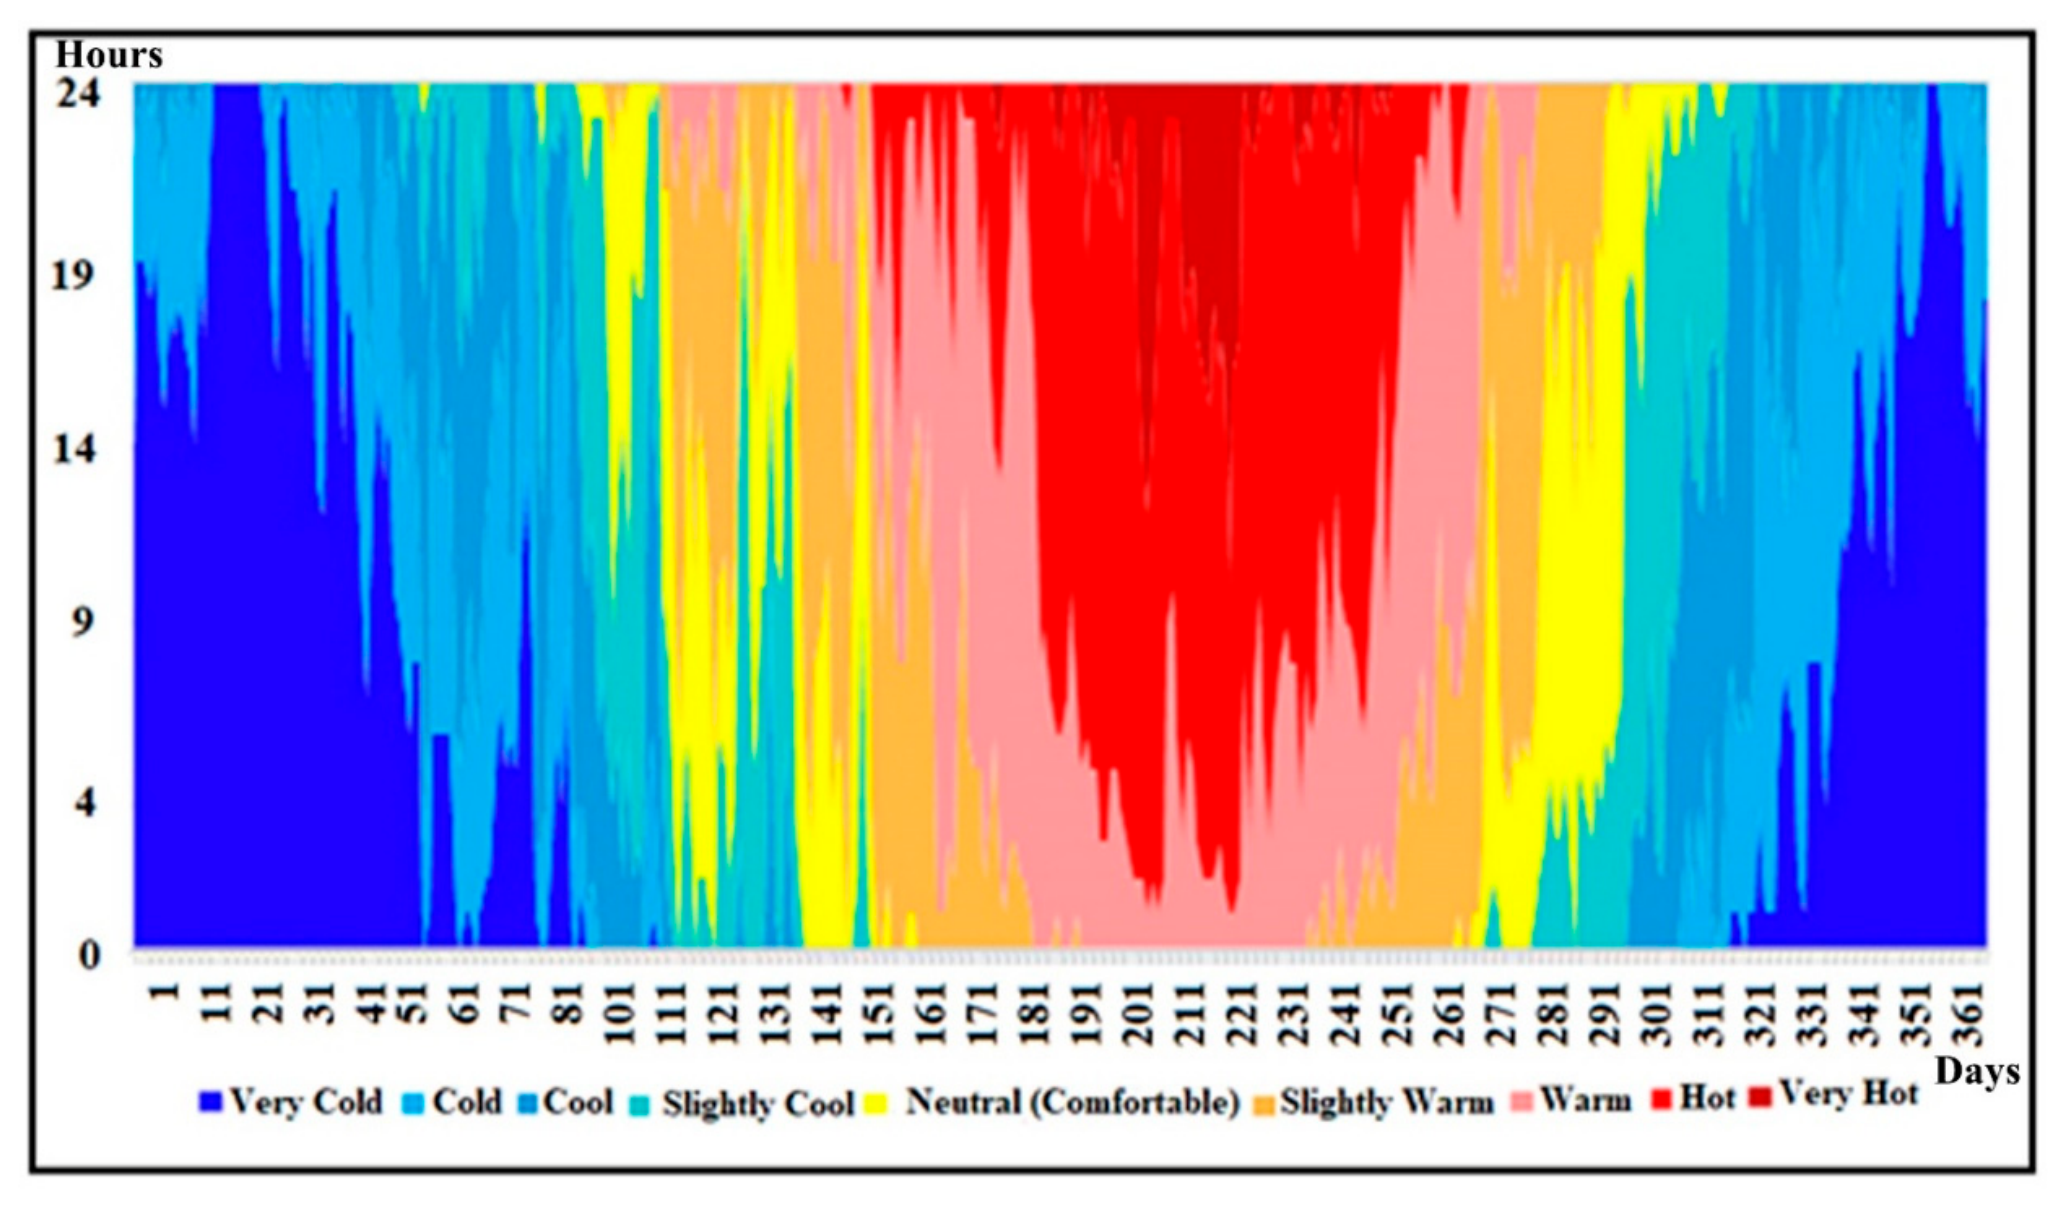
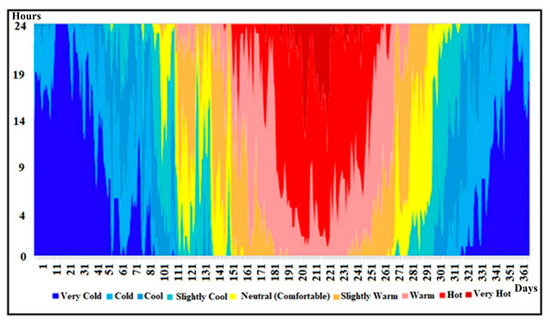
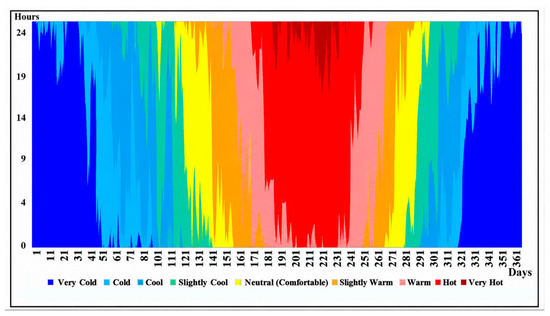
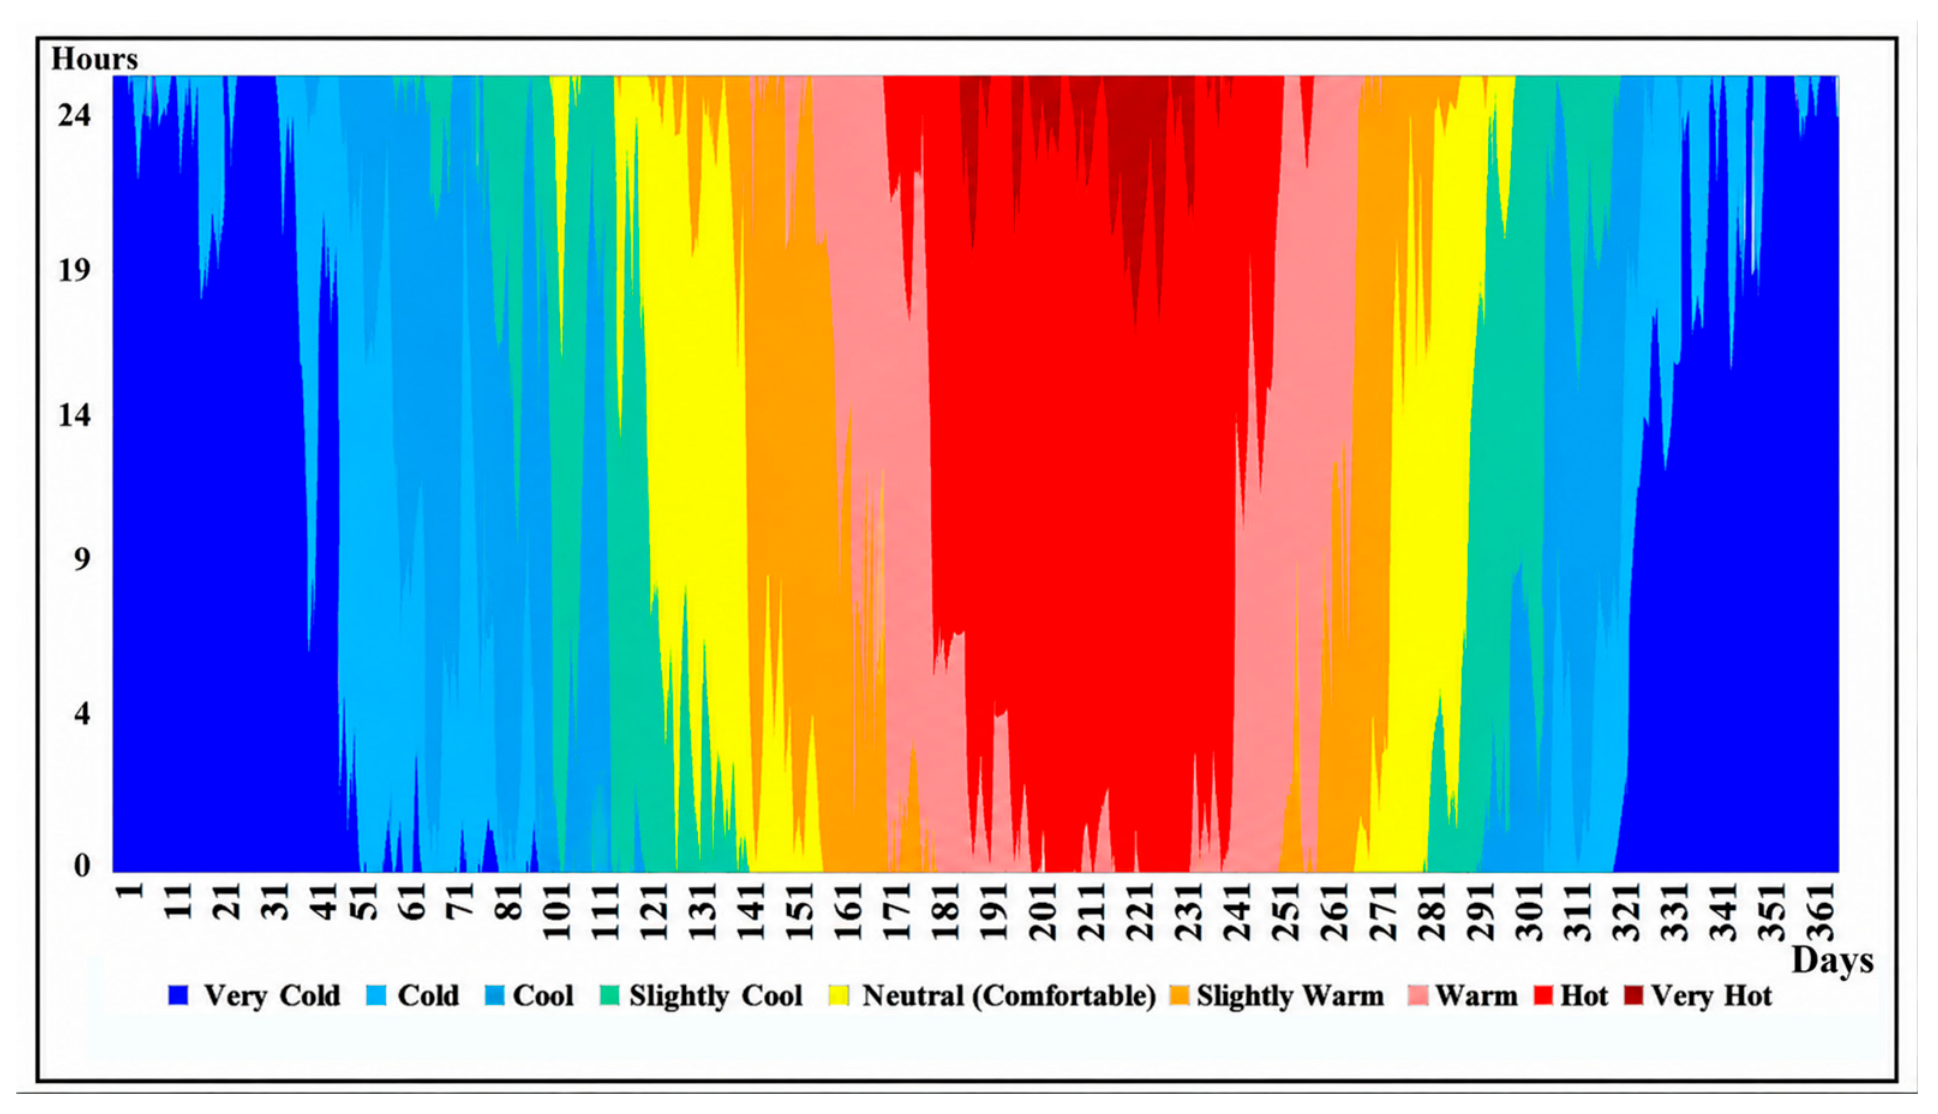
In the study, after the PET calculations of 32-year datasets were made, they were evaluated in 5-year periods, 2-year periods and finally in general. The average PET value between 1990 and 1995 was 15.58 °C. Within this time interval, the maximum PET value occurred between the 200th and 221st days of the year. During 80 percent of this 22-day period, individuals were exposed to temperature extremes. Between 1990 and 1995, the maximum PET value reached 47.03 °C, while the minimum was −9.71 °C. From the 330th to the 365th days and the 1st to the 50th days of the year, people were exposed to cold stress, particularly between the 11th and 30th days. Moreover, between the 350th and 360th days, individuals experienced very cold stress on 100 percent of the days (Figure 4).
Figure 4.
PET chart from 1990 to 1995.
The average PET value between 1996 and 2001 was determined to be 16.92 °C. In this period, the maximum PET value occurred between the 200th and 221st days of the year. For 80 percent of this 22-day period, individuals were exposed to temperature extremes. Between 1996 and 2001, the maximum PET value reached 48.81 °C, while the minimum was −7.46 °C. From the 330th to the 365th days and the 1st to the 60th days of the year, individuals were exposed to cold stress, particularly between the 15th and 33rd days. Moreover, between the 340th and 355th days, people experienced very cold stress 100 percent of the time. Between the 180th and 240th days of the year, individuals were exposed to heat stress (Figure 5).
Figure 5.
PET chart from 1996 to 2001.
The average PET value between 2002 and 2007 was determined to be 17.36 °C. In this time interval, the maximum PET value occurred between the 200th and 220th days of the year. For 85% of this 19-day period, individuals were exposed to temperature extremes. Between 2002 and 2007, the maximum PET value reached 48.25 °C, while the minimum was −10.95 °C. From the 330th to the 365th days and the 1st to the 60th days of the year, individuals were exposed to cold stress, particularly between the 20th and 38th days. Moreover, between the 348th and 353rd days, people experienced very cold stress 100 percent of the time. Between the 200th and 220th days of the year, individuals were exposed to heat stress (Figure 6).
Figure 6.
PET chart from 2002 to 2007.
The average PET value between 2008 and 2013 was determined to be 16.92 °C. In this time interval, the maximum PET value occurred between the 200th and 221st days of the year. For 83% of this 20-day period, individuals were exposed to temperature extremes. Between 2008 and 2013, the maximum PET value reached 47.86 °C, while the minimum was −9.65 °C. From the 330th to the 365th days and the 1st to the 60th days of the year, individuals were exposed to cold stress, particularly between the 19th and 30th days. Moreover, between the 347th and 352nd days, people experienced very cold stress 100 percent of the time. Between the 200th and 221st days of the year, individuals were exposed to heat stress (Figure 7).
Figure 7.
PET chart from 2008 to 2013.
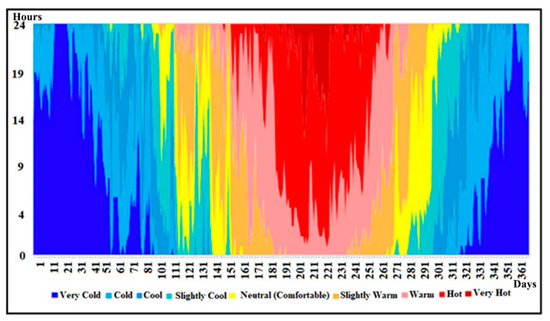
The average PET value between 2014 and 2019 was determined to be 18.07 °C. In this time interval, the days with the maximum PET value fall between the 180th and 215th days of the year. For 88% of this 34-day period, individuals were exposed to extreme temperature conditions. Simultaneously, unlike other years, between the 193rd and 230th days, people experienced heat stress throughout the entire day. While the maximum PET reached 43.48 °C between 2014 and 2019, the minimum was recorded at −8.10 °C. From the 320th to the 365th days and the 1st to the 50th days of the year, individuals were exposed to cold stress, especially between the 31st and 40th days. Furthermore, between the 355th and 358th days, people experienced very cold stress for 100% of those days (Figure 8).
Figure 8.
PET chart from 2014 to 2019.
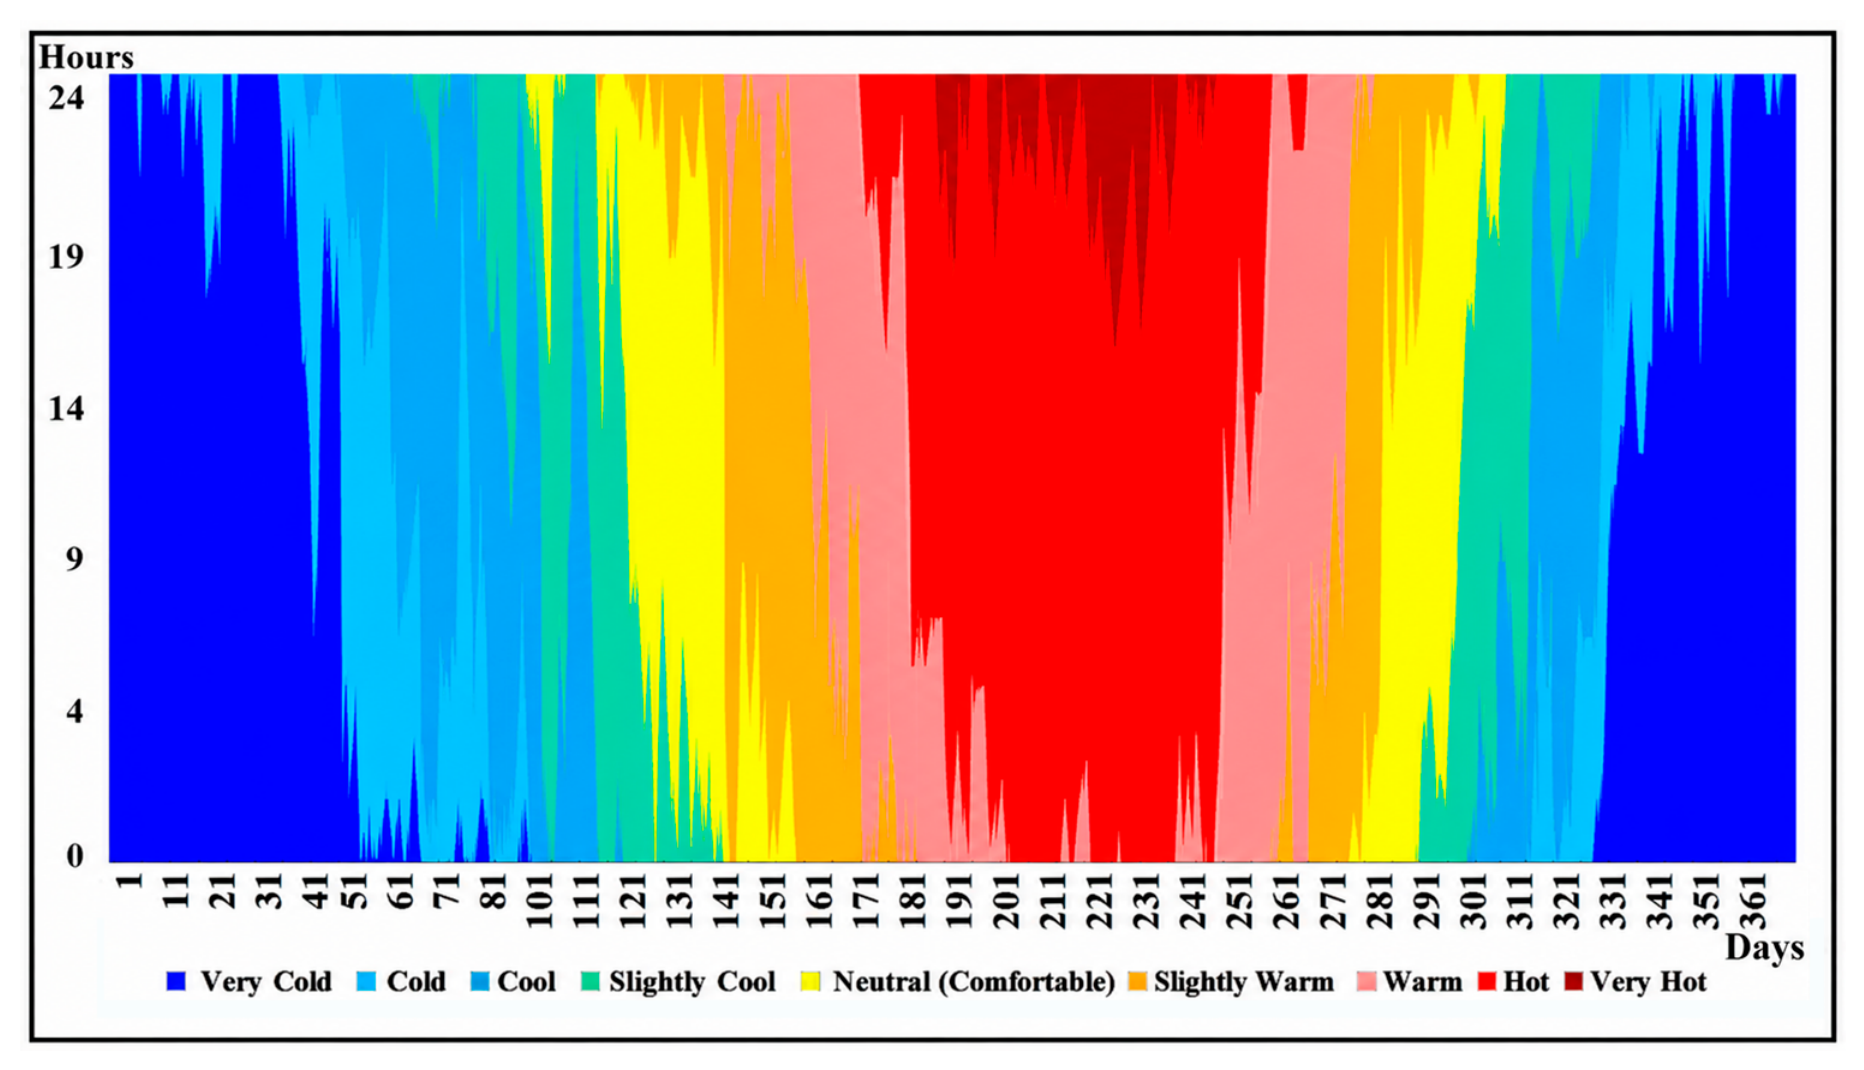
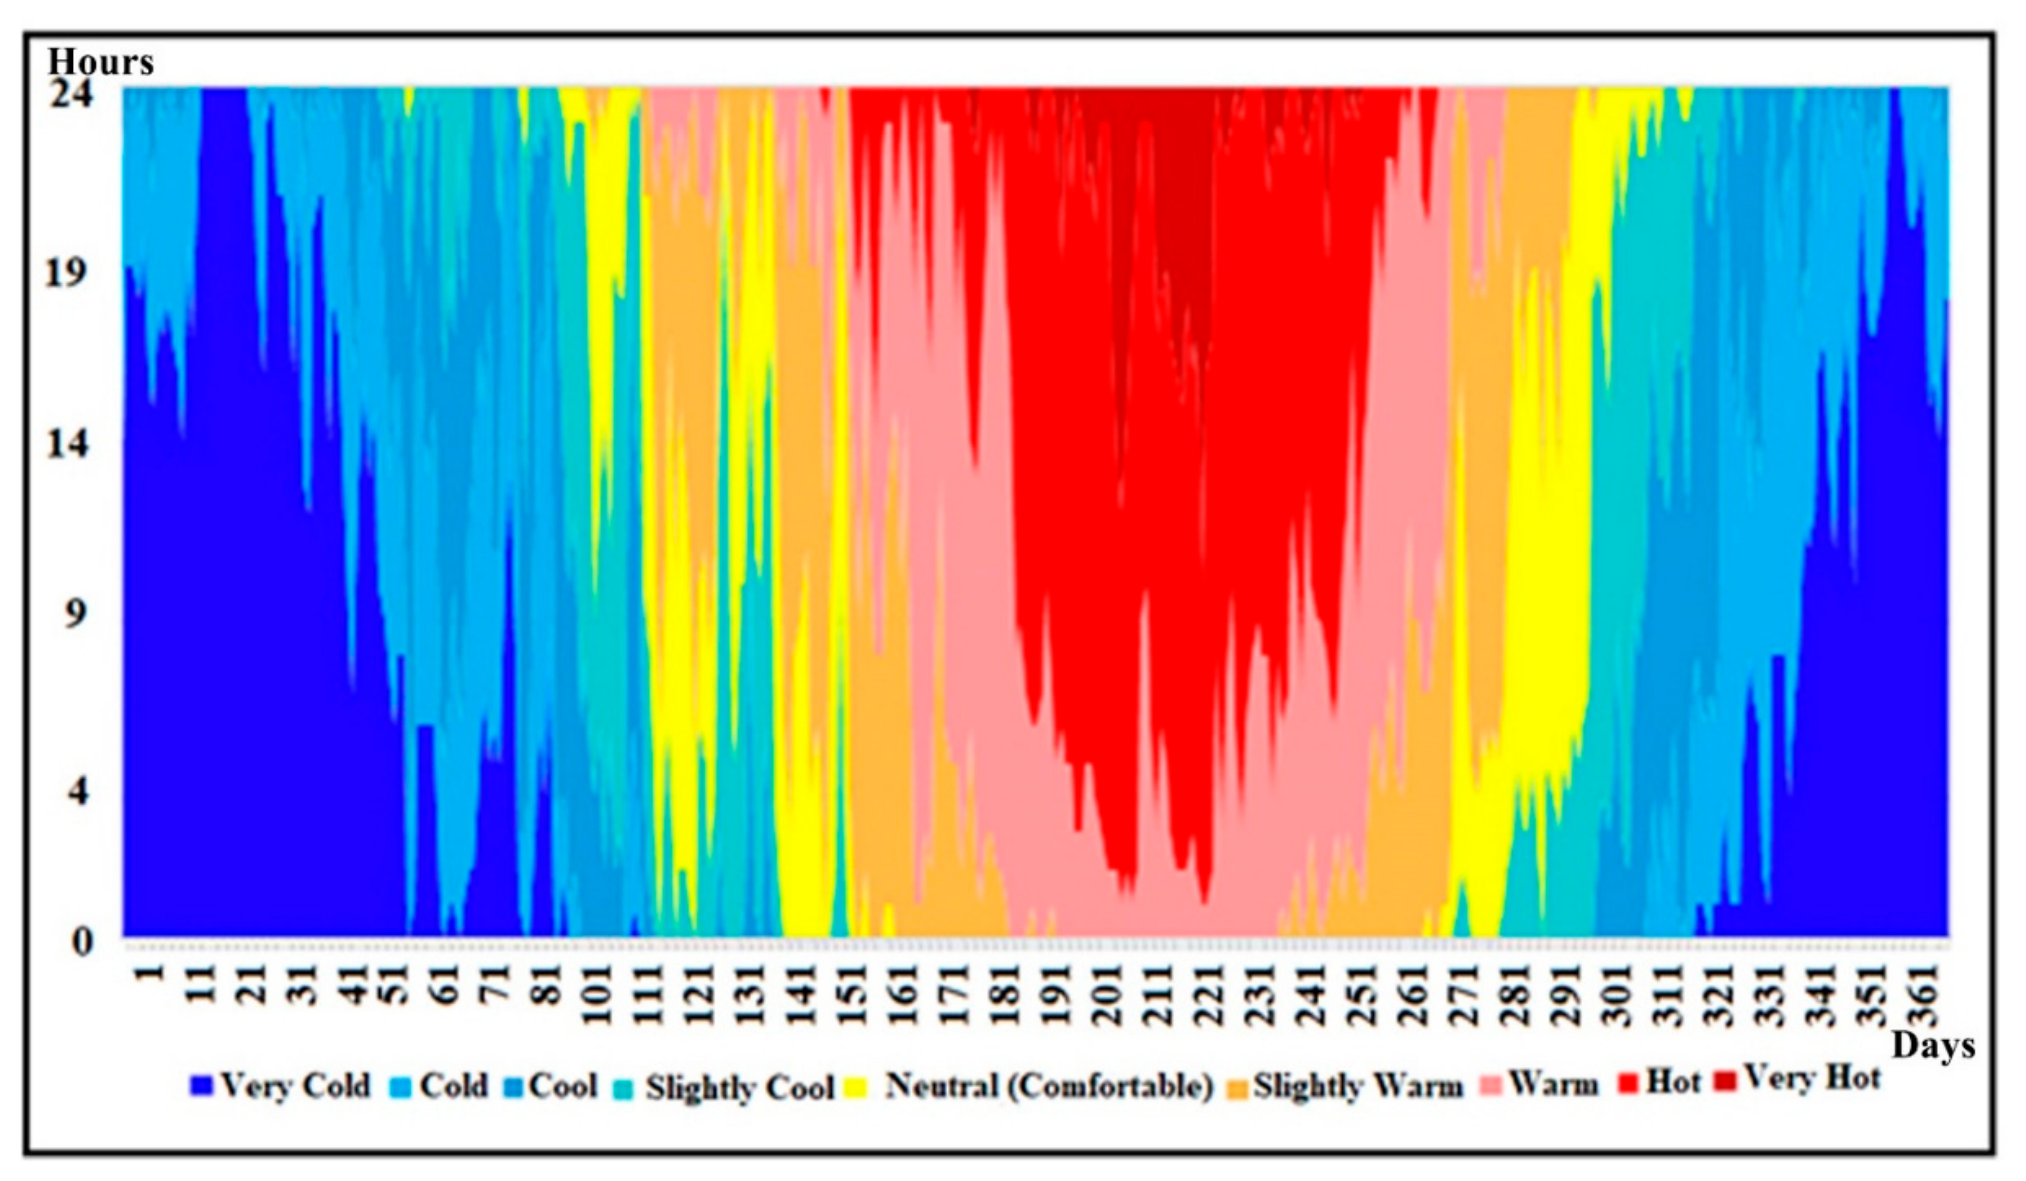
The average PET value between 2020 and 2022 was determined to be 18.46 °C. In this time interval, the days with the maximum PET value fall between the 192nd and 241st days of the year. For 92% of this 48-day period, individuals were exposed to extreme temperature conditions. Between 2020 and 2022, the maximum PET value reached 48.73 °C, while the minimum was recorded at −10.06 °C. From the 330th to the 365th day and the 1st to the 60th days of the year, individuals were exposed to cold stress, particularly between the 25th and 36th days. Furthermore, between the 352nd and 355th days, people experienced very cold stress for 100% of those days (Figure 9).
Figure 9.
PET chart from 2020 to 2022.
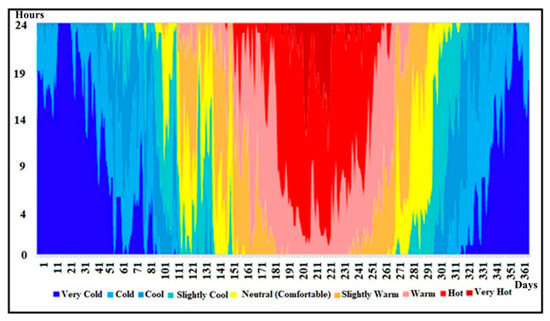
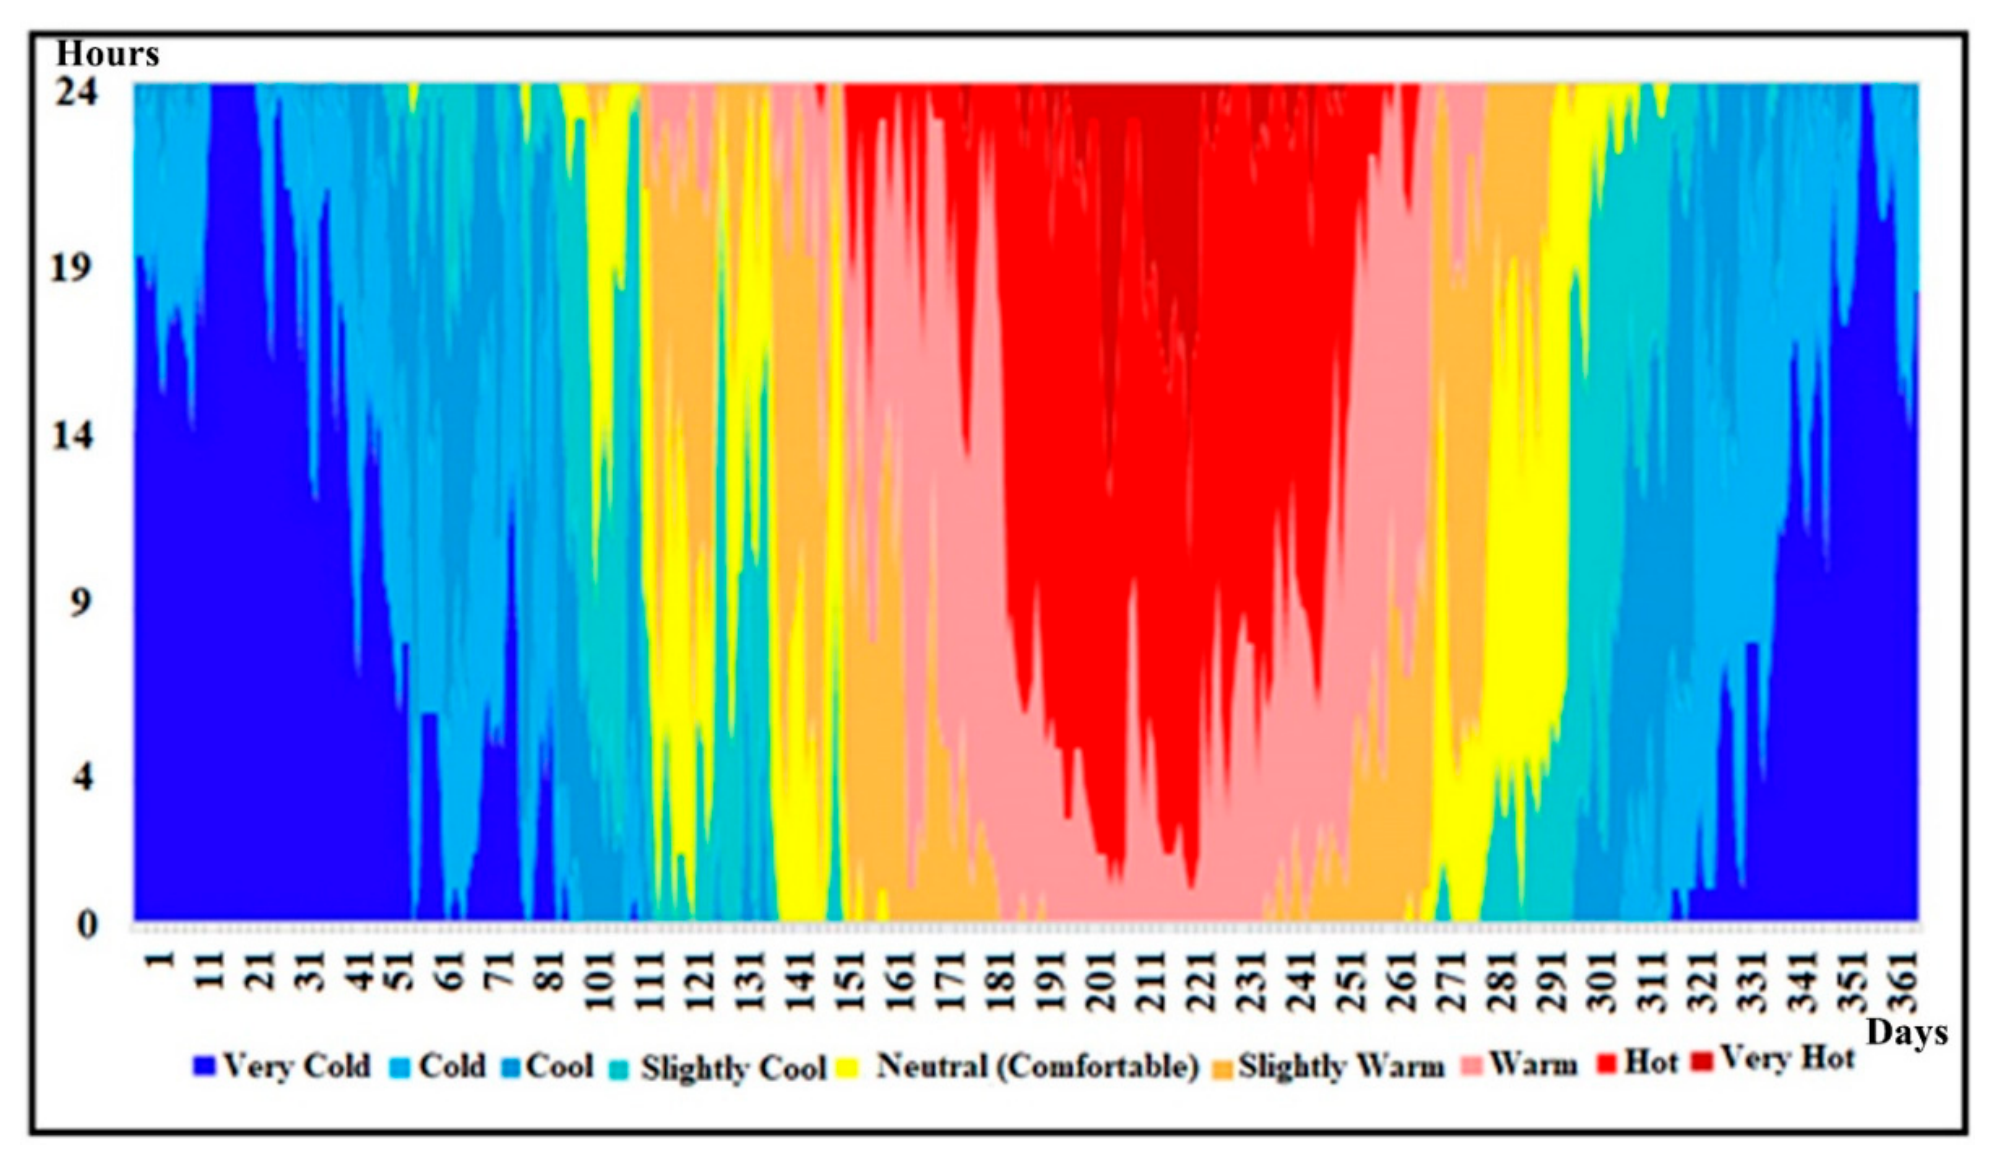
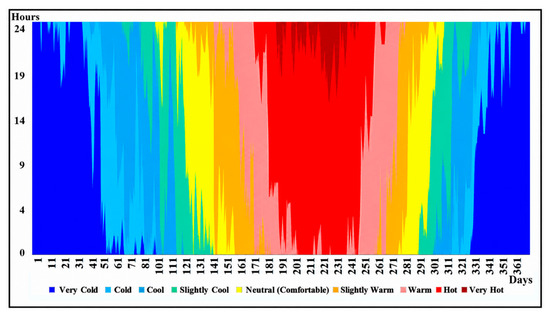
An analysis of the 32-year dataset reveals an average Physiological Equivalent Temperature (PET) of 17.11 °C. Within this period, individuals experienced a wide range of thermal conditions, with the highest PET recorded at 45.40 °C—indicative of extreme heat stress—and the lowest at −6.21 °C, corresponding to extreme cold stress. Heat stress was most prevalent during the summer months, particularly between the 190th and 244th days of the year. In contrast, periods of extreme cold stress occurred primarily between the 1st and 50th days, and again from the 334th to the 365th days. Thermal comfort conditions were typically observed between the 118th and 273rd days, marking the most favorable period for human thermal perception within the annual cycle (Figure 10).
Figure 10.
PET chart from 1990 to 2022.
4.2. Evaulation of Feature Forecast Data
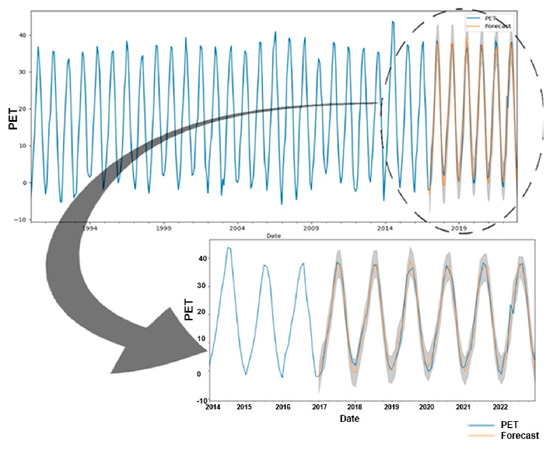
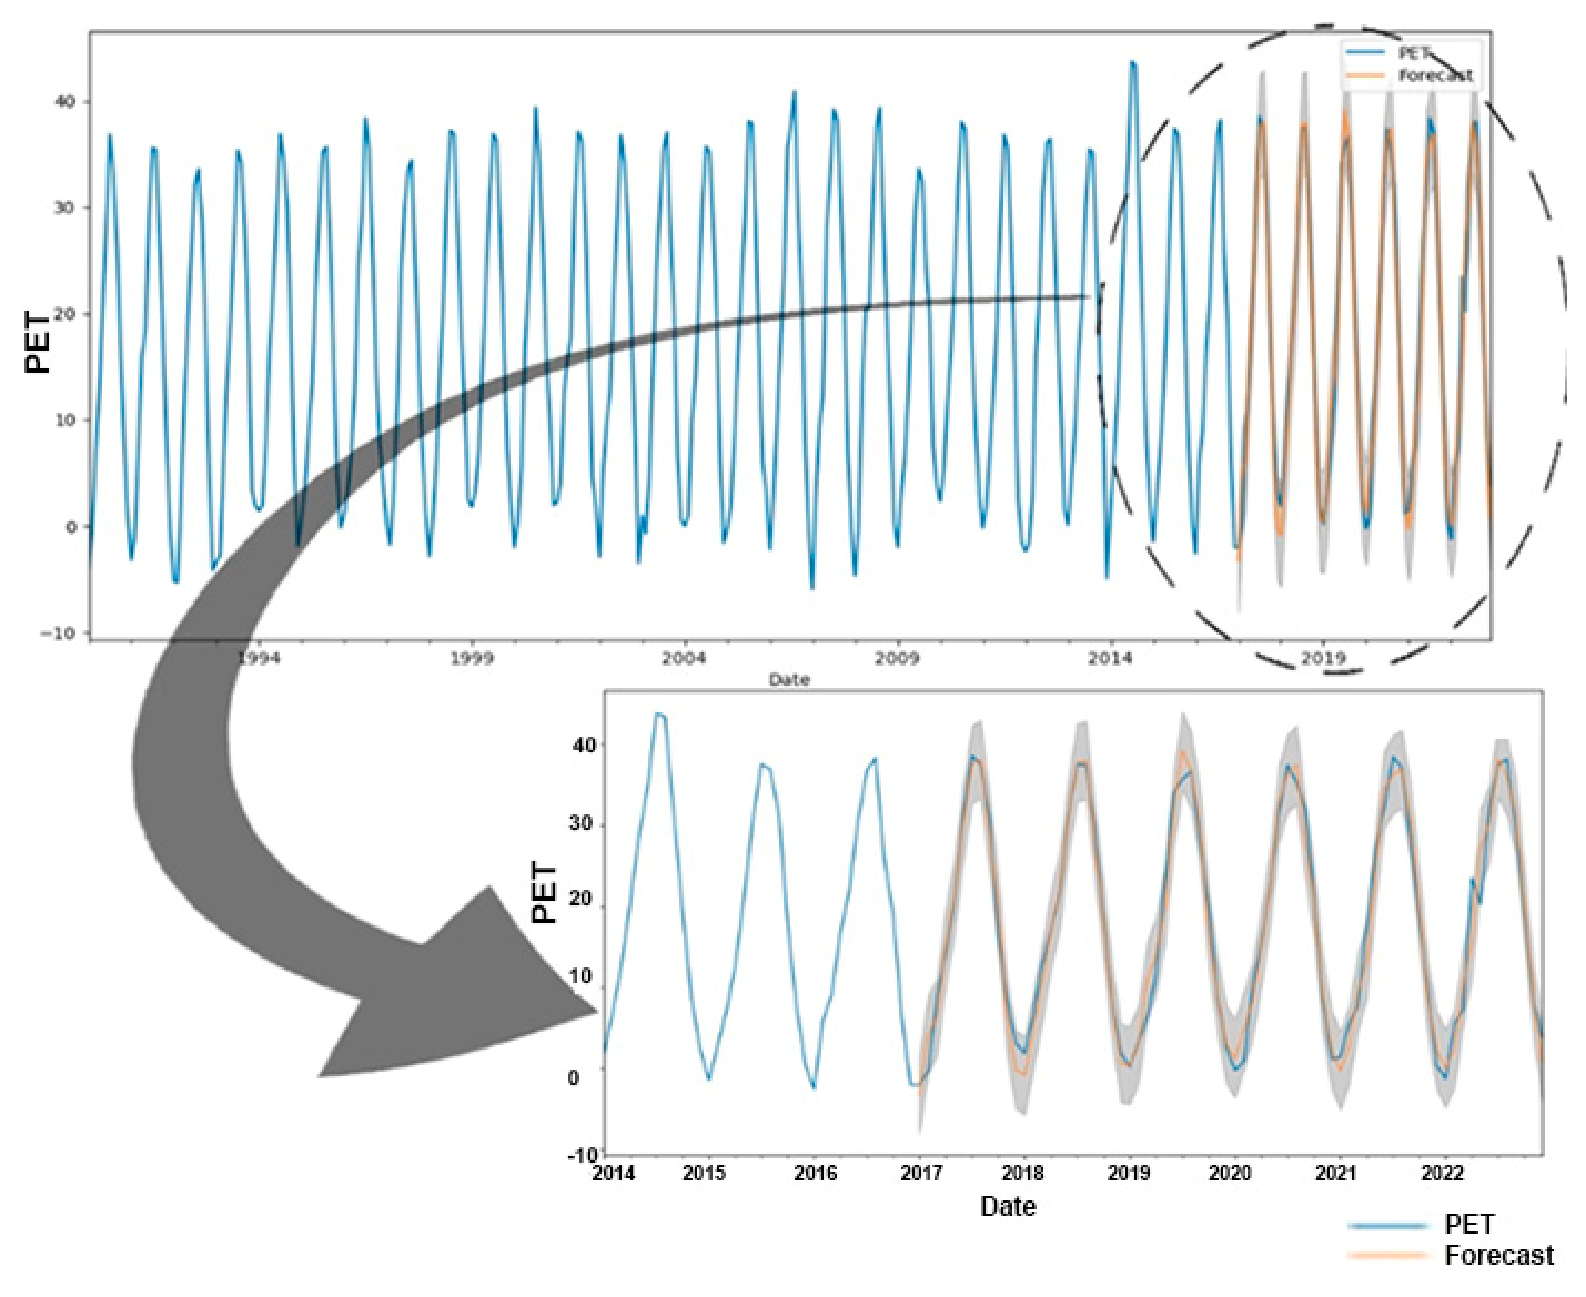
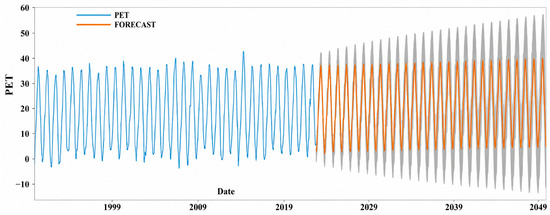
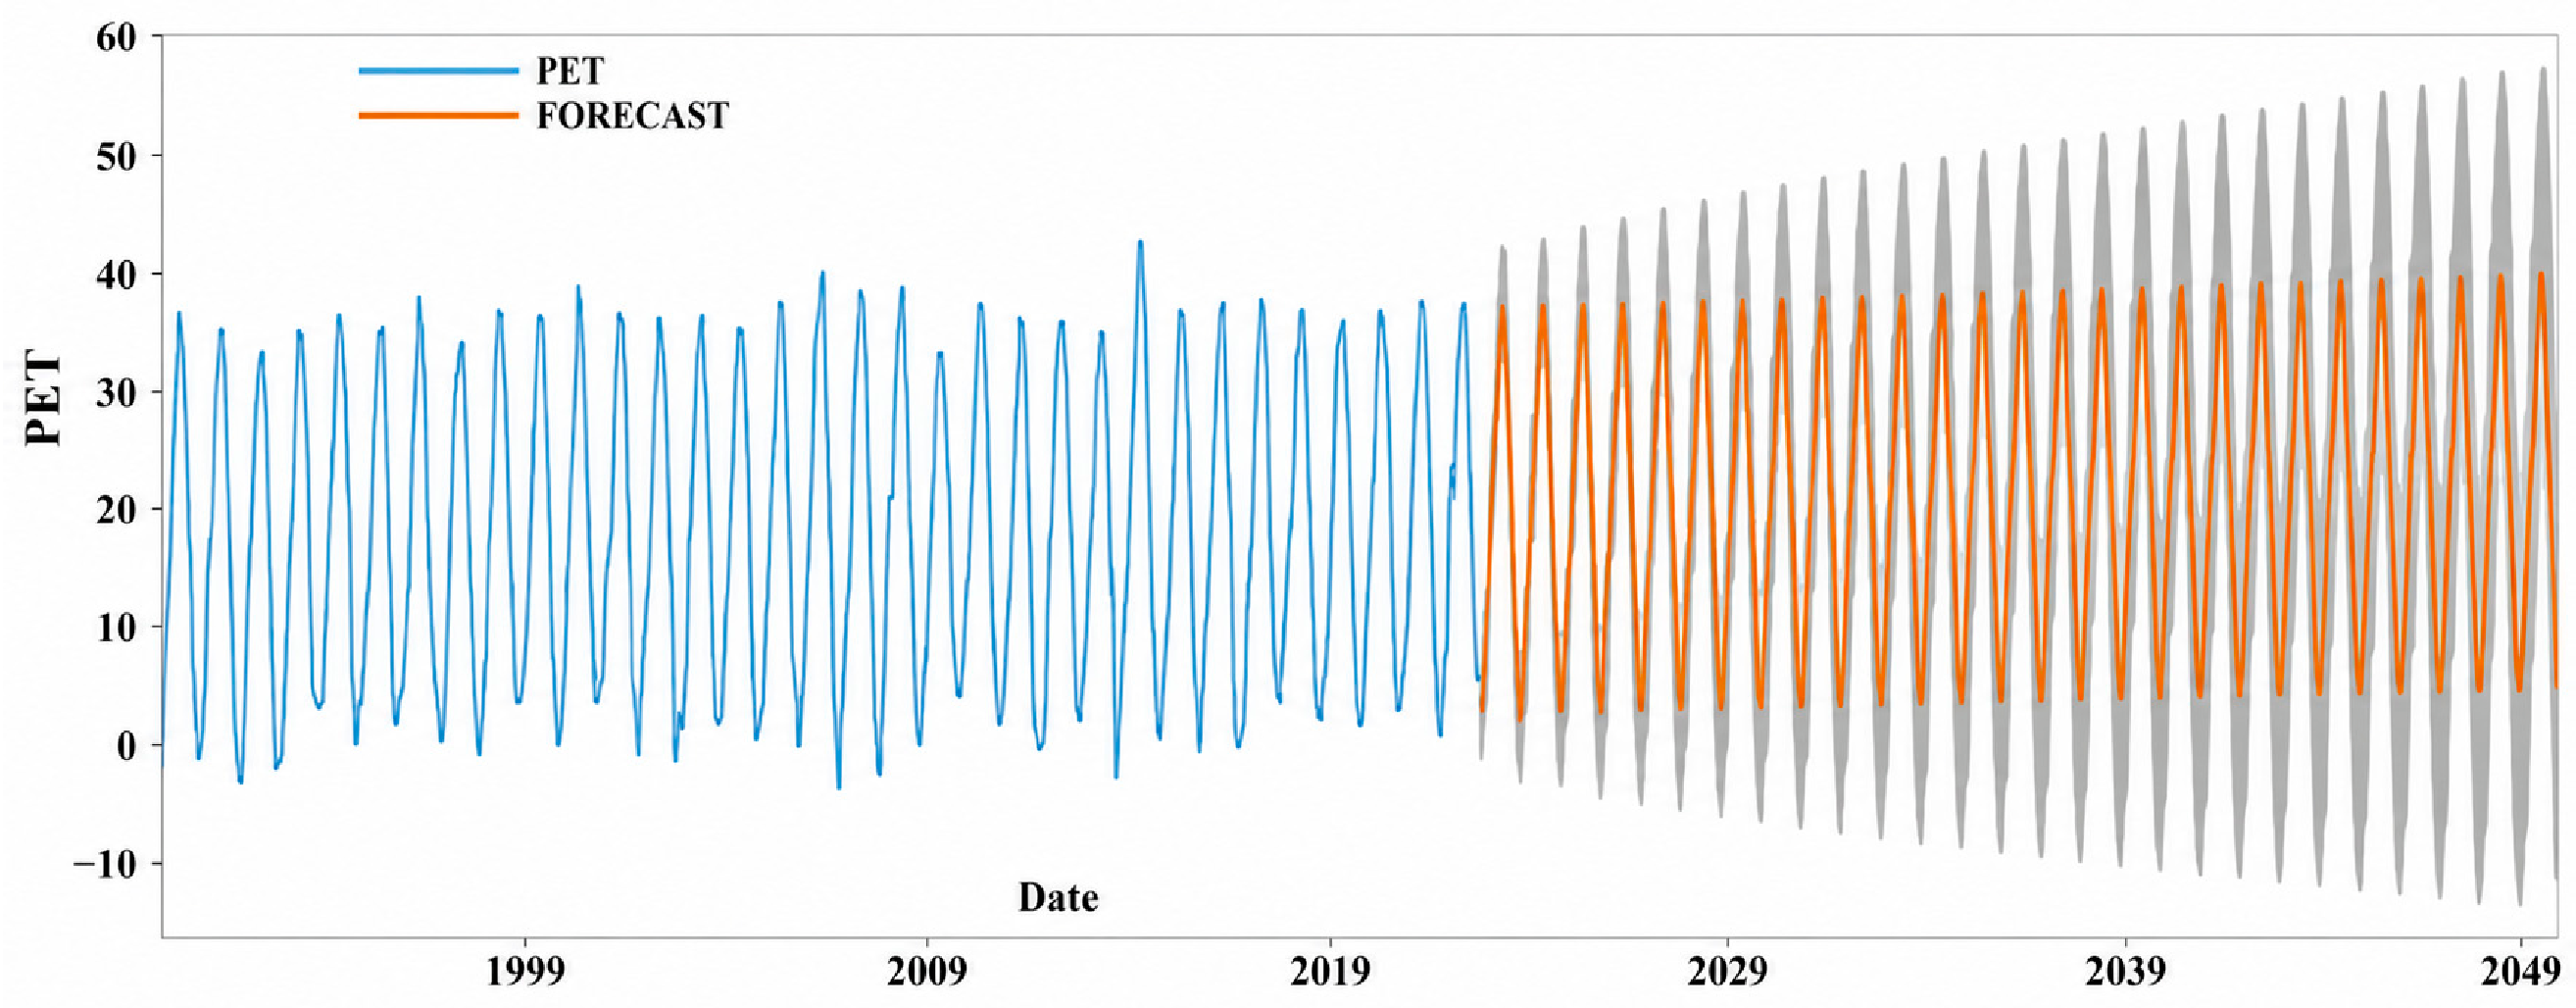
In the 32-year dataset, the SARIMAX forecasting model with automated parameter optimization allocated 60% of all data for training, 20% for validation, and 20% for testing. The data subsets were divided chronologically to preserve the temporal structure of the time series and prevent information leakage between training and testing phases (Figure 11). The model exhibited effective performance at these stages. During the testing phase, the final model achieved a Mean Absolute Percentage Error (MAPE) of 2.34%, indicating high forecasting accuracy for PET predictions. The 20% test data included in the study, along with the current data and the model’s predictions, are presented visually (Figure 11). The predicted values closely followed the observed PET series, demonstrating the model’s ability to capture both long-term trends and seasonal variability in Figure 11 and Figure 12.
Figure 11.
Distribution of data for the SARIMAX model.
Figure 12.
PET change graph between 1990 and 2050.
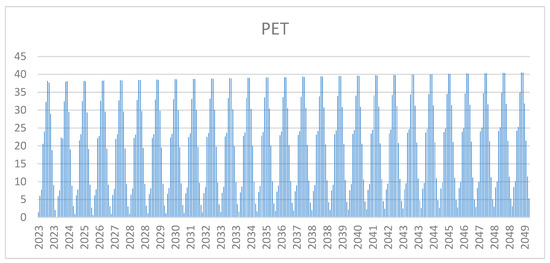
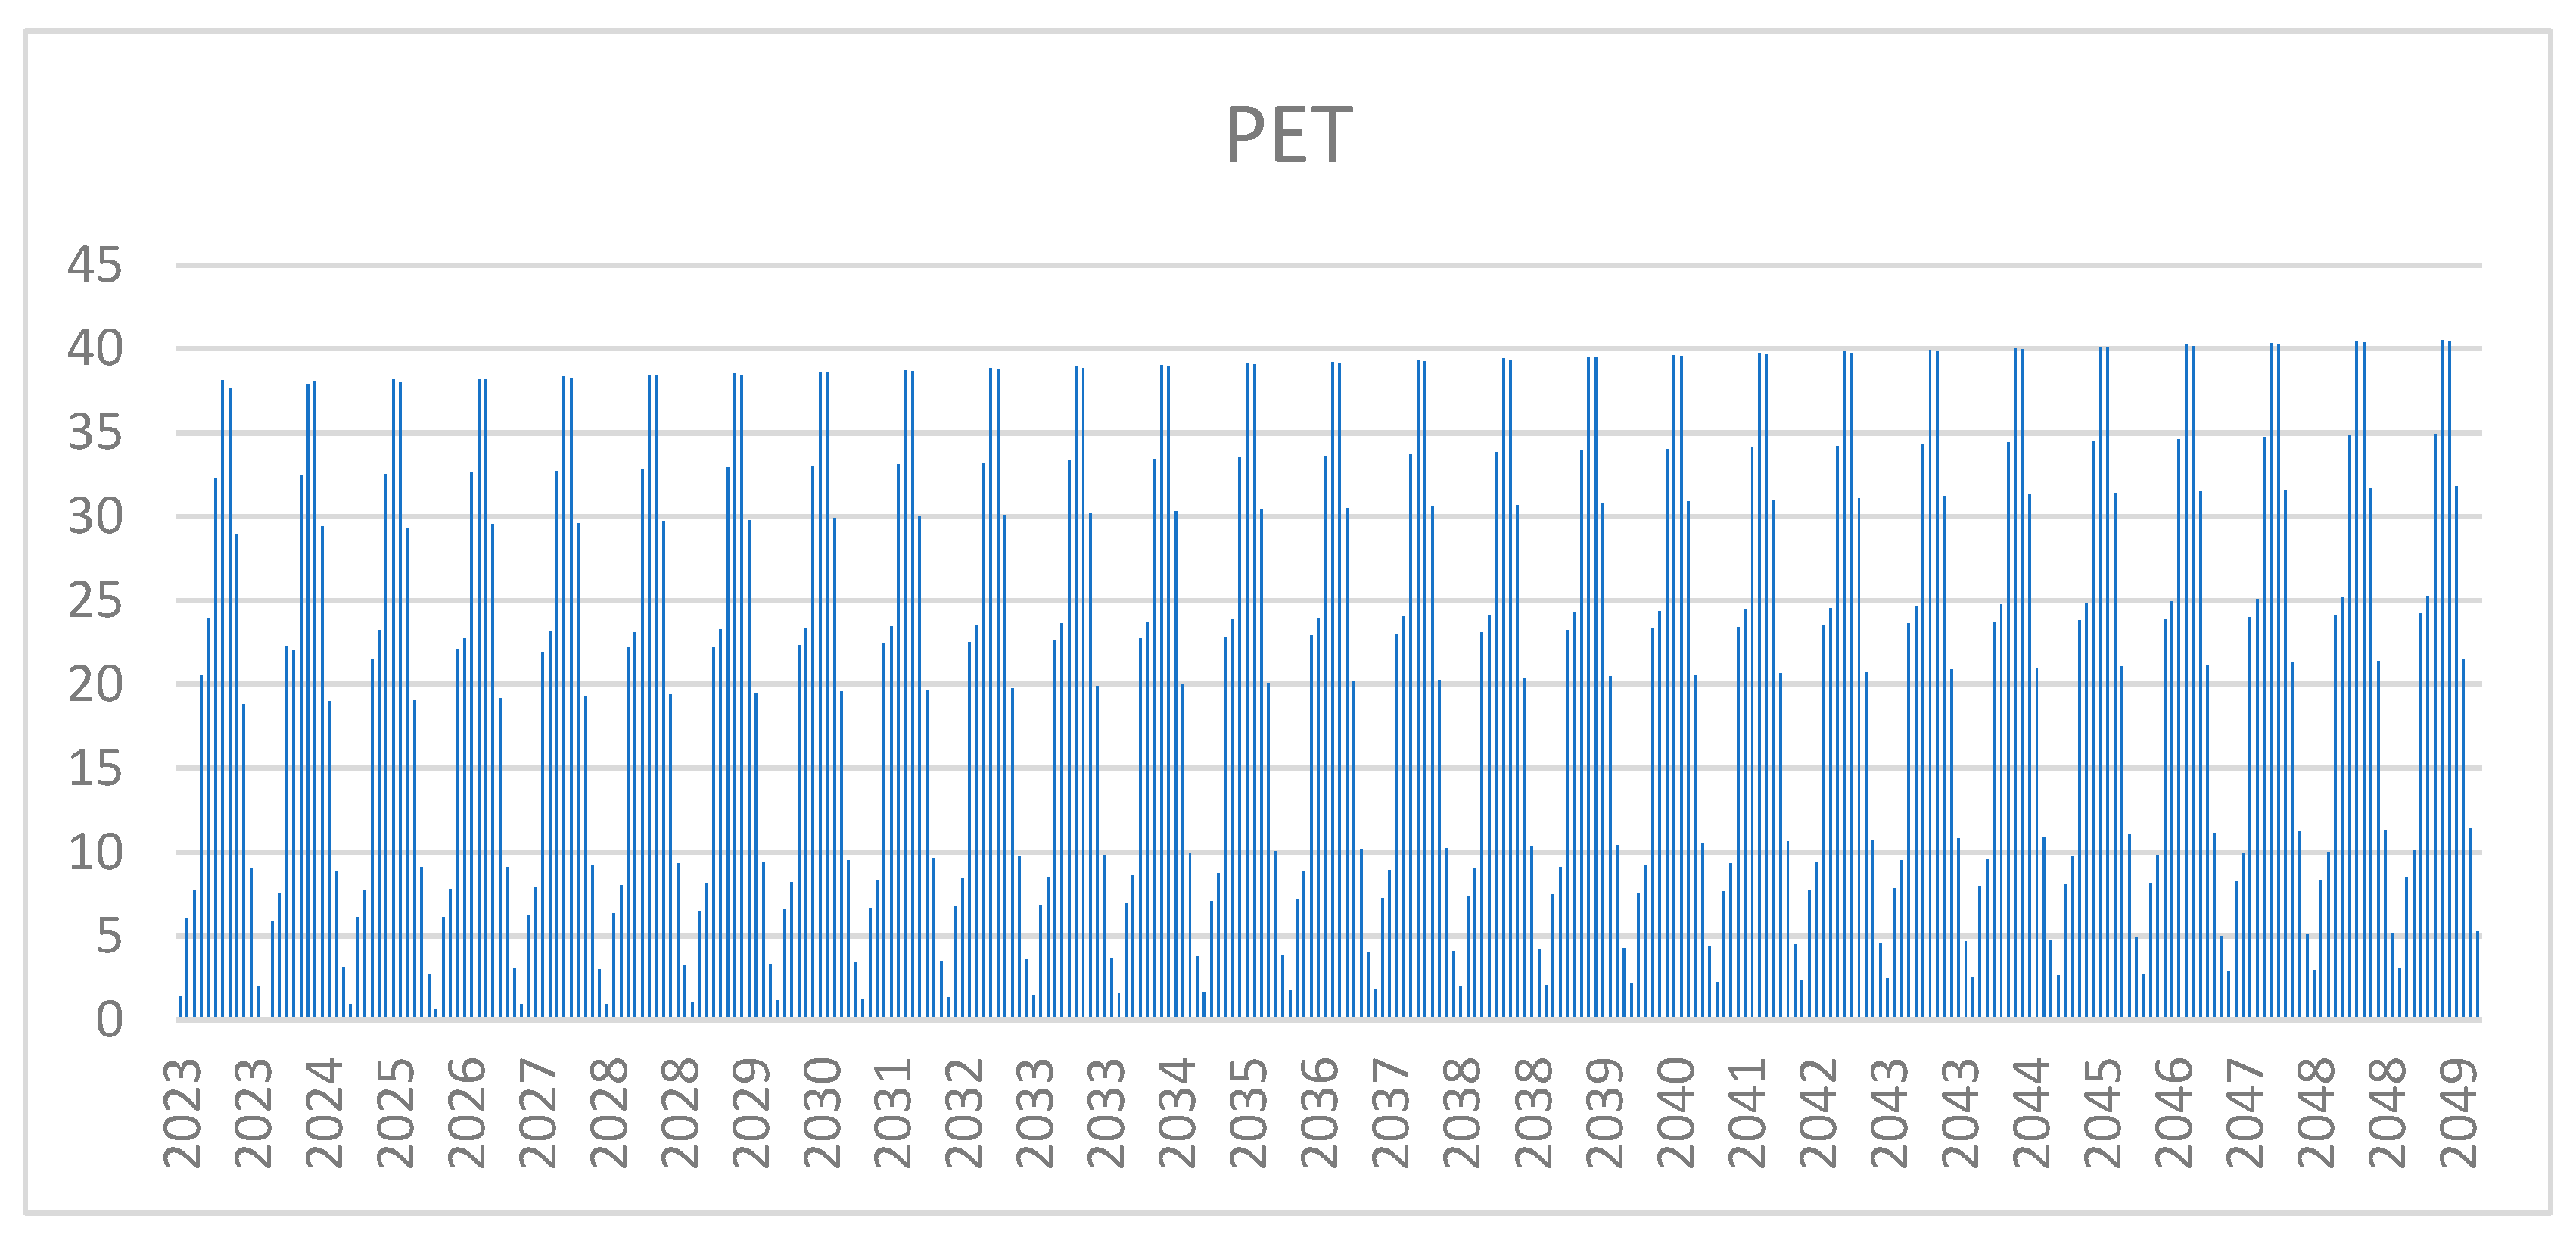
The average PET value is projected to be 20.12 °C during the period from 2023 to 2050. Compared with the historical average PET value of 17.11 °C for the period 1990–2022, this represents an increase of approximately 17.6%. Upon analyzing the actual data from 1990 to 2022, the PET value, initially at 17.11 °C, is estimated to increase by 17.59%, reaching 20.12 °C by 2050. In fact, the PET value, which stood at 15.58 °C between 1990 and 1995, experienced an 18.48% increase, reaching 18.46 °C between 2020 and 2002. Between 2023 and 2050, the maximum PET value of 40.52 °C is projected for July 2049. Although future mean PET values are expected to increase, projected extreme values remain lower than some historical extremes due to the smoothing characteristics of the SARIMAX forecasting framework and the statistical nature of long-term predictions. The minimum PET value of 0.07 °C is estimated in January 2024 (Figure 12 and Figure 13).
Figure 13.
PET change graph between 2023 and 2050.
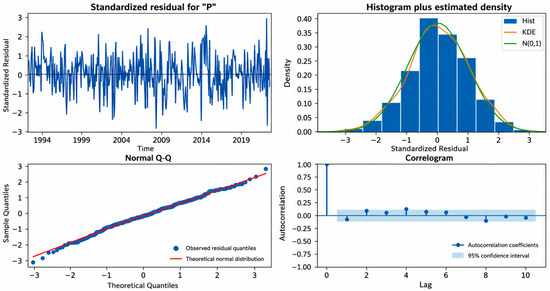
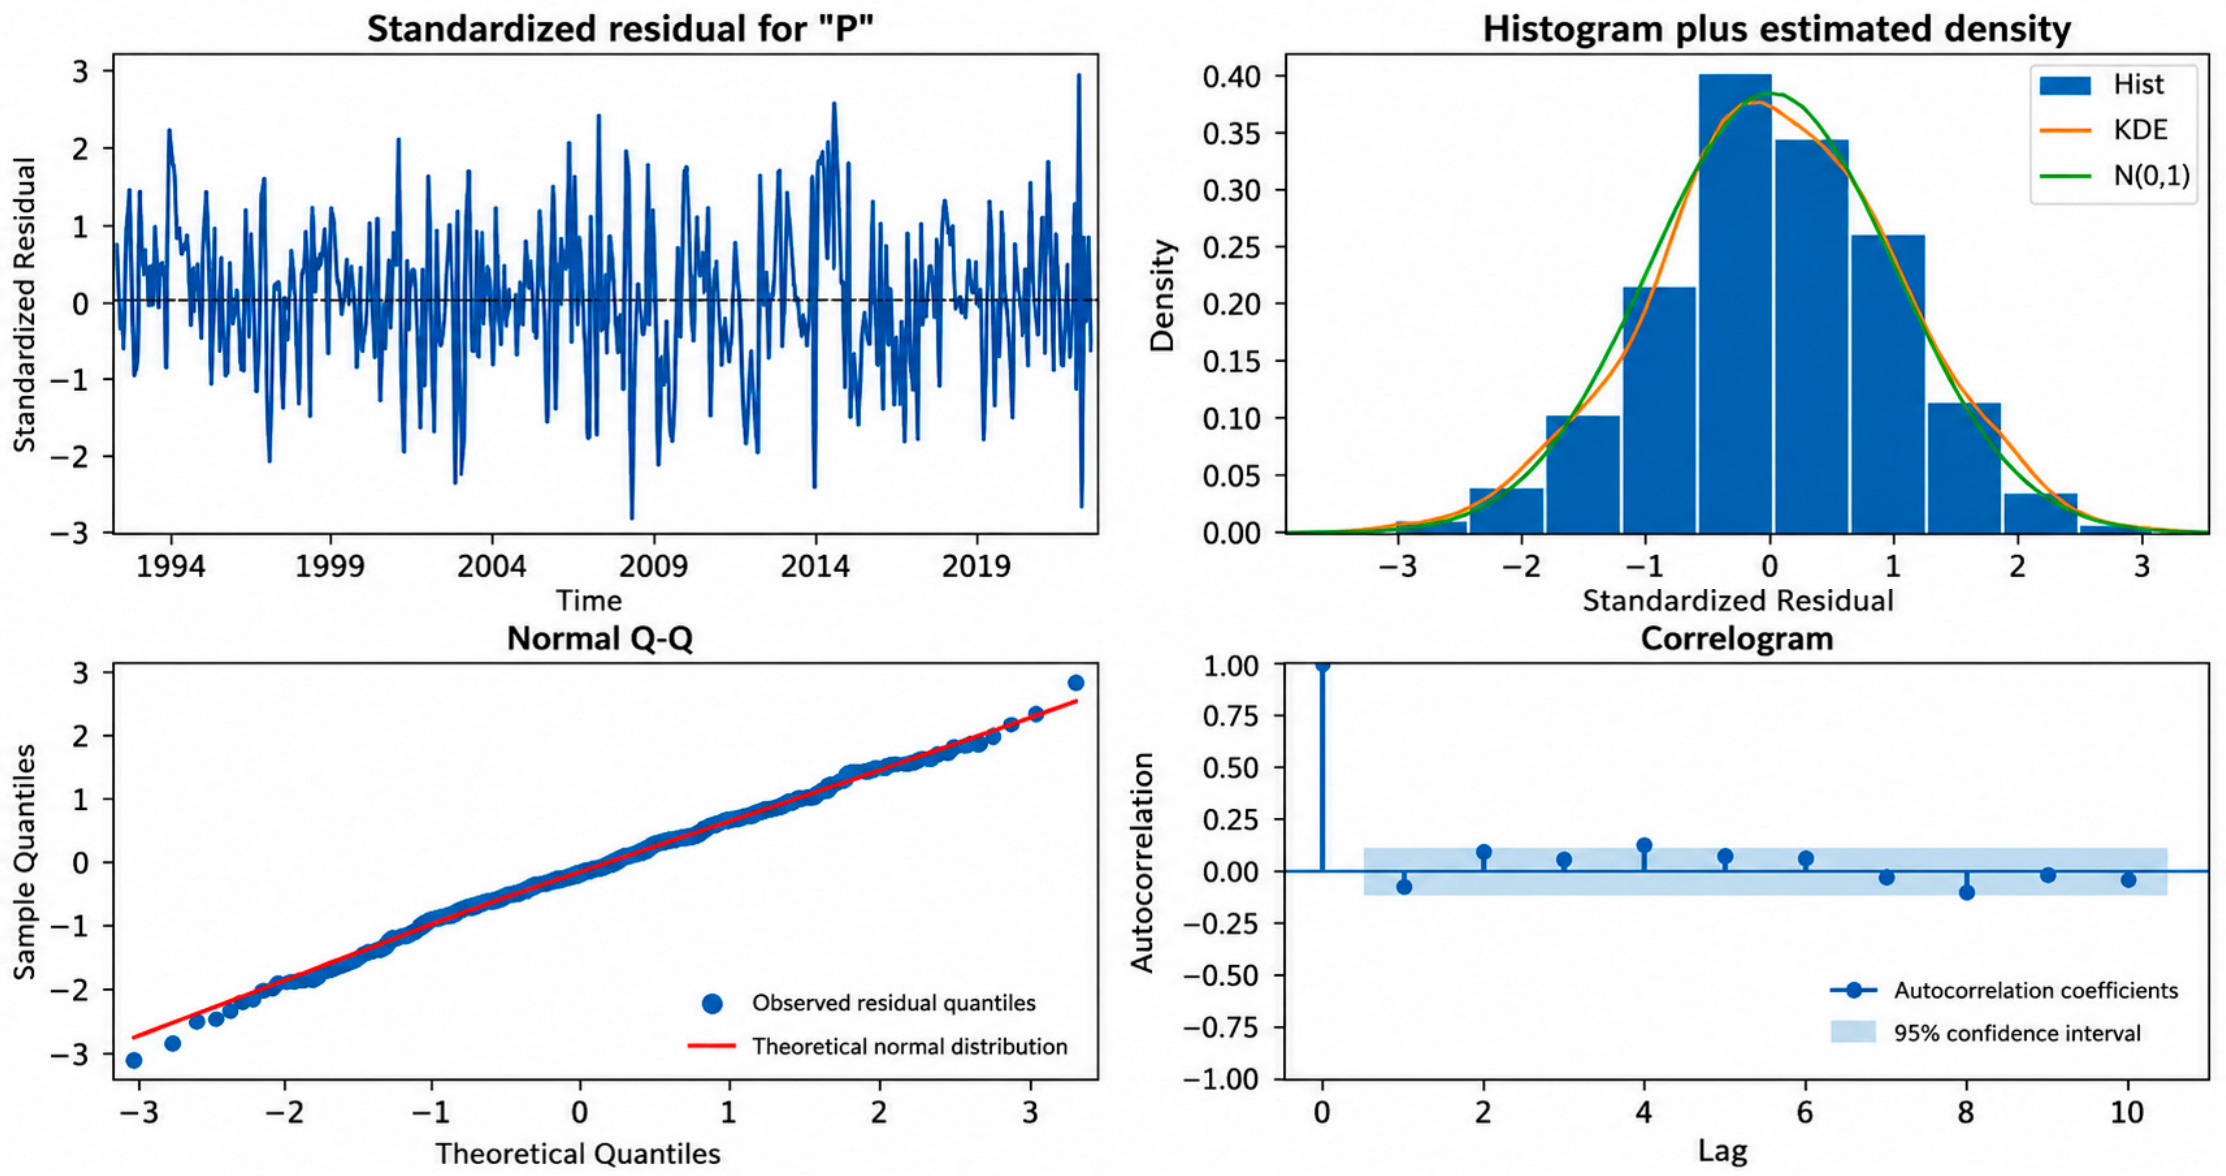
In this study, the SARIMAX method was employed, and results were obtained with an error margin of 2.34% in SARIMAX’s future predictions. Residual diagnostic analyses suggest no substantial deviations from normality, and the theoretical and observed distributions show good agreement. Furthermore, no pronounced outliers or systematic patterns were identified in the residual plots, supporting the adequacy of the model fit in Figure 14.
Figure 14.
Statistical evaluations of datasets.
5. Discussion
Human bioclimatic comfort has traditionally been assessed using simple indicators such as air temperature and humidity combined with subjective evaluations [5]. Over time, more advanced thermal comfort indices such as Physiological Equivalent Temperature (PET) [8], Apparent Temperature [56,57], Predicted Mean Vote (PMV) [58], and Standard Effective Temperature (SET) [59,60] were developed to integrate multiple meteorological and physiological parameters [4]. Among these, PET is particularly suitable for outdoor environments, especially in dry climates like Diyarbakır, as it expresses thermal conditions in degrees Celsius and incorporates key variables including air temperature, humidity, wind speed, radiation, clothing, and metabolic activity [8,46,61].
The research indicates a substantial rise in PET values in Diyarbakır during the study duration. The noted rise signifies a progressive decline in outdoor thermal comfort and an escalation in heat stress exposure. Comparable patterns have been observed in other semi-arid and swiftly urbanizing cities, where climate change and urban heat island effects collectively exacerbate thermal stress levels. PET is widely recognized as a comprehensive biometeorological index that effectively represents human thermal perception under outdoor conditions. Previous studies confirm that meteorological variables such as temperature, humidity, wind speed, and cloud cover directly influence PET and human thermal stress levels [46,62,63]. In the present study, between 1990 and 2022, air temperature increased by 0.6 °C and humidity by 3%, while wind speed and cloud cover remained relatively stable, resulting in a 0.19 °C rise in PET in Diyarbakır. These results are consistent with previous research highlighting the sensitivity of PET to climate variability. Recent literature emphasizes PET as a robust tool for assessing long-term bioclimatic comfort, particularly in urban environments. Earlier foundational studies by Matzarakis et al. (1999) and Höppe (1999) established its theoretical basis [8,46], while more recent studies have applied PET to urban form and green infrastructure analysis [64]. However, most previous work has been limited to seasonal or static assessments, whereas this study provides a long-term (32-year) and predictive analysis, extending up to 2050.
Methodologically, this research contributes by applying a SARIMAX-based time-series forecasting framework with automated parameter optimization based on AIC minimization. While SARIMAX provides stable short- and medium-term forecasting [65,66], hybrid approaches can improve prediction accuracy compared to standalone statistical models. Research indicates that SARIMAX can yield competitive forecasting performance relative to more complex approaches while maintaining greater interpretability and computational efficiency. Machine learning approaches, including Random Forest and LSTM models, have been widely used, particularly in contexts characterized by high volatility and non-stationary data [67,68]. In this study, the model achieved a low forecasting error (~2.34%), demonstrating strong predictive performance compared to conventional approaches. The SARIMAX model exhibited commendable predictive accuracy with a comparatively minimal prediction error. The model effectively identified long-term temporal trends and seasonality within the PET dataset. SARIMAX provides an interpretable and computationally efficient framework for long-term time-series forecasting, in contrast to more intricate deep learning methodologies. Nonetheless, certain limits must be acknowledged. The analysis is predicated on observations from a solitary meteorological station situated in the urban region of Diyarbakır. Thus, the findings predominantly illustrate local urban climate conditions and may not entirely capture the spatial heterogeneity throughout the region. The forecasting model relies on historical PET measurements and does not explicitly include greenhouse gas emission scenarios, land-use change estimates, or outputs from regional climate models. Consequently, the anticipated values should be seen as statistical forecasts based on past patterns rather than definitive climate change predictions. Third, the uncertainty of long-term forecasting always escalates with the extension of the prediction horizon. Extreme phenomena, including forthcoming heat waves, extended droughts, or abrupt climatic shifts, may not be adequately captured by the SARIMAX model. As a result, future PET values may deviate from the projections outlined in this study.
Previous studies have mainly focused on general climate variables under SSP/RCP scenarios [69,70], whereas PET-based forecasting remains limited. The results of this study indicate that PET increases more rapidly than air temperature alone, particularly in arid and densely urbanized regions such as Diyarbakır, due to combined effects of urban heat island formation, reduced vegetation, and altered wind flow. Similar findings regarding the influence of urban morphology on thermal comfort have been reported in earlier studies [71,72].
Urban expansion in Diyarbakır, including increased built-up areas between 1990 and 2018, may have contributed to the observed rise in thermal stress. However, because urban morphology variables were not explicitly incorporated into the forecasting model, this relationship should be interpreted as an association rather than direct causation. The results show an overall PET increase of approximately 38.9% during the study period, with projections indicating further increases up to 2050 (21.42 °C). This aligns with literature suggesting that semi-arid cities in mid-latitude regions are particularly vulnerable to intensified heat stress under climate change [73,74].
From a health perspective, rising PET values are associated with increased risks of heat stress, cardiovascular strain, and reduced outdoor activity [75,76]. The study also indicates a decreasing number of thermally comfortable days during summer, which may negatively affect both public health and social activity. Similar impacts on well-being and outdoor behavior have been reported in previous studies [77,78].
Compared with earlier works focusing on seasonal PET variability or scenario-based projections [79], this study provides continuous hourly analysis and long-term forecasting, offering a more detailed temporal understanding of thermal comfort dynamics. While most studies rely on air temperature-based projections [80,81,82], the present results demonstrate that PET offers a more realistic representation of human thermal stress because it integrates multiple environmental drivers.
Although machine learning models such as LSTM have been used in climate forecasting [83,84,85], they often require large datasets and complex tuning. In contrast, the SARIMAX-based hybrid approach used here provides a balance between interpretability and accuracy for long-term hourly PET data.
Finally, the findings highlight the strong influence of urban morphology, land cover change, and loss of green spaces on increasing PET values [2,71,72]. Traditional urban design elements such as narrow streets, courtyards, and shading structures may provide effective mitigation strategies [64,86]. Overall, the study emphasizes that rising thermal stress in Diyarbakır has significant implications for urban planning, public health, and energy demand, and it demonstrates the importance of integrating machine learning based forecasting into climate adaptation strategies.
Although the SARIMAX model demonstrated strong predictive performance, uncertainty inevitably increases with forecast horizon. Therefore, PET projections beyond the calibration period should be interpreted as statistical extrapolations of historical patterns rather than deterministic climate projections. Future studies may improve forecast reliability by integrating greenhouse gas emission scenarios, regional climate model outputs, and land-use change projections.
6. Conclusions
This study presents a data-driven analysis of long-term and future bioclimatic comfort trends in Diyarbakır, Türkiye, using 32 years of meteorological observations combined with a SARIMAX model with automated parameter optimization. The results indicate that the average PET value increased from 17.11 °C during the historical period (1990–2022) to a projected average of 20.12 °C during the forecast period extending to 2050, corresponding to an increase of approximately 17.6%. The findings reveal a transition from moderate thermal comfort conditions toward more frequent and prolonged heat stress, particularly in summer. Although cold stress conditions persist during winter, the intensity and duration of heat extremes have increased, leading to more persistent summer discomfort. The SARIMAX model demonstrates strong predictive performance, with a low Mean Absolute Percentage Error (MAPE) of 2.34%, confirming its reliability for PET forecasting. Urban expansion in Diyarbakır, including increased built-up areas, reduced green spaces, and disrupted wind circulation, may have contributed to rising PET values and intensified urban heat island effects. Unlike previous studies focused on short-term or seasonal assessments, this research provides long-term and annual-scale projections, supporting more informed urban planning and policy development. The study also highlights the relationship between PET and energy systems, particularly solar energy performance, as meteorological factors such as wind speed and humidity influence both thermal comfort and photovoltaic efficiency. These interactions are important for future energy and urban infrastructure planning in warming cities. To mitigate increasing thermal stress, climate-resilient urban strategies are necessary, including improved wind circulation through urban design, expansion of vegetation and shade-providing green infrastructure, use of reflective and permeable materials, and increased green open spaces.
In conclusion, PET is a valuable biometeorological indicator for assessing human thermal comfort and supporting climate-sensitive urban planning. The findings demonstrate a gradual increase in thermal stress conditions in Diyarbakır and highlight the importance of integrating long-term PET forecasting into urban adaptation and public health strategies. Nevertheless, future projections should be interpreted within the limitations of statistical forecasting and validated using climate scenario-based approaches in future research.
The results emphasize the need for integrated climate adaptation strategies to ensure livable and resilient urban environments in Diyarbakır and other cities facing similar climate and urbanization pressures.
Author Contributions
Conceptualization, A.K. and M.U.; methodology, A.K., M.U. and S.Ş.D.; software, A.K. and M.K.; validation, A.K., M.U., S.Ş.D., M.K., G.Ş. and E.A.; formal analysis, A.K. and M.K.; investigation, A.K., M.U. and S.Ş.D.; resources, G.Ş. and E.A.; data curation, A.K. and M.K.; writing—original draft preparation, A.K.; writing—review and editing, A.K., M.U., S.Ş.D., M.K., G.Ş. and E.A.; visualization, M.K.; supervision, M.U. and E.A.; project administration, M.U.; funding acquisition, Not applicable. All authors have read and agreed to the published version of the manuscript.
Funding
This research was conducted without any funding sources.
Institutional Review Board Statement
Ethical approval was not required for this study as it does not involve human or animal subjects requiring formal review.
Informed Consent Statement
This article does not require informed consent.
Data Availability Statement
The data are available from the corresponding author upon reasonable request due to restrictions related to privacy, legal, or ethical considerations.
Acknowledgments
The authors would like to thank all individuals who contributed indirectly to this work.
Conflicts of Interest
The authors declare no conflicts of interest.
References
- Chen, T.-H.; Li, X.; Zhao, J.; Zhang, K. Impacts of Cold Weather on All-Cause and Cause-Specific Mortality in Texas, 1990–2011. Environ. Pollut. 2017, 225, 244–251. [Google Scholar] [CrossRef] [PubMed]
- Koç, A.; Caf, A.; Koç, C.; Kejanli, D.T. Examining the Temporal and Spatial Distribution of Potential Urban Heat Island Formations. Environ. Sci. Pollut. Res. 2022, 29, 11455–11468. [Google Scholar]
- Yilmaz, S.; Yilmaz, H.; Irmak, M.A.; Kuzulugil, A.C.; Koç, A. Effects of Urban Pinus sylvestris (L.) Plantation Sites on Thermal Comfort. In Proceedings of the International Symposium on Greener Cities for More Efficient Ecosystem Services in a Climate Changing World 1215; ISHS: Leuven, Belgium, 2017; pp. 39–44. [Google Scholar]
- Baruch, G. Man, Climate, and Architecture; Elsevier Architectural Science Series; Elsevier: Amsterdam, The Netherlands, 1977. [Google Scholar]
- Daneshvar, M.R.M.; Bagherzadeh, A.; Tavousi, T. Assessment of Bioclimatic Comfort Conditions Based on Physiologically Equivalent Temperature (PET) Using the RayMan Model in Iran. Cent. Eur. J. Geosci. 2013, 5, 53–60. [Google Scholar] [CrossRef]
- Matzarakis, A.; Fröhlich, D.; Bermon, S.; Adami, P.E. Quantifying Thermal Stress for Sport Events—The Case of the Olympic Games 2020 in Tokyo. Atmosphere 2018, 9, 479. [Google Scholar] [CrossRef]
- Çağlak, S.; Matzarakis, A. Evaluation of the Relationship between Thermal Comfort Conditions and Respiratory Diseases in Amasya City, Turkey. J. Public Health 2024, 32, 967–977. [Google Scholar] [CrossRef] [PubMed]
- Höppe, P. The Physiological Equivalent Temperature–a Universal Index for the Biometeorological Assessment of the Thermal Environment. Int. J. Biometeorol. 1999, 43, 71–75. [Google Scholar] [CrossRef] [PubMed]
- Mayer, H.; Höppe, P. Thermal Comfort of Man in Different Urban Environments. Theor. Appl. Climatol. 1987, 38, 43–49. [Google Scholar] [CrossRef]
- Alawadhi, E.M. Thermal Comfort Analyses on Jogging Trails: The Effect of Trail Direction and Tree Shading on Trial Surface and Physiological Equivalent Temperatures. J. Therm. Biol. 2022, 110, 103358. [Google Scholar] [CrossRef] [PubMed]
- Lam, C.K.C.; Hang, J.; Zhang, D.; Wang, Q.; Ren, M.; Huang, C. Effects of Short-Term Physiological and Psychological Adaptation on Summer Thermal Comfort of Outdoor Exercising People in China. Build. Environ. 2021, 198, 107877. [Google Scholar] [CrossRef]
- Liu, Y.; Lai, Y.; Jiang, L.; Cheng, B.; Tan, X.; Zeng, F.; Liang, S.; Xiao, A.; Shang, X. A Study of the Thermal Comfort in Urban Mountain Parks and Its Physical Influencing Factors. J. Therm. Biol. 2023, 118, 103726. [Google Scholar] [CrossRef] [PubMed]
- López-Escamilla, Á.; Herrera-Limones, R.; León-Rodríguez, Á.L. Evaluation of Environmental Comfort in a Social Housing Prototype with Bioclimatic Double-Skin in a Tropical Climate. Build. Environ. 2022, 218, 109119. [Google Scholar] [CrossRef]
- Nouri, A.S.; Charalampopoulos, I.; Matzarakis, A. The Application of the Physiologically Equivalent Temperature to Determine Impacts of Locally Defined Extreme Heat Events within Vulnerable Dwellings during the 2020 Summer in Ankara. Sustain. Cities Soc. 2022, 81, 103833. [Google Scholar] [CrossRef]
- Widera, B. Comparative Analysis of User Comfort and Thermal Performance of Six Types of Vernacular Dwellings as the First Step towards Climate Resilient, Sustainable and Bioclimatic Architecture in Western Sub-Saharan Africa. Renew. Sustain. Energy Rev. 2021, 140, 110736. [Google Scholar] [CrossRef]
- Zhang, S.; Zhang, X.; Niu, D.; Fang, Z.; Chang, H.; Lin, Z. Physiological Equivalent Temperature-Based and Universal Thermal Climate Index-Based Adaptive-Rational Outdoor Thermal Comfort Models. Build. Environ. 2023, 228, 109900. [Google Scholar] [CrossRef]
- Jordan, M.I.; Mitchell, T.M. Machine Learning: Trends, Perspectives, and Prospects. Science 2015, 349, 255–260. [Google Scholar] [CrossRef] [PubMed]
- Shaveta, A. Review on Machine Learning. Int. J. Sci. Res. Arch. 2023, 9, 281–285. [Google Scholar] [CrossRef]
- Yang, J.H.; Wright, S.N.; Hamblin, M.; McCloskey, D.; Alcantar, M.A.; Schrübbers, L.; Lopatkin, A.J.; Satish, S.; Nili, A.; Palsson, B.O.; et al. A White-Box Machine Learning Approach for Revealing Antibiotic Mechanisms of Action. Cell 2019, 177, 1649–1661.e9. [Google Scholar] [CrossRef] [PubMed]
- Devi, R.M.; Patasaraiya, M.K.; Sinha, B.; Saran, S.; Dimri, A.P.; Jaiswal, R. Understanding the Linkages between Climate Change and Forest. Curr. Sci. 2018, 114, 987–996. [Google Scholar] [CrossRef]
- Mudelsee, M. Trend Analysis of Climate Time Series: A Review of Methods. Earth. Sci. Rev. 2019, 190, 310–322. [Google Scholar] [CrossRef]
- Murray, N.J.; Keith, D.A.; Bland, L.M.; Ferrari, R.; Lyons, M.B.; Lucas, R.; Pettorelli, N.; Nicholson, E. The Role of Satellite Remote Sensing in Structured Ecosystem Risk Assessments. Sci. Total Environ. 2018, 619, 249–257. [Google Scholar] [CrossRef] [PubMed]
- Rhein, M. Taking a Close Look at Ocean Circulation. Science 2019, 363, 456–457. [Google Scholar] [CrossRef] [PubMed]
- Wang, C.; Wang, Z.; Kong, Y.; Zhang, F.; Yang, K.; Zhang, T. Most of the Northern Hemisphere Permafrost Remains under Climate Change. Sci. Rep. 2019, 9, 3295. [Google Scholar] [CrossRef] [PubMed]
- Ponsero, A.J.; Hurwitz, B.L. The Promises and Pitfalls of Machine Learning for Detecting Viruses in Aquatic Metagenomes. Front. Microbiol. 2019, 10, 806. [Google Scholar] [CrossRef] [PubMed]
- Zhu, X.X.; Tuia, D.; Mou, L.; Xia, G.-S.; Zhang, L.; Xu, F.; Fraundorfer, F. Deep Learning in Remote Sensing: A Comprehensive Review and List of Resources. IEEE Geosci. Remote Sens. Mag. 2017, 5, 8–36. [Google Scholar] [CrossRef]
- Mosavi, A.; Ozturk, P.; Chau, K. Flood Prediction Using Machine Learning Models: Literature Review. Water 2018, 10, 1536. [Google Scholar] [CrossRef]
- Ghimire, S.; Deo, R.C.; Casillas-Pérez, D.; Salcedo-Sanz, S. Boosting Solar Radiation Predictions with Global Climate Models, Observational Predictors and Hybrid Deep-Machine Learning Algorithms. Appl. Energy 2022, 316, 119063. [Google Scholar] [CrossRef]
- Li, Q.; Wang, W.; Yu, Z.; Chen, J. Assessing Urban Micro-Climates with Vertical and Horizontal Building Morphological Cutting Deep Transfer Learning Neural Networks. Build. Environ. 2023, 234, 110186. [Google Scholar] [CrossRef]
- Nam, K.J.; Li, Q.; Heo, S.K.; Tariq, S.; Loy-Benitez, J.; Woo, T.Y.; Yoo, C.K. Inter-Regional Multimedia Fate Analysis of PAHs and Potential Risk Assessment by Integrating Deep Learning and Climate Change Scenarios. J. Hazard. Mater. 2021, 411, 125149. [Google Scholar] [CrossRef] [PubMed]
- Nguyen, D.T.; Ashraf, S.; Le, M.; Ali, M. Projection of Climate Variables by General Circulation and Deep Learning Model for Lahore, Pakistan. Ecol. Inform. 2023, 75, 102077. [Google Scholar] [CrossRef]
- Valipour, M.; Khoshkam, H.; Bateni, S.M.; Jun, C.; Band, S.S. Hybrid Machine Learning and Deep Learning Models for Multi-Step-Ahead Daily Reference Evapotranspiration Forecasting in Different Climate Regions across the Contiguous United States. Agric. Water Manag. 2023, 283, 108311. [Google Scholar] [CrossRef]
- Yu, W.; Yang, J.; Wu, F.; He, B.; Yu, H.; Ren, J.; Xiao, X.; Xia, J.C. Downscaling Mapping Method for Local Climate Zones from the Perspective of Deep Learning. Urban Clim. 2023, 49, 101500. [Google Scholar] [CrossRef]
- Demiryege, İ. Forecasting of Ionospheric Tec Variations by Deep Learning Method. MSc Thesis, Harran University, Sanlıurfa, Turkey, 2021. [Google Scholar]
- Demiryege, İ.; Ulukavak, M. Derin Öğrenme Tabanlı Iyonosferik TEC Tahmini. Geomatik 2022, 7, 80–87. [Google Scholar] [CrossRef]
- Zengin, A.O. Savran ve Akdere Akım Istasyon Verilerinin Derin Öğrenme Yöntemleri Kullanılarak Karşılaştırılması; Hasan Kalyoncu Üniversitesi: Gaziantep, Turkey, 2021. [Google Scholar]
- Turkish Statistical Institute (TUIK) Turkish Statistical Institute. Available online: https://data.tuik.gov.tr/ (accessed on 2 September 2024).
- Bulut, M. Diyarbakır’ın Portresi, 1st ed.; Detay Anatolia Akademik Yayincilik: Ankara, Turkey, 2022; Volume 1. [Google Scholar]
- Doğan, S.Ş.; Koç, A.; Şahin, G.; Sark, W.G.V. Impact of Different Vegetation Scenarios on Solar Power Plant Performance: An ENVI-Met and Machine Learning–Based Approach. Int. J. Energy Res. 2026, 2026, 4663626. [Google Scholar] [CrossRef]
- Çelik, M.; Yılmaz, H. Diyarbakır Kent Merkezi Termal Konforunun Belirlenmesi. Turk. J. Agric. Nat. Sci. 2023, 10, 770–780. [Google Scholar] [CrossRef]
- Olgyay, V. Design with Climate: Bioclimatic Approach to Architectural Regionalism; Princeton University Press: Princeton, NJ, USA, 2015. [Google Scholar]
- Abdulrahman Hamad, T.; Oğuz, H. Determining Thermal Comfort Zones for Outdoor Recreation Planning: A Case Study of Erbil–Iraq. Turk. J. For. Sci. 2020, 4, 133–145. [Google Scholar] [CrossRef]
- Ucer, H.B.; Tzortzi, J.N.; Lux, M.S.; Ogut, O. Sustainable Urban Landscapes in Hot–Dry Regions: Climate-Adaptive Courtyards. Land 2024, 13, 1035. [Google Scholar] [CrossRef]
- Talib, M.A.; Abaas, Z.R. Performative In Local Architecture, Marshes As A Model. Assoc. Arab Univ. J. Eng. Sci. 2020, 27, 94–121. [Google Scholar] [CrossRef]
- Zhang, X.; Ren, K.; Ding, X.; Gao, B. Modified Physiological Equivalent Temperature for Monitoring Heat Stress: 20-Year Data from the Falmouth Road Race. Int. J. Biometeorol. 2024, 69, 1529–1540. [Google Scholar]
- Matzarakis, A.; Mayer, H.; Iziomon, M.G. Applications of a Universal Thermal Index: Physiological Equivalent Temperature. Int. J. Biometeorol. 1999, 43, 76–84. [Google Scholar] [CrossRef] [PubMed]
- Çalişkan, O.; Türkoğlu, N.; Matzarakis, A. The Effects of Elevation on Thermal Bioclimatic Conditions in Uludağ (Turkey). Atmósfera 2013, 26, 45–57. [Google Scholar] [CrossRef][Green Version]
- Chen, Y.-C.; Matzarakis, A. Modified Physiologically Equivalent Temperature—Basics and Applications for Western European Climate. Theor. Appl. Climatol. 2018, 132, 1275–1289. [Google Scholar]
- Şensoy, S.; Türkoğlu, N.; Çiçek, İ.; Matzarakis, A. Antalya’nın Termal Konfor Özellikleri, Iklim Model Verileri Kullanılarak Gelecek Projeksiyonları ve Turizme Etkileri. Coğrafi Bilim. Derg. 2020, 18, 124–160. [Google Scholar]
- Cinar, İ.; Karakus, N.; Toy, S. Analysing Daytime Summer Thermal Comfort Conditions for Turkey’s Third Largest Tourism Destination. Environ. Sci. Pollut. Res. 2023, 30, 50046–50056. [Google Scholar] [CrossRef]
- Koç, A.; Şahin, G. Optimizing Wind Power Plant Locations: A GIS- Based Approach With Interval Type- 2 Fuzzy Risk Deviation Performance Index. Wind. Energy 2026, 29, e70134. [Google Scholar] [CrossRef]
- Matzarakis, A.; Rutz, F. RayMan: A Tool for Research and Education in Applied Climatology. In Proceedings of the 8th Conference on Meteorology Climatology-Atmospheric-Physicsathens, Athens, Greece, 24–26 May 2006; Available online: https://www.researchgate.net/publication/233759055_RayMan_A_TOOL_FOR_RESEARCH_AND_EDUCATION_IN_APPLIED_CLIMATOLOGY (accessed on 2 September 2024).
- Şahin, G.; Koç, A.; Doğan, S.Ş.; van Sark, W. Assessment of Wind Energy Potential and Optimal Site Selection for Wind Energy Plant Installations in Igdir/Turkey. Sustainability 2024, 16, 8775. [Google Scholar] [CrossRef]
- Matzarakis, A.; Rutz, F.; Mayer, H. Modelling Radiation Fluxes in Simple and Complex Environments—Application of the RayMan Model. Int. J. Biometeorol. 2007, 51, 323–334. [Google Scholar] [PubMed]
- Matzarakis, A.; Rutz, F.; Mayer, H. Modelling Radiation Fluxes in Simple and Complex Environments: Basics of the RayMan Model. Int. J. Biometeorol. 2010, 54, 131–139. [Google Scholar] [PubMed]
- Andrianajaina, T.; Razafimahefa, D.T.; Rakotoarijaina, R.; Haba, C.G. Grid Search for SARIMAX Parameters for Photovoltaic Time Series Modeling. Glob. J. Energy Technol. Res. Updates 2022, 9, 87–96. [Google Scholar] [CrossRef]
- Steadman, R.G. The Assessment of Sultriness. Part I: A Temperature-Humidity Index Based on Human Physiology and Clothing Science. J. Appl. Meteorol. Climatol. 1979, 18, 861–873. [Google Scholar] [CrossRef]
- Fanger, P.O. Thermal Comfort: Analysis and Applications in Environmental Engineering; Danish Technical Press: Copenhagen, Denmark, 1970. [Google Scholar]
- Gonzalez, R.R.; Gagge, A.P. Magnitude Estimates of Thermal Discomfort during Transients of Humidity and Operative Temperature and Their Relation to the New ASHRAE Effective Temperature (ET). ASHRAE Trans. 1973, 79, 88–96. [Google Scholar]
- Gagge, A.P.; Fobelets, A.P.; Berglund, L. A Standard Predictive Index of Human Response to the Thermal Environment; American Society of Heating, Refrigerating and Air-Conditioning Engineers: Peachtree Corners, GA, USA, 1986. [Google Scholar]
- Şahin, G.; Koç, A.; Doğan, S.S.; Rustemli, S.; van Sark, W.G. Exploring of Wind Energy Potential and Optimal Site Selection for Wind Energy Plants Installations in Erzurum/Turkey Based on Multicriteria Site Selection. Int. J. Energy Res. 2025, 2025, 2629977. [Google Scholar] [CrossRef]
- Almeida, D.P.; Resende, O.; Mendes, U.C.; Costa, L.M.; Corrêa, P.C.; Rocha, A.C. Influência Da Secagem Na Qualidade Fisiológica Do Feijão Adzuki. Rev. Bras. Ciências Agrárias-Braz. J. Agric. Sci. 2013, 8, 311–315. [Google Scholar] [CrossRef][Green Version]
- Ribeiro, K.F.A.; Justi, A.C.A.; Santos, F.M.D.M.; Nogueira, M.C.D.J.A.; De Musis, C.R. Análise dos Índices de Conforto Térmico PMV e PET em Diferentes Tipos de Coberturas em Ambiente Aberto na Cidade de Cuiabá-MT. Rev. Bras. Climatol. 2020, 26, 561–578. [Google Scholar] [CrossRef]
- Yilmaz, S.; Demircioglu Yildiz, N.; Toy, S.; Irmak, M.A. The Role of Climatic Elements in Public Tendency towards Alternative Tourism: A Sample of Turkey. Atmósfera 2009, 22, 367–374. [Google Scholar]
- Amelia, R.; Kustiawan, E.; Sulistiana, I.; Dalimunthe, D.Y. Forecasting Rainfall in Pangkalpinang City Using Seasonal Autoregressive Integrated Moving Average with Exogenous (Sarimax). BAREKENG J. Ilmu Mat. Dan Terap. 2022, 16, 137–146. [Google Scholar] [CrossRef]
- Permata, R.P.; Ni’mah, R.; Dani, A.T.R. Daily Rainfall Forecasting with ARIMA Exogenous Variables and Support Vector Regression. J. Varian 2024, 7, 177–188. [Google Scholar] [CrossRef]
- Wood, M.; Ogliari, E.; Nespoli, A.; Simpkins, T.; Leva, S. Day Ahead Electric Load Forecast: A Comprehensive LSTM-EMD Methodology and Several Diverse Case Studies. Forecasting 2023, 5, 297–314. [Google Scholar] [CrossRef]
- Schmid, L.; Roidl, M.; Kirchheim, A.; Pauly, M. Comparing Statistical and Machine Learning Methods for Time Series Forecasting in Data-Driven Logistics—A Simulation Study. Entropy 2024, 27, 25. [Google Scholar] [CrossRef] [PubMed]
- Herrmann, P.B.; Nascimento, V.F.; Casagrande, F.; de Freitas, M.W.D.; Klug, A.C. Spatial Modeling of Fire in the Atlantic Forest Considering Future Climate Change Scenarios in Rio Grande Do Sul State–Brazil. J. S. Am. Earth Sci. 2023, 131, 104614. [Google Scholar] [CrossRef]
- Zhang, Z.; Li, X.; Liu, X.; Zhao, K. Dynamic Simulation and Projection of Land Use Change Using System Dynamics Model in the Chinese Tianshan Mountainous Region, Central Asia. Ecol. Modell. 2024, 487, 110564. [Google Scholar] [CrossRef]
- Roshan, G.; Moghbel, M.; Attia, S. Evaluating the Wind Cooling Potential on Outdoor Thermal Comfort in Selected Iranian Climate Types. J. Therm. Biol. 2020, 92, 102660. [Google Scholar] [CrossRef] [PubMed]
- Ketterer, C.; Matzarakis, A. Mapping the Physiologically Equivalent Temperature in Urban Areas Using Artificial Neural Network. Landsc. Urban Plan. 2016, 150, 1–9. [Google Scholar] [CrossRef]
- Urban, A.; Kyselý, J. Comparison of UTCI with Other Thermal Indices in the Assessment of Heat and Cold Effects on Cardiovascular Mortality in the Czech Republic. Int. J. Environ. Res. Public Health 2014, 11, 952–967. [Google Scholar] [CrossRef] [PubMed]
- Aksay, C.S.; Ketenoğlu, O.; Kurt, L. Küresel Isınma ve İklim Değişikliği. Selçuk ÜNiversitesi Fen Fakültesi Fen Derg. 2005, 1, 29–42. [Google Scholar]
- Smoyer, K.E.; Rainham, D.G.C.; Hewko, J.N. Heat-Stress-Related Mortality in Five Cities in Southern Ontario: 1980–1996. Int. J. Biometeorol. 2000, 44, 190–197. [Google Scholar] [CrossRef] [PubMed]
- Vanos, J.K.; Warland, J.S.; Gillespie, T.J.; Kenny, N.A. Review of the Physiology of Human Thermal Comfort While Exercising in Urban Landscapes and Implications for Bioclimatic Design. Int. J. Biometeorol. 2010, 54, 319–334. [Google Scholar] [CrossRef] [PubMed]
- Gaitani, N.; Mihalakakou, G.; Santamouris, M. On the Use of Bioclimatic Architecture Principles in Order to Improve Thermal Comfort Conditions in Outdoor Spaces. Build. Environ. 2007, 42, 317–324. [Google Scholar] [CrossRef]
- Harlan, S.L.; Brazel, A.J.; Prashad, L.; Stefanov, W.L.; Larsen, L. Neighborhood Microclimates and Vulnerability to Heat Stress. Soc. Sci. Med. 2006, 63, 2847–2863. [Google Scholar] [CrossRef] [PubMed]
- Çağlak, S.; Türkeş, M. Spatial Distribution and Future Projections of Thermal Comfort Conditions during the Hot Period of the Year in Diyarbakır City, Southeastern Turkey. Sustainability 2023, 15, 10473. [Google Scholar] [CrossRef]
- Arfasa, G.F.; Owusu-Sekyere, E.; Doke, D.A. Climate Change Projections and Impacts on Future Temperature, Precipitation, and Stream Flow in the Vea Catchment, Ghana. Environ. Chall. 2024, 14, 100813. [Google Scholar] [CrossRef]
- Gemeda, D.O.; Korecha, D.; Garedew, W. Monitoring Climate Extremes Using Standardized Evapotranspiration Index and Future Projection of Rainfall and Temperature in the Wettest Parts of Southwest Ethiopia. Environ. Chall. 2022, 7, 100517. [Google Scholar] [CrossRef]
- Yaduvanshi, A.; Nkemelang, T.; Bendapudi, R.; New, M. Temperature and Rainfall Extremes Change under Current and Future Global Warming Levels across Indian Climate Zones. Weather Clim. Extrem. 2021, 31, 100291. [Google Scholar] [CrossRef]
- Hasan, M.W. Building an IoT Temperature and Humidity Forecasting Model Based on Long Short-Term Memory (LSTM) with Improved Whale Optimization Algorithm. Mem.-Mater. Devices Circuits Syst. 2023, 6, 100086. [Google Scholar] [CrossRef]
- Liu, C.; Su, H. Prediction of Glass Transition Temperature of Oxide Glasses Based on Interpretable Machine Learning and Sparse Data Sets. Mater. Today Commun. 2024, 40, 109691. [Google Scholar] [CrossRef]
- Kim, J.-Y.; Tangriberganov, G.; Jung, W.; Kim, D.S.; Koo, H.S.; Lee, S.; Kim, S.M. An Effective Representation Learning Approach: The Integrated Self-Supervised Pre-Training Models of StyleGAN2-ADA and DINO for Colon Polyp Images. IEEE Access 2023, 11, 143628–143634. [Google Scholar] [CrossRef]
- Lin, T.-P.; Matzarakis, A. Tourism Climate and Thermal Comfort in Sun Moon Lake, Taiwan. Int. J. Biometeorol. 2008, 52, 281–290. [Google Scholar] [PubMed]

Disclaimer/Publisher’s Note: The statements, opinions and data contained in all publications are solely those of the individual author(s) and contributor(s) and not of MDPI and/or the editor(s). MDPI and/or the editor(s) disclaim responsibility for any injury to people or property resulting from any ideas, methods, instructions or products referred to in the content. |
© 2026 by the authors. Licensee MDPI, Basel, Switzerland. This article is an open access article distributed under the terms and conditions of the Creative Commons Attribution (CC BY) license.