


Abstract
Radon is a naturally occurring radioactive gas present in soil, rocks, and water, and is one of the main sources of exposure to natural radiation. It is the second leading cause of lung cancer after smoking. An accurate assessment of indoor radon concentrations is therefore essential for radiation protection and risk management. This study presents a metrological analysis of indoor radon measurements performed using CR-39 nuclear track detectors exposed over varying exposure times. A dataset of 90 measurements was analyzed in accordance with ISO 11929 and ISO 11665-4, with particular attention to the combined use of measurement uncertainty and characteristic limits (decision threshold and detection limit). The results show that characteristic limits allow a statistically consistent discrimination between true radon signals and background fluctuations, while measurement uncertainty provides a quantitative description of the reliability of individual results. The combined interpretation of these quantities enables a more accurate assessment of the validity of the measurements, particularly for values close to the detection limit. In addition, a dimensionless Reliability Ratio (R), defined as the ratio of the measured concentration to the detection limit, is introduced as an operational indicator for evaluating the reliability of individual measurements and comparing results obtained under different exposure times. The proposed framework is demonstrated using real measurement data and highlights the practical role of metrological concepts in supporting decision-making processes in indoor radon risk assessment and mitigation strategies.
1. Introduction
The isotope 222Radon is a naturally occurring radioactive gas belonging to the radioactive chain of 238Uranium and is produced by the decay of 226Radium. Since the presence of uranium and radium is ubiquitous, radon is also present everywhere, although in variable concentrations depending on geology [1,2,3,4,5,6]. Radon, once produced, quickly dissipates outdoors; however, when it enters buildings, it can accumulate and reach concentrations that are hazardous to health. Since the general population spends about 80% of its time indoors, it can therefore be stated that indoor radon is the main source of ionizing radiation risk. As the second leading cause of lung cancer, radon is responsible for over 220,000 lung cancer deaths globally every year [7].
Despite its danger and the fact that exposure can be effectively managed through mitigation strategies, the interpretation of indoor radon measurements close to regulatory reference levels remains complex due to the combined effects of statistical fluctuations, background variability, and measurement uncertainty, particularly at low concentration levels. In this context, regulatory frameworks such as the European Directive 2013/59/EURATOM [8], which establishes a reference level of 300 Bq/m3 for dwellings and workplaces and has been transposed into Italian legislation through Legislative Decree 101/2020 [9], rely critically on the availability of reliable and metrologically valid measurement data. The effectiveness of such regulations therefore depends not only on the measurement of radon concentration values, but also on the quality and interpretability of the associated metrological information. In this regulatory context, compliance assessment is typically based on comparison between measured values and reference levels; however, such comparisons may be significantly affected when measurement results are associated with large relative uncertainties, particularly near decision thresholds. Therefore, metrological rigor has a central role in ensuring that the data used for risk assessment and law enforcement are scientifically robust [10]. To ensure radiological surveillance and environmental monitoring, an essential element of metrological accuracy is the assessment of the measurement uncertainty associated with the experimental data [11]. Although high radon concentrations can be measured with relatively low uncertainty, a significant fraction of routine measurements is performed at low concentration levels, close to the background or well below regulatory reference values. Measurement results at low concentrations, in some cases comparable to background levels, are strongly influenced by statistical fluctuations. At low concentrations, the combined standard uncertainty is dominated by counting statistics rather than systematic contributions such as calibration or detector sensing surface. Therefore, the relative uncertainties can become very large, rendering the measurement result meaningless. Another critical aspect concerns the definition of detection capability. At low radon concentrations, the distinction between a true signal and a statistical fluctuation of the background cannot be based solely on the measured net value. Instead, a probabilistic decision criterion is required, allowing explicit control over the probabilities of false positive and false negative decisions. For this reason, the concepts of decision threshold and detection limit become essential components of the measurement result. Under these conditions, the correct assessment of measurement uncertainty and detection capability becomes essential for meaningful interpretation of the data. Assessing measurement uncertainty by considering only counting statistics and calculating characteristic limits using empirical approaches generally leads to an incorrect assessment of measurement significance, particularly when low counting rates and a non-negligible background are present. A critical aspect of radon metrology is therefore the need for a consistent decision framework that simultaneously accounts for measurement uncertainty and detection capability, ensuring that observed signals can be interpreted in probabilistic terms rather than as simple point estimates.
These requirements are addressed by the metrological framework defined in ISO 11929 and ISO 11665-4, which provide a formal basis for the evaluation of measurement uncertainty, decision thresholds, and detection limits under low-level radiation measurement conditions [12,13]. In routine radon surveys, these quantities are often evaluated separately, without a unified interpretation framework that allows for their combined use in assessing measurement reliability and supporting decisional processes. When solid-state nuclear track detectors are used [14], these provide an effective tool for radon measurements, assessment of measurement uncertainty, and characteristic limits, considering Poisson and Gaussian statistics, background variability, and systematic contributions to measurement uncertainty such as detector efficiency and calibration. This approach is particularly relevant for radon measurements performed near regulatory reference levels or in cases where low concentration values are encountered. Although several studies have addressed uncertainty assessment in radon measurements, the role of characteristic limits in the interpretation of radon concentration results has received considerably less attention. In many practical applications, the uncertainty estimate is reported without a corresponding assessment of the decision threshold and detection limit, even though these quantities provide complementary information regarding the statistical significance of the measured signal. Consequently, uncertainty alone may be insufficient for the interpretation of measurements performed at low concentration levels, where the measured signal can be comparable to background fluctuations. This work aims to address this issue by integrating uncertainty evaluation and characteristic limit determination within a unified ISO 11929 framework and by demonstrating the practical implications of this approach using real indoor radon measurements. In this study, we do not propose modifications to existing ISO standards. Instead, we develop and demonstrate an operational metrological framework that combines measurement uncertainty and characteristic limits into a unified interpretation scheme for indoor radon measurements obtained with CR-39 detectors. Within this framework, a dimensionless Reliability Ratio (R) is introduced to support the interpretation of measurement results in terms of both detectability and precision.
Indoor radon measurements obtained with different exposure times were analyzed to show how the interpretation of experimental results changes when measurement uncertainty and characteristic limits are considered. The results provide a metrologically solid basis for the interpretation of measurements of low indoor radon concentrations, and are discussed in terms of their implications for reporting measurement and decision-making in indoor radon monitoring.
2. Materials and Methods
2.1. Radon Activity Concentration Determination
In this study, a total of 90 CR-39 solid-state nuclear track detectors were used to determine indoor radon activity concentration in dwellings. The detectors were exposed in monitored rooms for varying periods of time; namely, 1 month, 3 months, and 6 months. Each CR-39 was identified by an ID provided by the manufacturer which was used to ensure its traceability in the process from the laboratory to the measurement site and vice versa. As required by Legislative Decree 203/2022 [15], the radon measurements were carried out by the radioactivity laboratory that possesses the certification according to the ISO 9001:2015 [16] standard and accreditation according to the European Standard EN ISO/IEC 17025 [17] for the “Integrated measurement method for determining average activity concentration of the radon 222 in the environment air using passive sampling and delayed analysis” UNI ISO 11665:-42021 [12].
After exposure, all CR-39 detectors were chemically etched using a solution of 6.25 M NaOH (Biochem Consulting, Naples, Italy) at (98 ± 1) °C for 60 min. The automatic counting of track density was performed by means of a Politrack system (mi.am s.r.l., Rivergaro, PC, Italy). The radon concentration was calculated using Equation (1):
where
N is the number of tracks recorded by the detector.
N0 is the average number of background tracks determined experimentally by recording unexposed detectors processed under the same chemical–physical and counting conditions as the exposed detectors. All the background detectors belonged to the same batch.
Fc is the calibration factor expressed in [tracks/cm2) per (Bq h/m3)].
S is the sensitive area of the detector expressed in cm2.
t is the exposure time expressed in h.
The calibration factor (FC = [0.513 ± 0.051] tracks cm−2 per kBq·h·m−3, k = 1) was determined by exposing the CR-39 detectors to a certified radon atmosphere within the exposure range of 102 to 4545 kBq·h·m−3 at the National Metrology Institute (ENEA, Italy). The radon reference exposure was generated under controlled and certified conditions, ensuring traceability to national metrological standards for radon measurements. The uncertainty associated with the reference exposure was estimated at 4% (k = 1) and was propagated throughout the calibration process. The calibration uncertainty was combined with the statistical uncertainty of track counting to obtain the overall uncertainty of the calibration factor, which was subsequently included in the total uncertainty budget of the measurement model.
All experimental radon concentration measurements were corrected for detector fading and aging effects using experimentally determined correction functions.
To ensure the reliability and reproducibility of the measurement system, the Lab.RAD laboratory participates annually in interlaboratory comparison exercises organized by the Bundesamt für Strahlenschutz (BfS). These exercises confirm the consistency of the detector response, the robustness of the calibration procedure, and the overall reproducibility of the CR-39-based measurement system under standardized exposure conditions [17,18]. The uncertainty in repeatability, estimated using historical data on participation in PTs, is 4% in terms of exposure expressed in kBq h m−3. The combination of radon chamber calibration and participation in proficiency testing also provides an independent validation of the overall measurement performance, including the reliability of the decision framework used for the classification of results in terms of detection capability and uncertainty.
2.2. Measurement Uncertainty
The measurement uncertainty associated with the radon activity concentration was evaluated in accordance with the ISO 11665-4:2021 standard [12], applying the general principles of uncertainty propagation described in UNI EN ISO 11929-1:2025 [13].
The quantities in Equation (1) are independent, so it is possible to calculate the measurement uncertainty by applying the law of propagation of uncertainty. In this way, it is possible to calculate the uncertainty budget which contains both type A and B uncertainty. The statistical counting uncertainty was evaluated as type A uncertainty, while the uncertainties associated with the calibration factor and the sensitive area of the detector were treated as type B uncertainties. The uncertainty associated with sampling duration is generally neglected in cases of long-term measurements.
Applying the law of propagation of uncertainty, the statistical component of variance associated with radon activity concentration measured is:
where and are the variances associated with N and N0. Hereinafter, is referred to as .
Type B contributions due to the area of detector and calibration factor can be expressed as:
The combined standard uncertainty for the measurement of radon activity concentration is therefore given by:
2.3. Decision Threshold and Detection Limit
To assess the capability of the measurement method to reliably detect the presence of radon above background levels, the decision threshold and the detection limit were also evaluated. Both quantities were calculated according to ISO 11665-4:2021 and ISO 11929-1:2025 [12,13] at a 95% confidence level, considering the background count rate, the measurement time, and the expanded standard uncertainty.
The decision threshold is defined as the minimum value of the measurand, above which the presence of radon can be confirmed with a predefined probability of a false positive. The decision threshold was defined based on the standard deviation of the experimentally determined background, assuming a normal distribution, a significance level of 5%, and for , as
where k1−α = 1.65 and u0 is the statistical uncertainty associated with the background count, as defined above.
The detection limit corresponds to the true value of the radon activity concentration for which the probability that the measurement result exceeds the decision threshold is 1-β. It was calculated by combining the probabilities of false positive and false negative decisions, resulting in the detection limit equal to 3.3 times the background standard deviation normalized by the calibration factor and the exposure time:
Equation (6), which is in implicit form, can be solved with respect to C# using the Taylor series expansion, thereby providing an explicit expression for detection limit:
Equation (7) is derived in accordance with ISO 11929 framework using a first-order Taylor series expansion of the measurement model, in accordance with the Guide to the Expression of Uncertainty in Measurement (GUM). This linearization allows the propagation of uncertainties from the input quantities to the output quantity if relative uncertainties remain sufficiently small for higher-order terms to be neglected. The validity of this approximation is ensured under the experimental conditions of this study, characterized by sufficiently long exposure times and a large number of detectors, which result in stable count rates and moderate relative uncertainties for the majority of measurements. Under these conditions, the Gaussian approximation of Poisson-distributed variables provides an adequate description of uncertainty propagation. The applicability of Equation (7) is therefore limited to measurement regimes outside extremely low count conditions, while remaining valid near the decision threshold.
To take account of the varying sensitivities of the detectors used, resulting from different exposures, a dimensionless parameter Reliability Ratio (R) has been introduced, defined as the ratio of the measured radon concentration C to the corresponding detection limit.
This parameter provides information on how significant a signal is in relation to the sensitivity of the measurement method linking measurement uncertainty and detectability.
3. Results
3.1. Indoor Radon Concentration Measurements
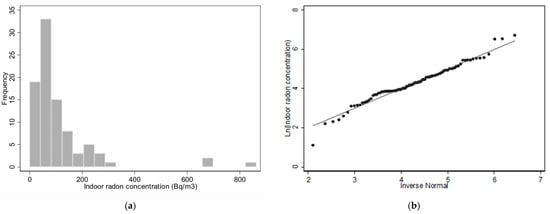
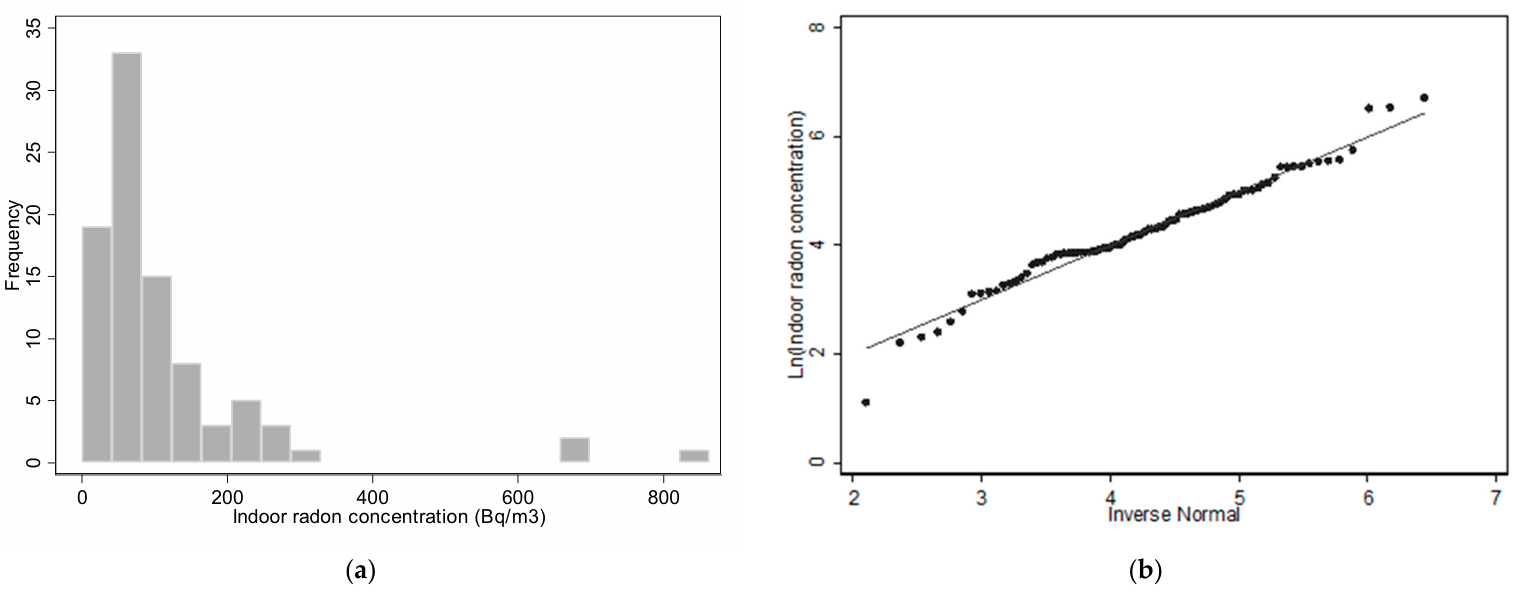
The radon measurements reported in this study were obtained using the measurement model and uncertainty budget calculation described in the previous sections. The distribution of the experimental data was first analyzed by 90 CR-39s to assess its statistical properties. Indoor radon measurements showed a median value of 68 Bq/m3; the geometric mean of radon concentrations was 68 Bq/m3, with a geometric standard deviation of 3.
In Figure 1, the statistical distribution of indoor radon concentration measured using 90 CR-39s is reported.
Figure 1.
(a) Frequency distribution of indoor radon concentrations using CR-39 detectors; (b) Q-norm plot of natural log-transformed radon concentration.
As expected, the distribution of indoor radon concentration values follows a log-normal pattern. Figure 1b shows the trend of experimental data for which the log-normal distribution was confirmed using a Shapiro–Wilk test (p = 0.145).
3.2. Characteristic Limits Analysis
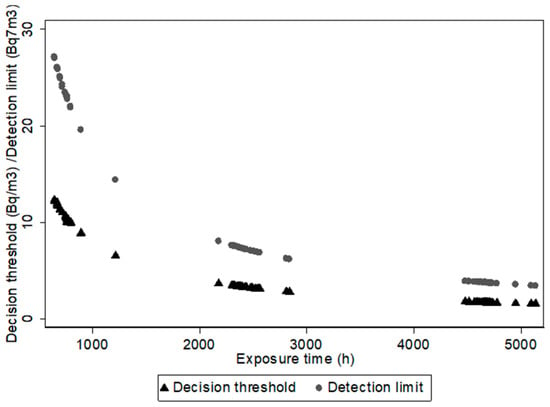
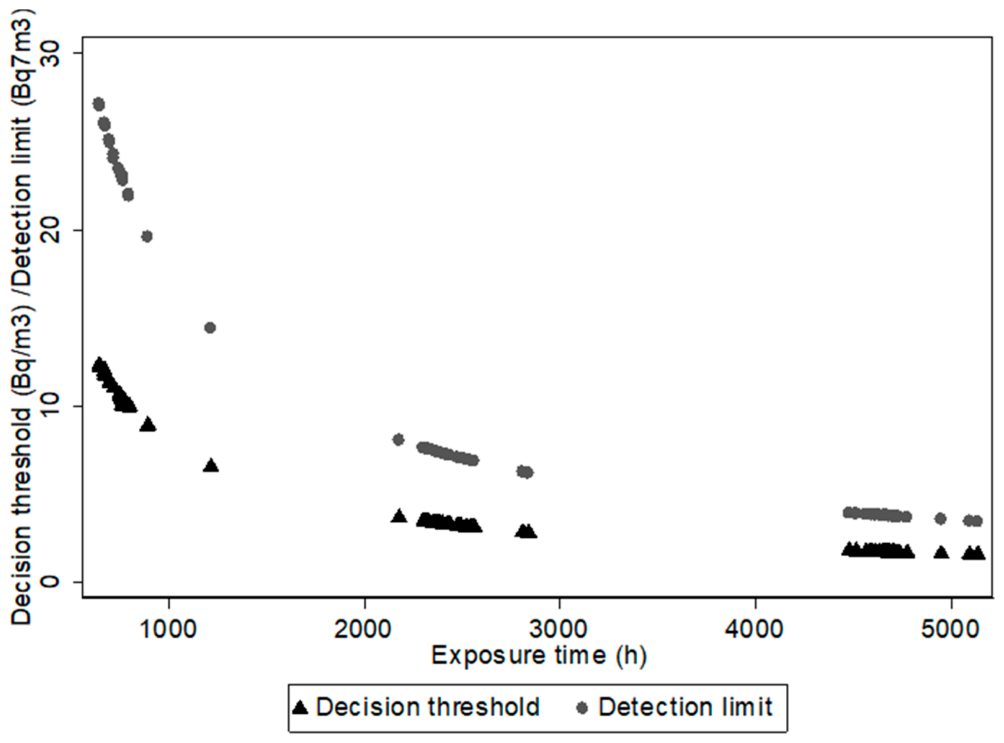
The results obtained show the presence of low concentrations for which the net signal could be comparable to background fluctuations. In these cases, the estimated radon concentration alone is not sufficient to assess the presence of radon with statistical significance. Following the statistical characterization of the dataset, the analysis was extended to the evaluation of the characteristic limits and their dependence on exposure time. By introducing the decision threshold, it was possible to distinguish measurements consistent with background fluctuations from those indicating a statistically significant radon signal. For each measurement, the characteristic limits were calculated and their variation as a function of exposure time is shown in Figure 2.
Figure 2.
Decision threshold () and detection limit () as a function of exposure time for CR-39 radon detectors. Both quantities decrease with increasing exposure time, reflecting improved counting statistics.
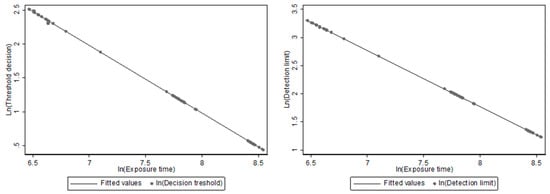
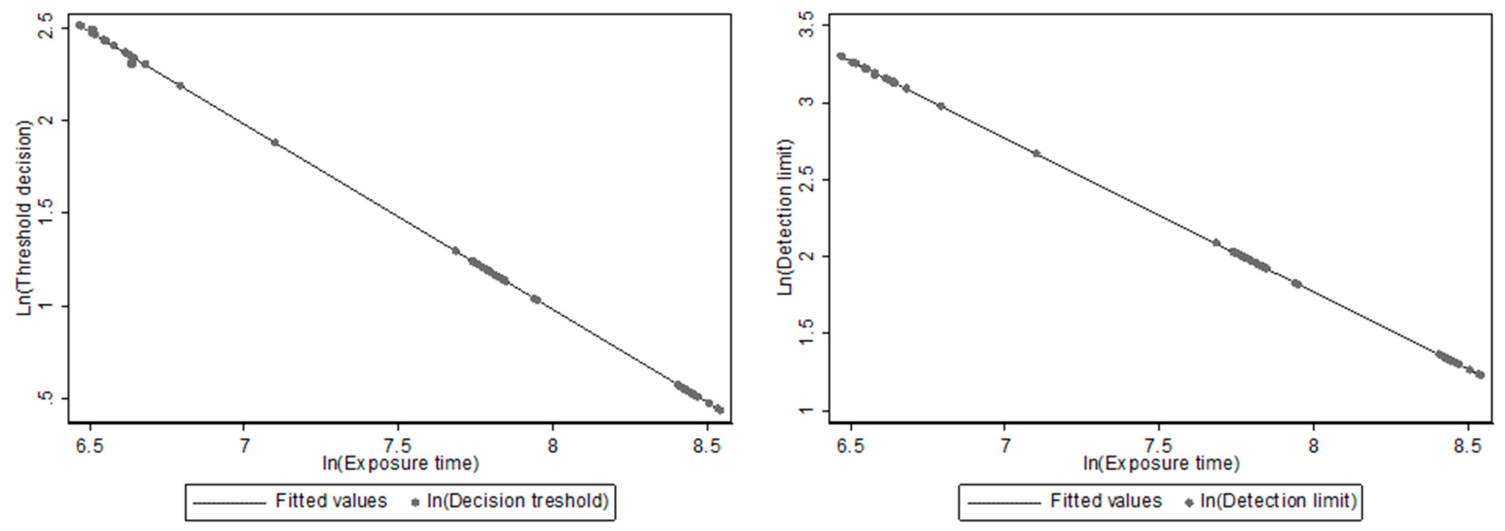
The experimental results show that the characteristic limits are clearly dependent on the exposure time. Both the decision threshold and the detection limit decrease as the integration time increases. This trend is observable across the entire time range investigated and is most pronounced for short exposure times, before tending towards a more gradual decrease for longer exposure times. To investigate the time dependence of the characteristic limits in greater detail, the data were reanalyzed using a logarithmic scale. Figure 3 shows the trends on a logarithmic scale (ln–ln) of the decision threshold and the detection limit as a function of exposure time to assess the possible presence of a power-law relationship.
Figure 3.
Ln–Ln plot of the decision threshold () and detection limit () versus exposure time for CR-39 radon detectors. The data were transformed using natural logarithms and the linear regression was performed in ln–ln space. Solid lines represent the power-law fit , where a = (8.978 ± 0.001) e b = (−1.0000 ± 0.0009) with R2 = 99.9% for (), and a = (9.777 ± 0.005) e b = (−1.0000 ± 0.0002) with R2 = 99.9% for (). The slopes near −1 indicate an inverse proportionality with time, arising from the use of a constant background. All data points from Figure 2 were included in the regression.
The decision threshold and the detection limit show the same trend as a function of exposure time. This is to be expected, since α = β = 0.05 was chosen in the calculation of the characteristic limits. Consequently, both quantities follow the same trend, differing only by a constant multiplicative factor. In a ln–ln representation, both show a clear linear trend in the investigated exposure range. Linear fits to the data yield slopes of approximately −1 (within uncertainties), indicating an inverse proportionality between the characteristic limits and exposure time. The fits show good agreement with the experimental data, confirming the robustness of the observed trend. The observed slope close to −1 in the ln–ln representation is a direct consequence of the background being treated as a constant quantity, evaluated for each measurement batch as the mean value of approximately 10% of unexposed detectors. Under this assumption, the uncertainty associated with the background does not vary proportionally to exposure time, leading to a detection limit inversely proportional to time rather than following the dependence expected from Poisson counting statistics.
3.3. Metrological Classification of Indoor Radon Measurements
The experimental results were compared with the calculated decision threshold () and detection limit ), determined in accordance with the metrological approach adopted. Based on this comparison, the measured concentrations were grouped into metrological classes. Three classes were defined: (A) non-detectable results (), (B) detectable but not quantifiable results (), and (C) statistically significant and quantifiable results ().
As shown in Table 1, 4% of the measurements are below the decision threshold and are statistically indistinguishable from the background. This result should not be interpreted as an absence of radon in the monitored rooms but rather indicates that it is not possible to distinguish the true signal from the background. A total of 8% of indoor radon concentrations fall within metrological class B. These measurements are detectable, but there is no guarantee that they will be identified as a true signal with probability 1-β. Most measurements (88%) fall into metrological class C, exceeding the detection limit. These radon concentration measurements can be distinguished from the background with a confidence level of α = β = 0.05.
Table 1.
Classification of radon measurements based on characteristic limits. The table shows the number and percentage of measurements in each class.
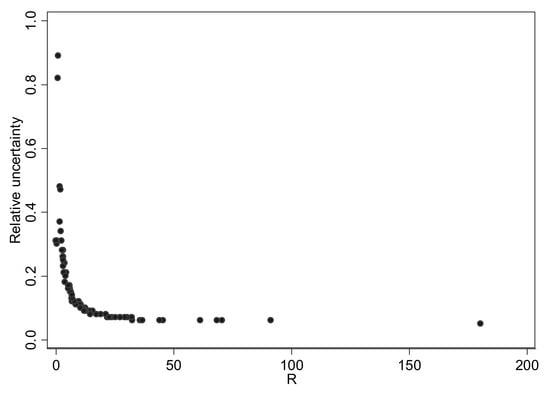
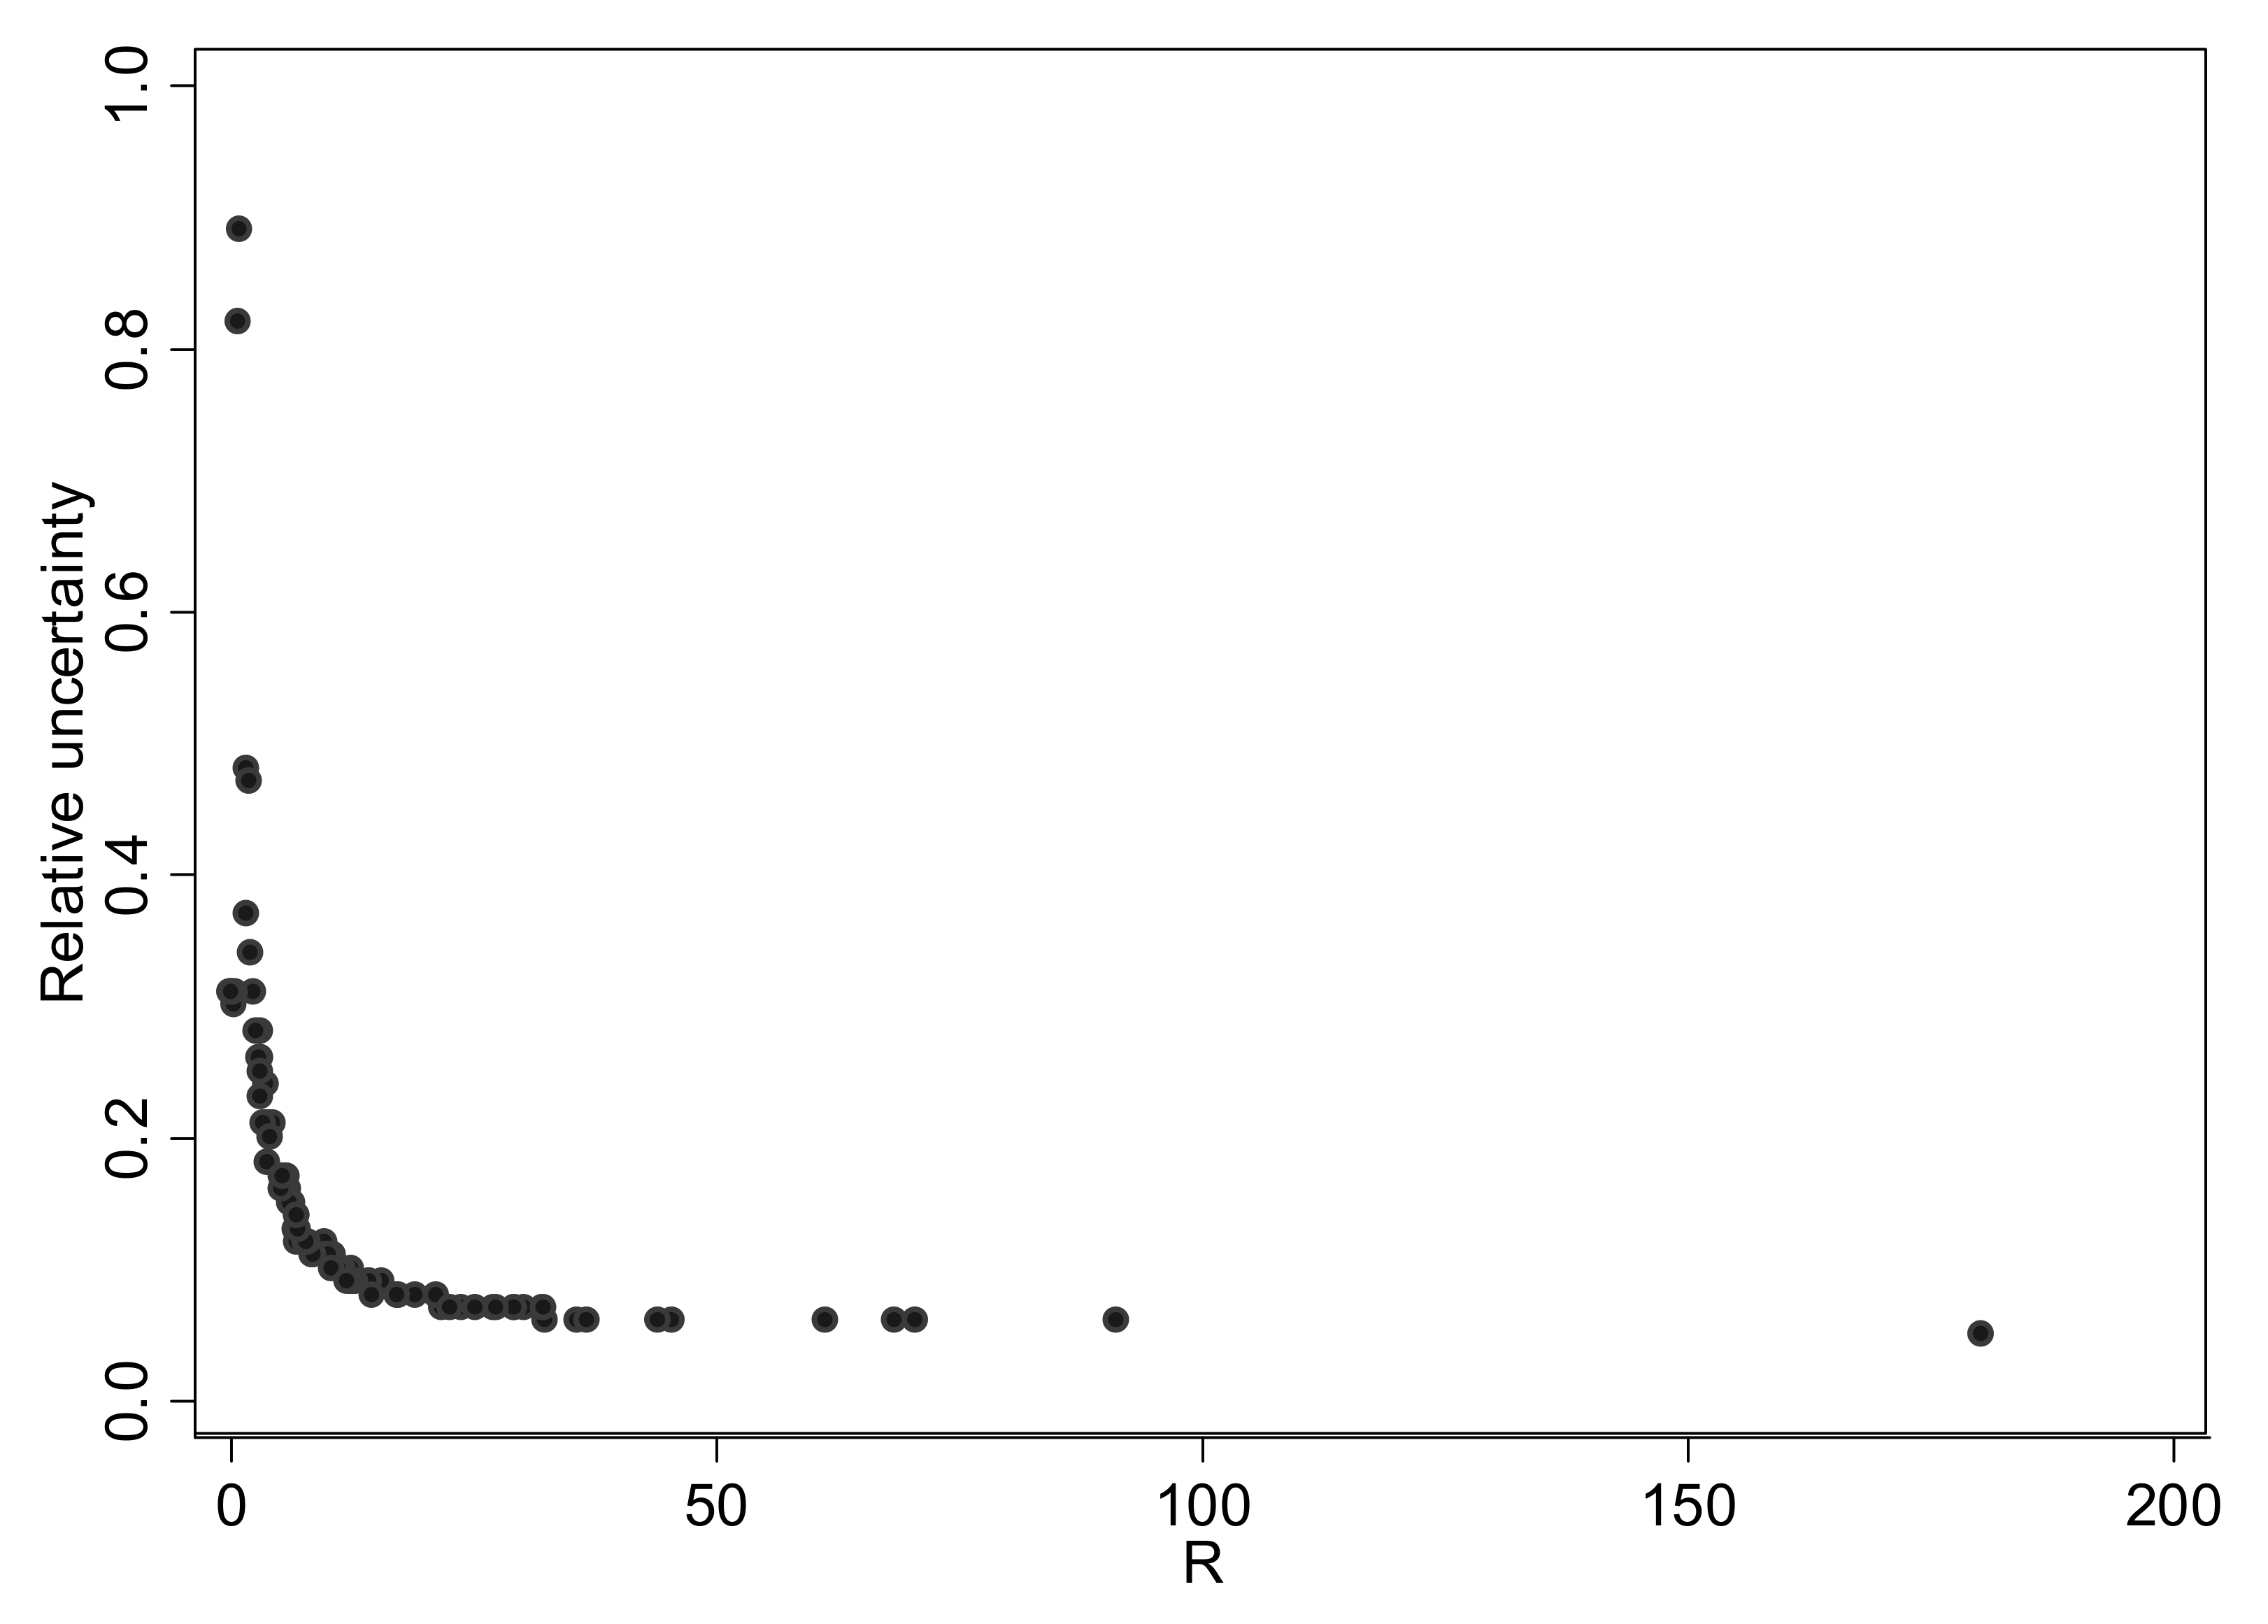
To assess the relationship between signal detectability and measurement accuracy, the relationship between the dimensionless parameter R and the relative uncertainty of the measured radon concentration was investigated. As expected, a decreasing trend in the relative measurement uncertainty was observed as R increased (Figure 4).
Figure 4.
Relative uncertainty of radon measurements as a function of the dimensionless R parameter. The uncertainty decreases with increasing , providing a clear overview of measurement reliability across different exposure times.
This result indicates that measurements with a signal significantly exceeding the detection limit are associated with greater statistical reliability. Since the background contribution, determined by the intrinsic density of the traces in batch CR-39, can be considered constant for all detectors, the observed behavior of the relative uncertainty can be interpreted in terms of counting statistics. In the low-R region, where the measured concentration approaches the detection limit, the net signal is comparable to the background level, and the measurement is therefore dominated by statistical fluctuations. Under these conditions, the uncertainty associated with the count, which follows a Poisson distribution, has a significant impact on the relative uncertainty of the estimated radon concentration. As R increases, the contribution of the net signal progressively exceeds the background, leading to a reduction in the relative influence of count fluctuations. This trend reflects the transition from a background-dominated regime to a signal-dominated regime, and supports the interpretation of R as an indicator of measurement reliability. Table 2 shows the median relative uncertainty, stratified into classes of the dimensionless parameter R, together with the interquartile range for each class.
Table 2.
Median relative uncertainty and interquartile range (IQR) of radon concentration measurements, grouped by classes of the dimensionless parameter R.
Table 2 highlights the decreasing trend of measurement uncertainty with increasing , illustrating that measurements with higher signal-to-detection-limit ratios are associated with improved precision, while low- values correspond to measurements dominated by background fluctuations.
4. Discussion
This study describes the metrological analysis of indoor radon concentrations measured using CR-39 detectors, with variable exposure times. The approach used, based on determination of the detection limit and calculation of the measurement uncertainty, allows both qualitative detection and quantitative assessment of radon levels in a statistically rigorous manner. The number of exposed detectors allowed a statistically robust, field-based estimation of both measurement uncertainty and detection limits. This integrated approach validates the measurement protocol, ensuring not only that radon concentrations are detectable, but also that they are quantified with controlled and acceptable uncertainty. However, in most previous radon studies, uncertainty evaluation and characteristic limits are treated separately, and their combined effect on the interpretation of experimental datasets is rarely discussed using real measurement campaigns. The following results should be interpreted as an operational demonstration of the proposed metrological framework, rather than as dataset-specific findings, as the same decision structure applies generally to radon measurements performed under ISO 11929 conditions. The determination of characteristic limits provides a solid basis for decision-making. In this study, it was observed that 4% of the measurements were below the decision threshold. This result indicates that these measurements are statistically indistinguishable from background levels. The present results demonstrate that the C*–C# region is not merely a theoretical construct but an experimentally observable decision zone under real measurement conditions, confirming the operational relevance of ISO 11929 characteristic limits for radon monitoring.
Without comparison with characteristic limits, low concentrations would have given rise to false positives. Our experimental data show that 8% of the results fall within the C*–C# range. This range can be interpreted as the region of uncertain decision probability. Measurements falling within this region are statistically detectable, but there is no guarantee that they will be identified as such with probability 1-β. Its small size shows that the exposure times of the CR-39 detectors used guarantee adequate statistical separation between background and environmental radon concentrations. When this region contains a lot of experimental data, it can be assumed that the exposure times were probably insufficient or that there was excessive background variability [19]. The presence of experimental data in all three regions provides metrological validation of the measurement protocol. Furthermore, the low number of measurements in the C*–C# region and the high percentage of experimental measurements (88%) exceeding the detection limit guarantees the high statistical power of the measurement protocol and the adequacy of the exposure times chosen for the survey, allowing empirical observation of the transition zone. The results demonstrate that the entire process (CR-39 exposure, etching, detector reading) operates under conditions of excellent detectability, where the probability of classification as a false negative is controlled.
The observed decrease in C* and C# with exposure time (slope ≈ −1 on a ln–ln scale) can be attributed to the background treatment as a time-independent contribution in the uncertainty model. Under ideal Poisson-dominated counting statistics, characteristic limits are expected to scale approximately as t−1/2, corresponding to a slope of −0.5 in the ln–ln representation. In this study, the background was estimated for each measurement batch using a subset (approximately 10%) of unexposed CR-39 detectors. The resulting batch-specific background level and its statistical uncertainty were propagated within the ISO 11929 framework as a constant contribution to the uncertainty budget. This approach, in which the background is treated as a constant quantity estimated from a limited number of unexposed detectors, is commonly adopted in routine radon monitoring and is consistent with standard metrological practice, although its limitations in terms of background variability and statistical uncertainty are well known.
Within this framework, the presence of a time-independent background term modifies the scaling behavior of the characteristic limits, leading to the observed effective dependence close to −1. Similar deviations from ideal Poisson scaling have been reported in CR-39 radon dosimetry systems where the time-independent background is included in ISO 11929 uncertainty evaluations [20,21,22].
These results indicate that the characteristic limits are governed primarily by the background contribution in the low-count regime rather than by pure counting statistics. From a practical perspective, this approach provides a stable and reproducible measurement model, suitable for large-scale radon monitoring, while ensuring consistent application of standardized uncertainty evaluation procedures.
Characteristic limits indicate whether radon concentrations are detectable with a given protocol, but do not provide information on the reliability of the measurement. For this reason, it is essential to supplement characteristic limits with the calculation of combined uncertainty. This aspect is particularly important for measurements close to the detection limit. These are statistically valid but have a higher relative uncertainty, while measurements well above the detection limit show both high detectability and low relative uncertainty. In this context, the Reliability Ratio (R) is introduced as an operational parameter that combines detectability and precision into a single indicator of measurement quality under different exposure conditions. The proposed approach is not specific to the current data set but is applicable whenever detection limits and uncertainty estimates are evaluated within a framework compliant with ISO 11929. However, the numerical outcomes reported in this study (e.g., distribution among A/B/C metrological classes and R–uncertainty relationships) depend on the specific detector batch, calibration conditions, background estimation procedure, and the selected α and β risk parameters. Higher R values correspond to measurements well above the detection limit and are associated with lower relative uncertainty, indicating higher precision. Conversely, lower R values correspond to measurements closer to the detection limit, where relative uncertainty increases and measurement precision decreases.
From a practical perspective, R should be considered a complementary decision-support indicator to regulatory reference levels rather than a direct compliance criterion. For example, a measurement of 150 Bq·m−3 with R = 1.5 (class 2 in Table 2) does not imply regulatory compliance or non-compliance, but indicates an intermediate detectability regime in which the signal is statistically distinguishable from the background while still being associated with non-negligible uncertainty. In such cases, regulatory interpretation should jointly consider the measured value, its uncertainty, and R to avoid over-interpretation near decision thresholds. Therefore, R provides a normalized indicator of measurement reliability that allows comparison of results obtained under different exposure conditions.
In Italy, although national legislation stipulates that radon measurements must be compared with the reference value of 300 Bq/m3 without taking measurement uncertainty into account, the latter provides information on the accuracy of the measurement. In this context, the proposed metrological approach provides a structured framework that supports regulatory decision-making by explicitly linking measurement results, detection capability, and uncertainty to the compliance assessment process.
Measurement uncertainty ensures that measurements are quantified within a known confidence interval, facilitating risk management [22]. This approach integrates metrological rigor with regulatory requirements, providing a scientifically sound basis for policy-relevant radon assessment. The link between metrology and regulations concerning radon risk assessment is bidirectional. While regulations define reference values, metrological rigor allows compliance with these limits to be verified in a scientifically reliable manner. Without a solid metrological basis, radon risk prevention policies would lose their effectiveness, as health decisions and mitigation measures would be based on data that may not be comparable or accurate. This highlights that the joint use of measurement uncertainty and ISO 11929 characteristic limits should be considered not only as a metrological refinement, but as an essential requirement for the correct interpretation of low-level radon measurements in regulatory contexts. From a regulatory perspective, this approach reduces ambiguity in the classification of buildings near the reference level, where binary compliance decisions (compliant/non-compliant) may be strongly affected by measurement uncertainty and chosen exposure time. The metrological label thus provides decision-makers with additional information to distinguish between actual exceedances of the limits and statistically inconclusive results. In addition, the R parameter provides a quantitative indicator of the measurement’s reliability and its ability to distinguish the radon signal from background fluctuations. Therefore, the proposed metrological framework should not be regarded solely as a refinement of measurement practice, but as a necessary component for ensuring scientifically defensible regulatory decisions in indoor radon protection strategies.
The methodological contribution of this work does not consist in redefining the characteristic limits established by ISO 11929, but rather in proposing an integrated interpretative framework that combines characteristic limits and measurement uncertainty for decision-oriented radon assessment. While ISO 11929 provides the statistical basis for determining detectability, and uncertainty quantifies the precision of the reported result, these quantities are usually evaluated separately. The proposed approach links them through the dimensionless parameter R, allowing the reliability of individual measurements to be assessed in a normalized manner independently of exposure time.
Although the framework was developed using CR-39 detectors, its conceptual structure is detector-independent and may be applied to other passive or active radon measurement systems whenever characteristic limits and uncertainty estimates are available. More generally, the approach may be extended to other environmental radioactivity measurements performed close to detection limits, where both detectability and precision contribute to the final decision-making process.
The present study should therefore be regarded not only as an application of ISO 11929 to a specific dataset, but also as a demonstration of a transferable metrological framework capable of supporting scientifically defensible risk management decisions under conditions of low-level environmental radioactivity.
5. Conclusions
The study of characteristic limits has revealed a clear dependence of passive detectors on exposure time: as exposure time increases, these limits systematically decrease, thereby improving measurement sensitivity. Overall, the results confirm that the joint analysis of characteristic limits and measurement uncertainty provides information on the adequacy of the measurement protocol adopted.
This combined metrological framework, integrated in the proposed metrological label, is particularly relevant in the context of radon risk governance and regulatory compliance, as it enables a more robust interpretation of measurements near reference levels, where classification decisions (compliance or non-compliance) are strongly affected by measurement uncertainty and detection capability.
This approach allows for greater reliability in exposure assessments, supports scientifically defensible decisions regarding prevention and mitigation, and contributes to the development of more consistent and transparent monitoring strategies to protect public health.
Author Contributions
Conceptualization, M.Q.; methodology, M.Q. and F.L.; software, M.Q. and F.L.; formal analysis, M.Q. and F.L.; resources, M.Q. and F.L.; data curation, M.Q. and F.L.; writing—original draft preparation, M.Q.; writing—review and editing, M.Q. and F.L.; supervision, M.Q.; project administration, M.Q. All authors have read and agreed to the published version of the manuscript.
Funding
This research received no external funding.
Institutional Review Board Statement
Not applicable.
Informed Consent Statement
Not applicable.
Data Availability Statement
The data presented in this study are available on request from the corresponding author.
Acknowledgments
The authors would like to thank the people who allowed radon concentration measurements at their homes and contributed to the realization of this work.
Conflicts of Interest
The authors declare no conflict of interest.
References
- WHO. Housing and Health Guidelines; World Health Organization: Geneva, Switzerland, 2018. Available online: https://www.who.int/publications/i/item/9789241550376 (accessed on 1 March 2026).
- Nunes, L.J.R.; Curado, A.; Lopes, S.I. The Relationship between Radon and Geology: Sources, Transport and Indoor Accumulation. Appl. Sci. 2023, 13, 7460. [Google Scholar] [CrossRef]
- Loffredo, F.; Opoku-Ntim, I.; Kitson-Mills, D.; Quarto, M. Gini Method Application: Indoor Radon Survey in Kpong, Ghana. Atmosphere 2022, 13, 1179. [Google Scholar] [CrossRef]
- Loffredo, F.; Opoku-Ntim, I.; Quarto, M. Sorrentina Peninsula: Geographical Distribution of the Indoor Radon Concentrations in Dwellings—Gini Index Application. Appl. Sci. 2021, 11, 7975. [Google Scholar] [CrossRef]
- Kuntoro, Y.; Setiwan, H.L.; Wijayanti, T.; Haerundin, N. The Correlation Between Radon Emission Concentration and Subsurface Geological Condition; IOP Conference Series: Earth nd Environmental Science; IOP Publishing Ltd.: Bristol, UK, 2018; Volume 132. [Google Scholar]
- Hendry, J.H.; Simon, S.L.; Wojcik, A.; Sohrabi, M.; Burkart, W.; Cardis, E.; Laurier, D.; Tirmarche, M.; Hayata, I. Human exposure to high natural background radiation: What can it teach us about radiation risks? J. Radiol. Prot. 2009, 29, A29. [Google Scholar] [CrossRef] [PubMed]
- Gaskin, J.; Coyle, D.; Whyte, J.; Krewksi, D. Global estimate of lung cancer mortality attributable to residential radon. Environ. Health Perspect. 2018, 126, 057009. [Google Scholar] [CrossRef] [PubMed]
- European Council. Council Directive 2013/59/Euratomon basic safety standards for protection against the dangers arising from exposure to ionising radiation. Off. J. Eur. Union 2014, 57, 1–73. [Google Scholar]
- Italian Governement. Decreto Legislativo n. 241 del 26 maggio 2020, Attuazione della direttiva 96/29/EURATOM in materia di protezione sanitaria della popolazione e dei lavoratori contro i rischi derivanti dalle radiazioni ionizzanti. In Official Gazette No.203, 31; Stato Italiano: Rome, Italy, 2000. (In Italian) [Google Scholar]
- Otahal, P.P.; Burian, I. Remarks to history of radon activity concentration metrology. Nukleonika 2020, 65, 45–49. [Google Scholar] [CrossRef]
- Röttger, S.; Röttger, A.; Grossi, C.; Vargas, A.; Karstens, U.; Cinelli, G.; Chung, E.; Kikaj, D.; Rennick, C.; Mertes, F.; et al. Radon metrology for use in climate change observation and radiation protection at the environmental level. Adv. Geosci. 2022, 57, 37–47. [Google Scholar] [CrossRef]
- ISO 11665-4:2021; Measurement of Radioactivity in the Environment—Air: Radon-222—Part 4: Integrated Measurement Method for Determining Average Activity Concentration Using Passive Sampling and Delayed Analysis. International Organization for Standardization: Geneva, Switzerland, 2021.
- ISO 11929-1:2025; Determination of the Characteristic Limits (Decision Threshold, Detection Limit and Limits of the Coverage Interval) for Measurements of Ionizing Radiation—Fundamentals and Application. International Organization for Standardization: Geneva, Switzerland, 2025.
- Cardoso Takahashi, L.; de Oliveira Santos, T.; Marques Pinheiro, R.M.; Gomes Passos, R.; Rocha, Z. Radon dosimetry using Solid State Nuclear Track Detectors in different environments: A review. Appl. Radiat. Isot. 2022, 186, 110217. [Google Scholar] [CrossRef] [PubMed]
- Italian Governement. Decreto Legislativo n. 203 del 25 novembre 2022, Disposizioni integrative e correttive al decreto legislativo 31 luglio 2020, n. 101, di attuazione della direttiva 2013/59/Euratom, che stabilisce norme fondamentali di sicurezza relative alla protezione contro i pericoli derivanti dall’esposizione alle radiazioni ionizzanti, e che abroga le direttive 89/618/Euratom, 90/641/Euratom, 96/29/Euratom, 97/43/Euratom e 2003/122/Euratom e riordino della normativa di settore in attuazione dell’articolo 20, comma 1, lettera a), della legge 4 ottobre 2019, n. 117. In Official Gazette No.2; Stato Italiano: Rome, Italy, 2023. (In Italian) [Google Scholar]
- ISO 9001:2015; Quality Management Systems–Requirements. International Organization for Standardization: Geneva, Switzerland, 2015.
- UNI CEI EN ISO/IEC 17025:2018; General Requirements for the Competence of Testing and Calibration Laboratories. International Organization for Standardization: Geneva, Switzerland, 2018.
- Loffredo, M.F.; Pacella, D.; Quarto, M. Exploring Seasonal Variation of Indoor Radon in Campania: Preliminary Findings. Indoor Air 2025, 2025, 5158897. [Google Scholar] [CrossRef]
- Janik, M.; Łoskiewicz, J.; Tokonami, S.; Kozak, K.; Mazur, J.; Ishikawa, T. Determination of the minimum measurement time for estimating long-term mean radon concentration. Radiat. Prot. Dosim. 2012, 152, 168–173. [Google Scholar] [CrossRef] [PubMed]
- Kropat, G.; Barazza, F.; Bochud, F.; Damet, J.; Meyer, N.; Gruson, M.P. Butterweck, calibration of the politreck system based on CR39 solid-state nuclear track detectors for passive indoor radon concentration measurements. Rad. Prot. Dos. 2015, 167, 302–305. [Google Scholar] [CrossRef]
- De Felice, P.; Jerome, S.; Petrucci, A. Practical implementation of ISO 11929: 2010. Appl. Rad. Isot. 2017, 126, 256–262. [Google Scholar] [CrossRef] [PubMed]
- Tsapalov, A.; Kovler, K. Metrology for Indoor Radon Measurements and Requirements for Different Types of Devices. Sensors 2024, 24, 504. [Google Scholar] [CrossRef] [PubMed]

Disclaimer/Publisher’s Note: The statements, opinions and data contained in all publications are solely those of the individual author(s) and contributor(s) and not of MDPI and/or the editor(s). MDPI and/or the editor(s) disclaim responsibility for any injury to people or property resulting from any ideas, methods, instructions or products referred to in the content. |
© 2026 by the authors. Licensee MDPI, Basel, Switzerland. This article is an open access article distributed under the terms and conditions of the Creative Commons Attribution (CC BY) license.