


Abstract
To address the lack of comprehensive quality evaluation indicators for heat treatment after bilateral induction hardening of high-speed linear guide rails, this study draws on the concept of geometric tolerance to innovatively propose a quantitative evaluation indicator for the “symmetry” of the hardening layer depth profile, and conducts non-destructive evaluation research based on ultrasonic transverse wave backscattering technology. Aiming at the complex cross-sectional profile of the guide rail and the problem of anisotropic acoustic scattering, a multi-dimensional symmetry characterization framework driven jointly by “local pair-wise tolerance zone constraints” and a “global equivalent case depth metric” was established. This dual-driven evaluation framework effectively eliminates the evaluation loophole of “false symmetry” caused by the mutual cancellation of opposite positive and negative local deviations. By constructing an equivalent hardened layer model based on discrete feature point mapping, the interference of non-parallel complex curved surfaces on traditional continuous B-scan imaging is successfully circumvented, achieving stable characterization of the overall hardening layer coverage under specific process parameters. A 15 MHz water-immersed point-focusing ultrasonic transverse wave oblique incidence detection system was developed, paired with a self-designed spring-loaded passive conformal tracking clamping mechanism for continuous automated scanning. Experimental results demonstrate that the overall equivalent symmetry of the tested guide rail specimens remains above 98%. Verified by the metallographic Vickers hardness gradient method, the equivalent relative error between the ultrasonically measured case depth and the physical case depth is only 1.0% and 1.6%. This proves that this non-destructive evaluation method possesses excellent measurement accuracy and holds significant industrial value for online non-destructive monitoring.
1. Introduction
With the continuous advancement of manufacturing technology, high-speed and precision equipment have been widely applied in fields such as aerospace, automotive, shipbuilding, and medical engineering. To satisfy the market demand for high-performance equipment, high-precision CNC machine tools, as the core of high-end manufacturing equipment, exhibit dynamic response and processing accuracy that directly determine the manufacturing quality of complex components [1,2]. High-speed linear guide rails, serving as key transmission components for achieving precise positioning and high-speed reciprocating motion in CNC machine tools, bear extreme service requirements of high rigidity, high load capacity, and excellent anti-vibration performance [3,4,5,6,7]. To guarantee their service life and wear resistance under high-speed and heavy-load operating conditions, the industry typically employs high-frequency induction surface quenching technology to heat-treat the near-surface zones of the guide rails [8,9]. This process transforms the near-surface microstructure into a fine, high-hardness martensitic lath structure, thereby endowing the guide rail with superior surface wear resistance and fatigue life, while retaining an excellent comprehensive toughness in the base matrix composed of a mixed microstructure of ferrite and pearlite [10]. After induction hardening, whether the evolution morphology of martensitic laths, grain boundary characteristics, and retained austenite distribution near the surface meet expectations directly determines the final operational reliability of the guide rail [10]. Therefore, conducting accurate quantitative evaluation of the hardened layer depth, macroscopic distribution uniformity, and microstructural gradients for high-frequency induction hardened linear guide rails carries vital engineering significance.
Over the past few decades, non-destructive testing (NDT) technologies based on ultrasonic waves have been widely implemented for the non-destructive evaluation of heat-treatment case depths. In early studies, Koppelmann [11] and Willems [12] pioneered the demonstration of utilizing the backscattering effect of ultrasonic transverse waves at the grain boundaries of the medium microstructure to measure the hardening depth of induction-hardened steel rolls and bearing rings. Building upon this physical foundation, Baqeri et al. [13] further successfully extended the ultrasonic backscattering method to measure the hardening depth profiles of induction-hardened steel shafts. Recently, benefiting from the fusion of advanced signal processing and phased array algorithms, numerous breakthroughs have been achieved in the ultrasonic non-destructive characterization of hardened layers: Salchak et al. [14] developed an integrated multi-functional ultrasonic testing instrument, significantly enhancing the engineering evaluation efficiency of carburized hardened layers; Hui et al. [15] proposed a method based on Full Matrix Capture (FMC) phased array ultrasonics combined with Common Mid-Point (CMP) gathers, successfully eliminating the reliance on prior material wave velocity and achieving adaptive depth calculation; Fu et al. [16] introduced a spatial gradient feature algorithm, effectively realizing case depth prediction in induction-hardened steel with broad transition zones; in more recent research, Hui et al. [17] further leveraged ultrasonic phased array technology to develop wave velocity inversion and migration imaging methods, opening new pathways for the visualization of geometric boundary characteristics inside the hardened layer.
However, for the specific structural object of high-speed linear guide rails, the traditional ultrasonic characterization framework still faces two critical research gaps in industrial applications:
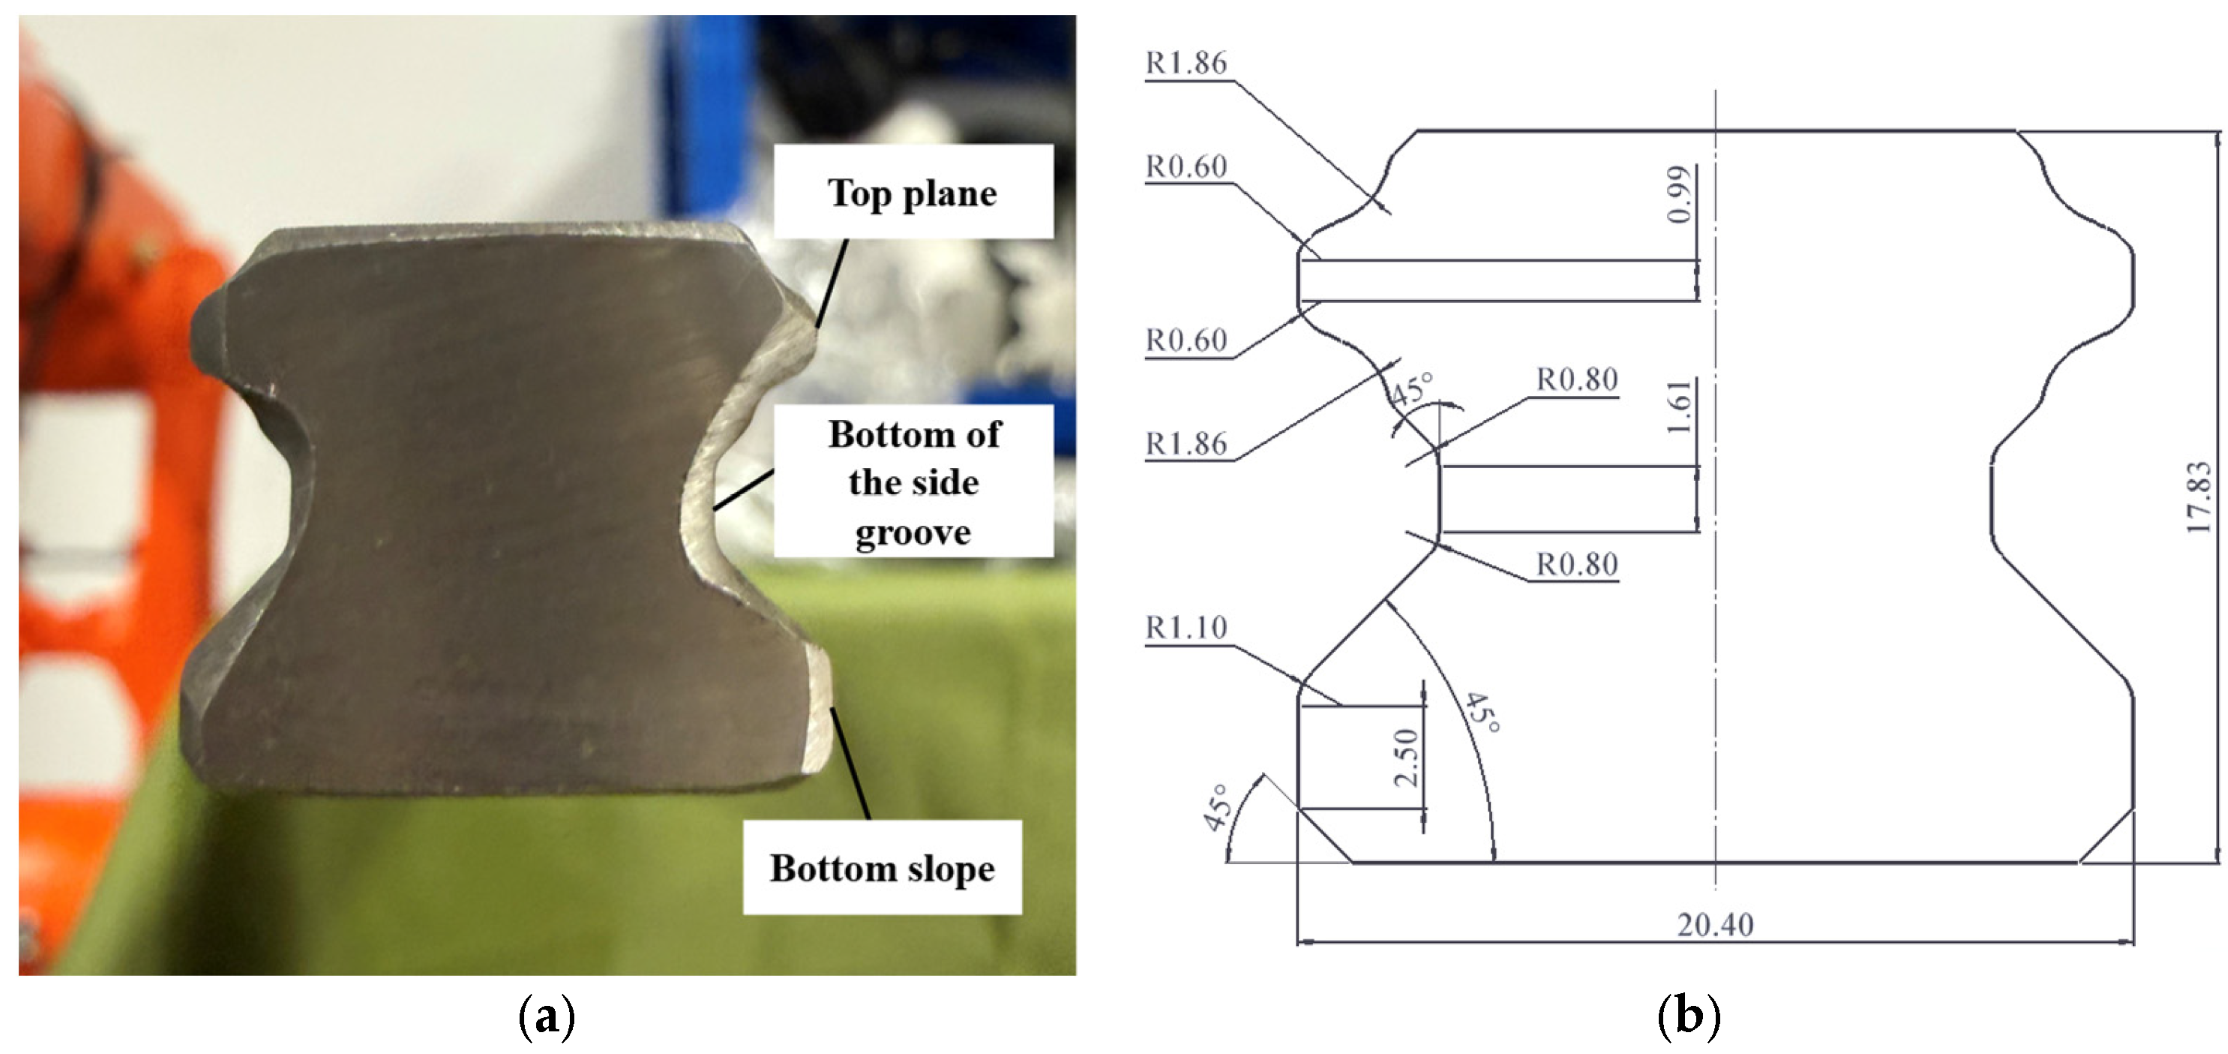
First, the interference of complex cross-sectional geometry. The vast majority of existing non-destructive depth measurement models are only applicable to regular and symmetric components such as flat plates, cylinders, or bearing rings [11,12,13]. In contrast, the cross-section of an industrial-grade linear guide rail is intricately composed of extremely narrow planes (the narrowest being only 0.99 mm), inclined machined surfaces, and circular arc rolling grooves [6]. When non-parallel complex curved surfaces encounter obliquely incident acoustic waves, severe acoustic scattering aberrations are induced, making it impossible to reliably implement continuous B-scan imaging via traditional dense scanning due to severe artifacts [18].
Second, the lack of quantitative comprehensive evaluation of bilateral symmetry. Existing literature, including prior research by the authors’ team (such as the B-scan and 3D visual presentation framework established by Chen et al. [18]), primarily focuses on measuring the absolute depth and micro-depth morphology of the hardened layer on a “single side” of the inspected component. Nevertheless, in the actual manufacturing of linear guide rails, a synchronous dual-side induction hardening process is utilized. Due to process perturbations such as coaxial misalignment between the induction coil and the guide rail centerline or unbalanced quenching fluid delivery on the two sides, the phenomenon of inconsistent case depths on the two sides is easily induced. This bilateral asymmetry in the hardening layer distribution is the underlying cause for inducing internal residual stress imbalance and accelerating long-term operational geometric distortion of the guide rails. Therefore, shifting the evaluation paradigm from isolated “single-side depth tracking” to an overall “bilateral geometric tolerance symmetry quantitative assessment” represents a bottleneck problem that urgently needs to be solved in guide rail manufacturing quality control.
To overcome the aforementioned limitations, this paper, for the first time, introduces the concept of “symmetry” from geometric tolerances into non-destructive heat-treatment quality evaluation to quantitatively evaluate the uniformity of the bilateral microstructural distribution in linear guide rails. To this end, this study not only defines a multi-dimensional symmetry evaluation architecture encompassing one-dimensional local point-pairs and two-dimensional profiles, but also proposes a dual evaluation criterion driven jointly by “local pair-wise tolerance zone constraints” and a “global equivalent case depth metric.” This framework thoroughly eliminates the evaluation loophole of “false symmetry” caused by the mutual cancellation of opposite deviations during global averaging. Aiming at the curved surface acoustic scattering problem caused by non-parallel inclined planes, this paper abandons the conventional continuous B-scan route and establishes an equivalent hardened layer model based on discrete feature point mapping, which significantly enhances the robustness of the process characterization. Based on this model, a 15 MHz high-frequency water-immersed point-focusing ultrasonic transverse wave oblique incidence automated detection system was designed and constructed. Paired with a self-developed Flexible conformal fitting and clamping mechanism, high-stability online monitoring along the entire length of GH20 guide rail specimens was achieved. Finally, the metallographic microhardness gradient method was employed to conduct a comprehensive comparative validation of the ultrasonic measurement accuracy and the efficacy of the symmetry indicators.
2. Theory
2.1. The Concept of Symmetry in Geometric Tolerances
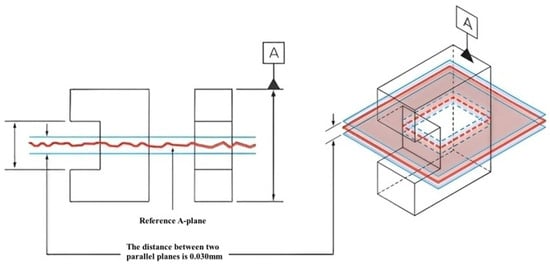
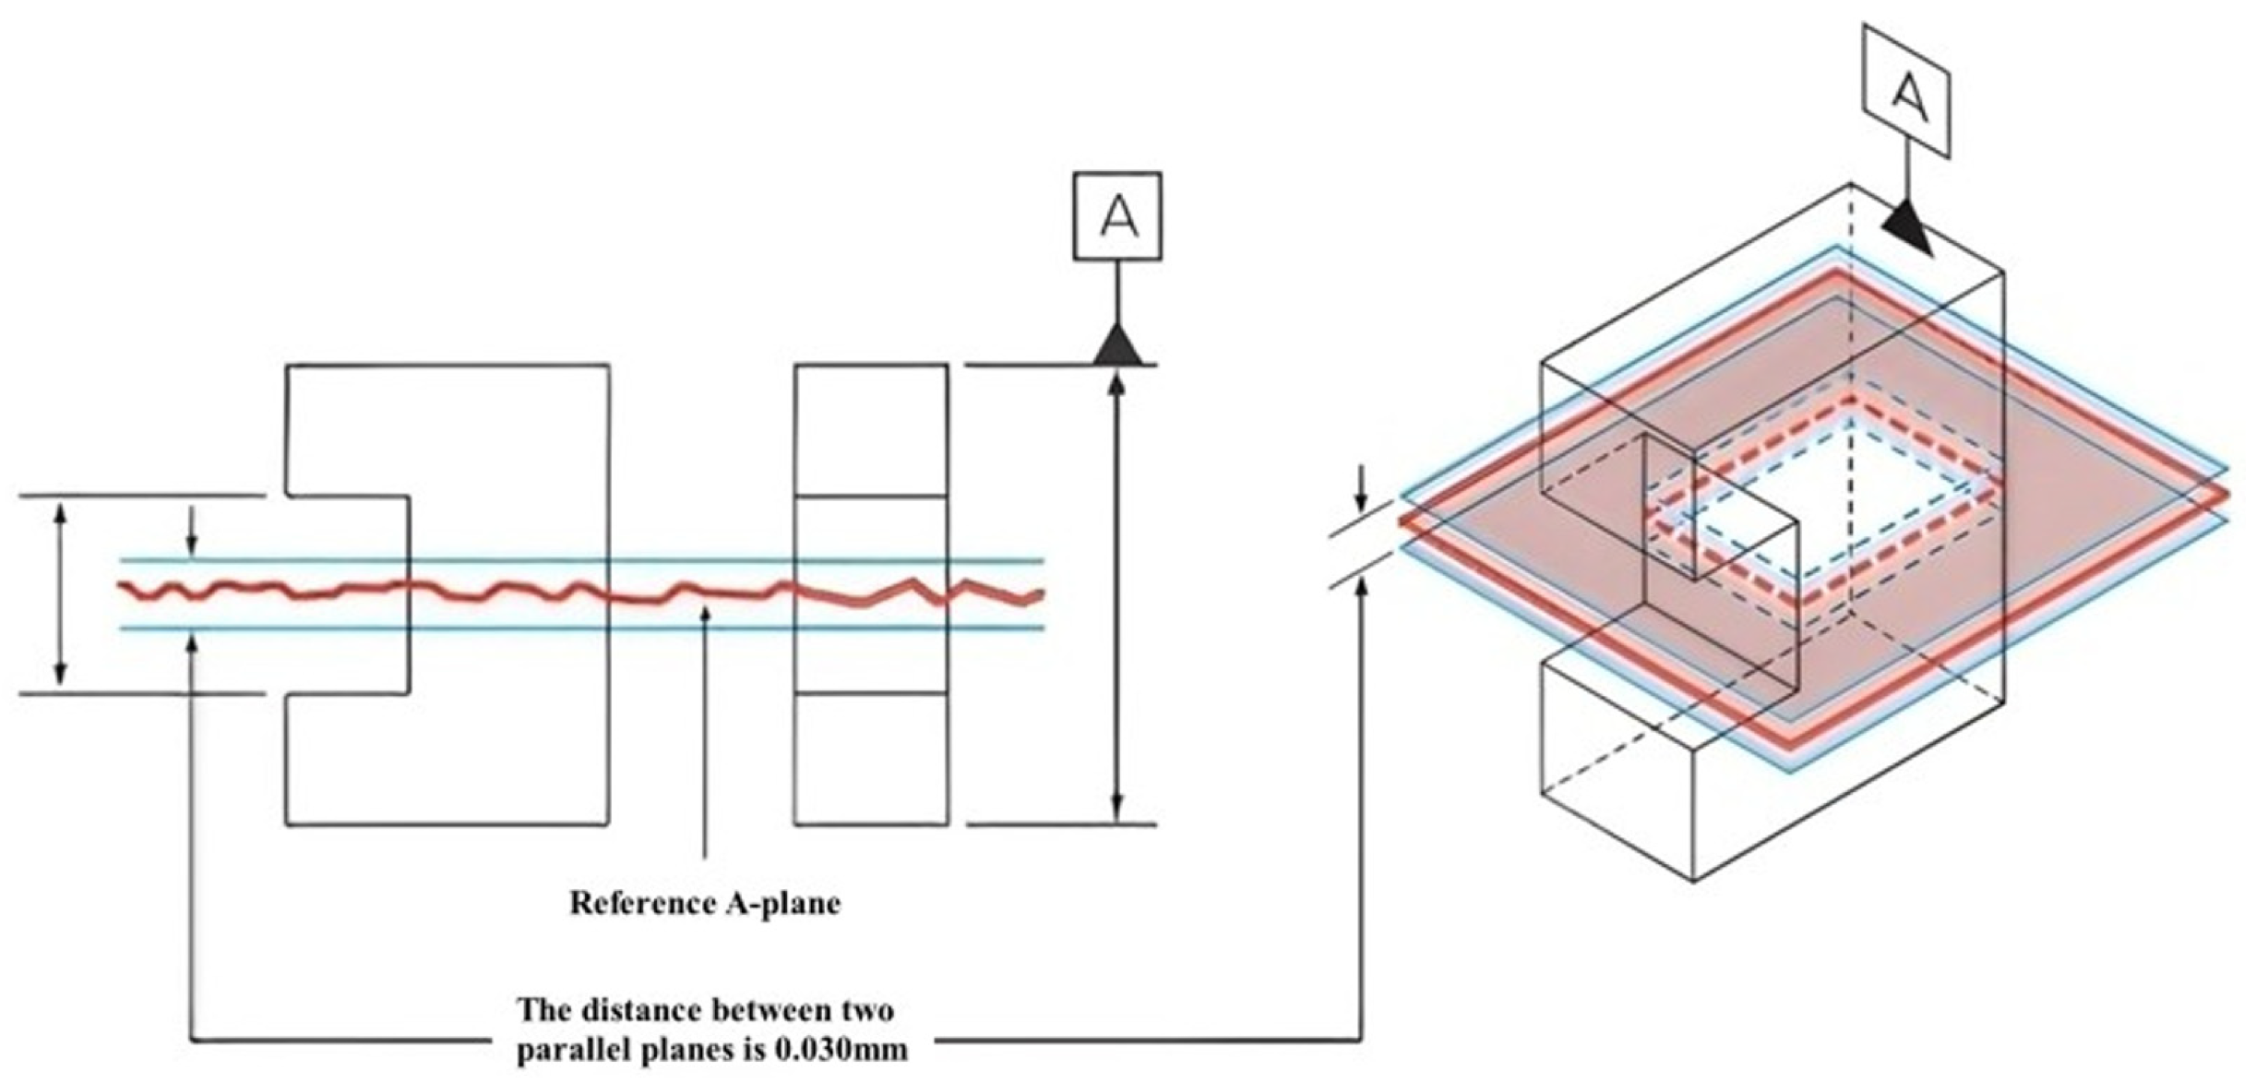
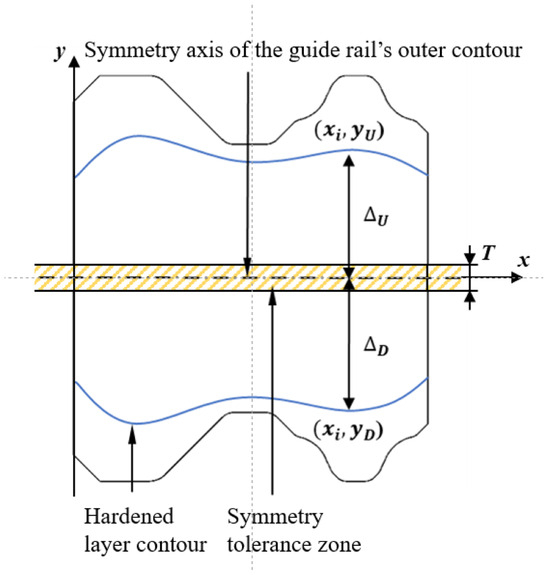
From the perspective of geometric tolerances, symmetry is a three-dimensional tolerance whose primary function is to ensure that two features on a part are uniformly distributed relative to a datum plane. To satisfy the symmetry tolerance requirements for a component, a predefined center plane is usually established as the evaluation datum. It requires that the median distance between corresponding points on the two surface features must fall near this center datum plane and remain within the allowable range of the tolerance zone, as illustrated in the evaluation diagram in Figure 1.
Figure 1.
Schematic diagram of traditional symmetry evaluation method.
As a three-dimensional tolerance, traditional symmetry measurement is extremely difficult. The primary reason is that its tolerance zone is established on a virtual datum plane; thus, it cannot be rapidly measured using standard hand-held gauges. Typically, to measure symmetry, a Coordinate Measuring Machine (CMM) must be configured to calculate the theoretical midpoint datum plane while measuring the surface areas of the two surface features, eventually determining the position of the feature midpoints relative to the datum plane. This method is complex and exhibits poor stability. Therefore, when symmetry is specified as a geometric tolerance requirement, it is generally avoided in most manufacturing scenarios due to its high measurement difficulty, and flatness, parallelism, or true position are preferred for constraints, annotation, and measurement instead.
2.2. Guide Rail Hardened Layer Depth Profile “Symmetry”
After undergoing the bilateral quenching process, the cross-section of the guide rail consists of three distinct zones: the base matrix, the transition zone, and the hardened layer, exhibiting a high degree of macroscopic symmetry. Asymmetry in the bilateral hardened layer depth can be caused by the following factors: (1) coaxial misalignment between the induction coil and the guide rail centerline; (2) variations in the gap from the coil to the surface along the length direction; (3) unbalanced quenching fluid delivery; and (4) material property variations such as local carbon depletion. In industrial production, such asymmetry occurs occasionally, particularly during the initial process setup phase or when coil wear alters the geometric shape.
Therefore, drawing on the definition of symmetry in geometric tolerances, this paper introduces the evaluation indicator of hardening layer depth profile “symmetry”. It aims to quantitatively evaluate the distribution symmetry of the hardened layer structural features formed after quenching on the high-speed linear guide rail. Unlike traditional geometric tolerance symmetry, the hardened layer depth profile “symmetry” does not focus on controlling the geometric external shape, but stands on the symmetry of the post-heat-treatment hardened layer profile, aiming to provide a supporting foundation for guide rail performance assurance at the microstructural level.
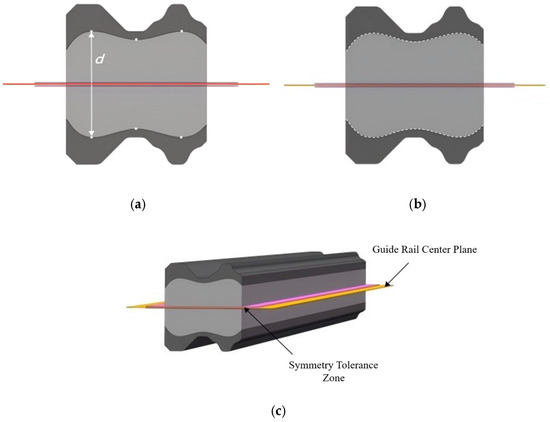
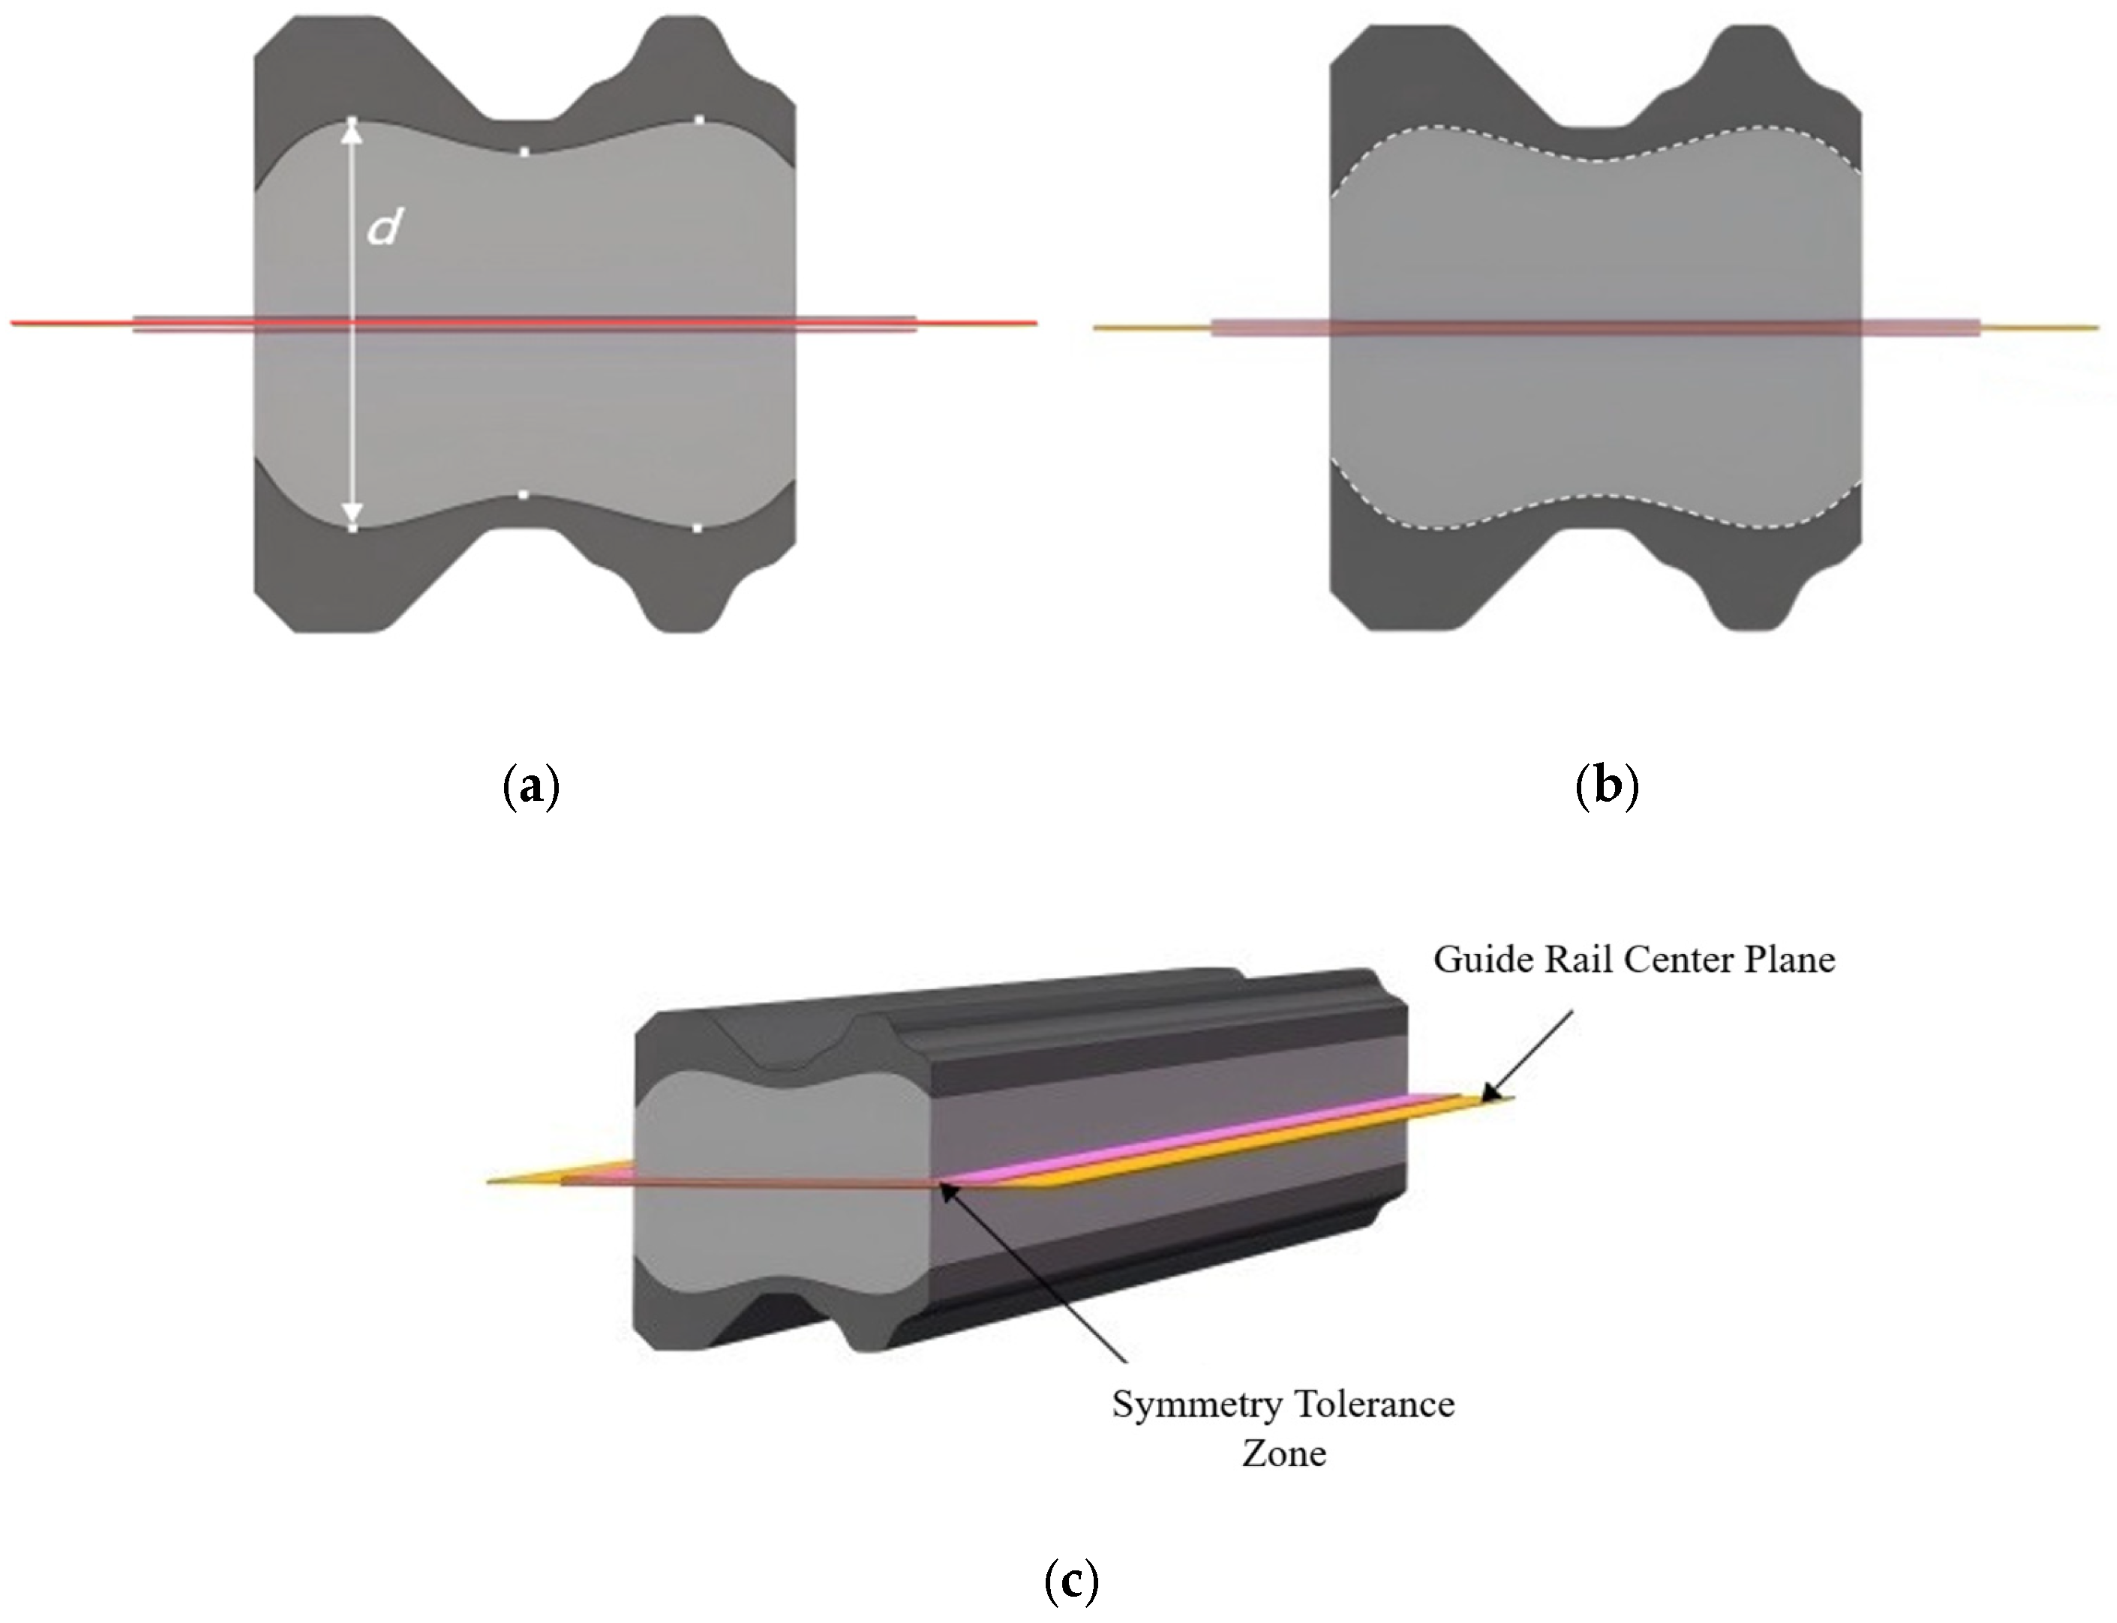
Based on this, this paper establishes the concept of “symmetry” for the hardening layer depth profile of high-speed linear guide rails, proposing definitions for one-dimensional and two-dimensional profile “symmetry”. The multi-dimensional symmetry evaluation framework will evaluate the hardening layer distribution comprehensive from one-dimensional case depth data and two-dimensional cross-sectional case depth profile curves, offering a complete evaluation of the guide rail quality. The schematic diagrams for each dimension of symmetry are presented in Figure 2.
Figure 2.
Schematic diagram of the multi-dimensional symmetry of the rail hardening layer depth profile. (a) One-dimensional symmetry; (b) Two-dimensional symmetry of a cross-section; (c) Overall two-dimensional symmetry.
Specifically, Figure 2a represents the one-dimensional symmetry of the hardening layer profile, denoting the symmetry between two mutually corresponding points on opposite sides of the guide rail centerline. Figure 2b represents the two-dimensional symmetry of the hardening layer profile, denoting the symmetry between the hardening layer distribution curves on opposite sides of the guide rail centerline. Figure 2c represents the overall two-dimensional symmetry of the hardening layer profile, denoting the overall state of symmetry of the hardening layer distributed along the entire length of the guide rail, using the guide rail center plane as the datum.
2.3. Evaluation Method for Guide Rail Hardened Layer Depth Profile “Symmetry”
This section will analogously establish the evaluation method for the “symmetry” of the hardening layer depth profile on high-speed linear guide rails. This method can be implemented for symmetry evaluation after obtaining the hardening layer profile via the destructive metallographic method. Furthermore, it lays the foundation for developing subsequent non-destructive ultrasonic evaluation methods for the guide rail hardened layer profile symmetry.
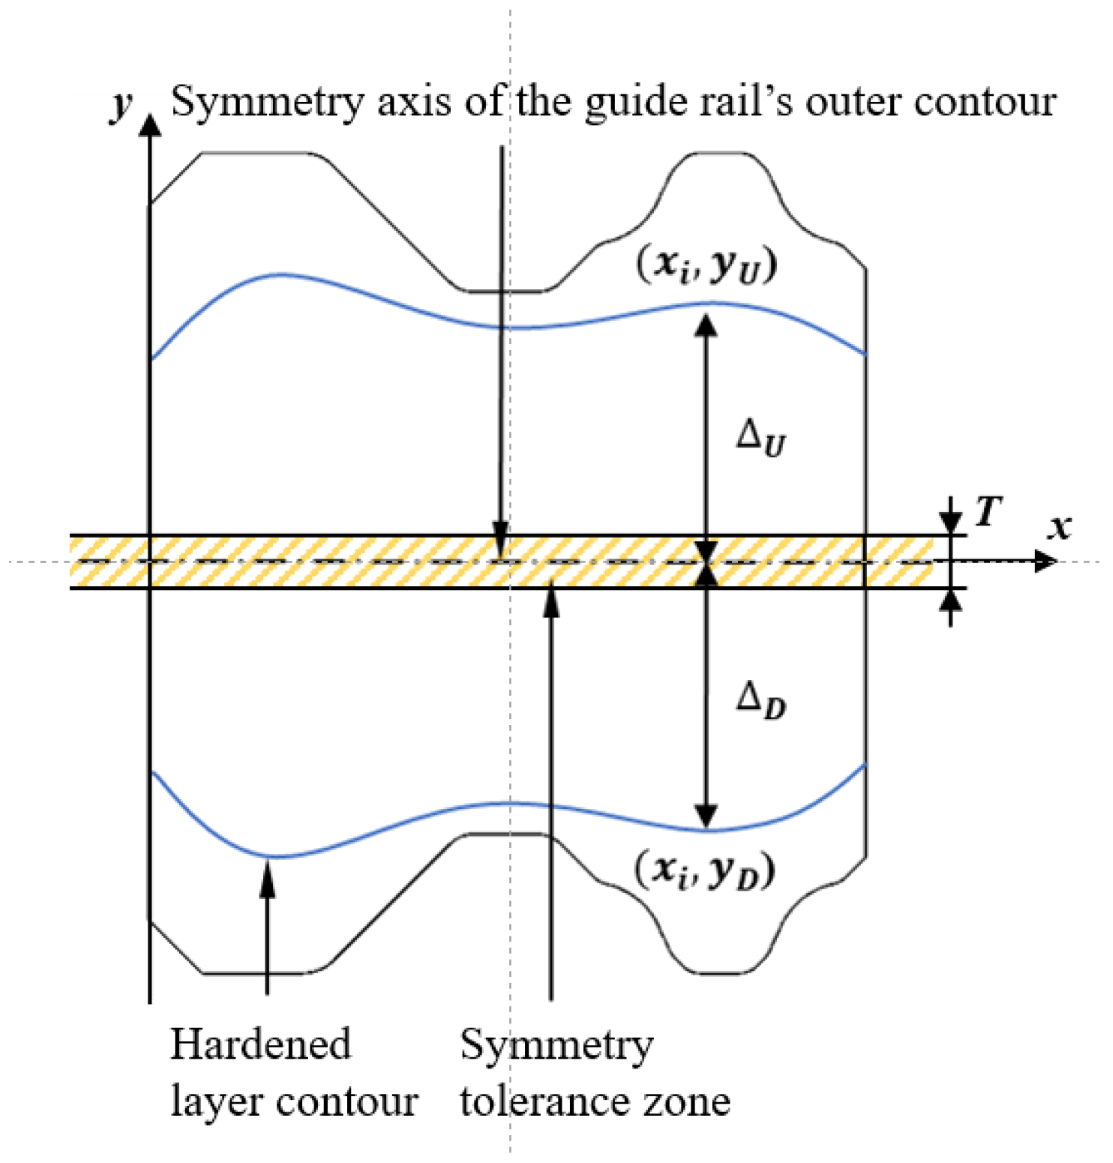
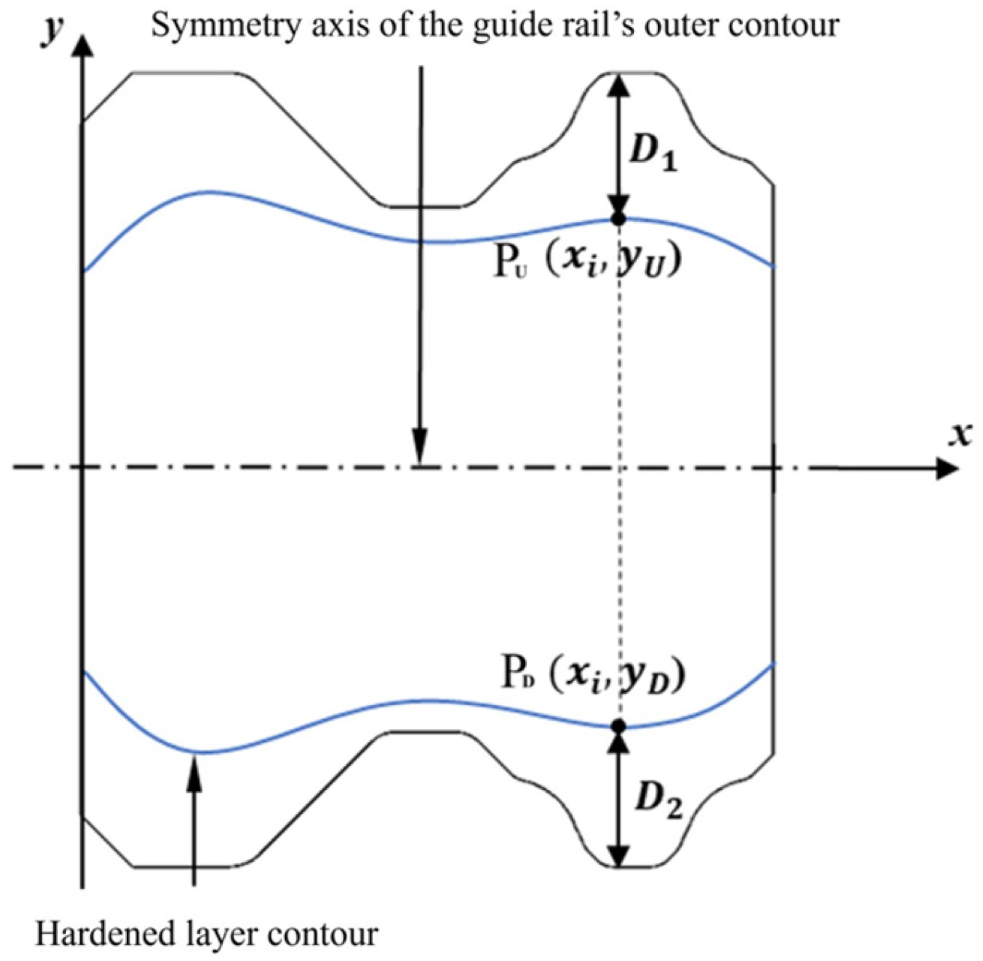
The core concept of this method is as follows: using the symmetry axis of the guide rail’s outer contour as the datum plane for “symmetry” evaluation, points on the hardening layer profile curves on both the left and right sides at the same height are extracted. Their coordinates relative to the symmetry axis are calculated to determine the respective offsets. By comparing these offsets with a predefined tolerance band width, quantitative evaluation of the symmetry between the two points is realized. The specific process is executed as follows:
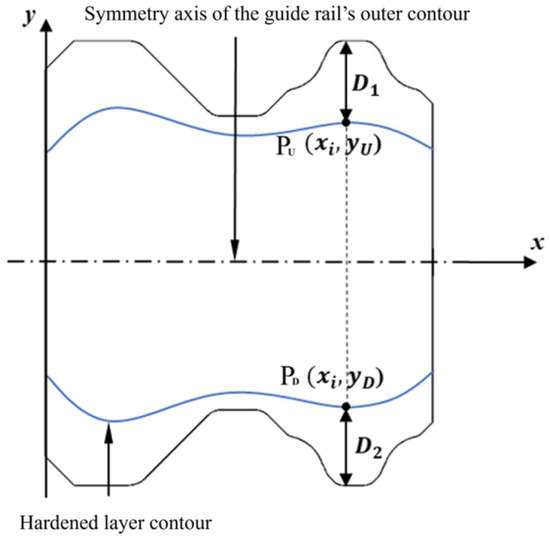
In accordance with Figure 3, a Cartesian coordinate system is established. Assuming a given coordinate xi on the cross-section of the guide rail, points PU(xi, yU) and PD(xi, yD) are extracted from the upper and lower hardening layer profile curves, respectively. The offsets of these two points relative to the symmetry axis are given by:
Figure 3.
Schematic diagram of hardening layer depth profile “symmetry” evaluation.
Then, the local hardening layer depth profile “symmetry” deviation at this coordinate is defined as:
Let T denote the predefined symmetry tolerance band width (e.g., T = 0.2 mm, determined by the engineering requirements of the specific guide rail model). For each sampling point i (where i = 1, 2, …, N, and N is the total number of sampling locations along the horizontal direction of the cross-section), if δi ≤ T, the local sampling point is considered to satisfy the symmetry requirement of the hardening layer profile. To evaluate the global symmetry of the entire hardening layer profile curve, the average deviation indicator D across all N sampling points is defined as follows:
The value of N is dictated by the sampling resolution of the profile data. In this study, when utilizing metallographic images, N corresponds to the number of pixel columns within the width range of the guide rail; when utilizing ultrasonic measurement, N corresponds to the discrete number of horizontal scanning positions.
By averaging the “symmetry” deviations of all sampling points via Equation (3) and comparing the result with the tolerance band, the global “symmetry” of the entire hardened layer profile curve can be evaluated. This evaluation method serves as a universal framework for guide rail hardening layer profile symmetry and is applicable to scenarios where the hardening layer profile curves can be directly acquired, such as direct measurement from macro-metallographic images.
3. Methods
3.1. Ultrasonic Transverse Wave Backscattering Effect Between Guide Rail Hardened Layer and Matrix
By analyzing the influence of the hardened layer on ultrasonic propagation characteristics, it is found that the case depth can be detected by utilizing the ultrasonic backscattering effect caused by material microstructural differences when ultrasonic waves propagate through the linear guide rail. To fully exploit the detection advantages of ultrasonic transverse waves, which are highly sensitive to microstructural changes, this section describes the ultrasonic transverse wave backscattering effect in linear guide rails and establishes the backscattering model.
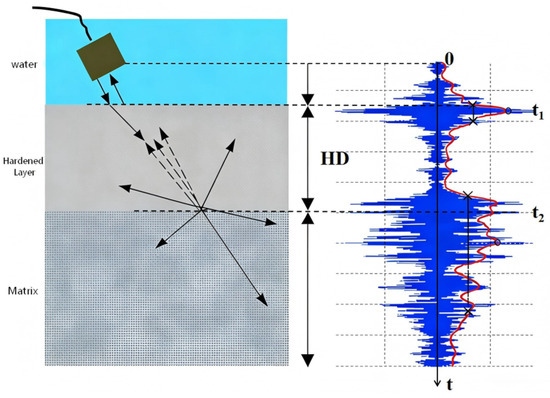
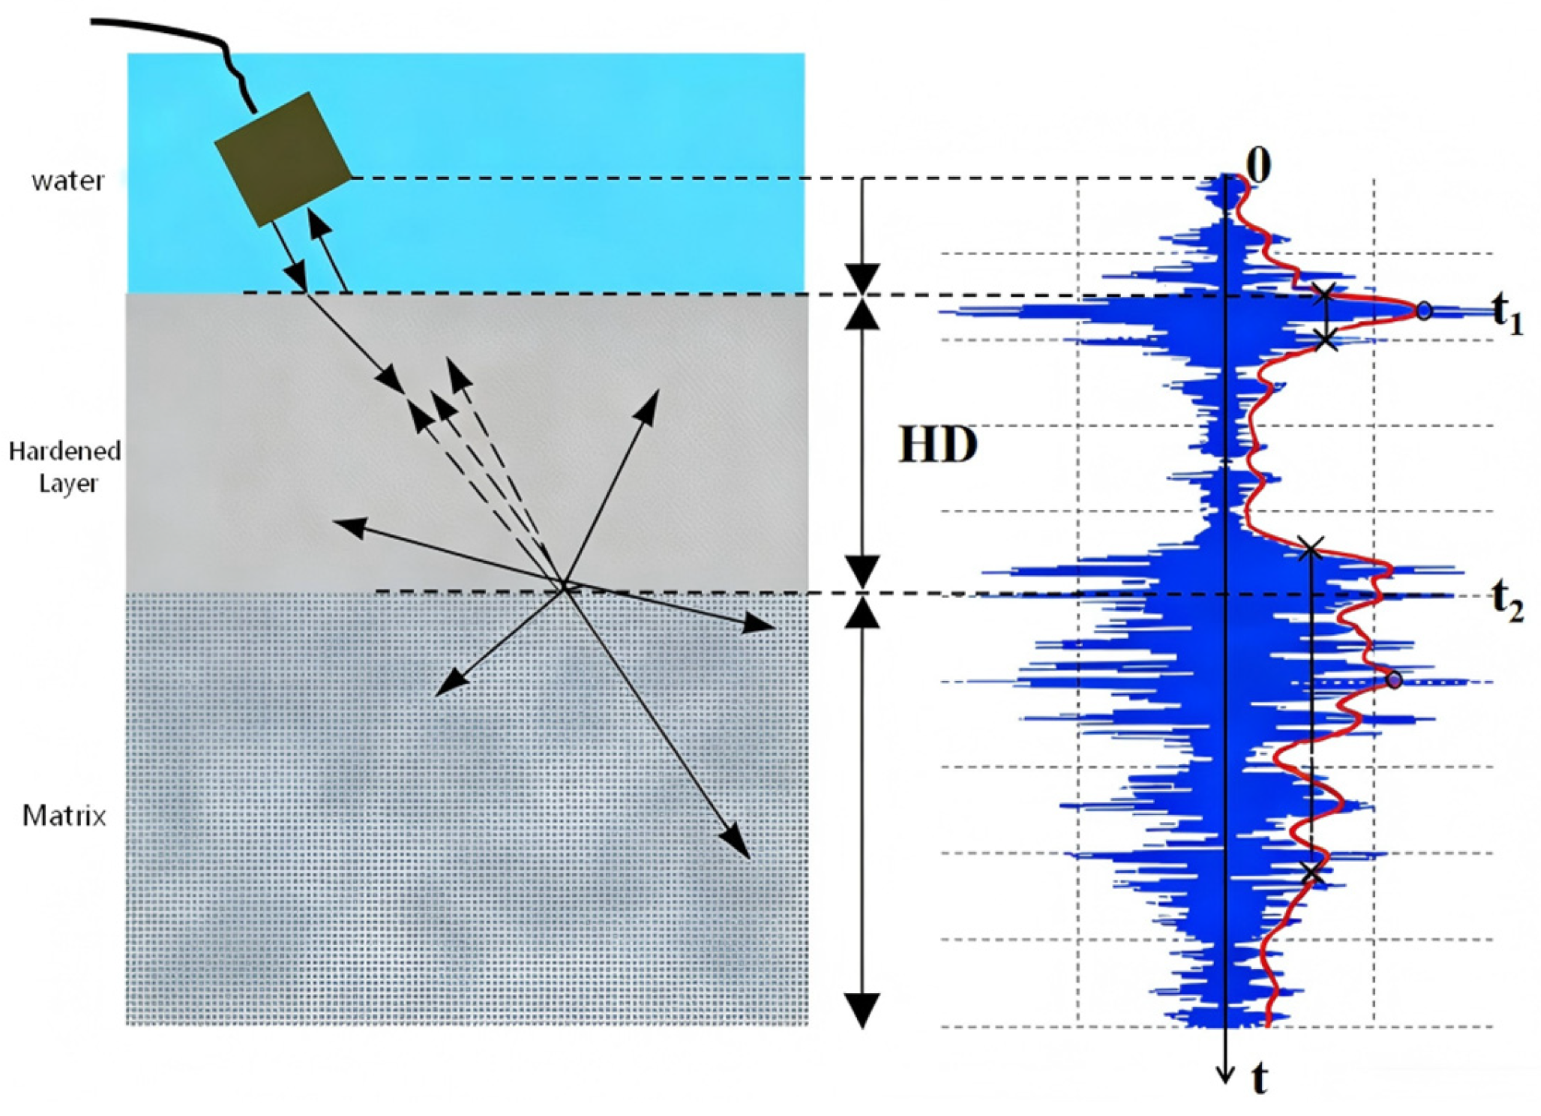
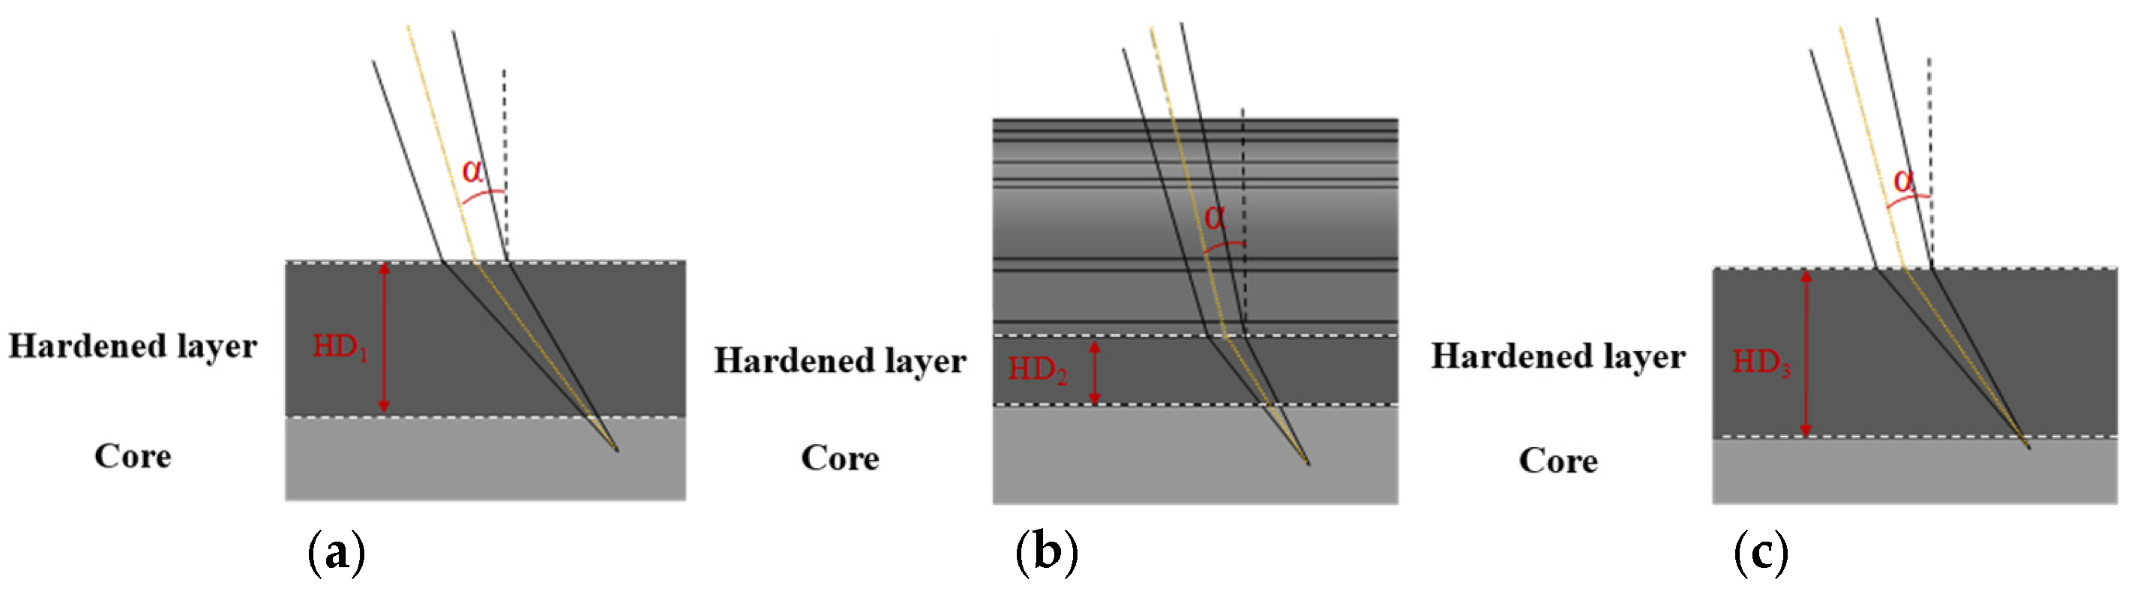
The application of ultrasonic transverse waves for detecting case depths was first implemented by Koppelmann for hardening layer inspection on steel rolls. Subsequently, H. Willems applied it to bearing ring case depth testing. In Willems’ experiments, bearing rings made of chrome-molybdenum steel were used, and the hardening depth range was accurately measured using the hardness method, recording the hardness information at different depths. Then, following the arrangement shown in Figure 4, a water-immersed probe was oriented at a specified oblique incidence angle. Refraction occurs at the water-steel coupling interface, generating refracted transverse waves inside the medium with the maximum transmission amplitude.
Figure 4.
Schematic diagram of shear wave testing for the hardness layer depth using the water immersion method.
The water-guide rail interface encounters a massive acoustic impedance mismatch: water is approximately 1.5 MRayl, while steel is approximately 45 MRayl. The vertical incidence reflection coefficient is around 0.94. Beam divergence and surface roughness partially reduce the front-surface echo amplitude.
The backscattering signal from the hardened layer itself originates from the fine 2–5 μm martensitic laths. Individual scatterers are weak, but they undergo coherent superposition within the focal volume (diameter ≈ 0.7 mm), generating a moderate signal amplitude.
The hardened layer-matrix transition zone exhibits the strongest scattering per unit volume because the microstructure abruptly changes from fine martensite to coarse ferrite-pearlite. In the Rayleigh scattering regime, the scattering cross-section is proportional to the sixth power of the particle size (Vs d6). The 10–30 μm ferrite-pearlite grains are much larger than the martensitic laths, making their scattering efficiency roughly one order of magnitude higher.
Let t be the time-of-flight (TOF) between the front surface wave and the backscattered signal from the boundary; the hardened layer depth (HD) can be calculated by the following formula:
where vT is the transverse wave propagation velocity in the medium, and β is the refraction angle of the transverse wave in the medium. According to Snell’s law, β satisfies the following relationship:
Here, α is the probe incident angle. The parameters c1 and c2 denote the acoustic longitudinal wave velocity in the first medium and the acoustic wave velocity in the second medium, respectively.
Summarizing Willems’ research, it can be confirmed that it is highly feasible to process the ultrasonic transverse wave backscattering signals to obtain the hardened layer depth by utilizing the backscattering effect caused by the microstructural differences between the hardened layer and the matrix. Subsequently, the ultrasonic evaluation of the hardening layer profile “symmetry” will be achieved based on the established ultrasonic transverse wave backscattering effect.
3.2. Evaluation Method for Guide Rail Hardened Layer Depth Profile “Symmetry” Based on Ultrasonic Transverse Wave Backscattering
Here, the same cross-sectional Cartesian coordinate system as established in Section 2.3 is used. Through the ultrasonic transverse wave backscattering effect, the hardened layer depth D1 at point PU(xi, yU) on the cross-section is obtained, while the hardened layer depth D2 at point PD(xi, yD) on the opposite side at the same horizontal coordinate is measured. To quantify the local “symmetry” of the hardening layer profile at the same coordinate, Sd is defined as the hardening layer depth profile “symmetry,” representing the degree of depth variation between both sides of the cross-section, calculated by the following formula:
It can be observed that when D1 = D2, Sd = 1, which represents perfectly consistent case depths on both sides, meaning the hardening layer profile is completely symmetric. Thus, the allowable deviation of Sd can be defined as the tolerance band range. In this study, it is stipulated that when Sd ≥ 0.9, the bilateral hardening layer profile “symmetry” satisfies the manufacturing technical requirements (The induction hardening process of this guide rail under stable conditions typically achieves a bilateral depth consistency within ±5%. The 90% threshold provides a scientifically justified guard band that accommodates measurement uncertainties and minor process fluctuations while maintaining high sensitivity to significant asymmetry).
The data source for the hardening layer profile “symmetry” evaluation method established here is the case depth information acquired based on the ultrasonic transverse wave backscattering effect. Compared with the direct profile measurement method described above, this method offers distinct convenience: it eliminates the need to measure the distance from the hardened layer profile to the outer contour symmetry axis, and avoids destructive cutting of the guide rail, making it highly suitable for industrial online measurement. The schematic diagram of this evaluation method is shown in Figure 5.
Figure 5.
Case depth-based evaluation method for hardening layer depth profile “symmetry”.
For linear guide rail hardened layer testing, due to its complex cross-sectional geometry, the propagation paths and reflection mechanisms of ultrasonic waves in different zones of the guide rail exhibit significant discrepancies. This makes it extremely challenging to acquire continuous cross-sectional B-scan images via dense ultrasonic A-scan scanning or phased array probes. Particularly when the outer contour of the guide rail consists of inclined and curved surfaces, because the internal hardening layer boundary is not parallel to the outer incident plane, severe acoustic wave scattering occurs, failing to produce effective refracted transverse waves.
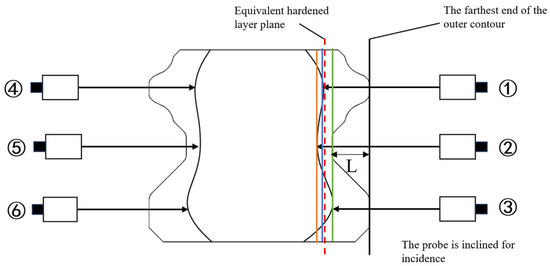
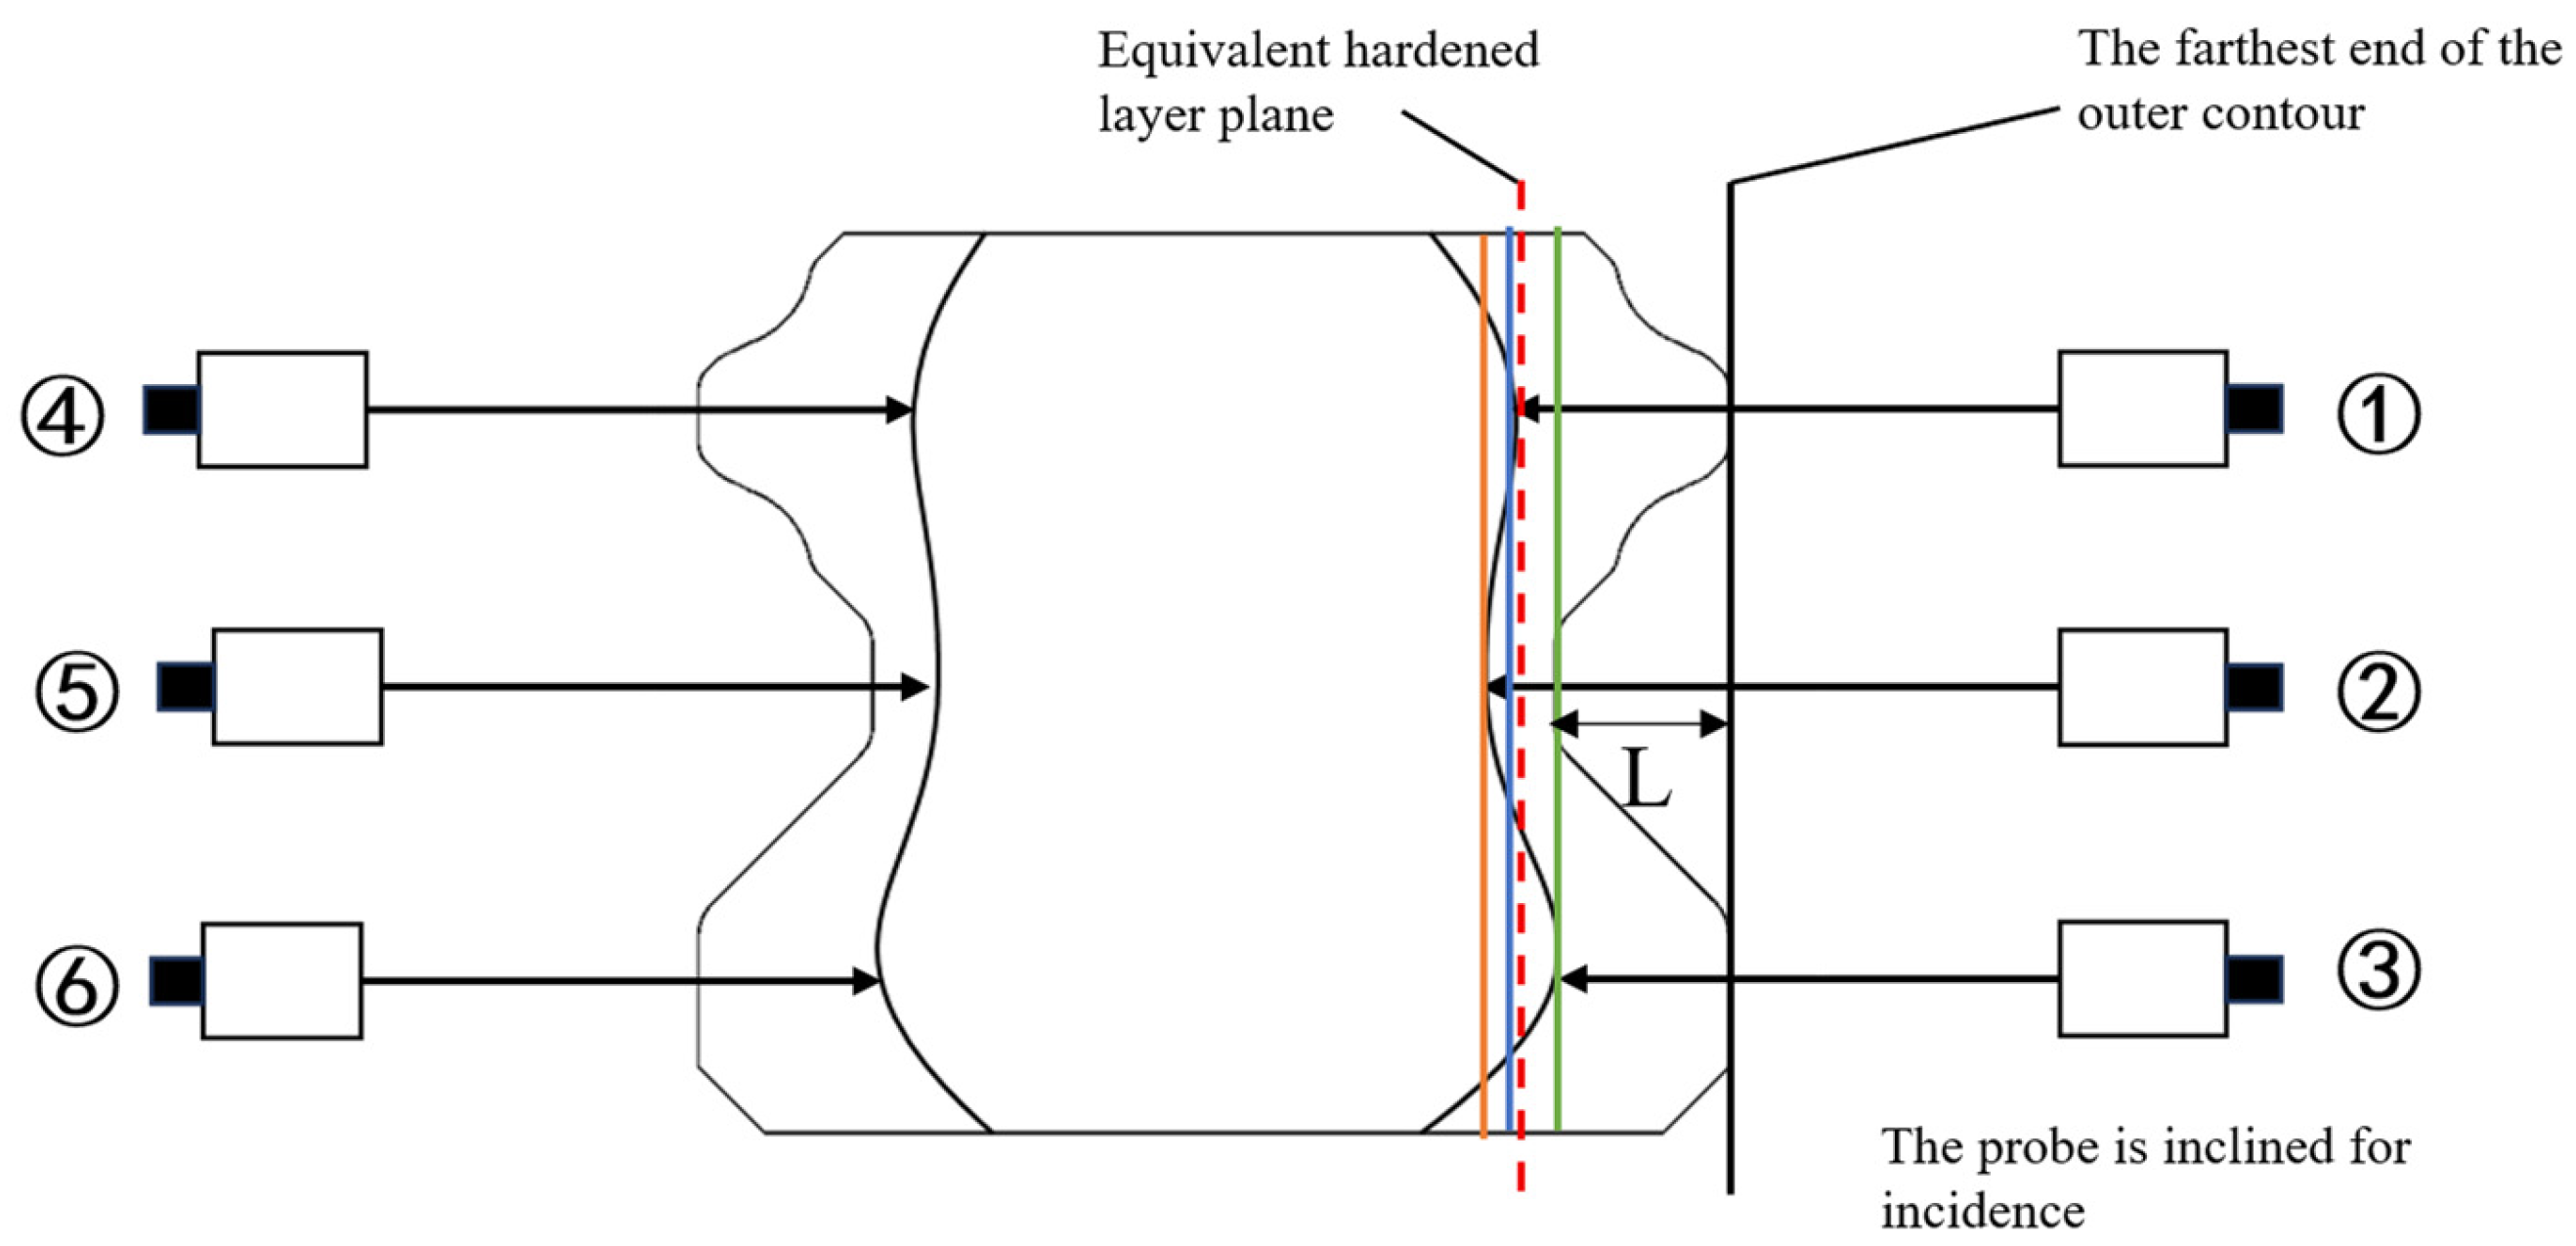
To address these challenges, this paper proposes an equivalent hardened layer model based on discrete feature point mapping, as shown in Figure 6. Taking the right side as an example, the hardened layer depths corresponding to the current feature points are obtained via ultrasonic measurement, denoted as D1, D2, and D3. The outer contour distance from point ② to its farthest end point is denoted as L. By substituting these values into Equation (7), the equivalent hardened layer depth is obtained (indicated by the red dashed line in Figure 6). Repeating the same steps for the left side yields the left equivalent hardened layer depth . Then, the symmetry index Sa is calculated using these equivalent depths via Equation (8). This method eliminates point-by-point random depth fluctuations and provides a stable characterization of the overall hardening layer coverage level under specific process parameters.
Figure 6.
Schematic diagram of constructing the equivalent hardened layer model on the right side of the guide rail.
To clarify the geometric rationale of Equation (7), the denominator is specified as “3” because the evaluation metric represents the mathematical expectation (mean value) derived from three independent localized profile feature points on each side of the linear guide rail, rather than a perimeter or boundary constraint involving four points. L represent the characteristic nominal distance from the outer contour feature point to the central vertical symmetry datum of the rail. Furthermore, the parameter L is implemented to align the spatial baselines of these three discrete measurement points. Due to the complex, multi-stepped cross-sectional geometry of the guide rail, the physical ultrasonic entry surfaces at different positions naturally sit at staggered initial depths. The primary purpose of introducing L is to standardize the baseline, ensuring that the nominal case depths of all three local feature points are strictly calculated starting from the exact same outer boundary reference line. This geometric alignment eliminates spatial artifacts and enables a valid, rigorous bilateral symmetry evaluation on a perfectly unified scale.
This model eliminates random jumps in individual measurement points caused by minor electromagnetic field fluctuations or microstructural inhomogeneity during the induction heating process in the two-dimensional plane, thereby reflecting the macroscopic coverage level of the hardened layer under the given process parameters. This possesses excellent engineering practicality for linear guide rail structures.
Based on this, a two-dimensional “symmetry” evaluation method based on the equivalent hardened layer model can be formulated. The equivalent hardened layer depth “symmetry” index is defined as Sa, calculated as follows:
Similar to the single-point case depth evaluation framework, when Sa = 1, the left and right equivalent hardened layer depths are perfectly equal. Sa < 1 implies the existence of non-uniform distribution between the bilateral equivalent hardened layer planes. Maintaining consistency with the above text, the acceptance threshold is likewise set at Sa ≥ 0.9. When this requirement is satisfied, the hardening layer profile “symmetry” complies with the regulations.
Averaging the three feature points into an equivalent depth successfully suppresses random point-to-point fluctuations and provides a stable index for the overall process conditions. However, to prevent the “false symmetry” condition where local deviations with opposite signs cancel each other out in the global average, a local constraint clause must be enforced. For each symmetric point pair (L1/R1, L2/R2, L3/R3), the individual depth deviation must independently satisfy , T = 0.2 mm (The normal fluctuation amplitude of induction hardening depth under conventional processes is about 5% of the targeted depth, corresponding to approximately 0.2 mm). In all tested specimens, every single point pair successfully satisfied this criterion, confirming that the global equivalent index Sa does not mask localized asymmetries.
4. Results
4.1. Guide Rail Sample
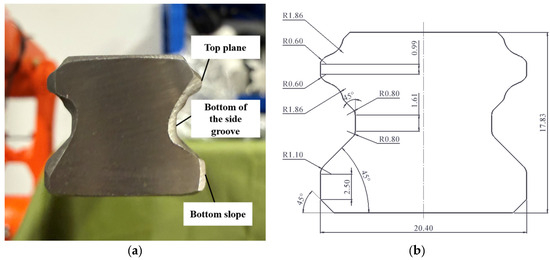
The high-speed linear guide rail specimen model utilized in the experiment is GH20, and the physical specimen is shown in Figure 7. Its material is S55C carbon steel for machine structural use. It features excellent elastic properties, uniform metallographic structure, and superior machining performance, making it highly suitable for surface hardening treatments such as high-frequency induction hardening and flame hardening. The specific material properties parameters are listed in Table 1.
Figure 7.
Photograph and cross-sectional dimension parameters of the GH20 linear guide rail specimen: (a) physical photograph; (b) dimensional diagram.
Table 1.
Material Performance Parameters of S55C Steel Plate.
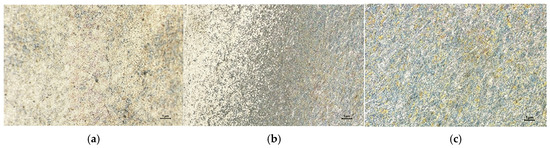
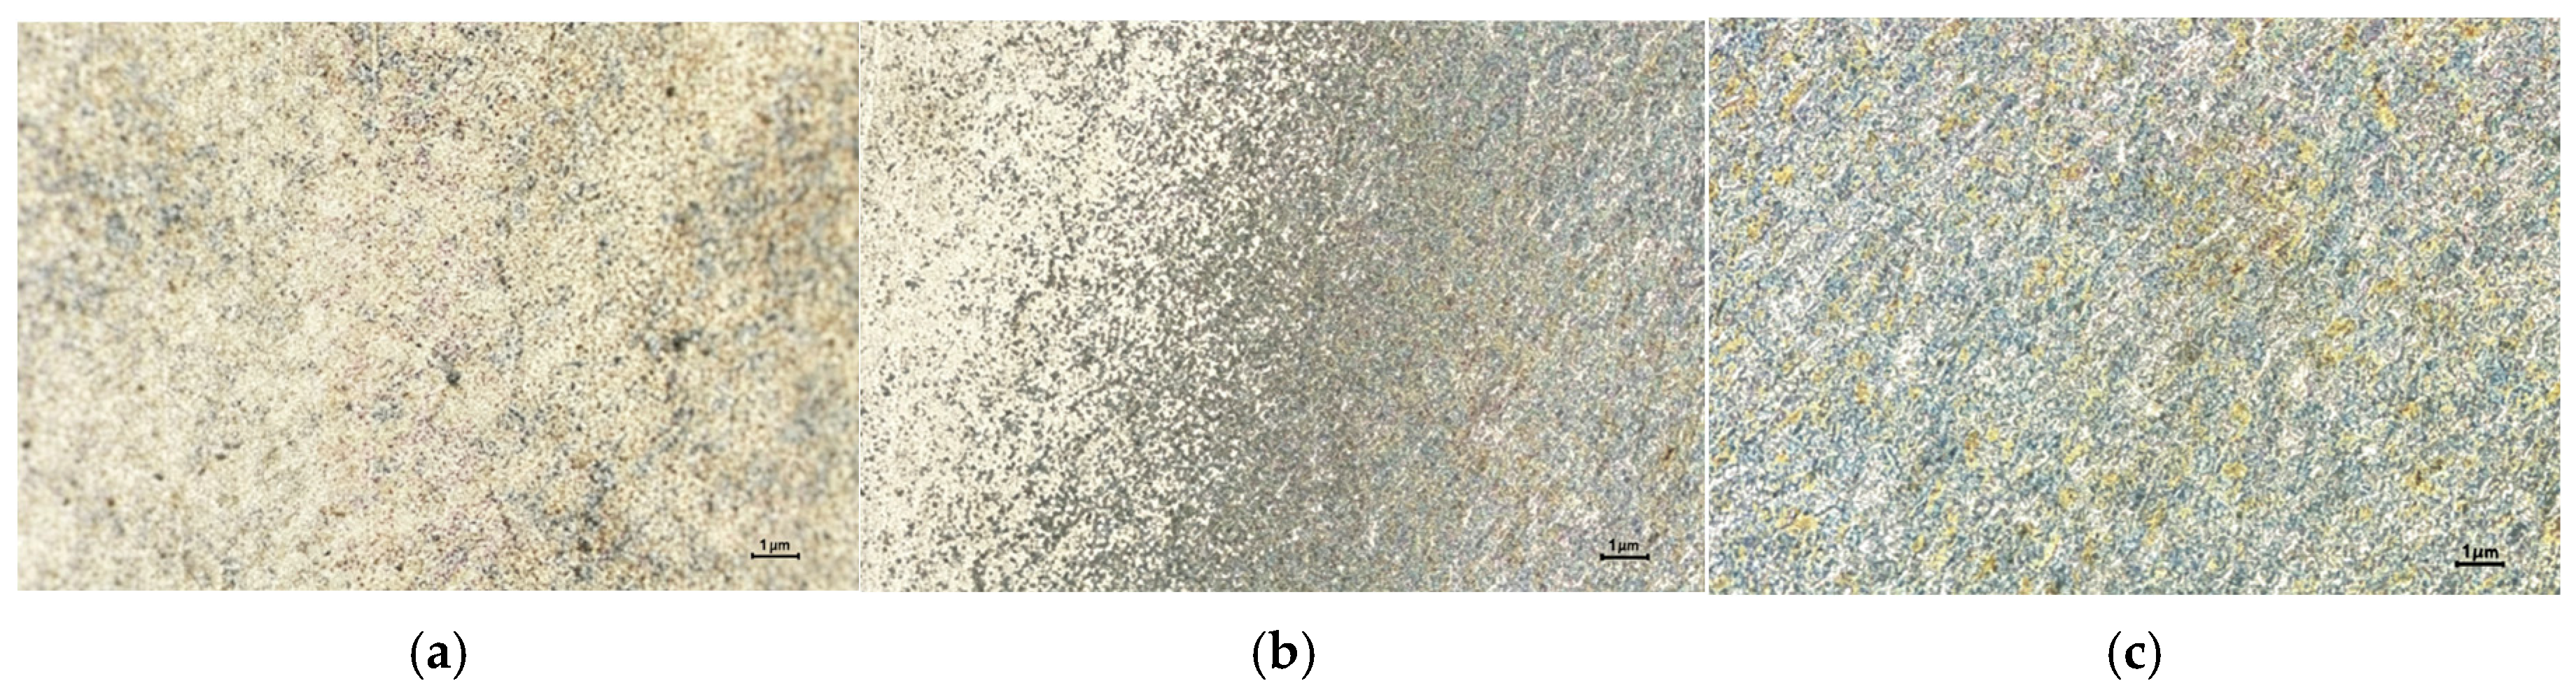
In the current manufacturing process of linear guide rails, an integrated high-frequency induction hardening machine is commonly used. The length specifications of this guide rail model are typically 4 m and 6 m. Therefore, during the quenching process, surface high-frequency induction hardening along the entire length of the linear guide rail is achieved by moving the induction heat source at a uniform velocity. The detailed heat treatment parameters are listed in Table 2. The cross-sectional microstructural metallographic images of the guide rail are displayed in Figure 8. Considering the space constraints of the experimental water tank, a complete 4 m guide rail was not directly used as the specimen. Instead, the guide rail was cut into specimens with a length of 1000 mm. Concurrently, it was confirmed via optical microscopy that its microstructure was highly uniform, without prominent band segregation or compositional pooling.
Table 2.
Detailed List of Heat Treatment Parameters for GH20 Linear Guide Rail.
Figure 8.
200× micro-metallographic images of the guide rail cross-section. (a) Microstructure of hardened layer; (b) Microstructure of the transition zone; (c) Microstructure of matrix.
4.2. Selection of Ultrasound Probe Parameters and Design of Probe Clamping Structure
This paper adopts a testing scheme based on water-immersed point-focusing probes. This is because the cross-sectional profile of the guide rail is highly complex and the effective measurement surfaces are extremely narrow. If a line-focusing probe is used, it can easily spill over the measurement zone and induce intense edge scattering interference. In contrast, the micro-point focal zone formed by a point-focusing probe can not only accurately cut into the narrow planes, but also compress the acoustic beam energy to the limit, significantly boosting the signal-to-noise ratio (SNR) of weak backscattering signals and enhancing cross-sectional spatial resolution, thereby providing assurance for constructing high-precision equivalent profiles subsequently.
Through an in-depth analysis of the focusing acoustic field evolution law of ultrasonic waves in the water-guide rail medium, it is revealed that to achieve unified, high-precision measurement of the hardened layer depth at three different feature points on the guide rail, the probe frequency, element diameter, focal length, incident angle, and water path must be systematically selected and optimized. Combined with preliminary metallographic experiments on the same batch of guide rails, the geometric measurement constraints and targeted hardened layer depths at the three feature points of the guide rail were obtained, as presented in Table 3. Concurrently, the ultrasonic wave propagation velocities in each zone of the guide rail and in water are listed in Table 4.
Table 3.
Measurement characteristics at the three feature points.
Table 4.
Sound Velocity in Various Regions of the Guide Rail and in Water.
Due to variations in the measurement plane width of the three feature points relative to the hardened layer depth, parameter selection must satisfy the constraints of the most unfavorable operating conditions while balancing resolution and focal column coverage. As shown in Table 3, Feature Point 1 falls under the “most unfavorable measurement condition”: it has the narrowest measurement plane but the deepest hardened layer.
For a focused probe, its focal zone possesses high energy and a high SNR, but the acoustic beam decays rapidly outside the focal zone, leading to a significant drop in the capability to resolve microstructural variations. Therefore, to ensure that ultrasonic waves can maximize penetration through the water-guide rail interface and form effective backscattering at the hardened layer-matrix interface, probe selection must simultaneously satisfy three core constraints: ① the focal spot diameter must be smaller than the minimum measurement surface width; ② the focal column length must fully cover the maximum hardened layer depth; and ③ the secondary focal position must stably fall near the transition zone between the hardened layer and the matrix. The selection process is detailed below:
(1) Central frequency of the probe and wafer diameter
According to the focused sound field theory, increasing the frequency reduces the wavelength, thereby significantly decreasing the diameter of the focal column and enhancing the lateral spatial resolution.
Considering the attenuation characteristics of S55C steel under ultrasonic frequencies, a probe center frequency of 15 MHz was selected. For carbon steels with similar microstructures (e.g., AISI 1045, 45 steel), the longitudinal wave attenuation coefficient at 5 MHz is approximately 0.5–1.0 dB/mm [19,20]. For the S55C matrix with a pearlite-ferrite grain size 10~30 µm, the shear wavelength at 15 MHz satisfies the condition where the wave propagation falls into the transition zone between the Rayleigh scattering regime and the stochastic scattering regime. According to classic scattering theory, the effective frequency exponent in this intermediate regime ranges from 2.5 to 3.5 [21]. At 15 MHz, the attenuation coefficient is estimated to be within the range of 3–6 dB/mm. Lower frequencies offer deeper penetration capabilities, but the longer wavelength results in an increased focal spot diameter, which may exceed the 0.99 mm measurement surface width at Feature Point 1, causing edge reflections and signal contamination. Conversely, higher frequencies improve spatial resolution but cause attenuation to surge to approximately 8–12 dB/mm, thereby significantly degrading the SNR of the already weak backscattering signals from the hardened layer-matrix transition zone. The selected 15 MHz frequency represents the optimal trade-off between spatial resolution (focal spot diameter ≈ 0.7 mm, satisfying the 0.99 mm constraint) and penetration depth (sufficient to reach the 3.6 mm maximum hardened depth with adequate signal margin).
The wafer diameter simultaneously influences both the focal column diameter and focal length. If it is too large, the required focal length increases significantly and the acoustic beam near-field zone becomes excessively long; if it is too small, the acoustic beam energy is insufficient. Combined with the 0.99 mm measurement surface constraint at Feature Point 1, a standard element diameter (approximately 9.5 mm/0.375″) was selected, ensuring that the focal spot diameter is strictly constrained within the scale of the measurement surface, avoiding edge strong reflection interference.
(2) Incidence angle
In water-immersed oblique incidence transverse wave measurement, it must be guaranteed that the ultrasonic longitudinal wave incident angle in water falls between the first and second critical angles. According to Equations (9) and (10), substituting the wave velocity parameters from Table 4 allows the calculation of the ultrasonic incident critical angle range under the “water-S55C hardened layer” coupling state.
where is the propagation velocity of the longitudinal wave in water; and are the longitudinal and transverse wave velocities in the tested workpiece, respectively. Only when the longitudinal wave incident angle in water satisfies . can a refracted transverse wave suitable for testing be obtained inside the workpiece.
The calculated legal interval for the incident angle is (14.36°, 26.59°). To facilitate subsequent calculation and actual debugging, 15°, 20°, and 25° were initially selected as candidate values for the probe incident angle.
(3) Focal length
To ensure that the focal column length can fully cover the maximum hardened layer depth, if estimated by vertical incidence theory, the focal length only needs to satisfy certain basic bounds. However, under oblique incidence conditions, due to the presence of a defocusing effect that shifts the focus deeper, selecting a short focal length probe will fail to maintain sufficient acoustic beam concentration and water path adjustment space within the 3.6 mm depth range. By comprehensively evaluating the focal depth constraints under the three candidate incident angles (requiring sufficient margin), it is derived that the focal length must satisfy stricter conditions. Theoretical derivation demonstrates that the required focal length must satisfy specific inequalities. Combined with the standard specification sequence of commercial probes, a spherical lens probe with a nominal focal length of 4.4″ (approximately 111.76 mm) was ultimately selected for the experiment.
(4) Water acoustic range
The setting of the underwater acoustic path length determines the precise depth of the secondary focus within the guide rail. Based on the distinct geometric depth parameters of the three feature points, the required theoretical underwater acoustic path lengths are calculated for each of the three candidate incident angles.
Taking the candidate angle of 15° as an example, the calculation results are presented in Table 5. To prevent excessive depth of focus from compromising effective focusing in the extremely shallow hardened layer, the calculated underwater acoustic path length was appropriately rounded downward in practical applications. The final determined adjustable underwater acoustic path range for the measurement system under a 15° incidence angle was established.
Table 5.
Calculation and values of underwater acoustic path lengths at three characteristic points under a 15° incidence angle for the probe.
(5) Analysis and Optimization of Incidence Angle Error
Under oblique incidence conditions, the focused acoustic beam exhibits significant aberrations and defocusing effects due to refraction. According to the geometric acoustics model, edge sound rays deviating from the principal acoustic axis converge at a position within the medium that lies off the theoretical focal point. After determining the probe focal length and the actual underwater acoustic path length, the rationality of the selected incidence angle must be verified by calculating the error between the theoretical focal point (obtained under assumptions of negligible acoustic wave refraction for oblique incidence) and the actual convergence point of the obliquely incident beam. Based on the geometric acoustics model proposed by Wang Jun et al. [22], the actual beam deflection angle under oblique incidence conditions is calculated and compared with the theoretical beam angle derived from the focal length to assess the relative error.
The calculation results indicate that when , the relative deviation of the focal depth is approximately 28.27%; when and 25°, the deviations surge to 58.66% and 90.1%, respectively. This demonstrates that as the incident angle increases, acoustic beam aberrations deteriorate sharply, significantly reducing the beam convergence capability and severely impairing the ultrasonic energy response at the interface. Considering both the defocusing error and existing literature findings, the 15° incident angle outperforms the 20° and 25° conditions in terms of focal position stability, beam convergence capability, and measurement sensitivity. Therefore, the probe’s optimal incident angle is determined to be . Figure 9 represents the geometric acoustic ray distribution and focusing effect validation at the three feature points under a 15° incident angle.
Figure 9.
Geometric acoustic ray distribution and focusing effect of the probe at three feature points under an incident angle of 15°. (a) Point 1; (b) Point 2; (c) Point 3.
In a recent parameter optimization study, Bayat-Kazazi [23] determined that probe angle and probe distance are the two most critical factors for ultrasonic hardening layer depth measurement. Through 81 experiments, they obtained an optimal probe angle of 16°. This result is exceptionally close to our selected 15° incident angle, providing independent validation for the angle selection in this work.
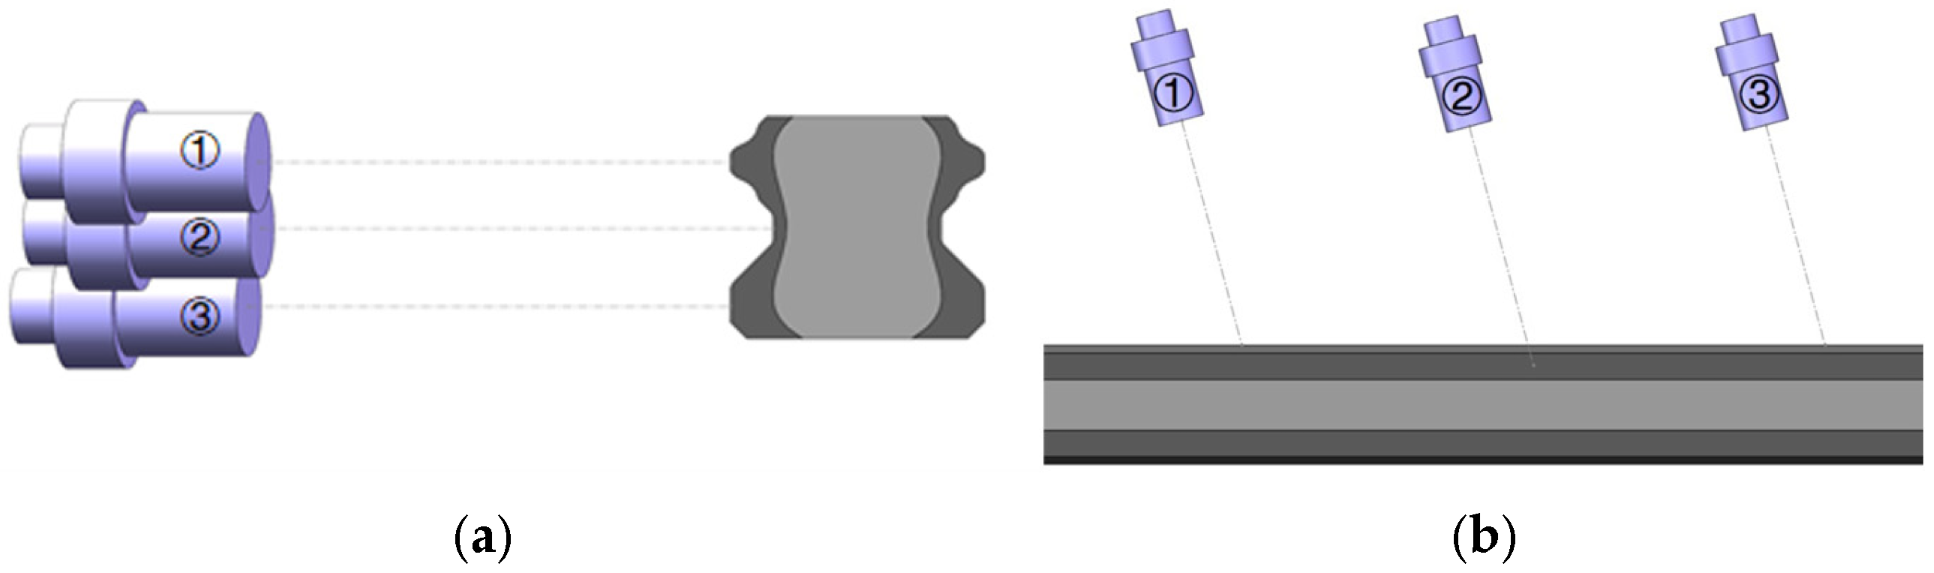
The core parameters of the water-immersed point-focusing probe ultimately determined are summarized in Table 6. The spatial arrangement of the probes at the three feature points is illustrated in Figure 10.
Table 6.
Parameters of the Water Immersion Focused Probe.
Figure 10.
Schematic diagram of ultrasound probe arrangement. (a) Front view of probe arrangement (b) Top view of probe arrangement.
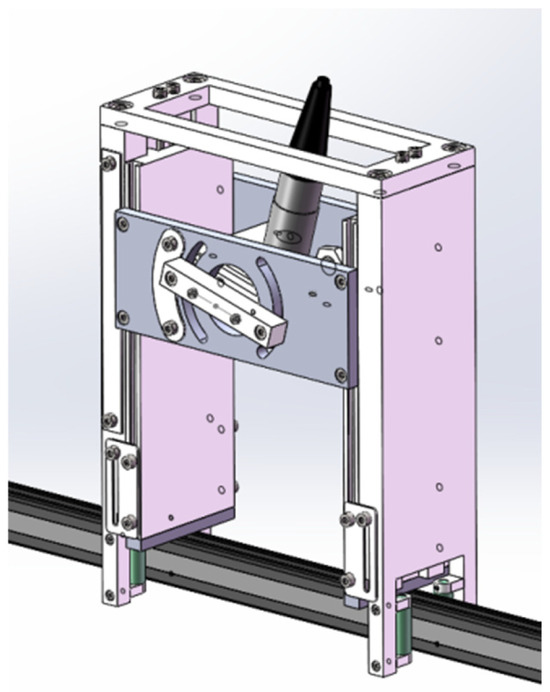
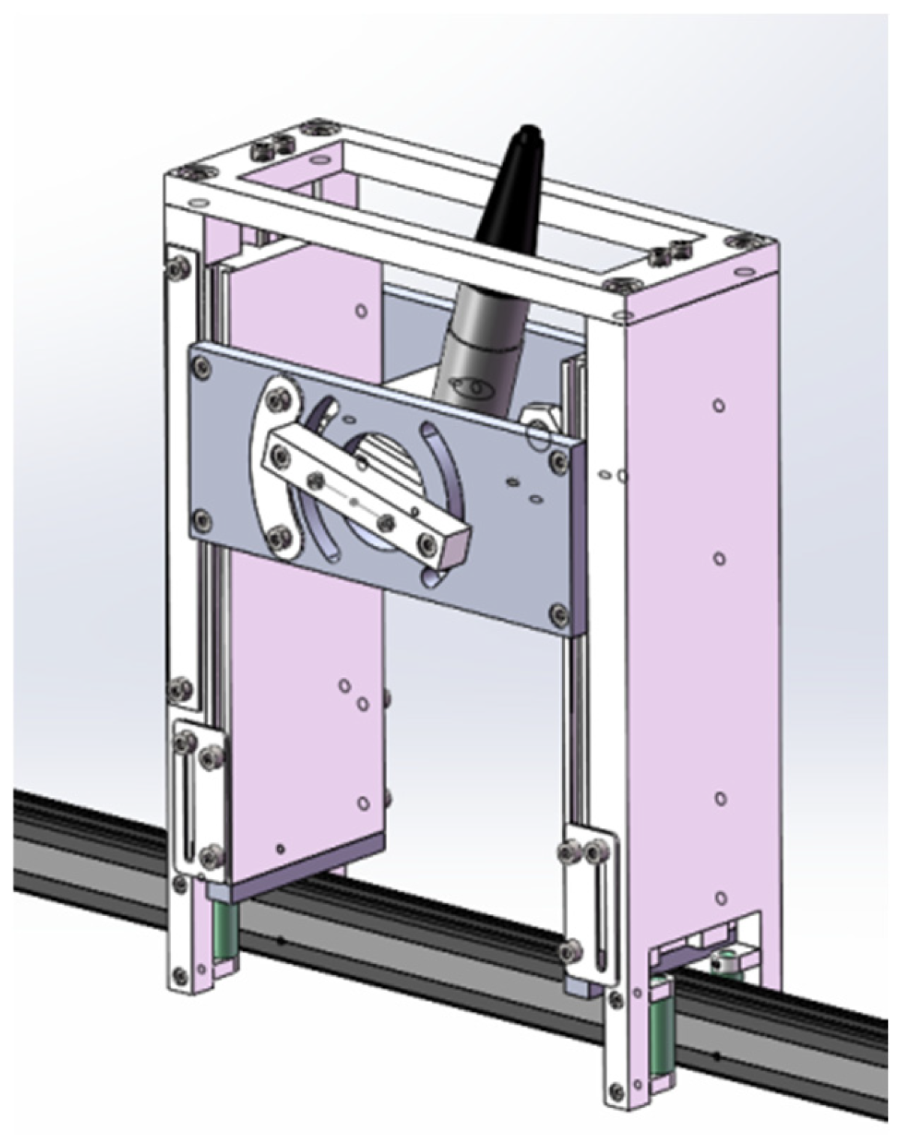
To ensure stable ultrasonic measurement of the guideway’s hardened layer depth, after selecting the probe parameters, a dedicated probe clamping mechanism suitable for underwater oblique incidence detection is required. This mechanism must maintain the probe’s incidence angle consistently within the predetermined range, accommodate adjustments of 97–105 mm hydroacoustic path lengths at various feature points, enable rapid switching between the three characteristic measurement points on the guideway, and adapt to minor surface topographic variations during continuous scanning—thereby ensuring stable ultrasonic coupling conditions and measurement results.
To meet these requirements, the experiment employs a self-designed clamping mechanism composed primarily of an attitude adjustment and locking module, a position adjustment module, and a flexible conformal guidance module. The attitude adjustment and locking module enables the setting and fixation of the probe’s oblique incidence angle; the position adjustment module ensures the probe’s horizontal and vertical positioning at various feature points to accommodate different acoustic path requirements at measurement locations; the flexible conformal guidance module maintains stable contact during the clamping mechanism’s continuous movement along the guide rail surface, minimizing the impact of local surface topographic variations on ultrasonic coupling performance. The overall mechanism structure is illustrated in Figure 11.
Figure 11.
Overall structural diagram of the clamping mechanism.
4.3. Establishment and Experiment of the Ultrasonic Measurement System
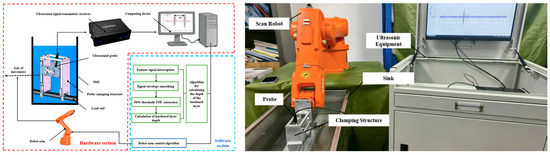
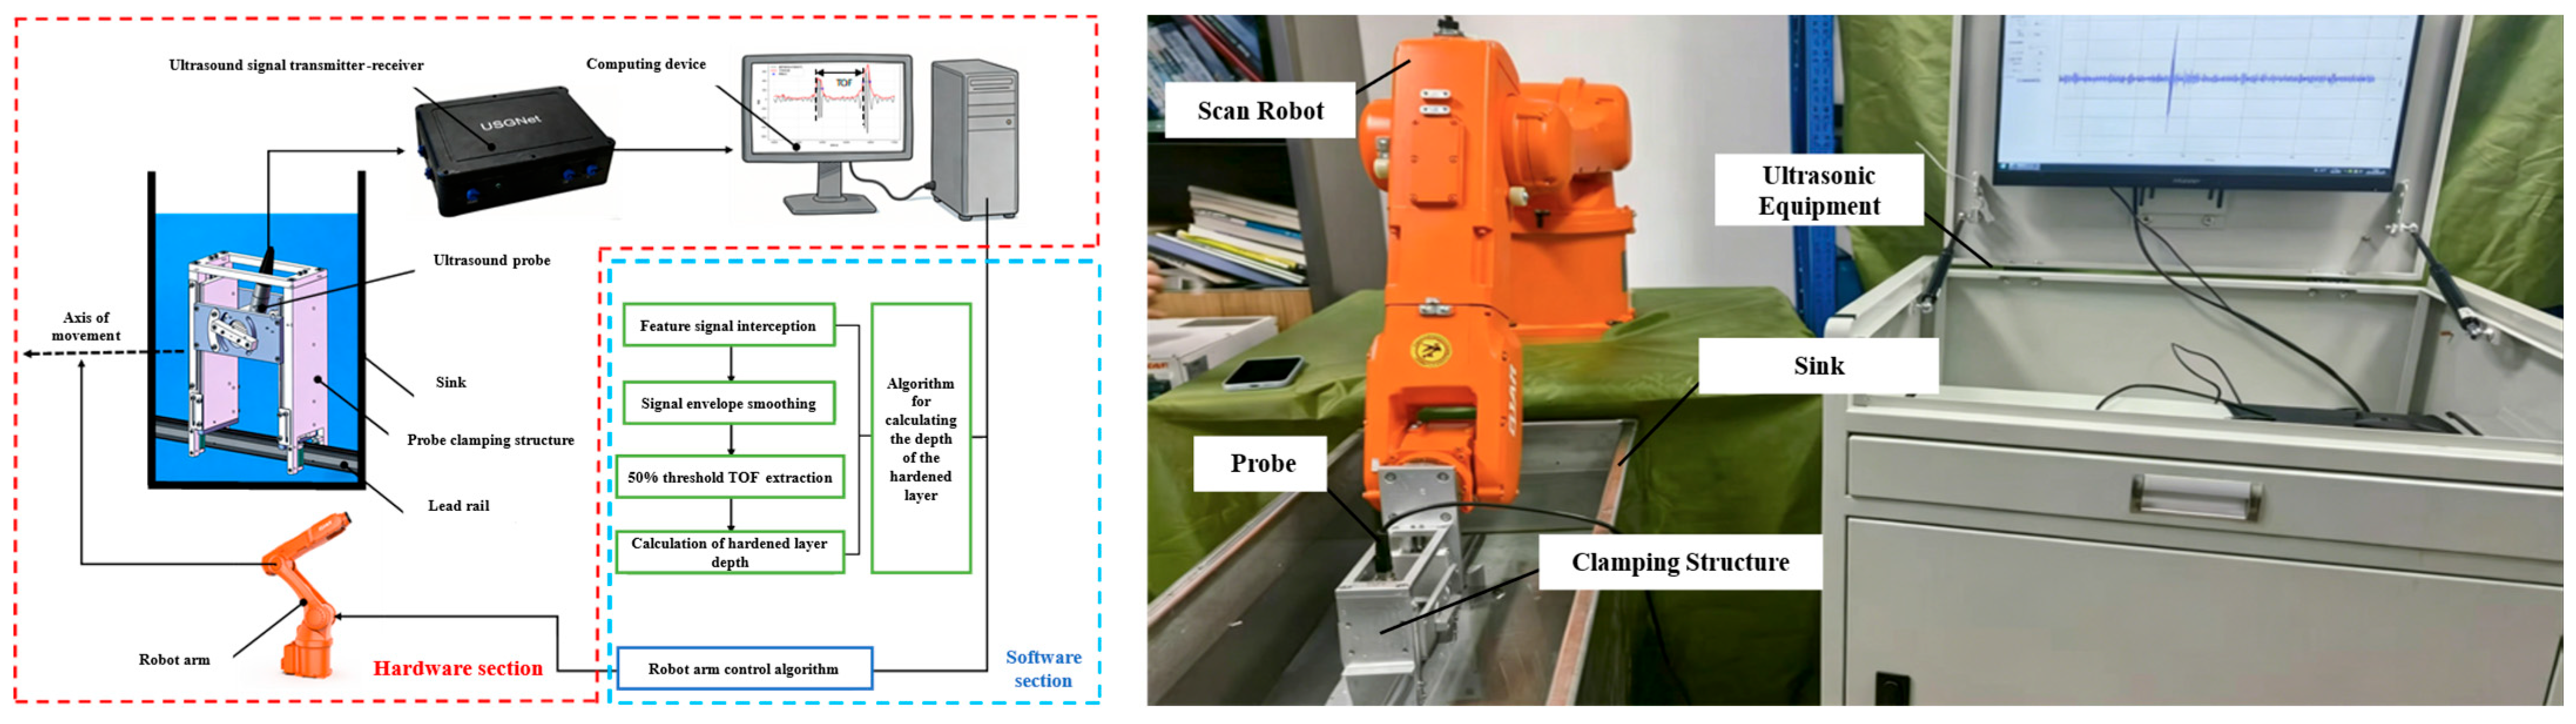
The system consists of an industrial PC, ultrasonic pulse-transmitter/receiver equipment, a water-immersed point-focused probe, a water tank, a QJR7-900 robot (Zhejiang Qianjiang Robot Co., Ltd., Wenling, China), and the custom ultrasonic probe clamping mechanism. Specifically, an OLYMPUS V328-SU (Olympus Corporation, Tokyo, Japan) water-immersed point-focused probe was selected, featuring a center frequency of 15 MHz and an element diameter of 0.375″. The ultrasonic pulse-transmitter and receiver equipment is a USGNet product (Hangzhou Jianwei Technology Co., Ltd., Hangzhou, China), with a maximum sampling frequency of up to 100 MHz. This equipment is an integrated module capable of adjusting pulse width, gain, and filters, and supports real-time display and export of A-scan signals. The robot is implemented to achieve stable feed of the probe clamping mechanism relative to the guide rail. The custom clamping mechanism guarantees the stability of the probe incident angle, water path, and measurement position during the scanning process. The entire system possesses excellent adjustability, adaptability, and repetitive measurement capabilities, satisfying the needs for separate measurement of the case depth at 6 feature points on both sides of the guide rail. The composition of the ultrasonic measurement system is summarized in Table 7 and illustrated in Figure 12.
Table 7.
Composition of the Ultrasound Measurement System.
Figure 12.
Physical diagram of the ultrasonic measurement system.
The mechanical system does not execute real-time active feedback adjustment. Instead, the custom clamping mechanism features a flexible conformal tracking guide module with spring-loaded rollers. This module maintains tight contact with the guide rail surface, allowing up to ±0.3 mm of vertical profile topography deviations while mechanically restricting the probe incident angle within ±0.5° of the nominal 15°. In this study, since the GH20 specimen underwent precision grinding, its flatness tolerance over the 1000 mm length is within 0.1 mm, making passive compensation entirely sufficient.
The QJR7-900 robot advances the clamping mechanism along the guide rail axis. It operates in a precise position-control mode, advancing along the guide rail length in 1 mm increments. At each discrete position, the robot pauses for 1 s to perform a 100-times coherent averaging signal acquisition. The robot does not employ force feedback or active compliance; instead, the passive flexible module (spring-loaded rollers) in the clamping mechanism handles minor surface height variation. The entire scanning sequence is pre-programmed and runs fully automatically.
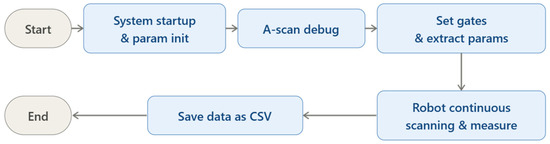
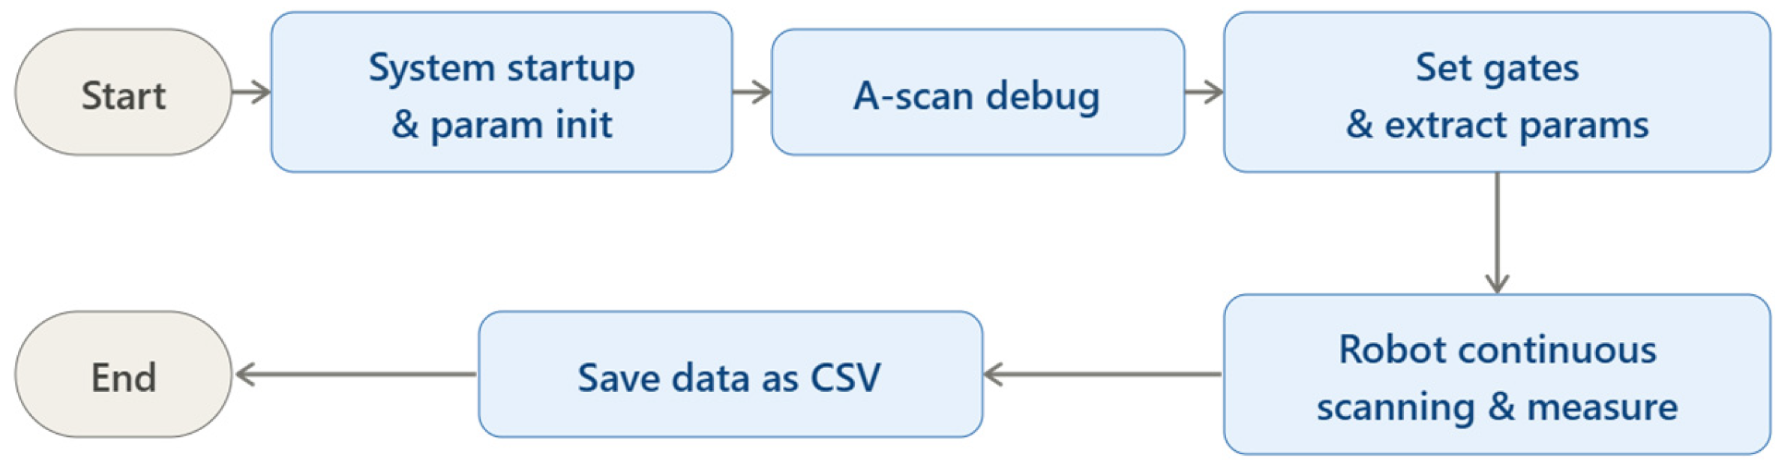
The experimental flowchart is shown in Figure 13. First, the industrial PC and ultrasonic acquisition software are launched, and the parameters of the ultrasonic signal transmission and reception equipment are initialized, including transmission voltage, sampling frequency, excitation delay, sampling length, signal gain, and band-pass filter parameters. The transmission-echo method is selected as the measurement mode. Subsequently, based on the real-time acquired A-scanning signals, the waveform characteristics at the current measurement point are observed and adjusted, and the measurement parameters are progressively optimized to obtain raw ultrasonic signals with high signal-to-noise ratios and clear interface features.
Figure 13.
Experimental flowchart.
After obtaining a stable A-scan signal, the effective gate range is further determined based on the time-domain distribution of the characteristic responses of the water-rail coupling interface wave and the harden layer-matrix transition zone, enabling the extraction of the backscattered signal interval between these two regions. During measurement, the system performs real-time analysis and processing of the signals within the gate to extract characteristic time parameters corresponding to the harden layer depth. Subsequently, the robot conducts continuous scanning measurements along the rail length direction using a single feed step of 1 mm and a single-point sampling time of 1 s. Upon completion, the data acquisition system saves the data as a CSV file for export, with a total of 1000 sets of cross-sectional data collected.
4.4. Experimental Results
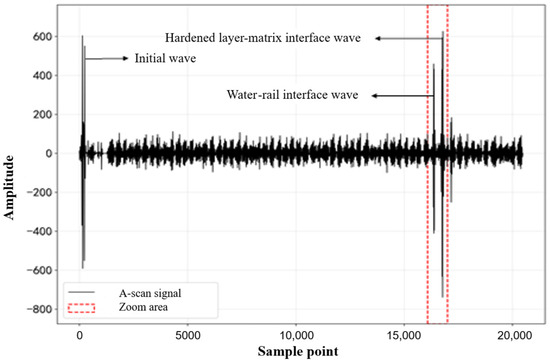
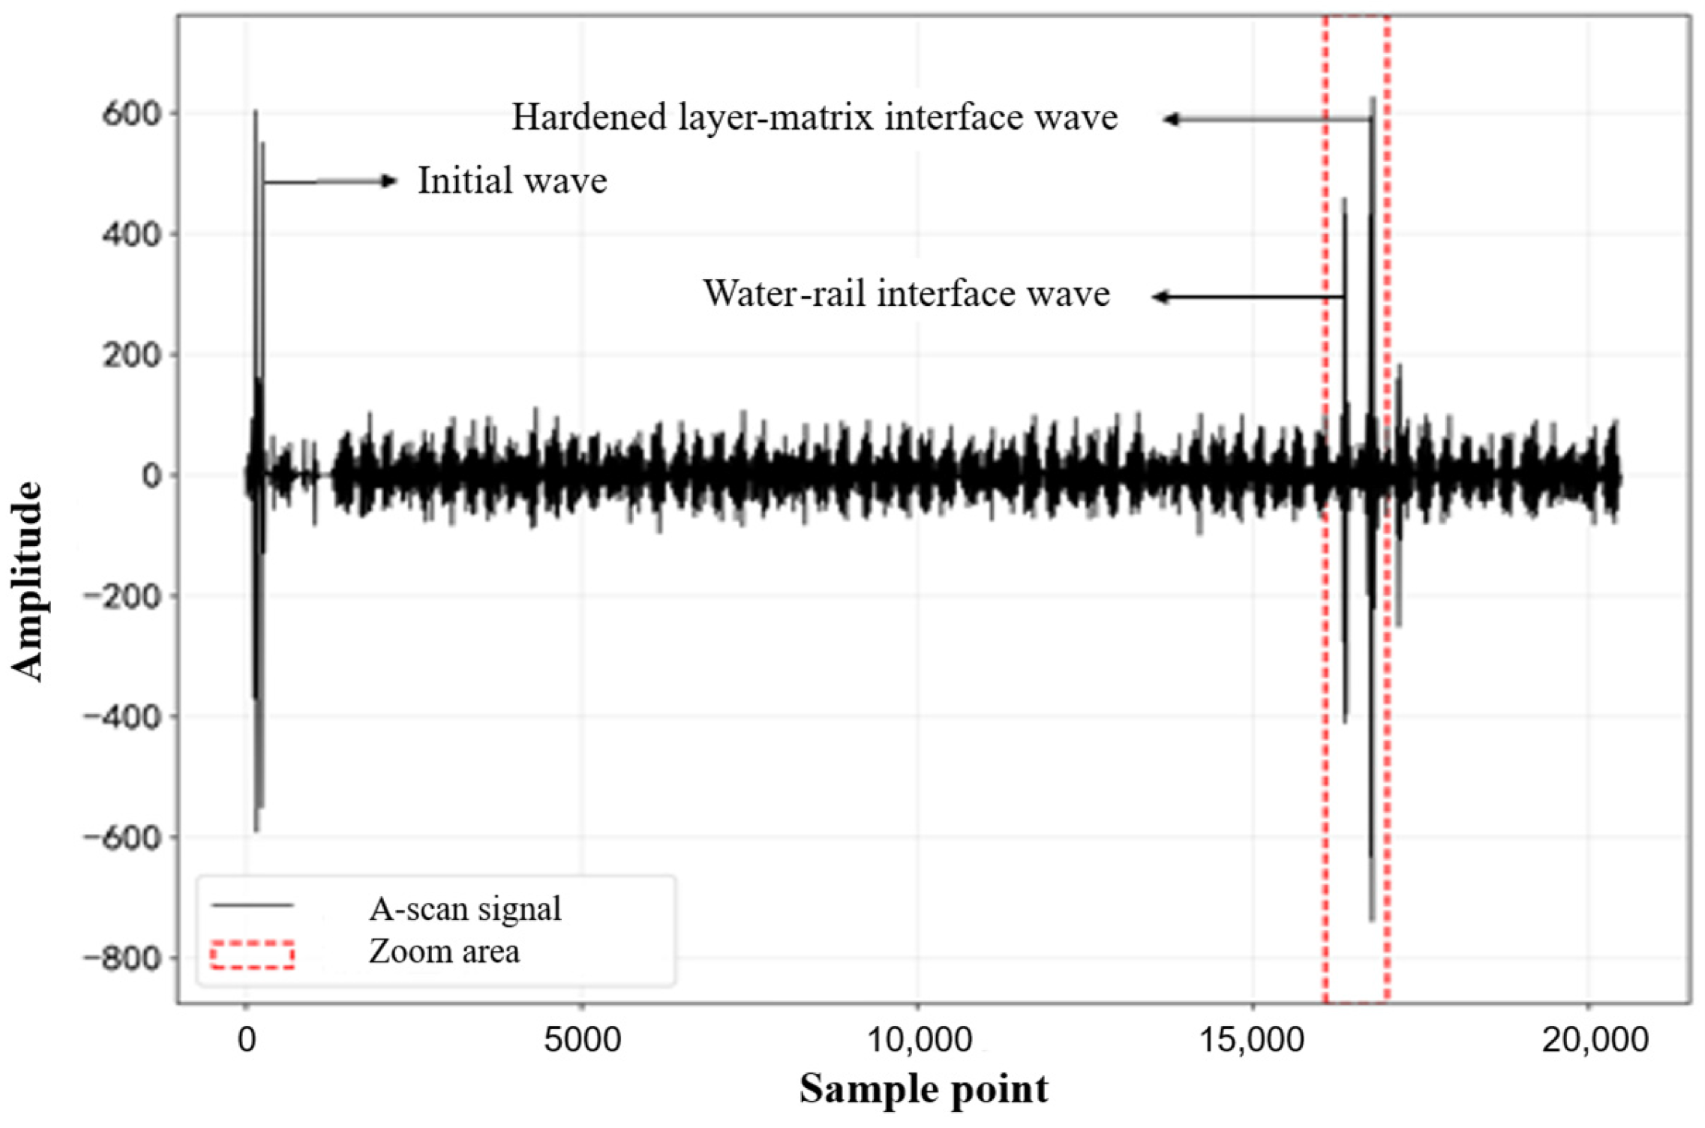
The waveform diagram of the A-scanning signal obtained in the experiment is shown in Figure 14. Analyzing the composition of the ultrasonic A-scanning signal reveals that it primarily consists of the probe initial wave, the water-rail coupling interface wave, and the characteristic response arising from the microstructural contrast between the hardened layer and the matrix. The water-rail coupling interface wave indicates the moment when the ultrasonic wave penetrates the rail surface, while the characteristic response near the hardened layer-matrix transition zone reflects the abrupt change in the material’s internal scattering properties. The time-of-flight (TOF) difference between these two waves serves as the key parameter for quantitatively determining the depth of the hardened layer.
Figure 14.
Trace of raw ultrasonic A-scan signal.
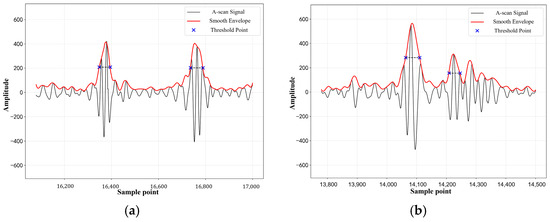
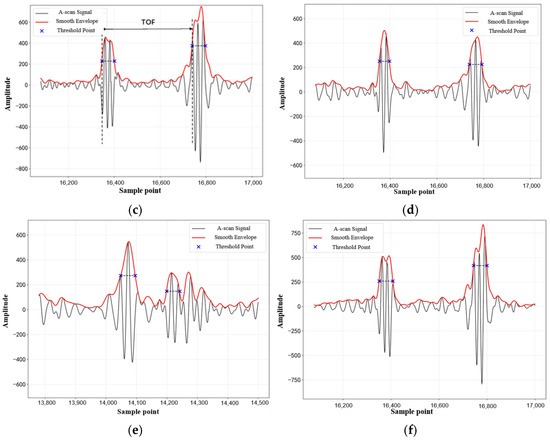
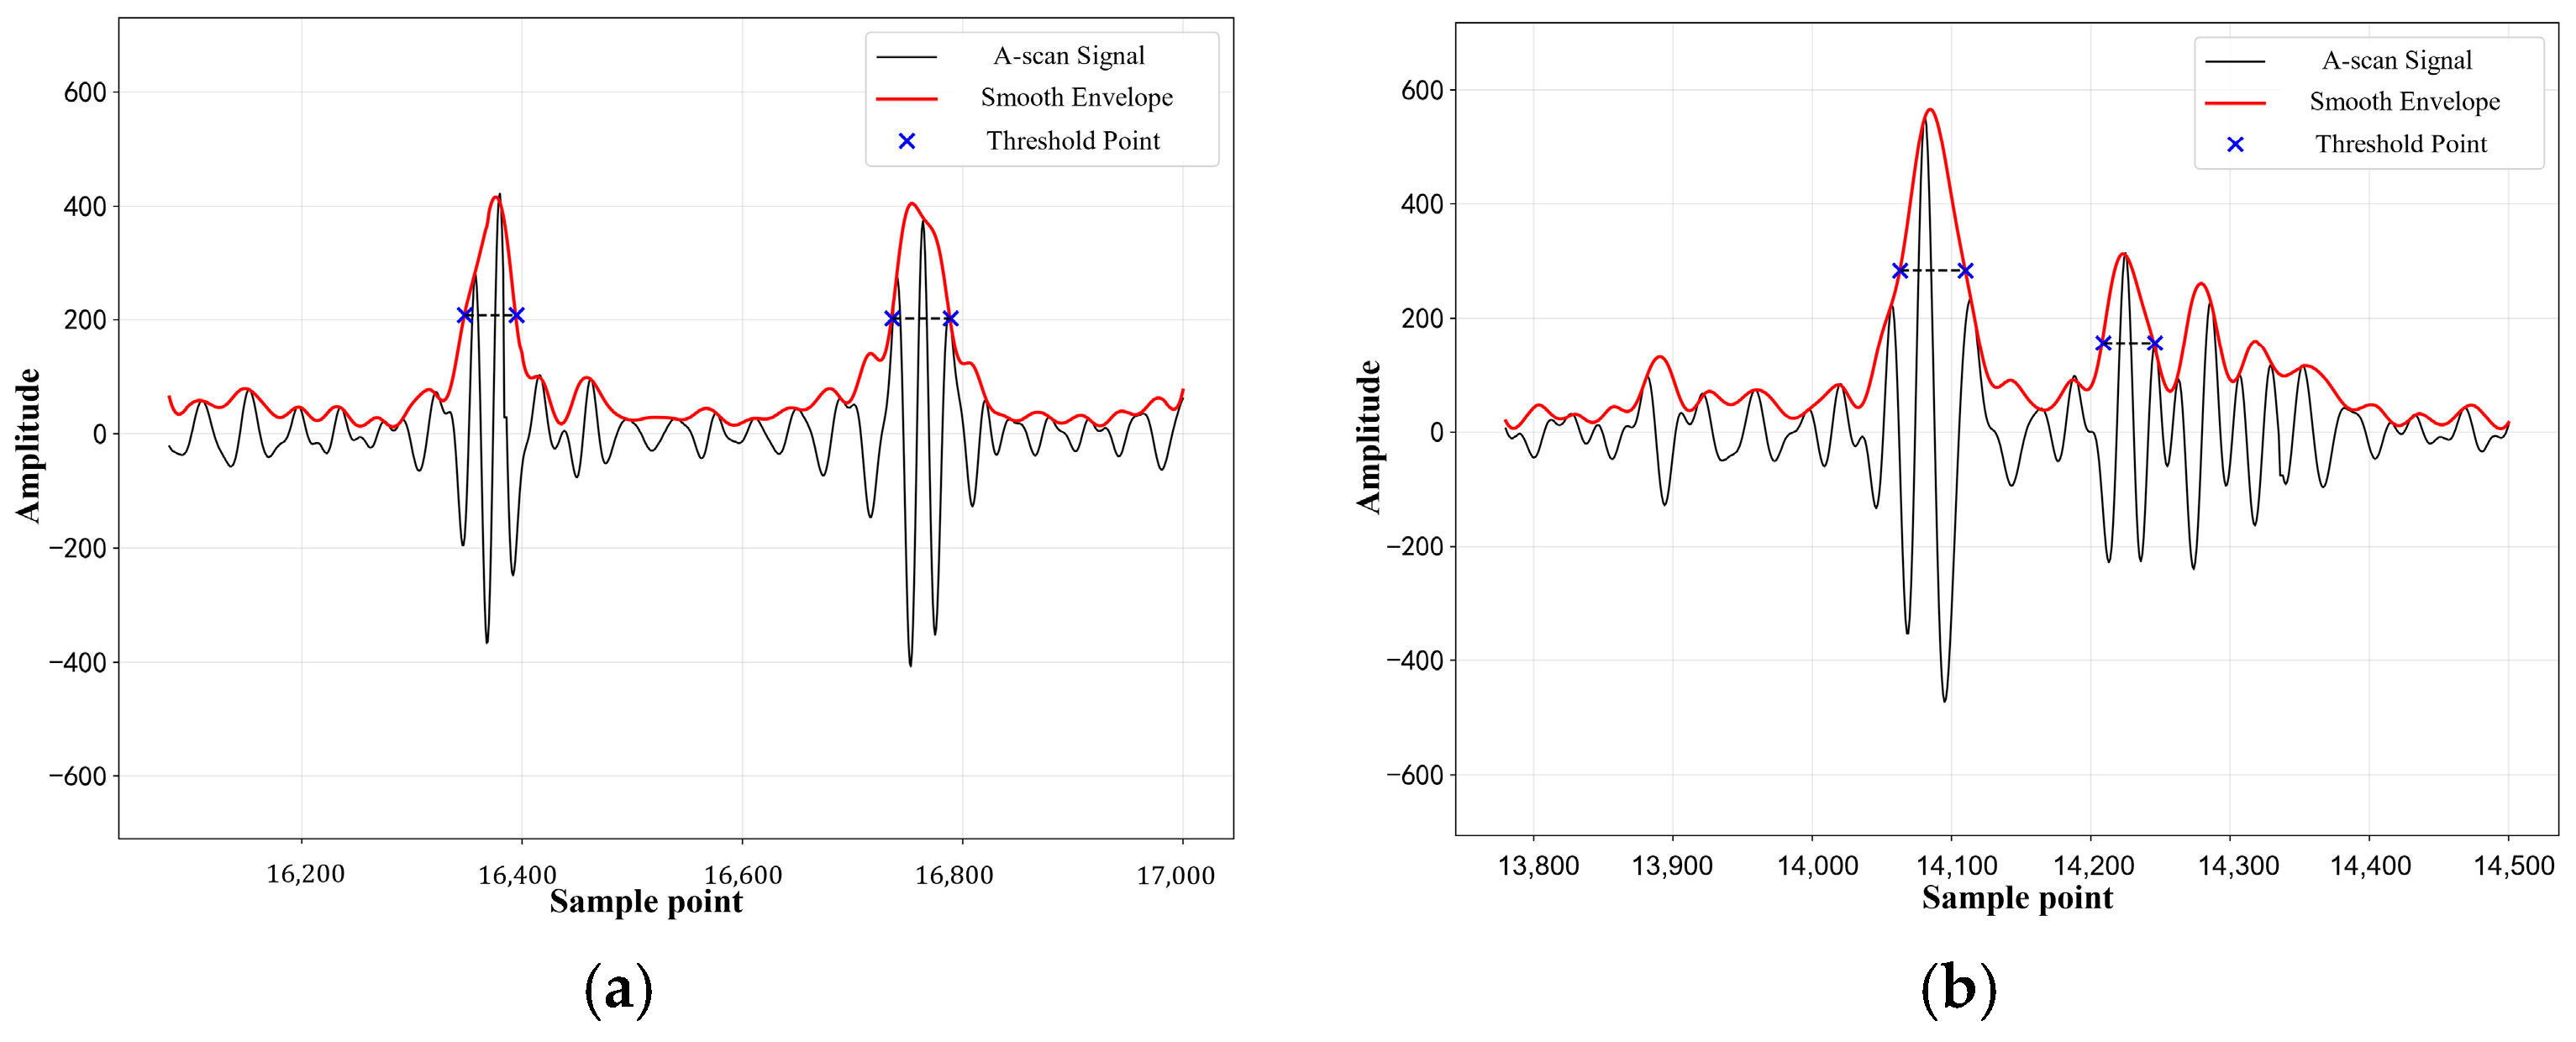
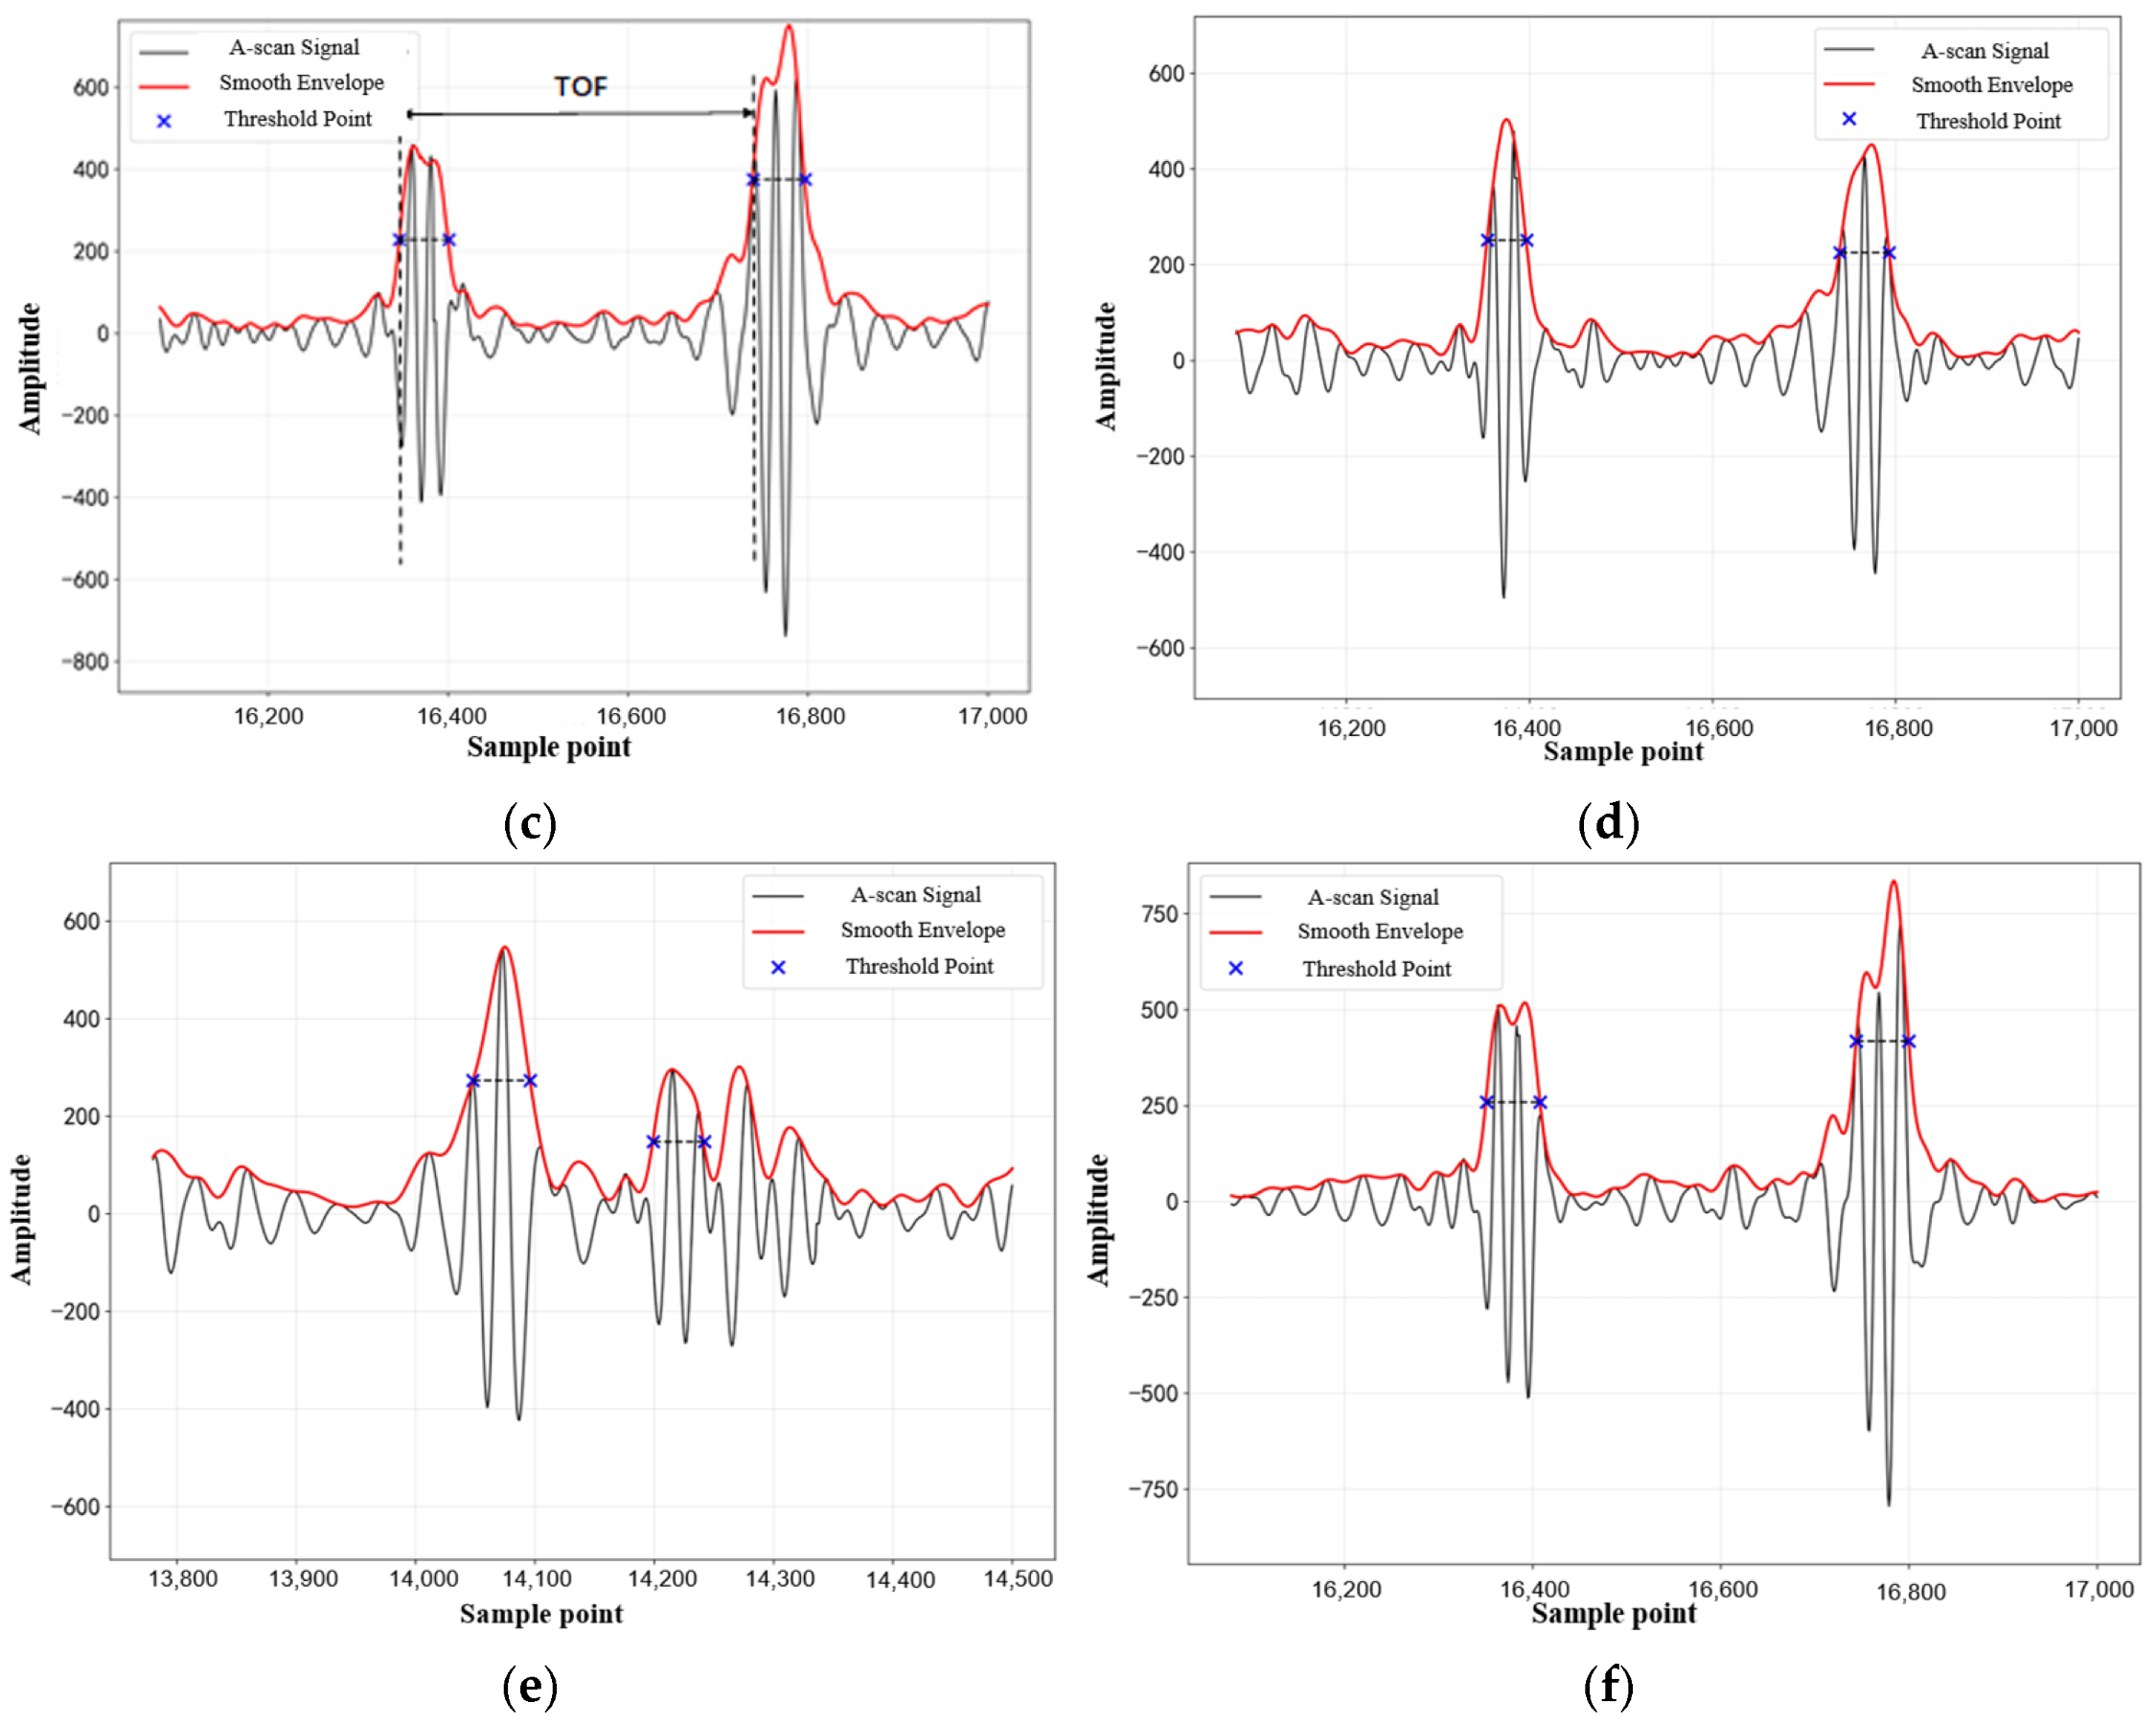
To accurately estimate the sound wave time difference Δt under high signal uncertainty, we applied the following processing sequence. First, the raw A-scan signal is processed through a 5 to 25 MHz bandpass filter. Second, the Hilbert transform is utilized to obtain the signal envelope. Third, a 0.1 μs moving average window is used to smooth the envelope. Fourth, the arrival time of each wave packet is defined as the point where the envelope rises to 50% of its local maximum. This half-maximum criterion is significantly more robust against noise than peak detection. The difference between the 50% rise times of the water-guide rail interface wave and the transition zone backscattering is extracted as Δt. For each measurement location, 100 coherent A-scans are averaged. The processed A-scan signal envelope traces for the three feature points on both the left and right sides are displayed in Figure 15.
Figure 15.
Processed ultrasonic A-scan signal envelope plots with 50% threshold markings. (a) Left point 1; (b) Left point 2; (c) Left point 3; (d) Right point 1; (e) Right point 2; (f) Right point 3.
After extracting the TOF data and substituting it into Equation (4), the outer contour dimension of the guide rail was determined to be 3.45 mm. Calculations yielded the hardened layer depth, with the measurement results along the length direction of the guide rail presented in Table 8.
Table 8.
Hardening layer depth values (mm) at six feature points on both sides of the guide rail.
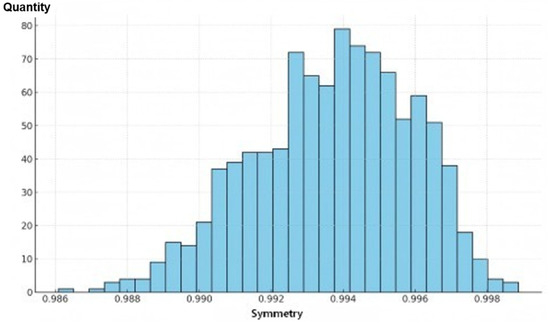
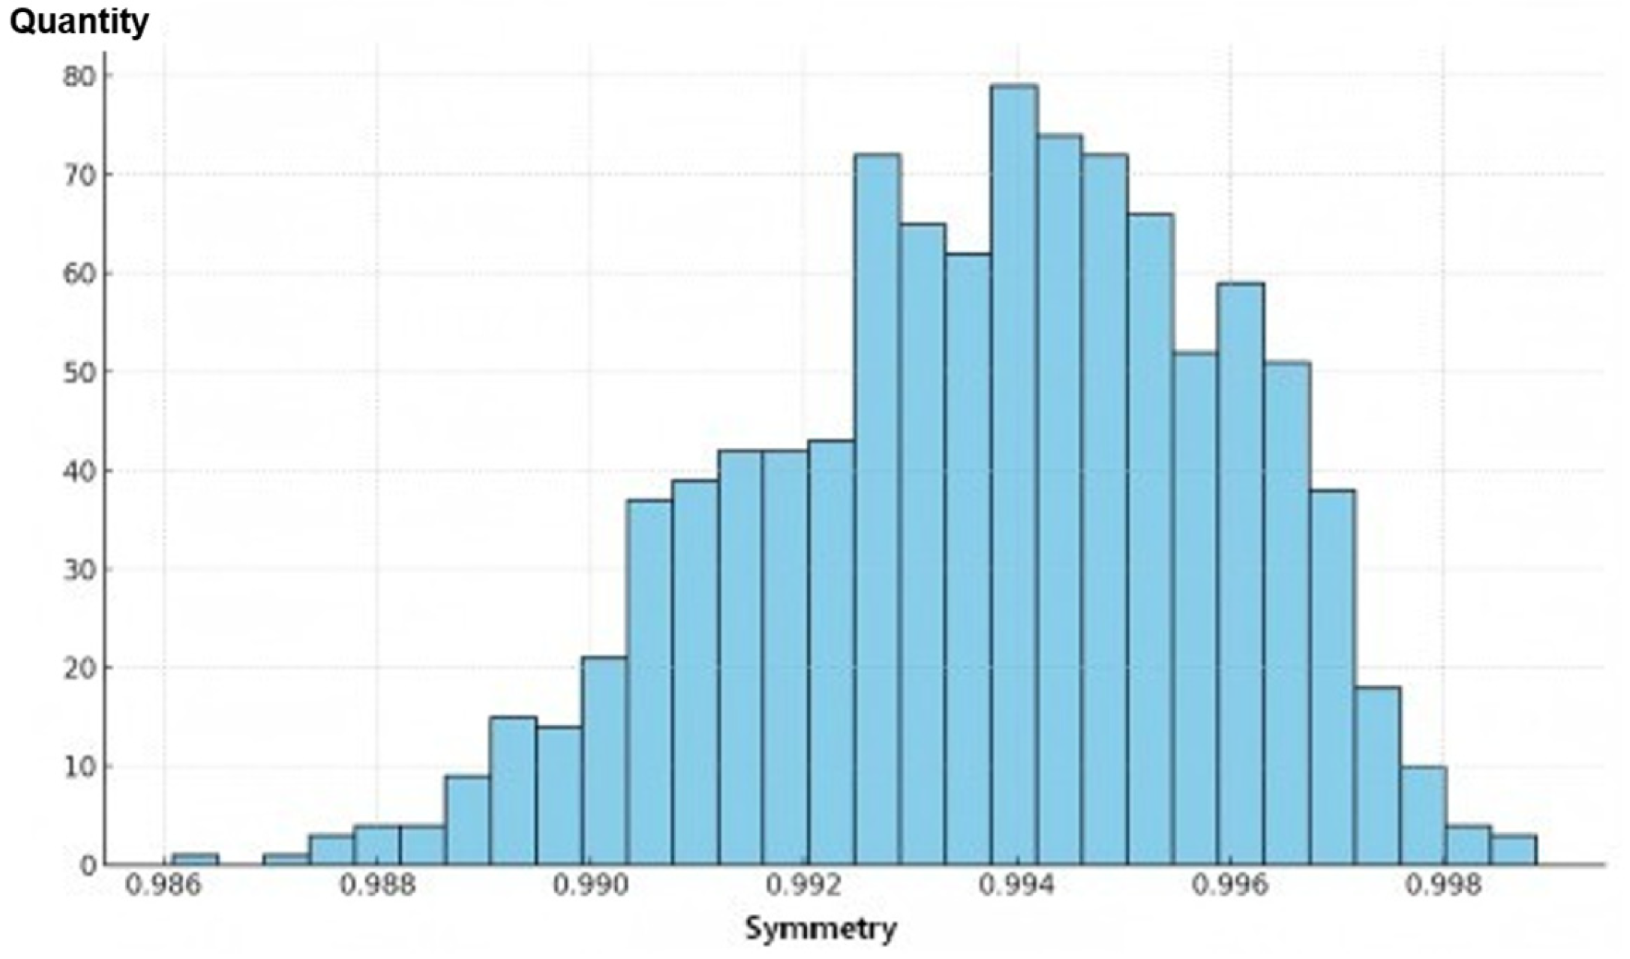
Based on the aforementioned results, Equations (7) and (8) were employed to calculate the equivalent hardening layer depth and “symmetry degree” on both sides. The calculation results are presented in Table 9, while the distribution of the “symmetry degree” across 1000 cross-sections is illustrated in Figure 16.
Table 9.
Equivalent hardened layer depth on both sides of the guide rail and “symmetry degree”.
Figure 16.
Column chart showing the distribution of the “symmetry” of the equivalent hardened layer depth across various cross-sections of the rail specimen under test.
The experimental results demonstrate that the average equivalent symmetry of the tested rail samples exceeds 98%, confirming that the current induction hardening process for these samples exhibits high consistency and stability in depth control.
4.5. Metallographic Verification
To validate the measurement accuracy of the proposed ultrasonic transverse wave backscattering technique, the tested specimen was sliced for destructive metallographic verification. The microhardness method was employed to measure the hardened layer depths of the guide rail specimen. By comparing the microhardness results with the actual ultrasonic measurement data, the accuracy of the current ultrasonic transverse wave method was rigorously evaluated. The selected sliced cross-section corresponds to the second set of data in the ultrasonic measurement (highlighted in red in the table).
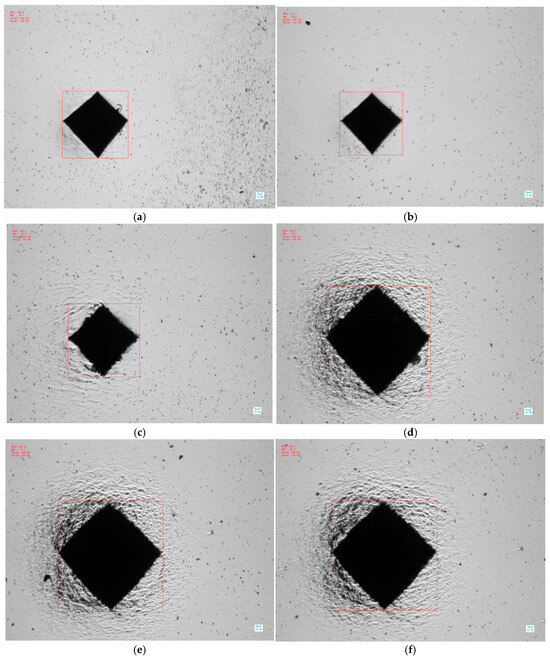
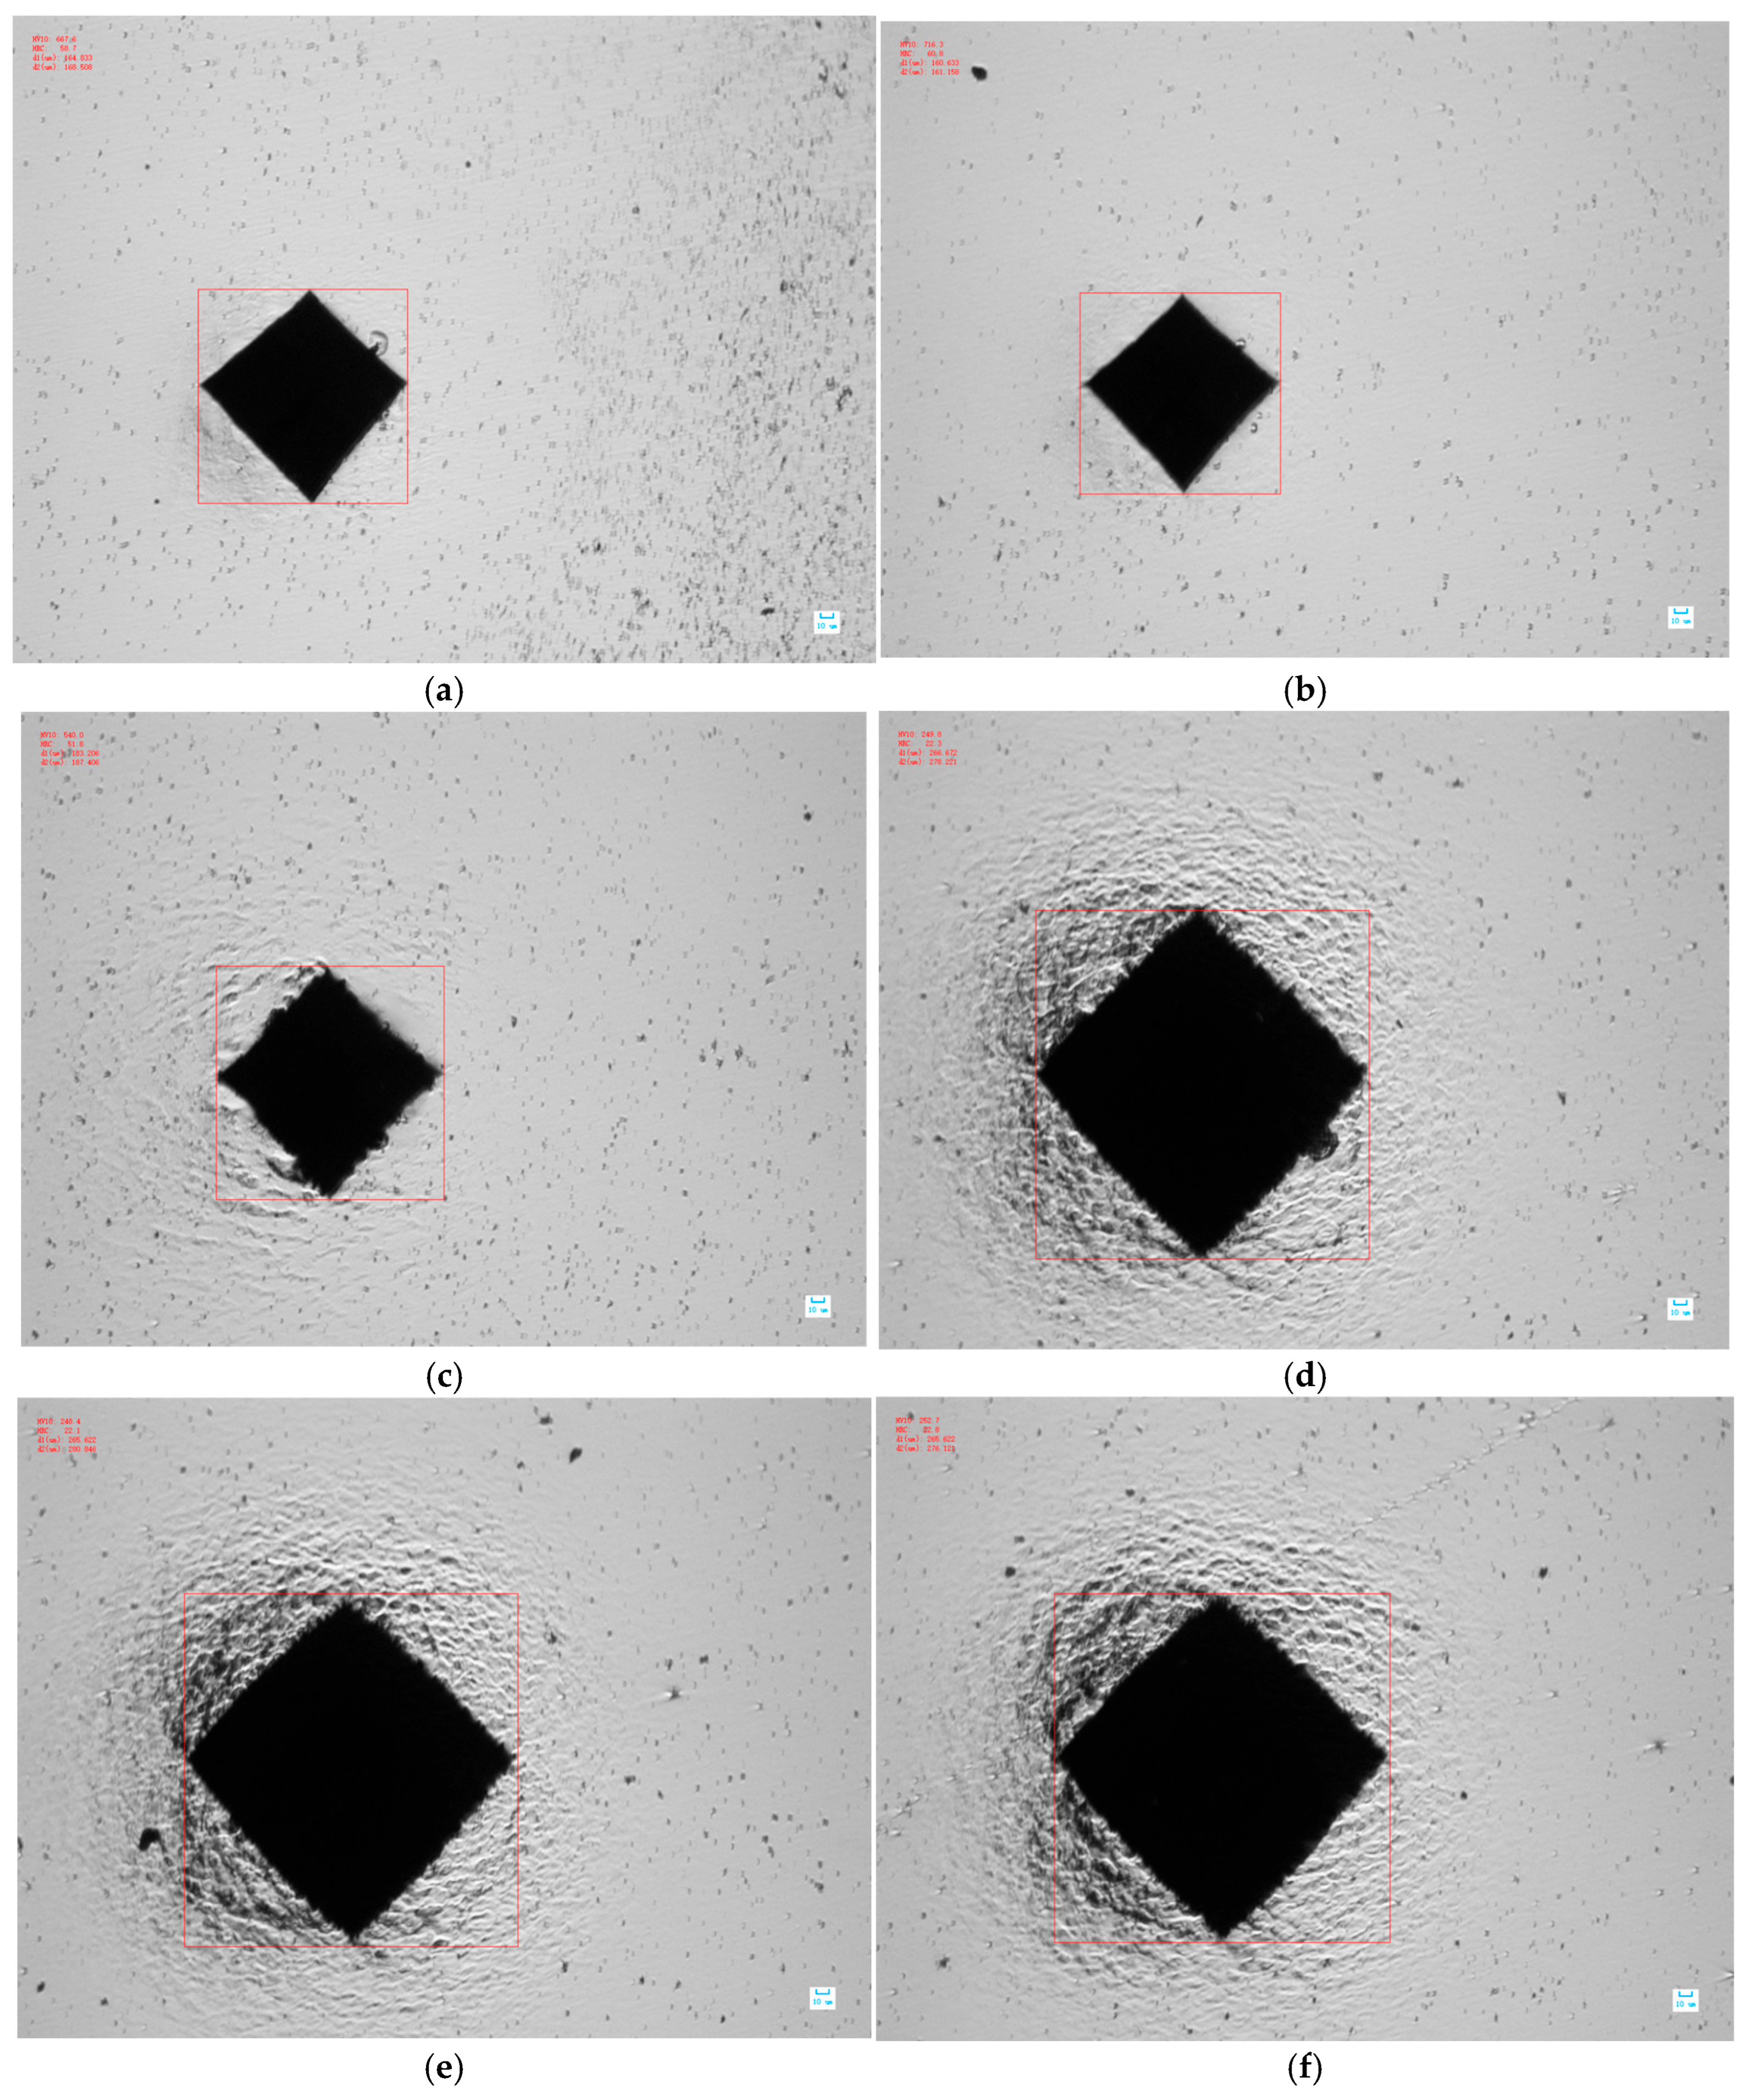
A model HVS-1000 Vickers microhardness tester (Shanghai Precision Instrument Co., Ltd., Shanghai, China) was used, applying a load of 9.8 N (1 kgf). Hardness measurements were executed from the edge of the specimen toward its center with a measurement step increment of 1 mm. According to the ISO 3754 [24] standard for case depth determination, the effective hardened layer depth is defined as the distance from the surface to the position where the hardness drops to 0.8 times the minimum required surface hardness. The guide rail cross-section corresponding to the ultrasonic method was selected for measurement. Concurrently, to minimize experimental uncertainties during the measurement process, 5 repetitive measurement sequences were performed on the guide rail cross-section. The microscopic indentation profile at Left Feature Point 1 is presented in Figure 17. Five sets of case depth data for the current cross-section were obtained, and the detailed data for the 6 measurement points are compiled in Table 10.
Figure 17.
Microscopic Vickers indentation photograph at Left Feature Point 1. (a) 1 mm; (b) 2 mm; (c) 3 mm; (d) 4 mm; (e) 5 mm; (f) 6 mm.
Table 10.
Hardness measurement results at various points on the same cross-section (mm).
Calculating the equivalent hardened layer depth and “symmetry” results for this cross-section yields , , and . The relative errors of the equivalent hardened layer depth are 1.6% for the left side and 1.0% for the right side. The symmetry indices provided by the two methods exhibit excellent agreement, validating the efficacy of the proposed ultrasonic measurement method for evaluating the symmetry of the equivalent hardened layer depth on both sides of the guide rail specimens.
5. Discussion
The measurement precision and characterization sensitivity of the proposed ultrasonic method are governed by several external factors and environmental uncertainties, which must be rigorously accounted for in practical industrial deployment:
1. Surface Roughness: The GH20 linear guide rails used in this experiment underwent precision grinding, restricting their nominal surface roughness strictly to Ra ≤ 1.6 μm. Under this superior surface state, the diffuse acoustic scattering energy loss when the acoustic wave obliquely strikes the water-steel interface is negligible, bounding the ultrasonic coupling attenuation to approximately 1–2 dB, which is comfortably within the compensation range of the system gain. However, if Ra > 3.2 μm due to improper induction hardening parameters that induce a thick, rough oxide scale layer on the near-surface, the interface coupling loss will abruptly surge to over 5 dB. Such severe acoustic attenuation and coherent phase interference will completely submerge the originally weak microstructural backscattering signal from the hardened layer-matrix transition zone within the environmental noise floor, dragging the comprehensive SNR below the 10 dB baseline threshold required for reliable TOF extraction. Therefore, maintaining a finely ground guide rail surface represents an indispensable physical prerequisite for ensuring the efficacy of this non-destructive evaluation tool.
2. Geometric Variations: The complex cross-sectional geometry of the guide rail (e.g., the 0.99 mm narrow plane width at the top) enforces rigid space constraints on the focal acoustic field. Manufacturing tolerances up to ±0.05 mm in the cross-sectional dimensions alter the nominal beam spot coverage. As derived in Section 3.2, our 15 MHz center frequency yields a focal spot diameter of approximately 0.7 mm, which remains smaller than the absolute worst-case plane width under tolerance limits (0.94 mm). Consequently, the high-energy focal volume is successfully confined within the planar boundaries, mechanically blocking phase contamination from adjacent geometric step edges and ensuring that the measurement remains highly robust across legitimate manufacturing tolerances.
3. Temperature-Induced Velocity Drift: Because the testing protocol utilizes a water-immersed oblique incidence refracted transverse wave configuration, the accuracy of TOF extraction depends heavily on the wave velocity stability in the coupling medium (water). Quantitative sensitivity and error propagation analysis reveal that a water temperature fluctuation of ±2 °C directly induces a linear drift of approximately ±6 m/s in the longitudinal wave velocity of water. For the maximum case depth of 3.6 mm designed in this work, if this velocity drift is uncorrected, it will be further amplified through Snell’s law of refraction, propagating into an absolute case depth measurement error. Although the ambient water temperature in the current controlled laboratory environment is strictly locked at 20 ± 1 °C, future workshop floor deployment must integrate a temperature dynamic compensation algorithm based on high-precision thermal sensors into the low-level data processing pipeline to dynamically correct velocity drift errors.
4. Mechanical Perturbations and Alignment Stability: In industrial environment deployments, surface irregularities or mechanical track non-parallelism can induce minor localized pivoting or crabbing of the roller fixture. Quantitative geometric acoustic tolerance analysis reveals that the spring-loaded roller design effectively restrains such angular deviations within ±0.5. Crucially, because the case depth determination relies on the differential time-of-flight between the surface interface echo and the sub-surface backscattering boundary, any dynamic variance in the water path operates as a common-mode shift that is mathematically cancelled during the t1–t2 extraction. Furthermore, because the arrival time is pinpointed via a 50% half-maximum envelope threshold, the extracted TOF is highly isolated from potential amplitude fluctuations or wave-front misalignments induced by fixture crabbing. Supported by the 100-times coherent averaging at each millimeter step, the extraction scheme demonstrates robust noise immunity.
6. Conclusions
Aiming at the limitations in the heat treatment quality evaluation of high-speed linear guide rails, this paper conducted a systematic “symmetry” evaluation study based on the ultrasonic transverse wave backscattering technique. The primary conclusions are summarized as follows:
1. A multi-dimensional “symmetry” evaluation framework was proposed: Analogous to the definition of geometric tolerances, multi-dimensional evaluation indicators ranging from one-dimensional hardened layer depth data to a two-dimensional equivalent plane were established, supplementing the evaluation methods for the comprehensive distribution of the guide rail hardened layer.
2. An efficient non-destructive testing scheme was constructed: Refracted transverse waves were generated using a water-immersed focused probe with oblique incidence, which, combined with backscattering signal processing technology, achieved non-destructive quantitative characterization of the guide rail hardening depth. Experimental verification demonstrates that the maximum relative error between the ultrasonic method and the metallographic Vickers hardness method is only 1.6%, exhibiting high detection accuracy.
3. A fully automated scanning vehicle tailored to industrial online monitoring needs was developed: In coordination with the position-controlled feed of the QJR7-900 robotic arm, a spring-loaded roller-based flexible conformal tracking clamping mechanism was designed. Visual characterization of the quality state was realized: Through the proposed equivalent hardened layer model, the symmetrical distribution state of the hardened layer on the guide rail cross-section was displayed, providing a reliable engineering tool for heat treatment quality evaluation in the early stages of production.
Author Contributions
Conceptualization, S.L. and P.C.; methodology, S.L.; software, S.L.; validation, L.C., P.C. and S.L.; formal analysis, S.L.; investigation, Y.Z.; resources, M.X.; data curation, C.Y.; writing—original draft preparation, S.L.; writing—review and editing, Y.Z.; visualization, P.C.; supervision, S.L.; project administration, C.Y.; funding acquisition, Y.Z. All authors have read and agreed to the published version of the manuscript.
Funding
This research was funded by: Zhejiang Provincial Natural Science Joint Fund Key Project, grant number LLSSZ24E050001; Key R&D Program of Lishui City, grant number 2023ZDYF01.
Data Availability Statement
The original contributions presented in this study are included in the article. Further inquiries can be directed to the corresponding author.
Acknowledgments
This work was funded by Lishui City and Zhejiang Natural Science Joint Fund. We thank colleagues for technical and administrative support.
Conflicts of Interest
The authors declare no conflicts of interest.
References
- Abele, E.; Altintas, Y.; Brecher, C. Machine tool spindle units. CIRP Ann. 2010, 59, 781–802. [Google Scholar] [CrossRef]
- Qu, Y.X.; Zhu, J.Q.; Zhu, D.B. Research on a user-oriented parametric design system for CNC machine tools. Mech. Des. 2016, 33, 43–46. [Google Scholar]
- China Machine Tool and Tool Association. “14th Five-Year Plan” for Intelligent Manufacturing Development; Ministry of Industry and Information Technology: Beijing, China, 2021.
- Rong, B.S. Optimization of the Structure and Dynamic Performance Analysis of High-Speed, Heavy-Load Roller Linear Guide Systems. Ph.D. Thesis, Shandong University, Jinan, China, 2020. [Google Scholar]
- Zhou, J.; Yu, H.; He, M. Application-oriented classification and performance analysis of precision linear feed mechanisms for machine tools. Sci. Prog. 2026, 109, 00368504251410781. [Google Scholar] [CrossRef] [PubMed]
- Zhang, S.S. Principles and applications of linear guides. Hongdu Sci. Technol. 2004, 2, 44–49. [Google Scholar]
- Kato, S.; Matsumoto, J. Recent developments in highly precise NSK linear guides. Motion Control 2000, 9, 27–34. [Google Scholar]
- Li, J.; Cao, Z.; Liu, L. Effect of microstructure on hardness and wear properties of 45 steel after induction hardening. Steel Res. Int. 2021, 92, 2000540. [Google Scholar] [CrossRef]
- Sun, Y.; He, L.; Gao, Y. Effect of induction quenching and tempering temperature on the mechanical properties and microstructure evolution of 45 steel for linear guide. J. Mater. Eng. Perform. 2023, 33, 12312–12321. [Google Scholar] [CrossRef]
- Hou, Z. Research on Ultrasonic Testing Technology for the Morphology of Quenched Layer in Alloy Steel. Master’s Thesis, Jilin University, Changchun, China, 2024. [Google Scholar]
- Koppelmann, J. Härtetiefenmessung an Stahlwalzen mit Ultraschall/Ultrasonic measurement of hardening depth on steel rolls/Mesure de la profondeur de trempe en cylindres d’acier par ultrasons. Mater. Test. 1967, 9, 401–405. [Google Scholar]
- Willems, H. Nondestructive determination of hardening depth in induction hardened components by ultrasonic backscattering. In Review of Progress in Quantitative Nondestructive Evaluation; Springer: Boston, MA, USA, 1991; Volume 10B, pp. 1707–1713. [Google Scholar]
- Baqeri, R.; Honarvar, F.; Mehdizad, R. Case depth profile measurement of hardened components by ultrasonic backscattering technique. In Proceedings of the 18th World Conference on Nondestructive Testing, Durban, South Africa, 16–20 April 2012; South African Institute for Non-Destructive Testing (SAINT): Johannesburg, South Africa, 2012; Volume 17. [Google Scholar]
- Salchak, Y.A.; Sednev, D.A.; Kroening, M.; Ardashkin, I.B. Method of case hardening depth testing by using multifunctional ultrasonic testing instrument. IOP Conf. Ser. Mater. Sci. Eng. 2015, 81, 012080. [Google Scholar] [CrossRef]
- Hui, F.; Geng, S.; Zhang, L.; Du, F.; Wang, S.; Liu, K.; Liang, S.; Liu, W. Hardened-layer depth measurement without prior velocity knowledge: An experimental study using FMC phased-array ultrasonics and CMP gathers. Ultrasonics 2026, 164, 108012. [Google Scholar] [PubMed]
- Fu, T.; Chen, P.; Yin, A. Prediction of the case depth based on the spatial gradient feature in induction-hardened steel with a large transition zone by ultrasonic backscatter. IEEE Sens. J. 2024, 24, 23561–23574. [Google Scholar] [CrossRef]
- Hui, F.; Geng, S.; Zhao, F.; Wang, S.; Wang, X.; Yang, C.; Zhao, D.; Zhang, J. Ultrasonic phased array-based wave velocity inversion and migration imaging method for hardened layers. Russ. J. Nondestruct. Test. 2025, 61, 1040–1052. [Google Scholar] [CrossRef]
- Chen, P.; Chen, L.; Xue, M.; Yang, C. B-Scan Imaging and 3D Visualization of Hardened Layer Depth Profile in Linear Guide Rails Based on Ultrasonic Shear Wave Backscattering Technique. Acoustics 2025, 7, 55. [Google Scholar] [CrossRef]
- Sladojevic, B. Attenuation of Ultrasonic Waves. In Proceedings of the 2nd International Conference on NDE in Relation to Structural Integrity for Nuclear and Pressurized Components, New Orleans, LA, USA, 24–26 May 2000. [Google Scholar]
- Ahn, B.; Lee, S.S. Effect of microstructure of low carbon steels on ultrasonic attenuation. IEEE Trans. Ultrason. Ferroelectr. Freq. Control 2000, 47, 620–629. [Google Scholar] [CrossRef]
- Papadakis, E.P. Scattering of Ultrasound in Polycrystalline Solids. Phys. Acoust. 1981, 15, 237–298. [Google Scholar]
- Wang, J.; Gang, T.; Tian, C.Y. Analysis and experiment on the oblique incidence acoustic field of a water-immersed focused probe. J. Jiamusi Univ. Nat. Sci. Ed. 2005, 3, 358–361. [Google Scholar]
- Bayat-Kazazi, M.; Honarvar, F.; Bahadory, A. Multi-response optimization of ultrasonic case depth measurement. J. Nondestruct. Eval. 2025, 44, 67. [Google Scholar] [CrossRef]
- ISO 3754:1976; Steel—Determination of Effective Depth of Hardening After Flame or Induction Hardening. International Organization for Standardization: Geneva, Switzerland, 1976.

Disclaimer/Publisher’s Note: The statements, opinions and data contained in all publications are solely those of the individual author(s) and contributor(s) and not of MDPI and/or the editor(s). MDPI and/or the editor(s) disclaim responsibility for any injury to people or property resulting from any ideas, methods, instructions or products referred to in the content. |
© 2026 by the authors. Licensee MDPI, Basel, Switzerland. This article is an open access article distributed under the terms and conditions of the Creative Commons Attribution (CC BY) license.