


Abstract
Microplastic pollution has become a global concern due to its widespread impacts on organisms and ecosystems. While there have been a few studies quantifying microplastics in inland areas of Puerto Rico, none, to our knowledge, have studied nearshore coastal surface waters. This study, therefore, presents the first assessment of microplastic concentrations and descriptions in the surface waters of La Parguera Natural Reserve, southwestern Puerto Rico. Using 333-micron plankton net trawls, we found low mean ± standard deviation microplastic concentrations of 0.02 ± 0.07 microplastic particles m−3 (95% confidence interval = 0.01 to 0.04 microplastic particles m−3). The most prevalent polymers were high-density polyethylene (48%) and polyethylene (32%), followed by polypropylene (11%) and polystyrene (7%). The most common colors were white (50%), blue (34%), black (8%), red (5%), and colorless (3%). Subsequently, the common structures found were fragments (78%), filaments (12%), films (8%), and fibers (2%). No clear coastal gradient or seasonal patterns were detected (p < 0.05), and mean concentrations were similar to previously surveyed oceanic waters from the Caribbean, suggesting coastal sources of marine microplastics were minimal compared to oceanic sources. This study provides a foundational understanding of microplastics in the coastal waters of La Parguera Natural Reserve and provides critical baseline data for detecting potential future changes in microplastic concentrations.
1. Introduction
Plastic has transformed modern society since the mid-1900s due to its versatility, durability, and low cost [1], making it an essential material across countless industries, including packaging, medicine, construction, and consumer goods [2]. However, despite the benefits and durability of plastics, the mismanagement of plastic waste and the lack of plastic biodegradation have led to the proliferation of microplastics in the atmosphere [3], farmland [4], rivers [5], beaches [6], the surface ocean [7], and the deep ocean [8]. Microplastics are plastics with a diameter of less than five millimeters [9], which consist of primary microplastics, such as microbeads and synthetic fibers used in personal care products and clothes manufacturing [10], and secondary microplastics that originate from the breakdown of macroplastics (greater than 100 mm) into smaller pieces due to biological, chemical, and physical degradation [9].
There is increasing concern about the impact of marine microplastics on wildlife [1,10]. Microplastics threaten marine animals because of the accessibility of these tiny particles to primary producers, which can be transferred into the food web [11]. The ingestion of microplastics has been observed for plankton [12], corals [11], seagrass [13], mangroves [14], sea urchins [15], fish [16], sea turtles, mammals, and humans [17]. The physical impact of microplastics can block the digestive tract, leading to reduced food intake, starvation, reduced energy and mobility, the formation of fat deposits, altered enzyme secretion, difficulty breathing, and delays in the reproductive process [11]. In addition, the chemical effects of microplastic ingestion can produce heartbeat alteration, pericardial edema, neurotoxicity, alteration in hormones, damage to the central nervous system, cancer, and death [18]. In addition to their direct impacts, microplastics can be associated with the adsorption of secondary chemicals such as PCBs, Phthalates, and BPA [19,20], the accumulation of heavy metals, and the generation of unique microbiomes [21], including potentially pathogenic bacteria [22,23].
Since microplastics are encountered in all environments, they pose ecological and health risks to humans [24] and terrestrial and marine organisms [1]. Therefore, studying their spatial and temporal distribution in the environment is crucial to better understand the corresponding spatial and temporal distribution of potential impacts. However, much of this knowledge is lacking in the Caribbean Region, with just a few examples from coastal beaches. For example, ref. [25] reported an average of 261 microplastic particles per kilogram on beaches of the Lesser Antilles, ref. [26] reported up to an average of 17 microplastic particles per kilogram of dry sand for heavily visited beaches in northern Puerto Rico, and ref. [27] reported the type but not the density of plastics and polymers at La Guancha in southern Puerto Rico. While there are no published studies on the spatial distribution of microplastics in the coastal waters of Puerto Rico, concentrations of up to 9269 microplastic particles km−2 were observed for surface waters of the estuaries of San Juan, Puerto Rico [28], and up to 148.64 ± 138.87 microplastic particles per kg were observed for four tidal flats on La Parguera Natural Reserve in Southwest Puerto Rico [29]. Further offshore, ref. [30] reported a mean concentration of 1414 microplastic particles per square meter from plankton net trawls conducted over a 22 year period from 1986 to 2008 in the surrounding North Atlantic and Caribbean surface waters.
This study aims to fill the gap in quantifying coastal marine microplastics in Puerto Rico by assessing the spatial and temporal distribution of marine microplastics across the surface waters of La Parguera Natural Reserve, located on the southwest of the island, providing an important site for understanding the microplastics contamination patterns in the southwest of Puerto Rico. We hypothesized that a higher concentration of microplastics would be found near the coast and that a decreasing gradient would be observed farther from the coast, as reported in [31]. In addition to quantifying the concentration of marine microplastics, we also described their shapes, colors, and compositions. The knowledge gained will help us understand the distribution, sources, and impacts of microplastics in Puerto Rico’s coastal waters.
2. Materials and Methods
2.1. Study Area
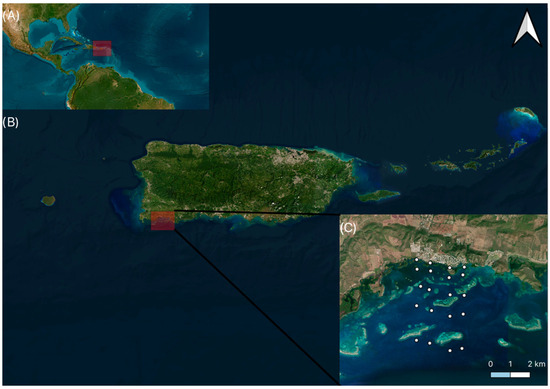
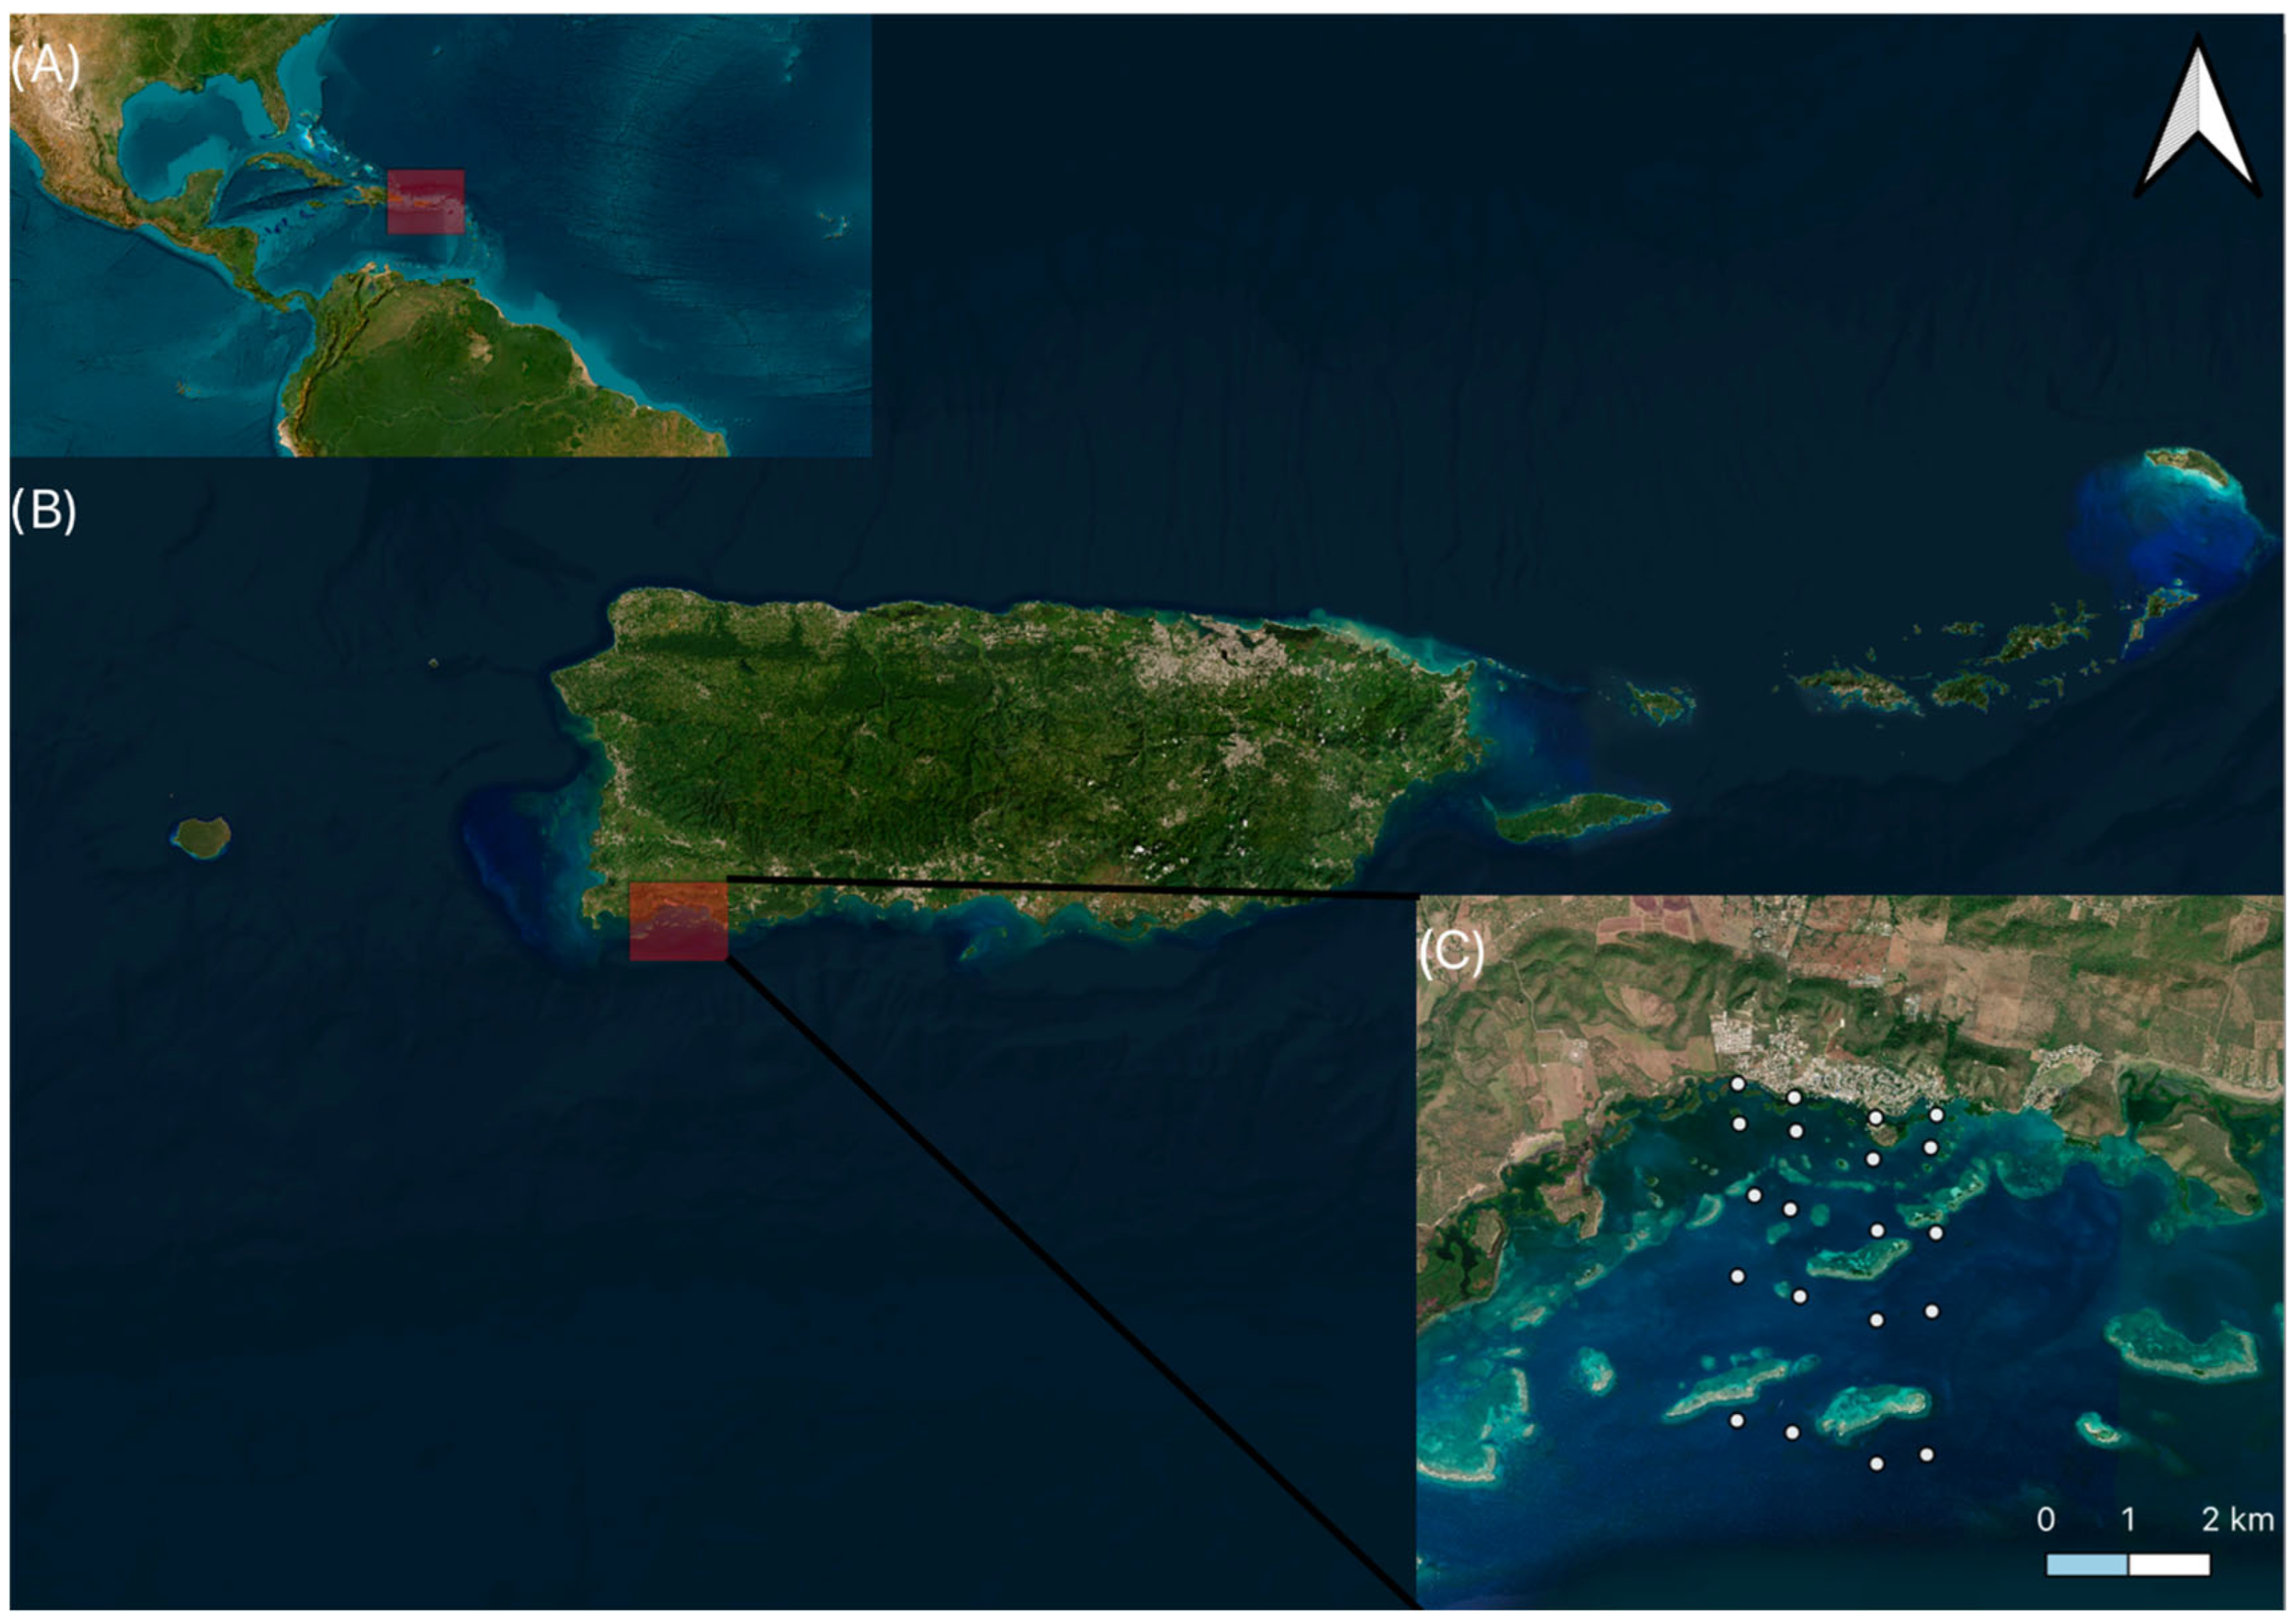
This research was conducted at the La Parguera Natural Reserve in southwestern Puerto Rico (Figure 1). This reserve is known for approximately 20 km2 of abundant mangroves, seagrasses, and coral reefs, including one of Puerto Rico’s bioluminescent bays, making it attractive for tourism. La Parguera receives less precipitation annually than other regions of Puerto Rico [32], with no direct water inputs from rivers. In La Parguera, five groups of four sites, representing 30 m, 520 m, 1.4 km, 2.5 km, and 4 km from the coast, were selected for microplastic sampling to visualize the distribution of microplastics in surface waters across the La Parguera Natural Reserve (Figure 1).
Figure 1.
(A) Image showing in red square the location of Puerto Rico in the Caribbean. (B) The red square shows the Location of La Parguera Natural Reserve in Puerto Rico. (C) Shows the sampling locations as white dots within La Parguera Natural Reserve.
2.2. Sampling
The sampling methods of this research were guided by the National Oceanic and Atmospheric Administration (NOAA) Marine Debris Program microplastics manual [33]. Sampling was conducted approximately monthly throughout 2023. Sampling days were selected based on forecasted wind speeds below 10 knots and wave heights below 0.3 m to prevent surface water microplastics from entering the mixed layer and escaping capture during the sampling effort [27,34]. To evaluate a possible coastal gradient, five predefined distances from the coastline to the open ocean were established (40 m, 520 m, 1400 m, 2400 m, and 4200 m). For each distance, four independent sites were selected as replicates, each representing a comparable distance from the coastline. At each site, a small plankton net of 333 microns and 30 × 120 cm was deployed from the side of the boat for five minutes at 1–2 knots (0.5–1.02 m/s). The net was positioned to skim the surface water by being fully submerged and filtering the first 30 cm of water from the surface. Each sampling effort consisted of 20 total trawls (5 distances x 4 replicates) across 8 sampling events for a total of 160 surface trawls. Tows were excluded and repeated if the net became visibly clogged by pelagic sargassum or if the net frame came out of the water to avoid sampling biases.
The net mesh size (333 microns) was chosen to maintain consistency with the scientific community and enable direct comparison with regional studies. It is important to note that the mesh size introduces an inherent size-filtered bias. Particles smaller than 333 microns are not efficiently retained, leading to underrepresentation. The area and distance traveled with the plankton net were recorded with a General Oceanics, Fl, USA Mechanical Flowmeter model 2030 series and a backup Garmin, Ks, USA eTrex 10 GPS track, resulting in an average of 14.7–29.4 m3 of surface water filtered per plankton tow, which varied with boat speed and current. All formulas were retrieved from the Flowmeter operational manual (Equations (1) and (2)).
The resulting microplastic abundance was normalized to the surface water volume filtered for each sample, and all results were presented as microplastic particles per cubic meter. In each station, the plankton net was cleaned with distilled water multiple times to prevent contamination at other sampling sites. All the material in the cod end of the net was transferred to a 16 oz glass mason jar using a squirt bottle filled with distilled water to clean and evenly distribute it. All squirt bottles were previously inspected before each sampling effort and washed with filtered water. Each glass mason jar collected was transported to the Bio-Optical Oceanography Laboratory on Magueyes Island for filtering and particle identification.
2.3. Sample Filtration
Each glass mason jar collected at each sampling site was poured through stacked stainless-steel sieves with 5, 1, and 0.3 mm diameter openings (10 × 4.5 cm, Adamas-beta). Sieves were washed with filtered water after collection and visually inspected using a digital microscope (Andostar Microscope, Shenzhen, China) at 40X magnification to ensure the recovery of every particle and prevent cross-contamination with other samples.
Potential contamination was evaluated by filling a cleaned mason jar with distilled water and leaving it open in the laboratory as a procedural blank. Eight blank mason jars were processed for each filtration effort during the 2023 campaign. After filtering the field samples, each blank was processed and inspected using the same protocol. No microplastic particles were detected in the laboratory blanks (0 microplastics per mason jar, n = 8). Therefore, no blank corrections were applied.
Each marine debris particle was manually transferred with pre-cleaned and inspected metal tweezers to a glass for subsequent analysis of sample color, size, and composition. To prevent contamination, all clothing used during the sampling effort and in the lab was cotton. The lab equipment used was made of metal or glass. Furthermore, all equipment was washed with filtered water and covered with aluminum foil after cleaning. Before using each instrument, they were inspected using the digital microscope. The squirt bottles used were 100 mL LDPE bottles. No clear LDPE microplastics were detected in any of the samples, suggesting they did not originate from the squirt bottles used for rinsing.
2.4. Samples Color and Size Identification
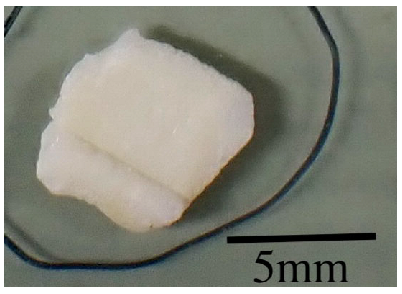
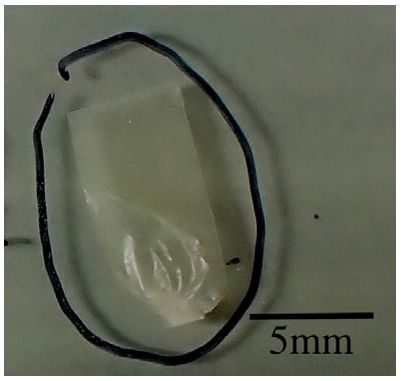
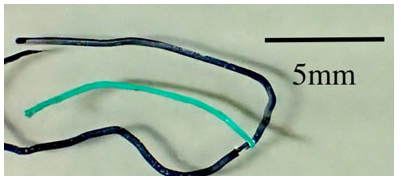
A digital microscope (Andostar Microscope) was used to separate, photograph, and visually inspect the debris collected in the samples. ImageJ software (version 2.14.0) was used to digitally measure and record the color of each debris item. Representative microplastic shapes used for the classification of microplastics in this study and their descriptions are reported in Table 1.
Table 1.
Microplastics’ shape descriptions and examples from this study.
2.5. FTIR Analysis
A PerkinElmer Spectrum Two FT-IR Spectrometer was used to identify the microplastic polymer at each site. To sample each debris, all samples were placed on the instrument’s diamond crystal, and 10 scans were averaged over the wavenumber range of 500 to 4000 cm−1, with a 4 cm−1 spectral resolution. Before analyzing any new debris, the instrument was cleaned with methanol, and the background was measured with the same settings against air. The pressure arm’s tightness, which holds each sample to the diamond crystal for measurement, was set to 70 to ensure consistent contact between the sample and the crystal.
Raw spectra were automatically baseline- and atmospheric-compensated within the instrument software. The PerkinElmer polymer library was used to determine the polymer type of each debris sample. A minimum library match score of 70% was established as the acceptance threshold of polymer assignment. In addition, each spectrum was inspected in accordance with the visual spectrum identification guidelines developed by [35]. Spectra that matched less than 60% and were difficult to identify with visual inspection were classified as unidentified and excluded from the analysis.
2.6. Data Visualization
The data visualizations were conducted using the R (version 4.4.0) package ggplot2 (version 3.5.1).
2.7. Statistical Analysis
To evaluate the spatial and temporal gradients in microplastic abundance, we fitted a generalized linear mixed-effects model (GLMM) with a negative binomial distribution. This model was used because our results consisted of count data that were highly right-skewed and overdispersed. Microplastic abundance was modeled as a function of seasons (Dry vs. Wet) and standardized distances from the coast (40 m, 520 m, 1400 m, 2400 m, and 4200 m). This model was fitted by using the glmmTMB (version 1.1.14) package in R (version 4.4.0) using a log link function.
3. Results
3.1. Microplastics Spatial Distribution
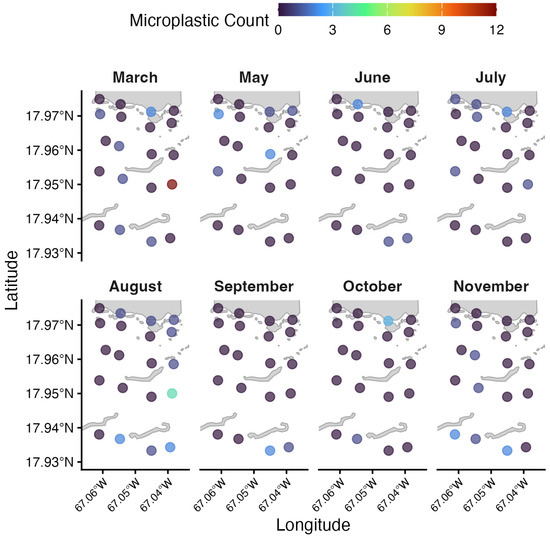
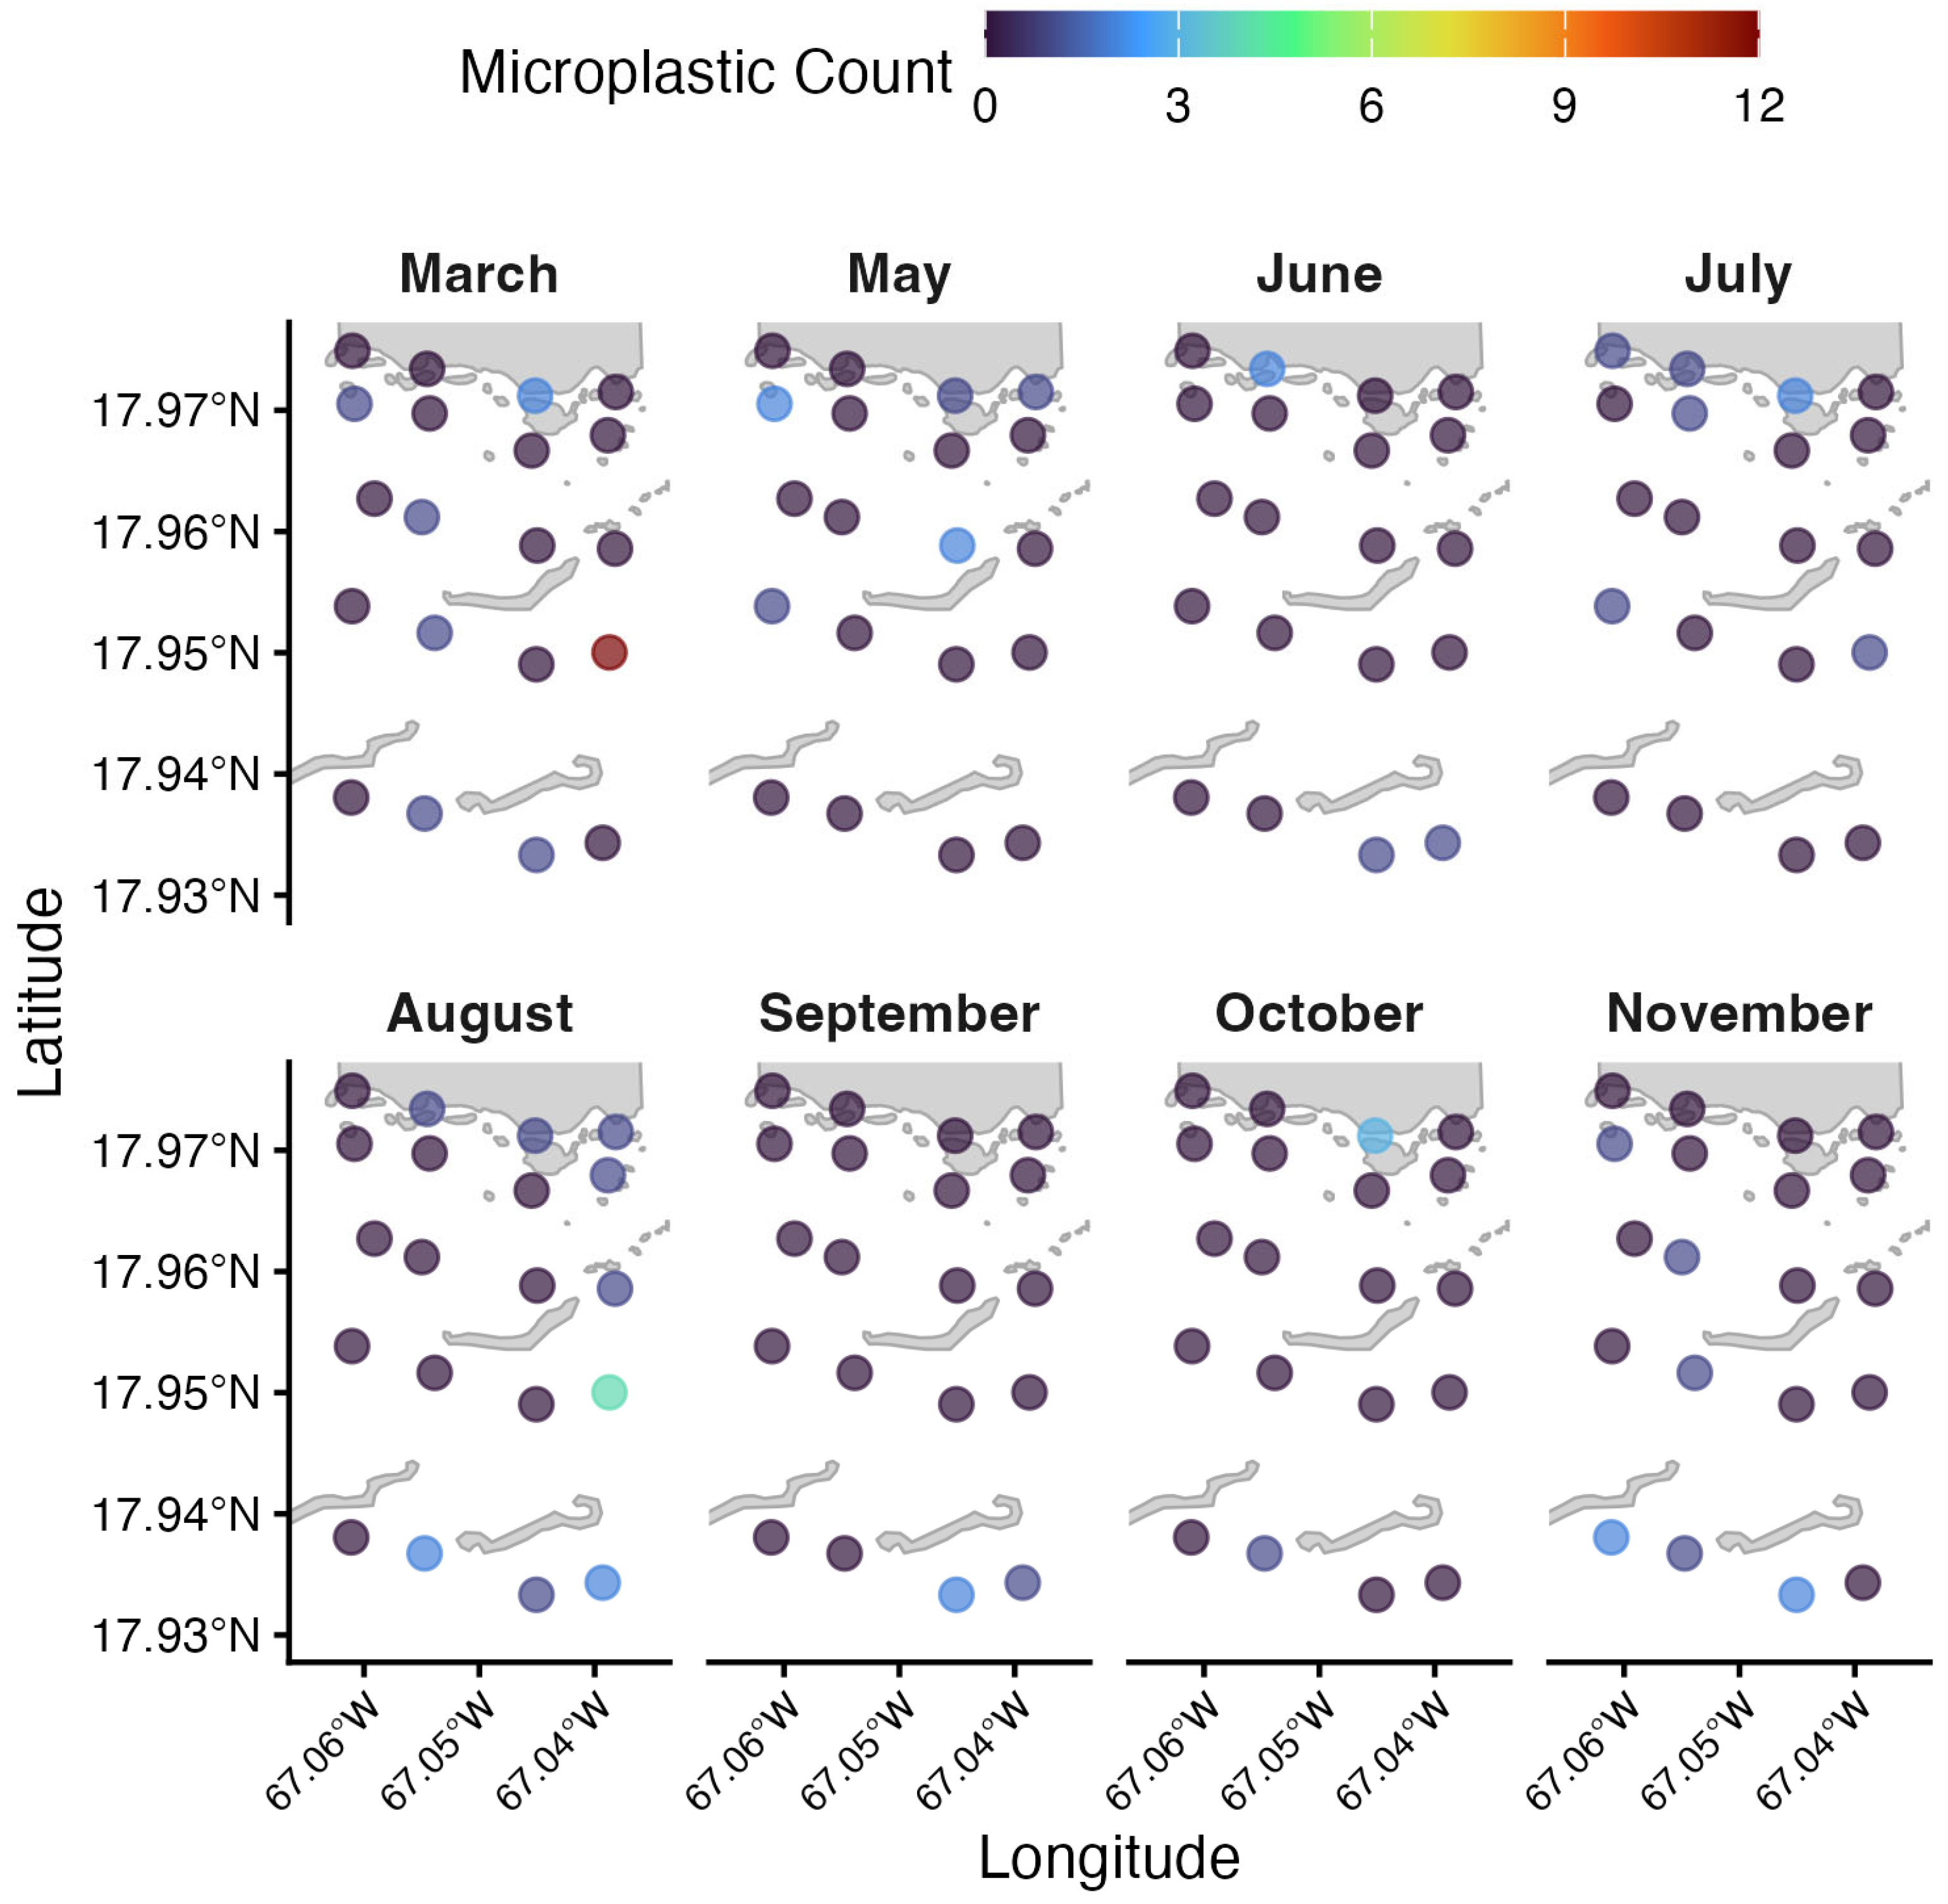
The mean microplastic concentration in this study at La Parguera Reserve was 0.02 ± 0.07 microplastics m−3 (95% confidence interval = 0.01 to 0.04 microplastics m−3). There were no significant differences between distance from the coast (p = 0.24) or sampling event (p = 0.57), suggesting there were no detectable inshore–offshore or temporal gradients in surface microplastics during the study period (Figure 2). Additionally, all laboratory blanks had zero microplastics in Mason jars.
Figure 2.
Point map of microplastic densities for each sampling date. Each sample site is colored by its respective microplastic concentration to visualize spatial patterns in marine microplastic (MP) density (m−3).
3.2. Microplastics Descriptions
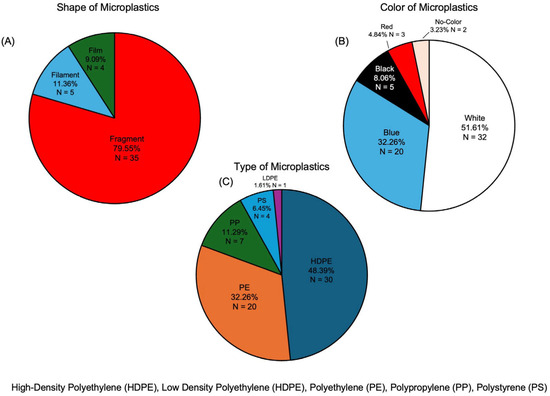
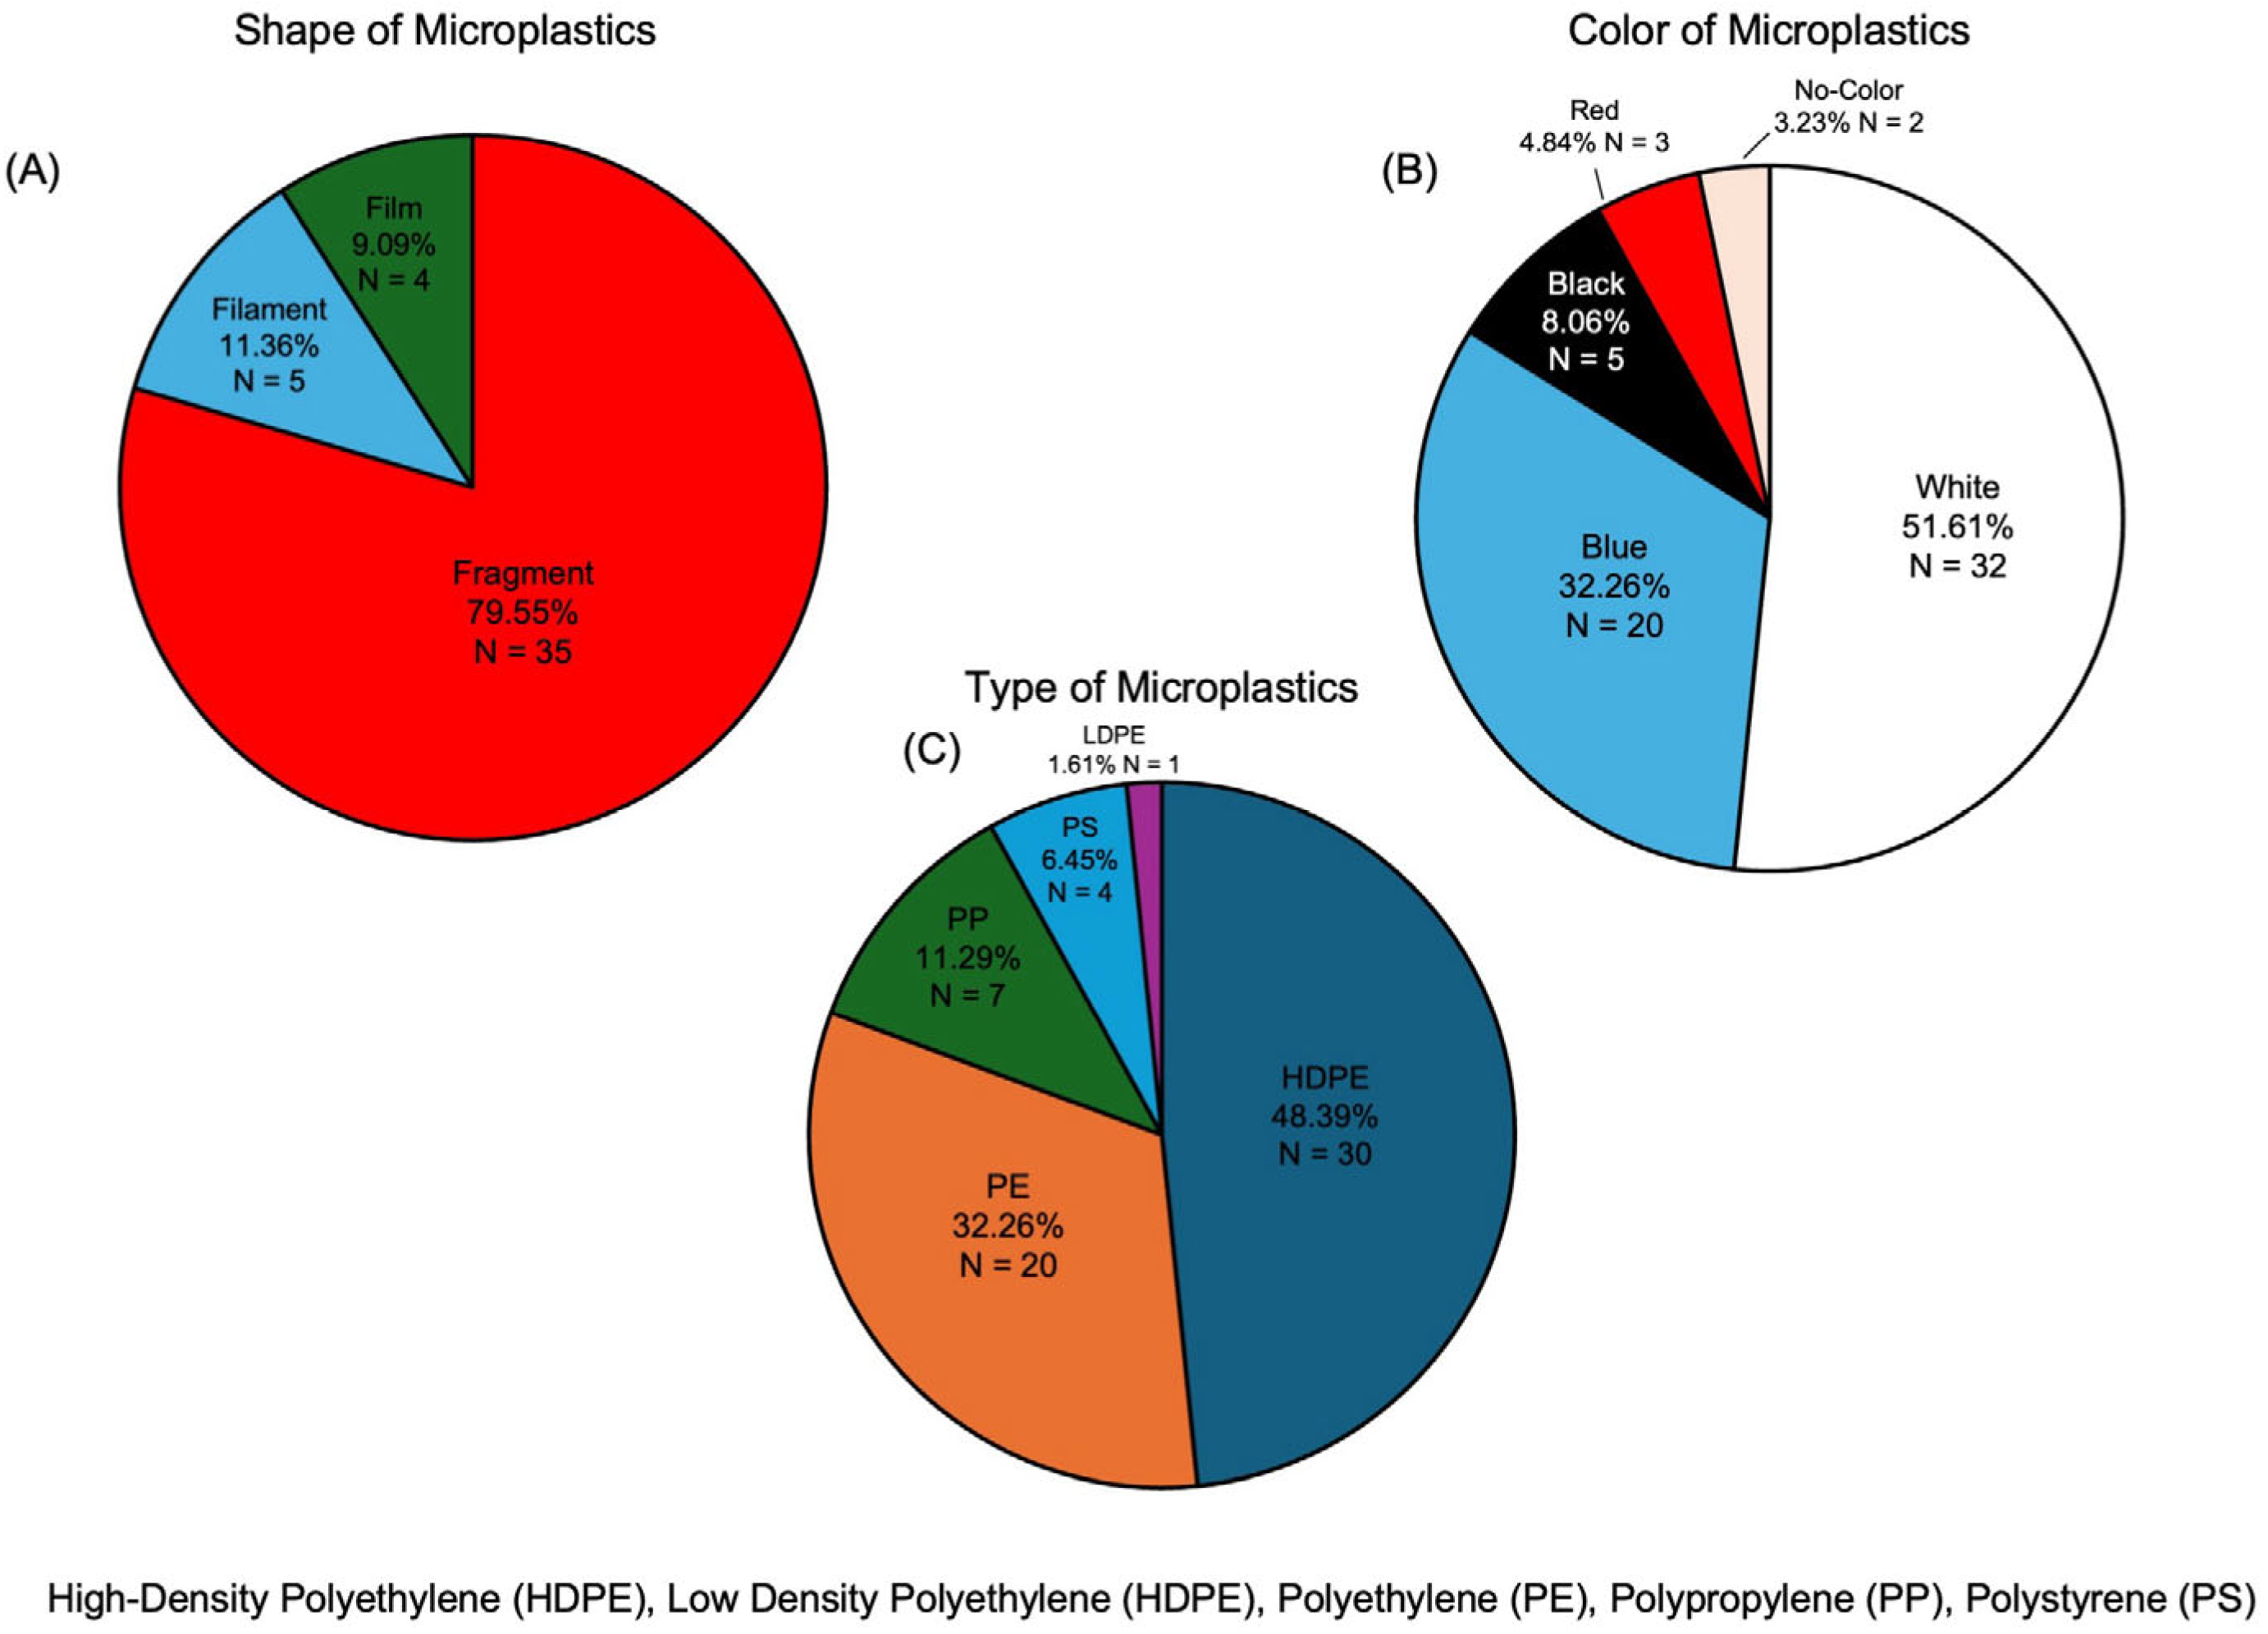
The majority of the microplastics found in La Parguera Reserve were fragments (78%), followed by filaments (12%), films (8%), and fibers (2%) (Figure 3). The most common color for the microplastics was white (50%), followed by blue (34%), black (8%), red (5%), and colorless (3%) (Figure 3). High-density polyethylene was the most common (48%), followed by polyethylene (32%), polypropylene (11%), polystyrene (7%), and low-density (2%) (Figure 3).
Figure 3.
Pie charts represent the classification of microplastics observed across all sampling events and stations from this study. (A) shows the percentages of each shape, (B) shows the percentages of each color, and (C) shows the percentages of each polymer.
4. Discussion
To the authors’ knowledge, this is the first study to report the spatial distribution and descriptions of microplastics in coastal surface waters of Puerto Rico. The mean concentration of microplastics found in LPNR was low, with a mean of 0.02 ± 0.07 microplastic particles m−3 (95% confidence interval = 0.01 to 0.04 microplastic particles m−3) and no detectable spatial or temporal pattern across the sampling stations according to the result of the GLMM. These results were similar to the 0.01 items m−3 reported for sampling sites with minimal human populations and lacking river inputs in coastal Colombian water [36]. These are also comparable microplastic concentrations, ranging from 0 to 2000 items km−2 in open-ocean waters south of Puerto Rico [30], although the lack of volume-normalized concentrations, colors, and sizes by [30] prevents a more direct comparison. In addition, microplastics in the estuaries of the more populous city of San Juan, Puerto Rico, averaged 9269 particles km−2 [28]. If we spatially normalize our microplastic data to the area with the diameter of the plankton net and the distance traveled, our mean concentrations would be 0.0057 ± 0.0159 microplastic particles m−2 (mean ± SD). This is comparable to the offshore concentrations near Southwest Puerto Rico reported by [30] but is much lower than the values reported for San Juan Estuaries by [28].
We had hypothesized that microplastic concentrations would be higher inshore, consistent with coastal sources of microplastics as observed in the Gulf of Cadiz in Spain [31]. However, we found no detectable coastal gradient in marine microplastics (p = 0.24), with concentrations reflecting those sampled from offshore waters by [30], suggesting that most of the microplastics encountered in this study were potentially advected from offshore waters and were not due to coastal inputs. While we did not explicitly model seawater hydrodynamics during the study period, the prevailing currents flowing from the east and trade winds blowing from the southeast would likely transport any microplastics from those directions [37]. However, we cannot rule out the influence of the adjacent Rio Loco River, which flows westward into La Parguera [38], or occasional pulses of more distant riverine waters from the Amazon and Orinoco Rivers [39]. We also hypothesized that marine microplastic densities would be higher during rainy seasons or precipitation events and lower during dry seasons, following [40]. However, we observed no detectable temporal patterns in microplastic densities throughout the sampling year (p = 0.57), and mean concentrations were comparable to offshore concentrations reported by [30]. These findings reinforce the idea that marine microplastics in La Parguera Natural Reserve may have potentially originated from offshore sources, with comparatively few from nearshore sources.
Most of the microplastics found in La Parguera were white-colored fragments (Figure 3). These findings agree with previous observations that fragments were most commonly marine microplastics [31,36]. However, while pellets were observed in the sands at nearby La Guancha beaches [27], we did not observe any pellets in our samples. Plastic breaking down into smaller pieces was therefore the principal source of microplastics along Puerto Rico’s coastlines [9]. While we observed 12% filaments (Figure 3), no prior study reported filaments, including for the tidal flats of La Parguera [29]. However, some studies report filaments as fibers, so if that is the case [28], then La Parguera tidal flats and coastal surface waters would have similar microplastic structures. White, blue, black, red, and colorless microplastics were the primary colors observed in this study (Figure 3) and have also been commonly observed elsewhere [36,41], including the tidal flats of La Parguera [29]. Most importantly, the observed colors of microplastics in this study are similar to those found in the guts of different fish species [42], indicating a greater threat to small marine organisms that could ingest them [42].
High-density polyethylene, polyethylene, and polypropylene were the most observed microplastics in this study (Figure 3). This is consistent with prior marine microplastic studies, including those from the tidal flats of La Parguera, which document polyethylene and polypropylene as the most common [27,29]. This is an expected result because polyethylene is widely used and among the most produced polymers [43]. However, while previous studies documented higher-density polymers such as PVC and PET [27,28,29,36], we did not observe them in our samples (Figure 3). The absence of these higher-density PVC and PET plastics may be due to the use of the plankton net, which only captures surface microplastics that are less dense than seawater (PE, PS, and PP), leaving out polymers such as polyamide (PA), polyurethane (PU), polyethylene terephthalate (PET), and PVC that are denser than seawater and thus would sink to the benthos. We may also have been unable to detect biofouled particles [44], particles smaller than our smallest mesh size [8], or particles mixed deeper in the water column due to wind, resulting in a potential underestimate of actual concentrations [34,45]. However, these are common limitations of marine debris studies, and by following established methods [33], our study allows direct comparison with other marine microplastics studies that use the same methodology.
5. Conclusions
This study, to our knowledge, provides the first assessment of the spatial distribution and microplastic descriptions in the surface waters of La Parguera Natural Reserve, Puerto Rico. Our analysis indicates that the microplastic content of surface water is lower than in beaches, tidal flats, and estuaries near industrialized or river-influenced areas in Puerto Rico. However, the similarity in polymer type, color, and structure between nearby studies indicates similar secondary plastic inputs. The lack of detectable coastal gradient and seasonal patterns suggest minimal direct coastal sources of microplastics from the town of La Parguera and that the majority of marine microplastics may have originated from offshore. This study establishes critical baseline data for detecting potential future changes in marine microplastics in La Parguera area and other coastal Puerto Rican sites. Given the widespread prevalence of microplastics, it is essential to mitigate plastic pollution, protect marine ecosystems, and implement stricter rules on plastic production and waste management.
Author Contributions
R.I.: Data curation, Investigation, Methodology, Conceptualization, Visualization, Writing—original draft, Writing—review & editing. Formal Analysis. L.C.: Investigation, Methodology, Data curation. T.A.C.: Conceptualization, Writing—original draft, Writing—review & editing. J.J.C.M.: Conceptualization, Writing—review & editing. R.A.A.: Conceptualization, Writing—review & editing, Resources, Funding acquisition. All authors have read and agreed to the published version of the manuscript.
Funding
This research was funded by NASA OCEAN MUREP Program Award number 80NSSC21K1701.
Data Availability Statement
The raw data supporting the conclusions of this article will be made available by the authors on request.
Acknowledgments
We thank Sindia Ramos for training in analyzing polymer samples and Nairmen Mina for granting access to the FTIR facilities. We would also like to thank Frank Lazu for captaining the boat during selected sampling events. Thanks to the NASA Ocean MUREP program for funding this study. Finally, special thanks to the Department of Marine Science at the University of Puerto Rico at Mayagüez for their support, assistance, laboratory facilities, and logistical support for the samplings.
Conflicts of Interest
The authors declare no conflicts of interest.
Abbreviations
The following abbreviations are used in this manuscript:
| PE | Polyethylene |
| HDPE | High-Density Polyethylene |
| LDPE | Low-Density Polyethylene |
| PS | Polystyrene |
| PP | Polypropylene |
References
- Hale, R.C.; Seeley, M.E.; La Guardia, M.J.; Mai, L.; Zeng, E.Y. A Global Perspective on Microplastics. J. Geophys. Res. Ocean. 2020, 125, e2018JC014719. [Google Scholar] [CrossRef]
- Alimba, C.G.; Faggio, C. Microplastics in the marine environment: Current trends in environmental pollution and mechanisms of toxicological profile. Environ. Toxicol. Pharmacol. 2019, 68, 61–74. [Google Scholar] [CrossRef]
- O’Brien, S.; Rauert, C.; Ribeiro, F.; Okoffo, E.D.; Burrows, S.D.; O’Brien, J.W.; Wang, X.; Wright, S.L.; Thomas, K.V. There’s Something in the Air: A Review of Sources, Prevalence and Behaviour of Microplastics in the Atmosphere. Sci. Total Environ. 2023, 874, 162193. [Google Scholar] [CrossRef]
- Fakour, H.; Lo, S.-L.; Yoashi, N.T.; Massao, A.M.; Lema, N.N.; Mkhontfo, F.B.; Jomalema, P.C.; Jumanne, N.S.; Mbuya, B.H.; Mtweve, J.T.; et al. Quantification and Analysis of Microplastics in Farmland Soils: Characterization, Sources, and Pathways. Agriculture 2021, 11, 330. [Google Scholar] [CrossRef]
- Polanco, H.; Hayes, S.; Roble, C.; Krupitsky, M.; Branco, B. The Presence and Significance of Microplastics in Surface Water in the Lower Hudson River Estuary 2016–2019: A Research Note. Mar. Pollut. Bull. 2020, 161, 111702. [Google Scholar] [CrossRef] [PubMed]
- Costa, M.F.; Barletta, M. Microplastics in Coastal and Marine Environments of the Western Tropical and Sub-Tropical Atlantic Ocean. Environ. Sci. Process. Impacts 2015, 17, 1868–1879. [Google Scholar] [CrossRef]
- Van Sebille, E.; Wilcox, C.; Lebreton, L.; Maximenko, N.; Hardesty, B.D.; Van Franeker, J.A.; Eriksen, M.; Siegel, D.; Galgani, F.; Law, K.L. A Global Inventory of Small Floating Plastic Debris. Environ. Res. Lett. 2015, 10, 124006. [Google Scholar] [CrossRef]
- Peng, X.; Chen, M.; Chen, S.; Dasgupta, S.; Xu, H.; Ta, K.; Du, M.; Li, J.; Guo, Z.; Bai, S. Microplastics Contaminate the Deepest Part of the World’s Ocean. Geochem. Perspect. Lett. 2018, 9, 1–5. [Google Scholar] [CrossRef]
- Andrady, A.L. Microplastics in the Marine Environment. Mar. Pollut. Bull. 2011, 62, 1596–1605. [Google Scholar] [CrossRef]
- Prapanchan, V.N.; Kumar, E.; Subramani, T.; Sathya, U.; Li, P. A Global Perspective on Microplastic Occurrence in Sediments and Water with a Special Focus on Sources, Analytical Techniques, Health Risks, and Remediation Technologies. Water 2023, 15, 1987. [Google Scholar] [CrossRef]
- Sharma, S.; Chatterjee, S. Microplastic Pollution, a Threat to Marine Ecosystem and Human Health: A Short Review. Environ. Sci. Pollut. Res. 2017, 24, 21530–21547. [Google Scholar] [CrossRef]
- Sun, X.; Li, Q.; Zhu, M.; Liang, J.; Zheng, S.; Zhao, Y. Ingestion of Microplastics by Natural Zooplankton Groups in the Northern South China Sea. Mar. Pollut. Bull. 2017, 115, 217–224. [Google Scholar] [CrossRef]
- Seng, N.; Lai, S.; Fong, J.; Saleh, M.F.; Cheng, C.; Cheok, Z.Y.; Todd, P.A. Early Evidence of Microplastics on Seagrass and Macroalgae. Mar. Freshw. Res. 2020, 71, 922. [Google Scholar] [CrossRef]
- Duan, J.; Han, J.; Cheung, S.G.; Chong, R.K.Y.; Lo, C.-M.; Lee, F.W.-F.; Xu, S.J.-L.; Yang, Y.; Tam, N.F.; Zhou, H.-C. How Mangrove Plants Affect Microplastic Distribution in Sediments of Coastal Wetlands: Case Study in Shenzhen Bay, South China. Sci. Total Environ. 2021, 767, 144695. [Google Scholar] [CrossRef]
- Murano, C.; Agnisola, C.; Caramiello, D.; Castellano, I.; Casotti, R.; Corsi, I.; Palumbo, A. How Sea Urchins Face Microplastics: Uptake, Tissue Distribution and Immune System Response. Environ. Pollut. 2020, 264, 114685. [Google Scholar] [CrossRef] [PubMed]
- Su, L.; Deng, H.; Li, B.; Chen, Q.; Pettigrove, V.; Wu, C.; Shi, H. The Occurrence of Microplastic in Specific Organs in Commercially Caught Fishes from Coast and Estuary Area of East China. J. Hazard. Mater. 2019, 365, 716–724. [Google Scholar] [CrossRef] [PubMed]
- Meaza, I.; Toyoda, J.H.; Wise, J.P., Sr. Microplastics in Sea Turtles, Marine Mammals and Humans: A One Environmental Health Perspective. Front. Environ. Sci. 2021, 8, 575614. [Google Scholar] [CrossRef] [PubMed]
- Blackburn, K.; Green, D. The Potential Effects of Microplastics on Human Health: What Is Known and What Is Unknown. Ambio 2022, 51, 518–530. [Google Scholar] [CrossRef]
- Tanaka, K.; Takada, H.; Yamashita, R.; Mizukawa, K.; Fukuwaka, M.; Watanuki, Y. Accumulation of Plastic-Derived Chemicals in Tissues of Seabirds Ingesting Marine Plastics. Mar. Pollut. Bull. 2013, 69, 219–222. [Google Scholar] [CrossRef]
- Brennecke, D.; Duarte, B.; Paiva, F.; Caçador, I.; Canning-Clode, J. Microplastics as Vector for Heavy Metal Contamination from the Marine Environment. Estuar. Coast. Shelf Sci. 2016, 178, 189–195. [Google Scholar] [CrossRef]
- Bowley, J.; Baker-Austin, C.; Porter, A.; Hartnell, R.; Lewis, C. Oceanic Hitchhikers—Assessing Pathogen Risks from Marine Microplastic. Trends Microbiol. 2021, 29, 107–116. [Google Scholar] [CrossRef]
- Zettler, E.R.; Mincer, T.J.; Amaral-Zettler, L.A. Life in the “Plastisphere”: Microbial Communities on Plastic Marine Debris. Environ. Sci. Technol. 2013, 47, 7137–7146. [Google Scholar] [CrossRef] [PubMed]
- Casella, C.; Cornelli, U.; Ballaz, S.; Zanoni, G.; Merlo, G.; Ramos-Guerrero, L. Plastic Smell: A Review of the Hidden Threat of Airborne Micro and Nanoplastics to Human Health and the Environment. Toxics 2025, 13, 387. [Google Scholar] [CrossRef] [PubMed]
- Li, Y.; Zhang, H.; Tang, C. A Review of Possible Pathways of Marine Microplastics Transport in the Ocean. Anthr. Coasts 2020, 3, 6–13. [Google Scholar] [CrossRef]
- Bosker, T.; Guaita, L.; Behrens, P. Microplastic Pollution on Caribbean Beaches in the Lesser Antilles. Mar. Pollut. Bull. 2018, 133, 442–447. [Google Scholar] [CrossRef]
- Pérez-Alvelo, K.M.; Llegus, E.M.; Forestier-Babilonia, J.M.; Elías-Arroyo, C.V.; Pagán-Malavé, K.N.; Bird-Rivera, G.J.; Rodríguez-Sierra, C.J. Microplastic Pollution on Sandy Beaches of Puerto Rico. Mar. Pollut. Bull. 2021, 164, 112010. [Google Scholar] [CrossRef]
- Colón-Ortiz, A.J.; Febles-Moreno, K. Description of Microplastics on the Coast of La Guancha in Ponce, Puerto Rico Descripción de Microplásticos En La Costa de La Guancha En Ponce, Puerto Rico. ECORFAN-Boliv. J. 2018, 5, 24–32. [Google Scholar]
- Ocasio-Malavé, C.; González-Mederos, Á.M.; Torres-Talavera, F.F. Microplastic Pollution on the Surface Waters of the San Juan Bay Estuary, Puerto Rico: First Observations on Occurrence and Distribution. Perspect. Asun. Ambient. 2020, 8, 118–133. [Google Scholar]
- Bruffey, B.R.; Rodrigues, L.J. Distribution of Microplastics in the Tidal Flats of La Parguera, Puerto Rico. Mar. Pollut. Bull. 2025, 211, 117371. [Google Scholar] [CrossRef]
- Law, K.L.; Morét-Ferguson, S.; Maximenko, N.A.; Proskurowski, G.; Peacock, E.E.; Hafner, J.; Reddy, C.M. Plastic Accumulation in the North Atlantic Subtropical Gyre. Science 2010, 329, 1185–1188. [Google Scholar] [CrossRef]
- González-Ortegón, E.; Sendra, M.; Sparaventi, E.; Leal, R.F.S.; de los Ríos, I.; Baldó, F.; González-Fernández, D.; Yeste, M.P. Coastal Gradients of Small Microplastics and Associated Pollutants Influenced by Estuarine Sources. Mar. Pollut. Bull. 2022, 174, 113292. [Google Scholar] [CrossRef]
- Hernández Ayala, J.J.; Méndez Tejeda, R. Examining the Spatiotemporal Changes in the Annual, Seasonal, and Daily Rainfall Climatology of Puerto Rico. Climate 2023, 11, 225. [Google Scholar] [CrossRef]
- Mausra, B.; Foster, A. Laboratory Methods for the Analysis of Microplastics in the Marine Environment; NOAA: Silver Spring, MD, USA, 2015.
- Kukulka, T.; Proskurowski, G.; Morét-Ferguson, S.; Meyer, D.W.; Law, K.L. The Effect of Wind Mixing on the Vertical Distribution of Buoyant Plastic Debris. Geophys. Res. Lett. 2012, 39, L07601. [Google Scholar] [CrossRef]
- Nandiyanto, A.B.D.; Ragadhita, R.; Fiandini, M. Interpretation of Fourier Transform Infrared Spectra (FTIR): A Practical Approach in the Polymer/Plastic Thermal Decomposition. Indones. J. Sci. Technol. 2022, 8, 113–126. [Google Scholar] [CrossRef]
- Garcés-Ordóñez, O.; Espinosa, L.F.; Costa Muniz, M.; Salles Pereira, L.B.; Meigikos dos Anjos, R. Abundance, Distribution, and Characteristics of Microplastics in Coastal Surface Waters of the Colombian Caribbean and Pacific. Environ. Sci. Pollut. Res. 2021, 28, 43431–43442. [Google Scholar] [CrossRef] [PubMed]
- León-Pérez, M.C. Spatial-Temporal Dynamics of Decaying Stages of Pelagic Sargassum Spp. along Shorelines in Puerto Rico Using Google Earth Engine. Mar. Pollut. Bull. 2023, 188, 114715. [Google Scholar] [CrossRef]
- Larsen, M.C.; Webb, R.M.T. Potential Effects of Runoff, Fluvial Sediment, and Nutrient Discharges on the Coral Reefs of Puerto Rico. J. Coast. Res. 2009, 251, 189–208. [Google Scholar] [CrossRef]
- López, R.; López, J.M.; Morell, J.; Corredor, J.E.; Del Castillo, C.E. Influence of the Orinoco River on the Primary Production of Eastern Caribbean Surface Waters. J. Geophys. Res. Ocean. 2013, 118, 4617–4632. [Google Scholar] [CrossRef]
- Xia, W.; Rao, Q.; Deng, X.; Chen, J.; Xie, P. Rainfall Is a Significant Environmental Factor of Microplastic Pollution in Inland Waters. Sci. Total Environ. 2020, 732, 139065. [Google Scholar] [CrossRef]
- Cverenkárová, K.; Valachovičová, M.; Mackuľak, T.; Žemlička, L.; Bírošová, L. Microplastics in the Food Chain. Life 2021, 11, 1349. [Google Scholar] [CrossRef]
- Horie, Y.; Mitsunaga, K.; Yamaji, K.; Hirokawa, S.; Uaciquete, D.; Ríos, J.M.; Yap, C.K.; Okamura, H. Variability in Microplastic Color Preference and Intake among Selected Marine and Freshwater Fish and Crustaceans. Discov. Ocean. 2024, 1, 5. [Google Scholar] [CrossRef]
- Ronca, S. Polyethylene. In Brydson’s Plastics Materials, 8th ed.; Gilbert, M., Ed.; Elsevier: Amsterdam, The Netherlands, 2017; pp. 247–278. ISBN 9780323358248. [Google Scholar]
- Kooi, M.; van Nes, E.H.; Scheffer, M.; Koelmans, A.A. Ups and Downs in the Ocean: Effects of Biofouling on Vertical Transport of Microplastics. Environ. Sci. Technol. 2017, 51, 7963–7971. [Google Scholar] [CrossRef]
- Choy, C.A.; Robison, B.H.; Gagne, T.O.; Erwin, B.; Firl, E.; Halden, R.U.; Hamilton, J.A.; Katija, K.; Lisin, S.E.; Rolsky, C.; et al. The Vertical Distribution and Biological Transport of Marine Microplastics across the Epipelagic and Mesopelagic Water Column. Sci. Rep. 2019, 9, 7843. [Google Scholar] [CrossRef]

Disclaimer/Publisher’s Note: The statements, opinions and data contained in all publications are solely those of the individual author(s) and contributor(s) and not of MDPI and/or the editor(s). MDPI and/or the editor(s) disclaim responsibility for any injury to people or property resulting from any ideas, methods, instructions or products referred to in the content. |
© 2026 by the authors. Licensee MDPI, Basel, Switzerland. This article is an open access article distributed under the terms and conditions of the Creative Commons Attribution (CC BY) license.