


Abstract
Microplastic pollution threatens soil health by disrupting chemical and microbial balances and impairing nutrient cycling, with effects that vary depending on soil properties. The objective of this study is to determine the effects of contamination with three types of microplastics (<5 mm)—polypropylene (PP), polyethylene (PE), and polyethylene terephthalate (PET)—on the microbiological and chemical parameters of four soil types in Bulgaria: Calcic Chernozem, Vertisol, Luvisol, and Fluvisol. A controlled 180-day laboratory incubation experiment was performed, where each soil type was contaminated with microplastics at three concentrations to monitor changes in key microbiological and chemical properties. It was established that microplastics contamination suppressed abundance of key microbial groups and limited nutrient availability, inducing a state of biological and chemical imbalance in the soil. PET exerted the strongest impact on soil chemical properties, with the agrochemical properties of Fluvisol being the most sensitive to MP contamination. PE and PET had the greatest influence on microbial communities, with Vertisol and Luvisol being the most affected in this regard. PP contamination altered key metabolic processes, with the specific impact being highly dependent on soil type and most pronounced in Chernozem. Furthermore, the concentration influenced the measured parameters, with the effects varying depending on the soil type and the microplastic type. Among the factors influencing soil responses to microplastic contamination, soil type appears to be the most decisive, followed by the type of microplastic.
1. Introduction
Microplastics (MPs), defined as plastic debris smaller than 5 mm, represent a significant environmental threat. Due to their small size and persistence, microplastics can affect biological functions, ecological processes and are a potential risk to human health [1]. Initially, research on microplastic pollution was predominantly focused on marine environments. However, recent studies have revealed a significant and widespread distribution of these pollutants in terrestrial ecosystems. In fact, evidence suggests that agricultural soils may harbor even higher concentrations of microplastics than oceanic sediments, positioning soil as the primary global reservoir for this form of pollution [2]. For instance, some studies have reported alarmingly high accumulation rates, with topsoil containing up to 6.7% microplastics by weight in certain contaminated areas [3,4], found near the polluted industrial zone [3]. High concentrations of MPs have been observed in soils near landfills, long-term mulched areas, and following repeated application of sewage sludge [5].
Microplastics can enter terrestrial ecosystems through multiple pathways. Many modern agricultural practices contribute significantly to soil contamination with microplastics. Among them, the use of plastic mulch is considered one of the major sources of MP contamination in agricultural soils [6,7]. The application of soil amendments such as sewage sludge to agricultural lands [8], composts, organic fertilizers [9], and pollution along roads and parking lots [10], irrigation [11,12,13] and atmospheric deposition [14] also lead to significant MPs contamination of agricultural land. Nizzetto et al. [15] estimate that in Europe around 63,000 to 430,000 tons of microplastics reach agroecosystems annually via biosolids alone, whereas estimates for North America range from 44,000 to 300,000 tones.
A growing body of research indicates that once introduced into the soil environment, microplastics (MPs) interact with the soil matrix through a range of physical, chemical, and biological mechanisms, leading to significant alterations in soil properties and, consequently, to soil quality degradation [16,17]. The presence and accumulation of MPs can modify the soil physical environment by altering bulk density, porosity, aggregate stability, water-holding capacity, and moisture dynamics [7,18]. In addition, microplastic contamination can affect key soil chemical parameters such as pH, nutrient availability, dissolved organic matter, and cation exchange capacity, thereby influencing the composition and functionality of soil organic matter [4,14,19]. MPs can adversely affect soil microbial communities, leading to reduced enzyme activity and shifts in bacterial and fungal diversity [20]. These disturbances may ultimately impact fundamental processes such as organic matter decomposition. Such effects occur through two principal mechanisms: alterations in the physical and chemical properties of substrates and direct interference with decomposition processes [21]. Conversely, the remarkable metabolic versatility of soil microbiomes constitutes a promising resource for in situ remediation. This biodegradation process relies on a complex network of enzymes and is regulated by quorum sensing (QS), which coordinates microbial communication and the expression of catabolic genes essential for degrading contaminants [21,22].
Despite the growing interest in this topic, considerable uncertainty remains because relatively few studies have examined the effects of microplastics across multiple trophic levels in agroecosystems. Consequently, both robust evidence of adverse effects and well-documented cases showing no significant effects remain limited [13]. Potential impacts on key soil ecosystem functions, including carbon sequestration, nitrogen cycling, pollutant accumulation, and crop productivity are expected. Moreover, MPs may influence soil health and contamination status by affecting the migration, transformation, and degradation of co-existing pollutants such as heavy metals and organic contaminants [17].
Many commonly used polymers possess carbon–carbon backbones that are highly resistant to hydrolytic and enzymatic degradation, contributing to their persistence in the environment. Their degradation may be initiated by oxidative processes induced by ultraviolet radiation or heat, while plasticizers and other additives can further influence degradation dynamics. For example, the effects of plasticized PVC microplastics on soil microbiomes have been linked to the presence of phthalates, widely used additives in PVC and PP products [23,24].
Although research has expanded significantly, information remains insufficient regarding how soil type influences processes associated with microplastic contamination. This knowledge gap is particularly relevant in the context of repeated application of organic and waste-derived amendments, as well as sustainable soil management practices involving soil conditioners and mulching materials.
In light of these uncertainties, the present study aimed to determine changes in the chemical, biochemical, and microbiological properties of four soil types widely distributed across the country under conditions of MP contamination. A further objective was to assess the response of soil properties to three types of microplastics—PP, PE, and PET—and to evaluate the influence of MP concentration on key soil functions. The novelty of the present incubation experiment lies in its integrated multifactorial design, which combines soil matrix diversity, polymer specificity, and a concentration gradient within a single experimental framework. The study demonstrates that the effects of MPs depend on the physicochemical soil properties, indicating that soil type plays a key role in determining the severity of the impact. Furthermore, the inclusion of three pollution levels enables the development of a model integrating biological and chemical changes according to the “polymer–environment-dose” framework, which is essential for realistic ecological assessment.
2. Materials and Methods
2.1. Soil Properties
The incubation experiment was conducted using soil samples collected from topsoil of four uncultivated soil varieties and subsequently contaminated with microplastics under controlled laboratory conditions. The soils included moderately eroded Calcic Chernozem (Trastenik, Ruse district), Haplic Vertisol (Bozhurishte, Sofia district), Vertic Chromic Luvisol (Suhodol, Sofia district), and Fluvisol (Negovan, Sofia district) (Table 1).
Table 1.
Basic soil properties of the sampled soil layers. SOC—soil organic carbon. Db—soil bulk density. Ds—soil particle density. Wh—hygroscopic water content at 75% relative air humidity.
Calcic Chernozems are widespread in the northern part of the Danube Plain and are typically formed on loess parent material. Carbonates are present throughout the soil profile. These soils are characterized by a domination of silt fraction (68%) (Table 1), composed mainly from plagioclase and muscovite minerals [25].
Vertisols are heavy clay soils with high colloidal content, dominated by montmorillonitic clay minerals. The content of clay in the topsoil in the soil in Bozhurishte is 60%, which is reflected in the highest hygroscopic water content (Wh = 11.5% w/w) among the studied soils.
Vertic Chromic Luvisols are distinguished by a pronounced textural differentiation, with higher clay accumulation in the illuvial horizon. The studied soil in Suhodol is situated on a slope subjected to erosion which explains the increase in clay content on a shallower depth. At depth 35–45 cm the clay content reaches 61%.
Fluvisols form on river terraces from alluvial deposits. They are genetically young soils with domination of coarse particles and primary minerals (quartz, potassium feldspars, etc.). The surface horizon of the Fluvisol in Negovan is characterized by the highest content of sand and lowest content of clay which is reflected in the lowest Wh (1.5% w/w) (Table 1). The Fluvisols are characterized by a high aeration porosity and low water retention properties.
2.2. Experimental Setup
For the experiment, the excavated soil material was gently broken and mixed by hand, removing surface feeding roots, plant residues, stones and other impurities. Three types of microplastics—polypropylene (PP–kitchen plates), pre-production (primary MPs) low-density polyethylene (PE–pellets), polyethylene terephthalate (PET–bottles)—were added to the tested soils. Plastics from commercial origin (PP and PET) were washed and grounded (using Haitian Mars 2 MA1600, Haitian International Holdings Ltd., Ningbo, China), and sieved to a particle size of less than 5 mm. Particles size distribution was determined by sieve analysis and is presented in Table 2. PP and PET particles were flat, irregular fragments, whereas virgin PE pellets were granules with a diameter of 3 mm (Appendix A Figure A1). The crystallinity of the used microplastics varied significantly depending on their polymer structure. Low-density polyethylene is characterized by a highly branched chain, which restricts close packing and results in lower crystallinity values ranging from 30% to 50%. Polyethylene Terephthalate (PET), typically used in bottles and films, exhibits a crystallinity of 30% to 40% that is mechanically induced through strain-induced crystallization, yielding a clear, high-strength structure. Conversely, Isotactic Polypropylene (iPP) displays the highest crystallinity range of 50% to 70%; this is due to its highly regular structure, where all methyl groups are positioned on the same side of the chain, facilitating tight helical packing.
Table 2.
Size distribution (%) by weight of grounded polymer products (secondary MP). The primary MPs (PE) are almost round balls with a diameter of 3 mm (Figure A1).
The microplastics were added in three concentrations—0.5, 2.0 and 5% (w/w) (Table 3). The lowest concentration (0.5%) reflects moderate contamination conditions reported in intensively managed agricultural soils, where plastic mulching and sludge application contribute to chronic microplastic inputs. The intermediate level (2.0%) was designed to simulate highly impacted soils subjected to long-term accumulation or localized plastic residues. The highest concentration (5%) represents an extreme [26], yet experimentally informative, scenario intended to assess threshold responses and to elucidate potential nonlinear effects on soil physicochemical properties and microbial activity. Together, this gradient enables the evaluation of dose-dependent responses and the identification of potential tipping points in soil microbial processes and ecosystem functioning.
Table 3.
Experimental design.
Fresh soil with an equivalent weight of 250 g of dry matter was placed in glass containers with a capacity of 400 mL. Before being placed in the thermostat, the weight of all containers was recorded. To maintain soil moisture at 60% of the field capacity, distilled water equal to evaporated water was added each week. The soil was homogenized by stirring with metal spatulas and the containers were put back in the thermostat. The incubation was carried out in a thermostat “ST 5 C SMART–szafa termostatyczna”, at T 20 °C, without light. Each treatment was performed in triplicate.
2.3. Laboratory Analysis
2.3.1. Microbiological Analysis
For a period of six months, the dynamics of the main taxonomic and physiological groups of soil microorganisms (ammonifying bacteria, cellulose-degrading microorganisms, bacteria utilizing mineral nitrogen, actinomycetes and microscopic fungi), CO2 production, biomass C and enzyme activity were monitored and analyzed.
Samples were taken for microbiological analysis in the second, fourth and sixth months. The amount of the main groups of soil microorganisms was determined by the ten-fold dilution method, by inoculating soil suspensions on selective agarized nutrient media [27]. The following physiological and taxonomic groups of soil microorganisms were determined: ammonifying bacteria on meat-peptone agar (MPA) after three-day incubation; microscopic fungi on acidified Čapek medium after seven-day incubation; actinomycetes and bacteria that absorb mineral nitrogen–starch–ammonia agar (SAA) after seven days of incubation; and cellulose-decomposing microorganisms on Hutchinson’s medium after fourteen days of incubation.
2.3.2. Enzyme Activity and Agrochemical Analysis
The activity of the peroxidase (PO) and polyphenol oxidase (PPO) was assessed with the method of Galstian [28] and expressed in relative units-mg purpurogalin (PPG) obtained per g absolutely dry soil for 30 min (mg PPG g−1 30 min−1). The total organic carbon (SOC, %) content was quantified using the modified Tjurin method, which involves wet digestion with dichromate and sulfuric acid at 125 °C for 45 min [29]. For the analysis of soil pH and electrical conductivity (EC), a 1:2.5 water suspension was prepared and measured with a combined pH-EC meter. Plant-available forms of phosphorus and potassium were extracted simultaneously with the acetate-lactate method. The concentration of potassium in the extract was determined directly by flame photometry, while phosphorus was measured spectrophotometrically following a color reaction [30].
2.3.3. Microbial Biomass Carbon (Cmic) and Basal Soil Respiration (BR)
The determination of microbial biomass carbon (Cmic), basal respiration (BR), and substrate-induced respiration (SIR) was based on previously described procedures, following the methods [31,32].
In this incubation experiment, no conventional pre-incubation was performed because the soil samples were taken from pots maintained under controlled moisture conditions. Prior to analysis, soil samples placed in vials were manually cleaned of visible biogenic organic residues. Glass vials with a volume of approximately 9 mL were used. After air sampling, the exact air volume in each vial was determined by weighing the amount of distilled water required to fill the vial (with the soil sample inside) to the level of the cap. Approximately 1 g of soil was placed in each vial. The exact mass of fresh soil was recorded and subsequently converted to dry soil mass based on the measured soil moisture content.
The vials containing soil were placed in an incubator for 2 h at 22 °C. Before adding the glucose solution or distilled water, the vials were opened for ventilation to remove excess CO2 accumulated during soil handling.
For the determination of SIR, 0.1 mL of glucose solution was added to each vial to obtain a final glucose concentration of 10 mg g−1 soil. Distilled water of the same volume was added to separate vials to determine basal respiration (BR). The vials were then tightly sealed and incubated in an incubator. The incubation time was 2–4 h for SIR determination and 24 h for BR determination. The exact sealing and measurement times for each vial were recorded in minutes. All measurements were performed in three replicates.
To determine the background concentration of carbon dioxide in the air, empty vials containing ambient air were sealed simultaneously with the experimental vials (separately for SIR and BR measurements) in four replicates.
Air samples (1 mL) were taken from each vial using a gas syringe. The carbon dioxide concentration (ppm) was measured using a Shimadzu Nexis GC-2030 gas chromatograph (Shimadzu Corporation, Kyoto, Japan). A thermal conductivity detector (TCD), SH-Q-BOND PLOT column (100% divinylbenzene, 30 m × 0.53 mm × 20 µm), and hydrogen as the carrier gas were used.
SIR and BR were calculated using the following equation [33]:
where SIR represents the rate of substrate-induced respiration (or BR, the rate of basal respiration), expressed as μl CO2 g−1 h−1;
%S and %A are the CO2 concentrations in the air inside the vial with and without soil (vol%);
Vv is the air volume inside the vial (ml);
mds is the dry soil mass (g);
Vc is the air volume injected into the gas chromatograph (ml);
ΔT is the incubation time (min).
Microbial biomass carbon was calculated according to the equation proposed by Jenkinson and Brookes [33]:
where Cmic is microbial biomass carbon (µg C g−1 soil) and SIR is substrate-induced respiration (µl CO2 g−1 h−1).
The ratio between basal respiration and substrate-induced respiration (BR/SIR) was also calculated as an additional indicator of microbial activity.
The metabolic quotient (qCO2), defined as the ratio between basal respiration and microbial biomass carbon, was used as an indicator of microbial metabolic efficiency:
where qCO2 is expressed as µg CO2-C mg−1 Cmic h−1.
2.4. Statistical Analysis
We employed an impact index based on standardized variables to provide an integrated assessment of the effects of microplastics on soil health in this incubation experiment. Because the study included a wide range of agrochemical, microbiological, and biochemical indicators measured in different units and numerical ranges, standardization was necessary to transform all variables into comparable dimensionless values. The aggregation of these standardized parameters into an impact index enabled quantification of the overall magnitude of soil disturbance caused by microplastics, overcoming the limitations of interpreting individual indicators separately, which may produce inconsistent or multidirectional responses. This approach facilitated a holistic evaluation of soil ecosystem responses and allowed assessment of the cumulative effects of treatments on soil quality and functioning.
To standardize the impact of microplastics across soil types during the incubation experiment, percentage change relative to the control was calculated for each parameter, expressed as deviation from the respective untreated soil [34,35].
Subsequently, a cumulative (summarized) impact index (II) was calculated to integrate the overall effect of the treatments across the measured indicators.
II = ∑ ∣%Δ_i∣
A three-factor analysis of variance (ANOVA) was applied to evaluate the effects of soil type and treatment. Principal Component Analysis (PCA) and Spearman rank correlation analysis were performed to identify relationships and interactions among the examined variables. Spearman rank correlation coefficients were calculated for each pair of variables, and statistical significance was assessed based on corresponding p-values. All statistical analyses were conducted using SPSS Statistics 27.
3. Results
3.1. Impact of Microplastics on Chemical and Physicochemical Properties in Soil
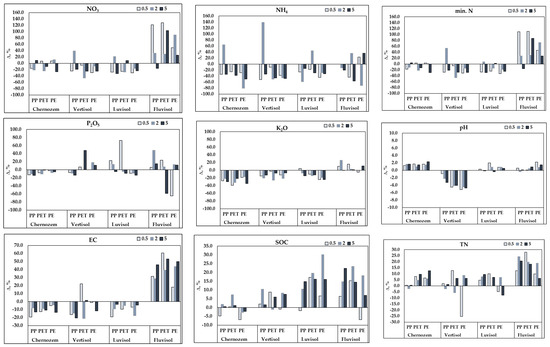
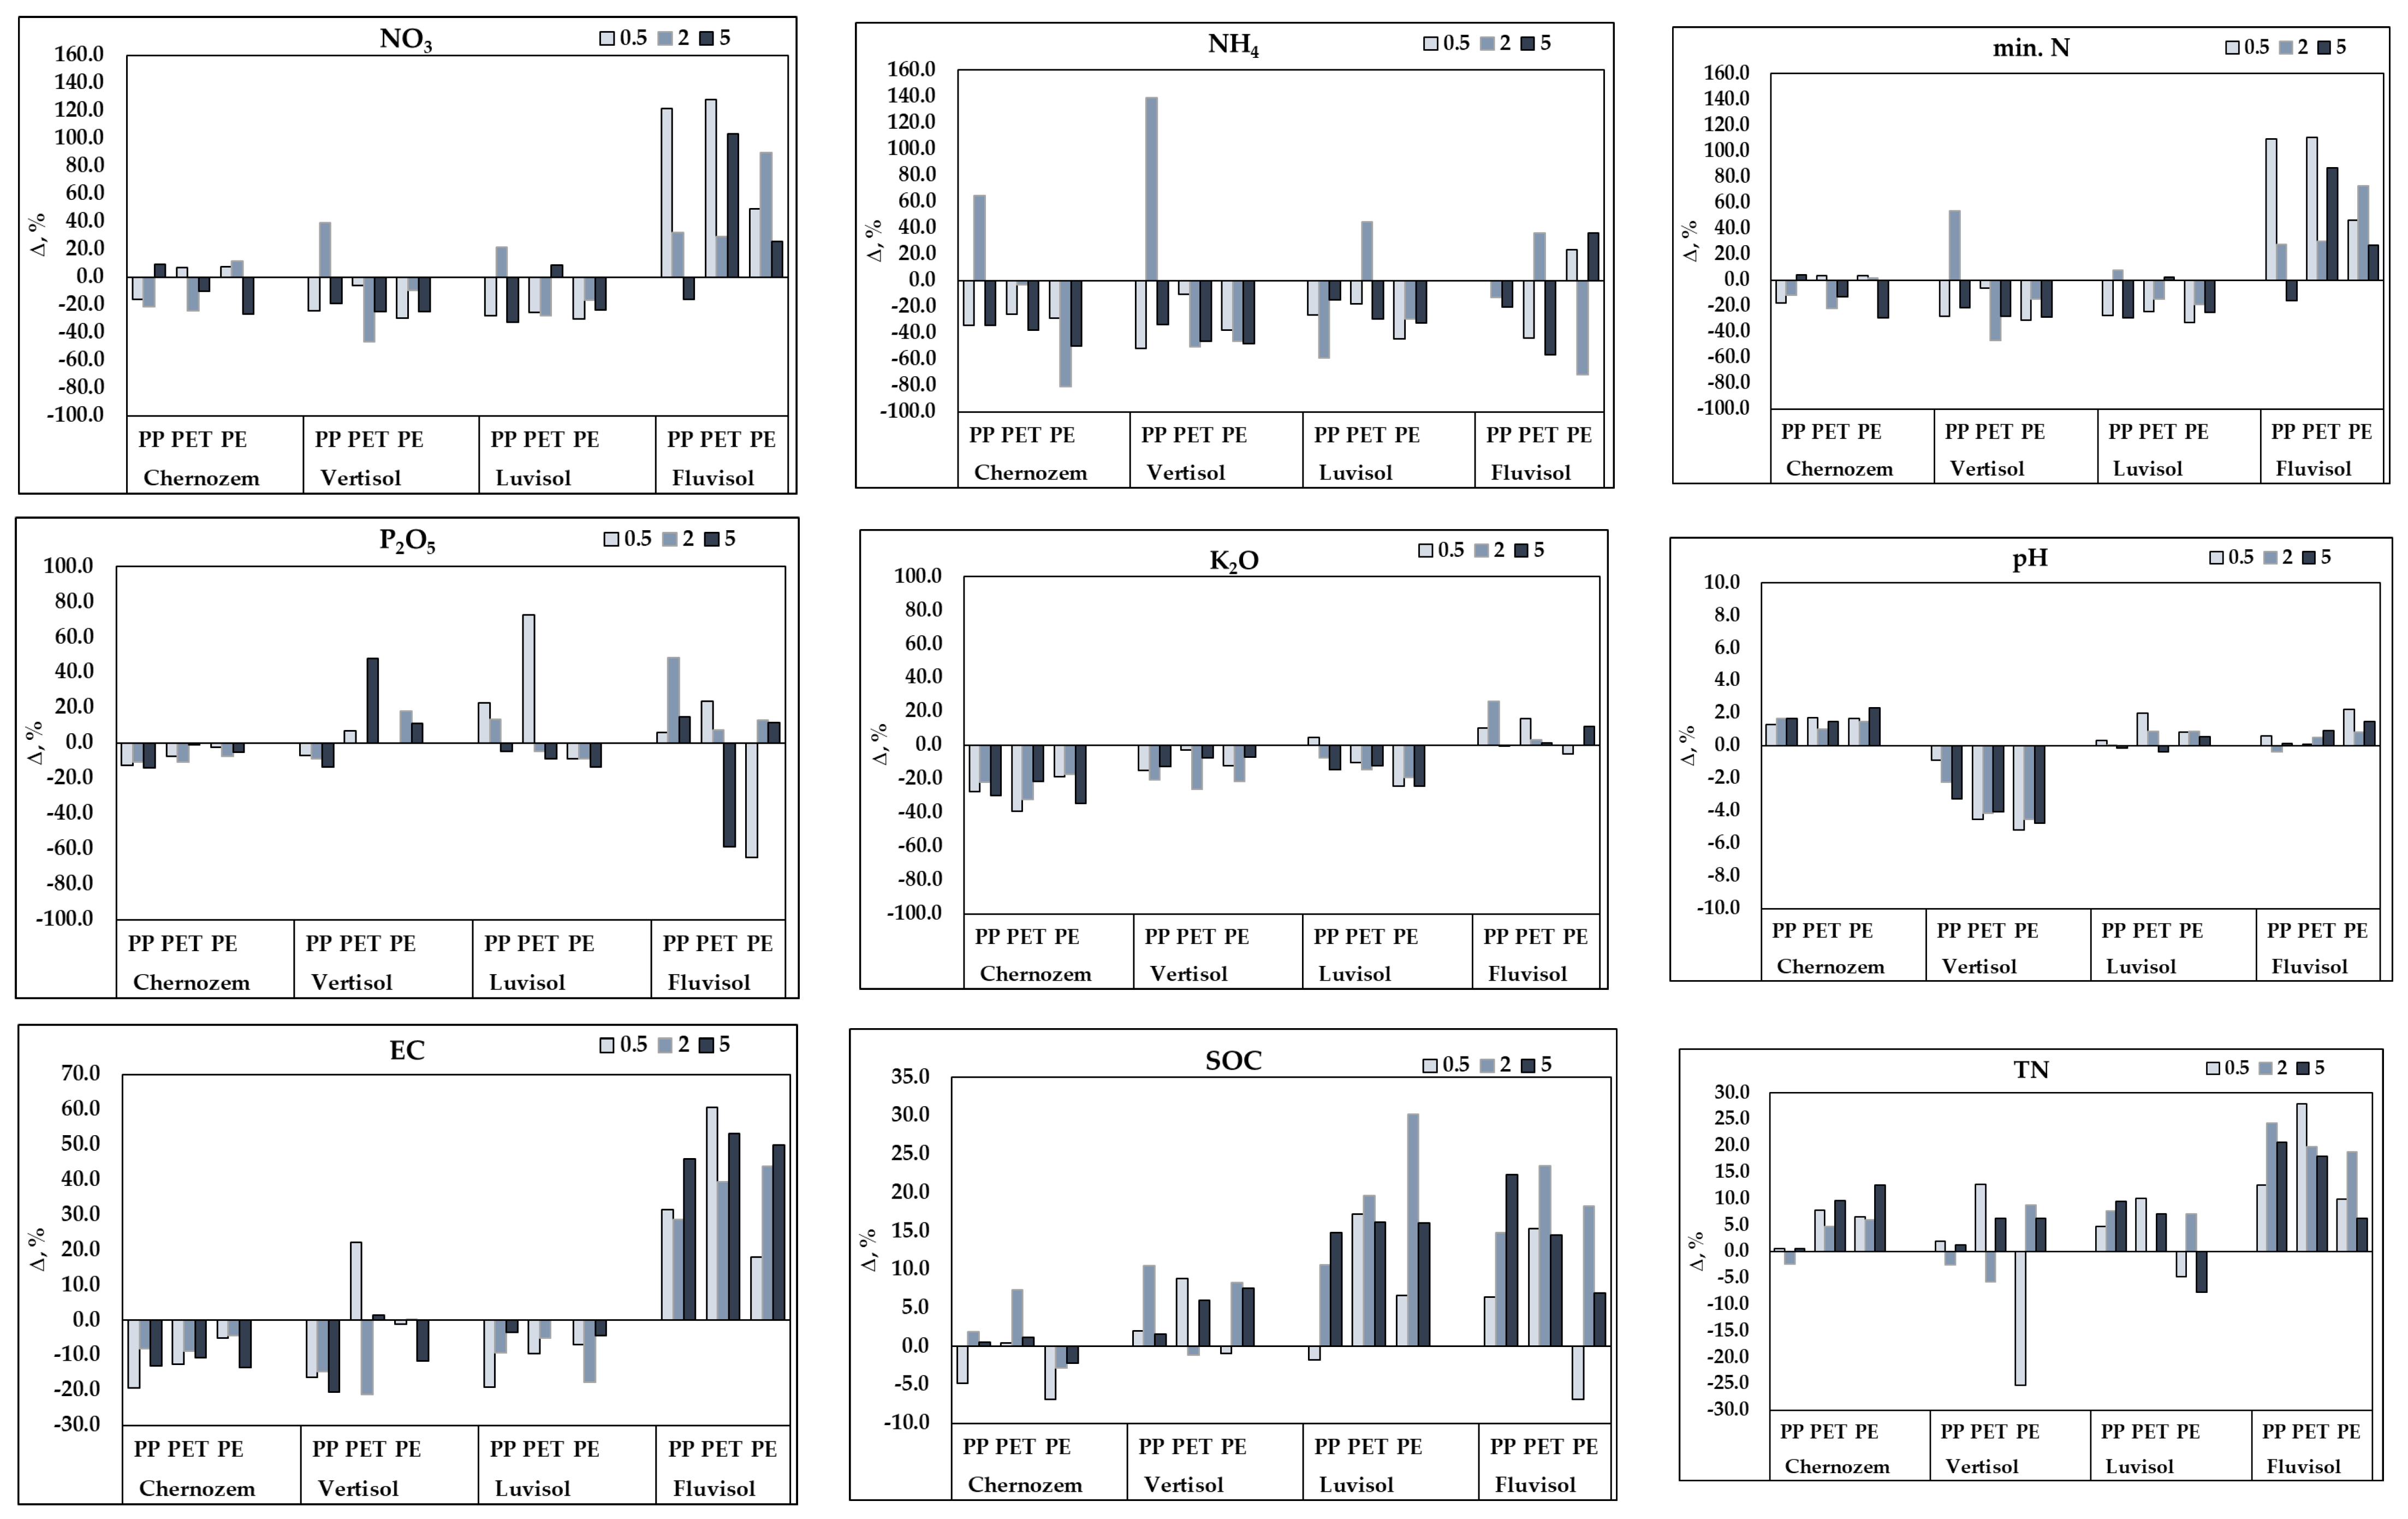
The impact of microplastics contamination was assessed by relating each value to the control according to Equation 4. In Chernozem after 180 days of incubation under controlled conditions, a decrease in the amount of N-NO3 by up to 26.7% as well as mineral nitrogen by up to 29.3%, available forms of phosphorus and potassium (−1.1–−13.8%), EC (−4.5%–−19.4%) was recorded in contaminated variants (Figure 1). In this type of soil, which has a slightly alkaline reaction, an increase in pH was recorded under contamination with all types of MPs. pH decreased only in Vertisol (with 0.88–5.18%) comparing with uncontaminated soil. It slightly increased in Luvisol (with 1.99%) and Fluvisol (with 2.42%). Three-way ANOVA results pointed to a significant impact of soil type. Differences in mineral nitrogen, available forms of potassium, phosphorus, EC, and pH between treatments were not statistically significant (Table A1); however, the influence of treatments on SOC and TN was significant. In Chernozem, Vertisol and Luvisol, the availability of phosphorus and potassium decreased upon incubation in the presence of microplastics. Their availability is changing under changing conditions and there was strong and moderate negative correlation with Cmic (r = −0.81), SOC (r = −0.62), BR (r = −0.64). SOC content and TN were measured after 180 days of incubation and they slightly increased in most treatments and in all four soil types. In Chernozem and Vertisol the change in SOC was between −4–+10%. The strongest impact on organic carbon was measured in Fluvisol (by up to 22–23%). The total organic carbon content at this point was measured using the wet combustion method (sulfuric acid, potassium dichromate), that could not digest MPs. This change could be explained with increasing Cmic and eventually microbial necromass in all type of soils specially in Luvisol and Fluvisol, because SOC correlated positively with Cmic (r = +0.74) and ammonifying bacteria (r = +0.30) and BR (r = +0.33), and TN correlated positively with SOC (r = +0.37), PO (r = +0.64), PPO (r = +0.58). These two types of soils exhibited the strongest increase in SOC, and also showed the highest increase in Cmic.
Figure 1.
Impact of MPs contamination on soil chemical and physicochemical properties-ΔN (N-NO3, N-NH4), ΔEC, ΔpH, ΔTN, ΔSOC, ΔC/N. The figures represent the standardized differences %Δ to the control for each soil type.
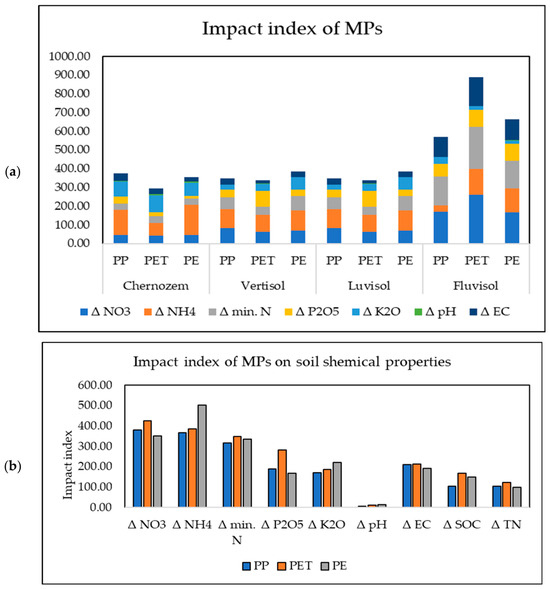
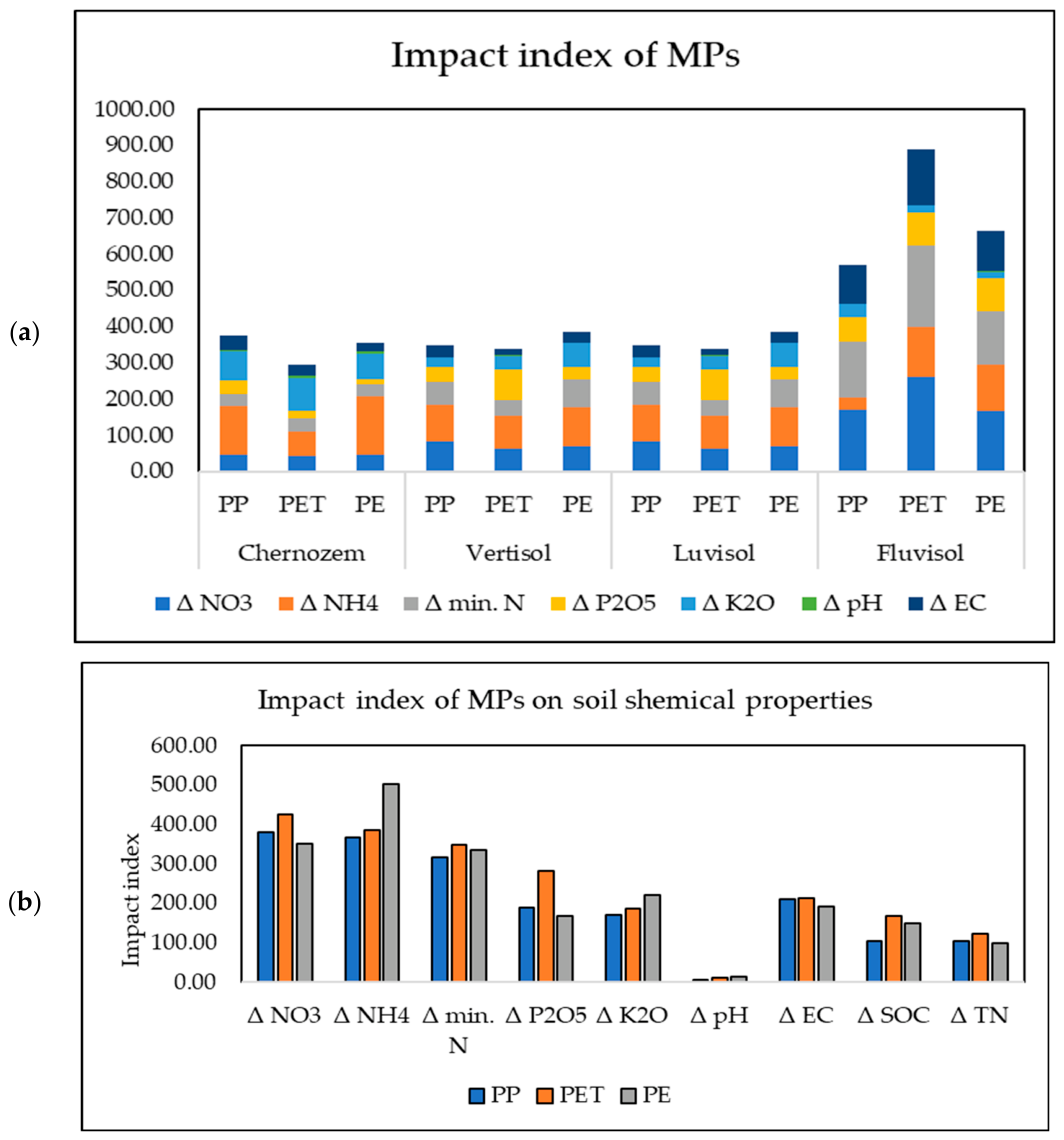
Fluvisol exhibited the most significant modification in its chemical indicators. Overall, PET contamination had the highest impact, with the cumulative effect on all investigated agrochemical parameters following the order: PET > PE > PP (Figure 2). Based on the sum of the standardized impacts, the strongest influence of MPs was observed on the ammonium and nitrate forms, while the lowest effect was on pH.
Figure 2.
Cumulative Impact index: (a) sum of the absolute values of impacts of MPs contamination by type (ΔNO3, ΔNH4, Δ min. N, ΔP2O5, ΔK2O, ΔSOC, ΔTN); (b) sum of the absolute values of impacts on soil parameters under the influence of MPs.
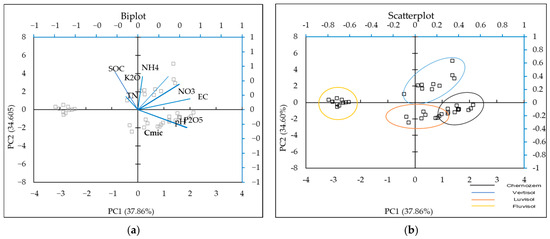
To understand the interdependencies of the measured parameters, a principal component analysis (PCA) was conducted on the changes induced by microplastic incubation (Figure 3, Table 4). The analysis revealed two main components. Component 1 (37.86%) describes a pattern where an increase in nitrate, phosphorus, electrical conductivity, and pH coincides with a decrease in total nitrogen and soil organic carbon. The biplot shows the closest association between P2O5 and pH. EC is most strongly linked to N-NO3 concentration. The vectors for SOC and TN are closely positioned, indicating an interrelated change, their acute angle relative to the ammonium (N-NH4) vector points to a positive interaction. In contrast, Component 2 is defined by a concurrent increase in SOC, potassium, and ammonium (N-NH4).
Figure 3.
Biplot (a) and scatterplot (b) of the principal component analysis carried out on a dataset including: soil mineral N (N-NO3, N-NH4) (mg kg−1), available P2O5 (mg 100g−1), available K2O (mg 100g−1), EC (µS cm−1), pH, SOC (%), Cmic (mg kg−1), TN (%).
Table 4.
PCA-Variable loadings of the first two components of principal components analysis. Soil mineral N (N-NO3, N-NH4) (mg kg−1), available P2O5 (mg 100g−1), available K2O (mg 100g−1), EC (µS cm−1), pH, SOC (%), Cmic (mg kg−1), TN (%).
3.2. Changes in Microbial Community Composition Under Microplastics Contamination of Soil
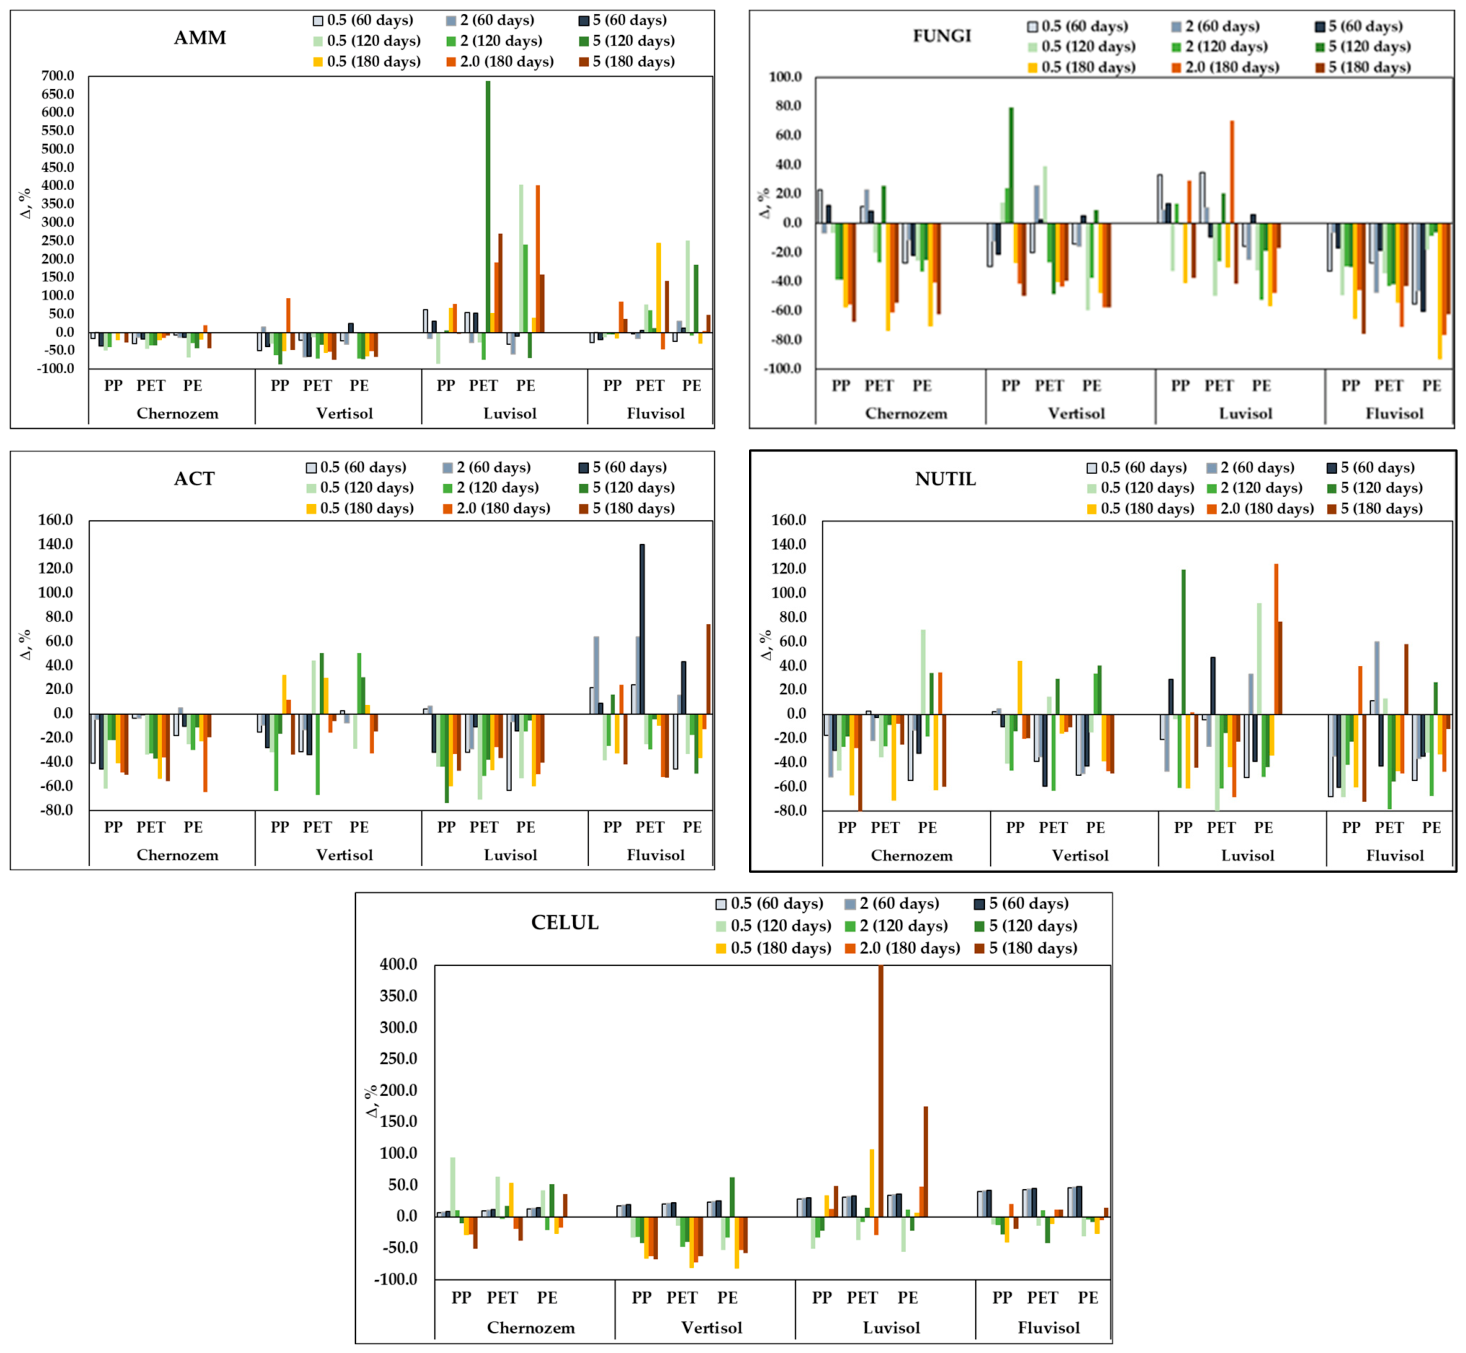
Microbial communities are widely recognized as sensitive indicators of soil quality [36] and the abundance of several key microbial groups was monitored throughout the incubation period. The results showed a consistent decline in all studied microbial groups across the four investigated soil types.
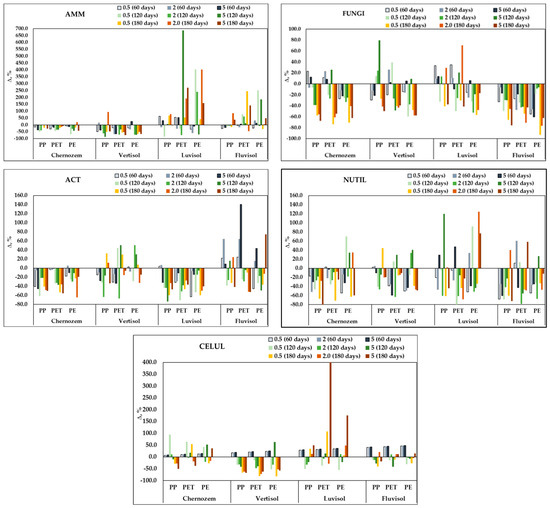
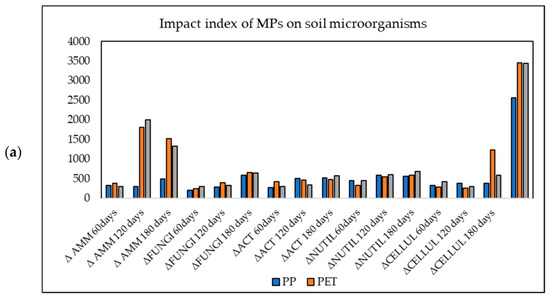
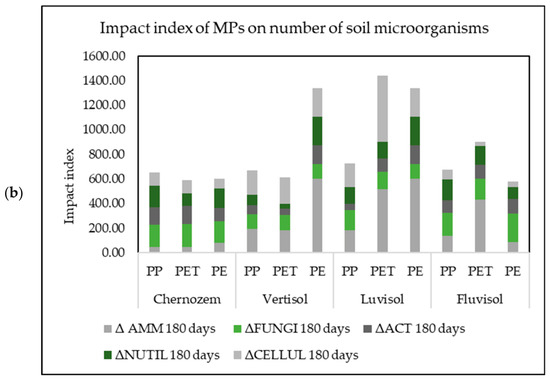
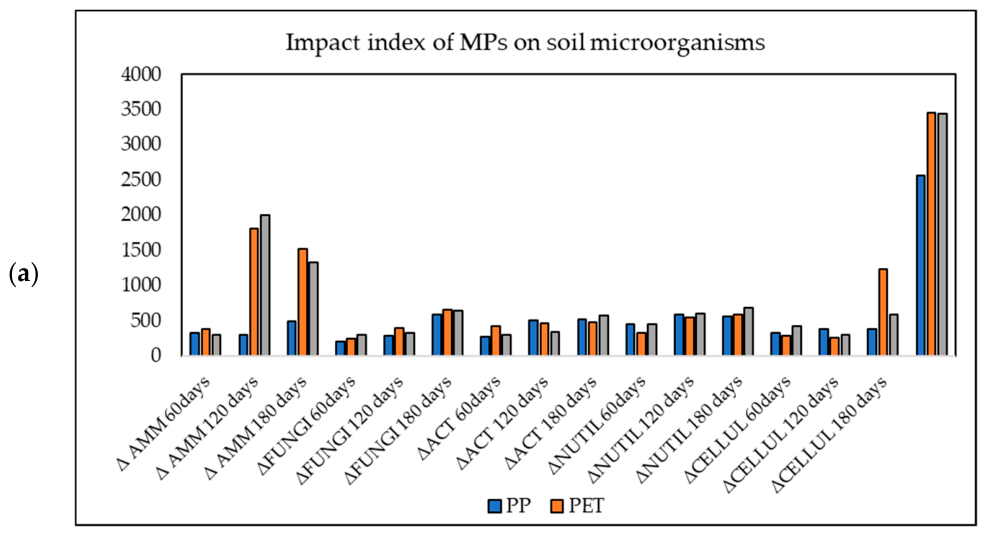
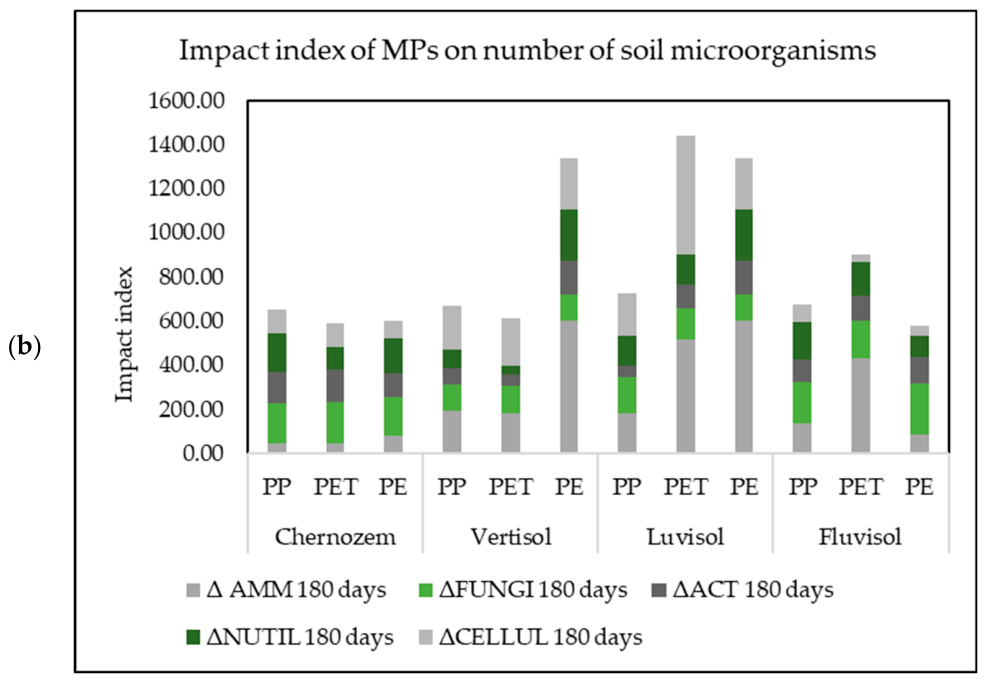
Figure 4 illustrates the dynamic response of soil microbial communities to microplastic (MP) contamination, characterized by an initial suppression followed by a time-dependent recovery in specific bacterial groups. A dominant trend across all soil types was the consistent decline of microscopic fungi throughout the incubation period. In contrast, ammonifying bacteria and actinomycetes exhibited resilience. After an initial decrease (up to 60%) during the first 60 days, their abundance rebounded by day 180, particularly in Luvisol and Fluvisol (increasing up to 4-fold). Similarly, cellulose-degrading microorganisms showed divergent patterns by day 180, shifting from suppression in Chernozem and Vertisol to stimulation in other soil types. Overall, the impact of MPs intensified over time, with PE and PET exerting the strongest suppressive effects compared to PP (Figure 5, Table A1).
Figure 4.
Impact of MPs contamination on the abundance of soil ammonifying bacteria ΔAMM, nitrogen-utilizing bacteria ΔNUTIL, actinomycetes ΔACT, microscopic fungi ΔFUNGI, cellulose-decomposing microorganisms ΔCELLUL on the 60th, 120th and 180th day of incubation. The figures represent the standardized differences (%Δ) to the control for each soil type.
Figure 5.
Cumulative Impact index: (a) sum of the absolute values of impacts of MPs contamination by type of plastic on the abundance of soil microorganisms (ΔAMM, ΔACT, ΔFUNGI, ΔNUTIL, ΔCELLUL); (b) sum of the absolute values of impacts on soil communities under the influence of MPs on the 60th, 120th, 180th days of incubation.
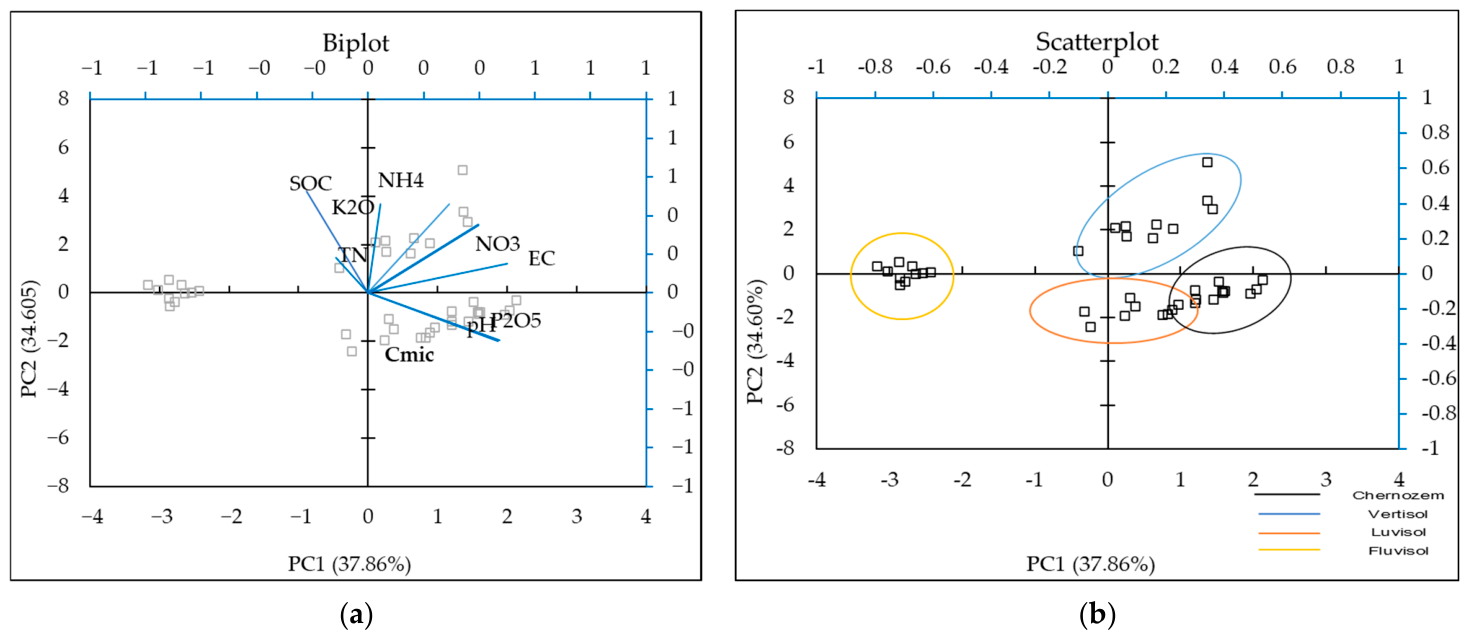
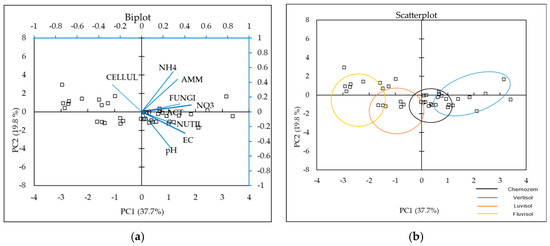
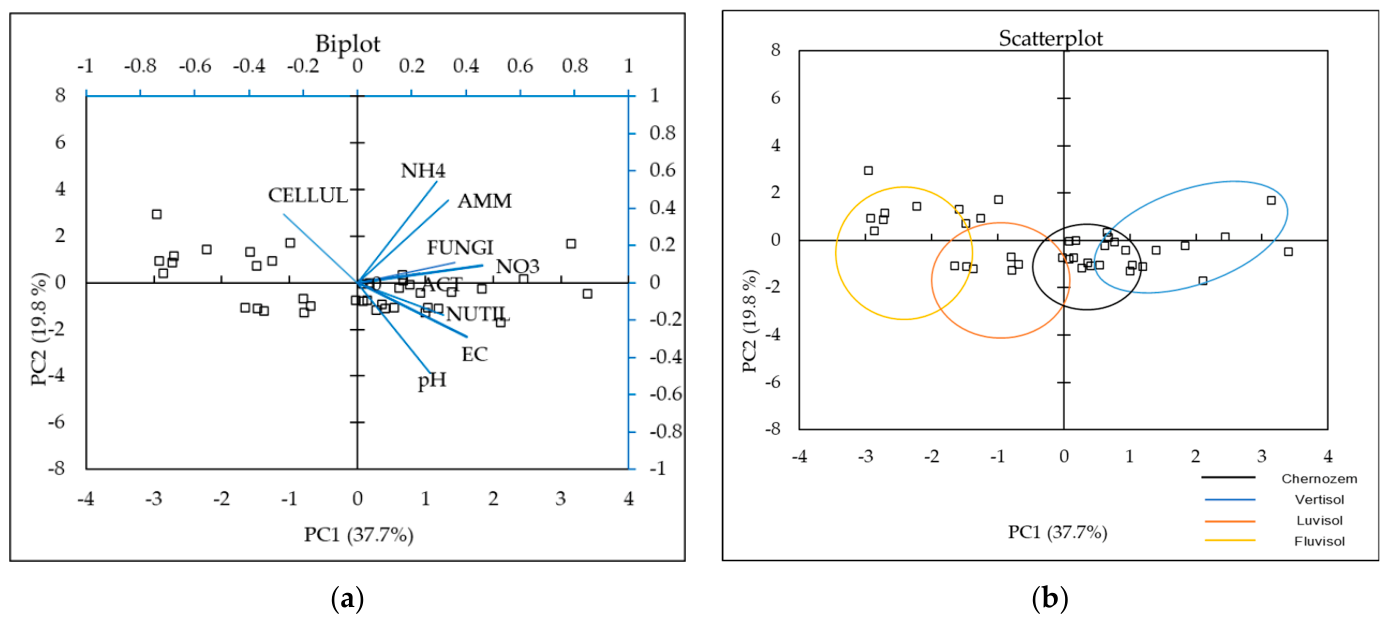
Principal component analysis (PCA) revealed distinct patterns among the variables (Figure 6, Table 5). Component 1 (37.72% of the data) is defined by positive loadings for AMM, ACT, FUNGI, NUTIL, N-NO3, N-NH4, pH, and EC, contrasted by a negative loading for cellulose decomposers (CELLUL). Component 2 shows positive loadings for CELLUL, AMM, and N-NH4, and negative loadings for pH and EC. The biplot illustrates these associations, as the vectors for actinomycetes (ACT) and fungi (FUNGI) are positioned closely to that of NO3, indicating a strong positive correlation. Similarly, the vector for mineral nitrogen-utilizing bacteria (NUTIL) is closely associated with those for EC and pH.
Figure 6.
Biplot (a) and scatterplot (b) of the principal component analysis carried out on a dataset including AMM (CFU × 106 g−1), nitrogen-utilizing bacteria NUTIL (CFU × 106 g−1), actinomycetes ACT (CFU × 106 g−1), microscopic fungi FUNGI (CFU × 106 g−1), cellulose-decomposing microorganisms CELLUL (CFU × 106 g−1) and N N-NO3 (mg kg−1), N-NH4 (mg kg−1), EC (µS cm−1), pH.
Table 5.
PCA-Variable loadings of the first two components of principal components analysis, including AMM (CFU × 106 g−1), nitrogen-utilizing bacteria NUTIL (CFU × 106 g−1), actinomycetes ACT (CFU × 106 g−1), microscopic fungi FUNGI (CFU × 106 g−1), cellulose-decomposing microorganisms CELLUL (CFU × 106 g−1) and N-NO3 (mg kg−1), N-NH4 (mg kg−1), EC (µS cm−1), pH.
3.3. Impact of Microplastics on Enzyme Activity, Basal Respiration and Microbial Biomass Carbon
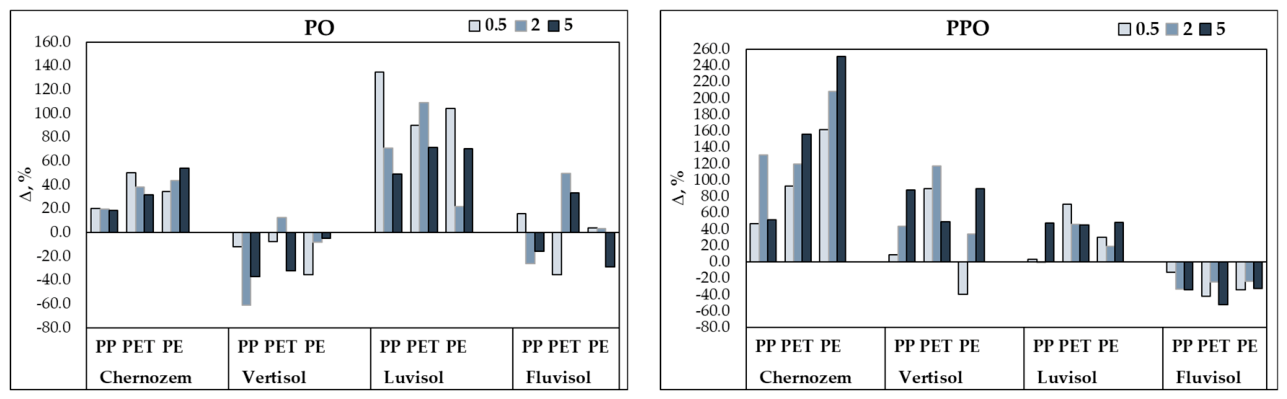
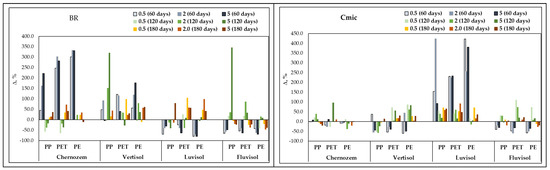
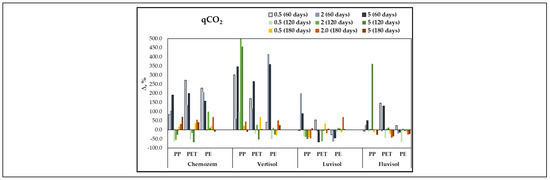
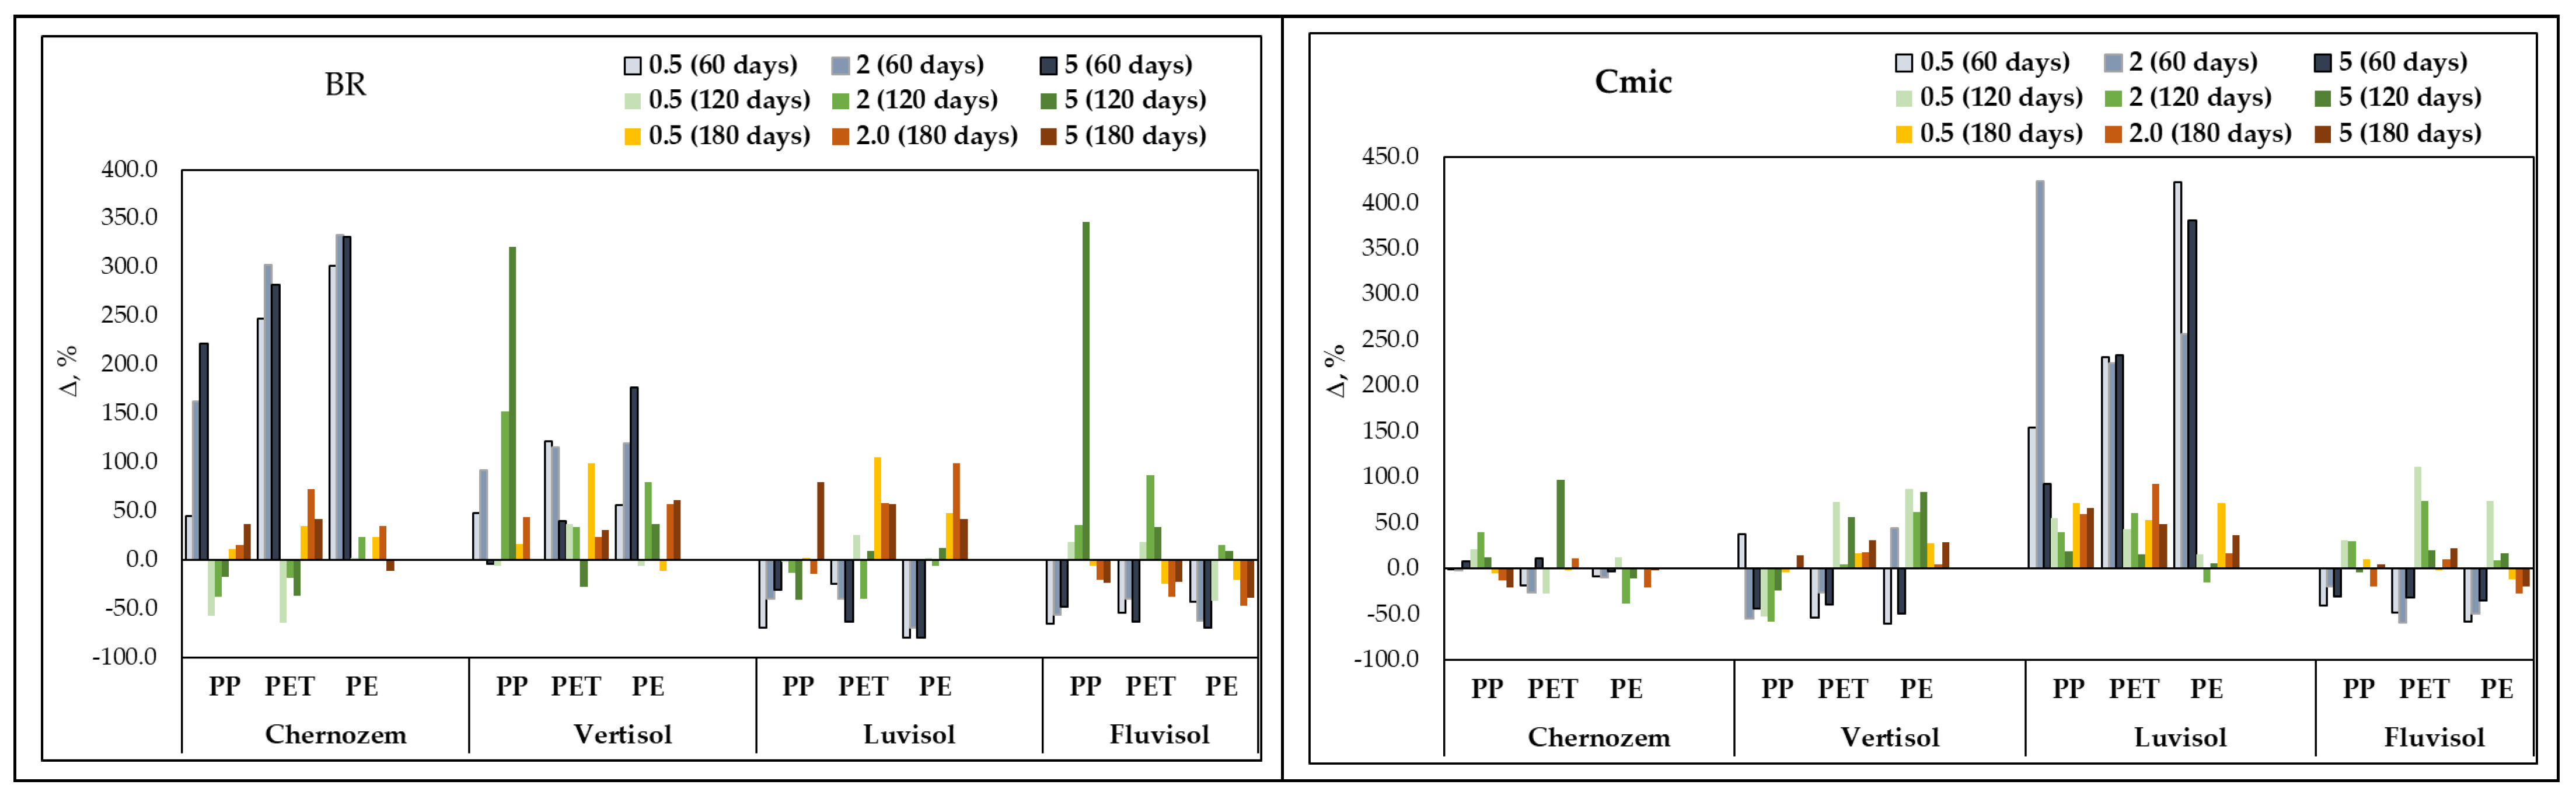
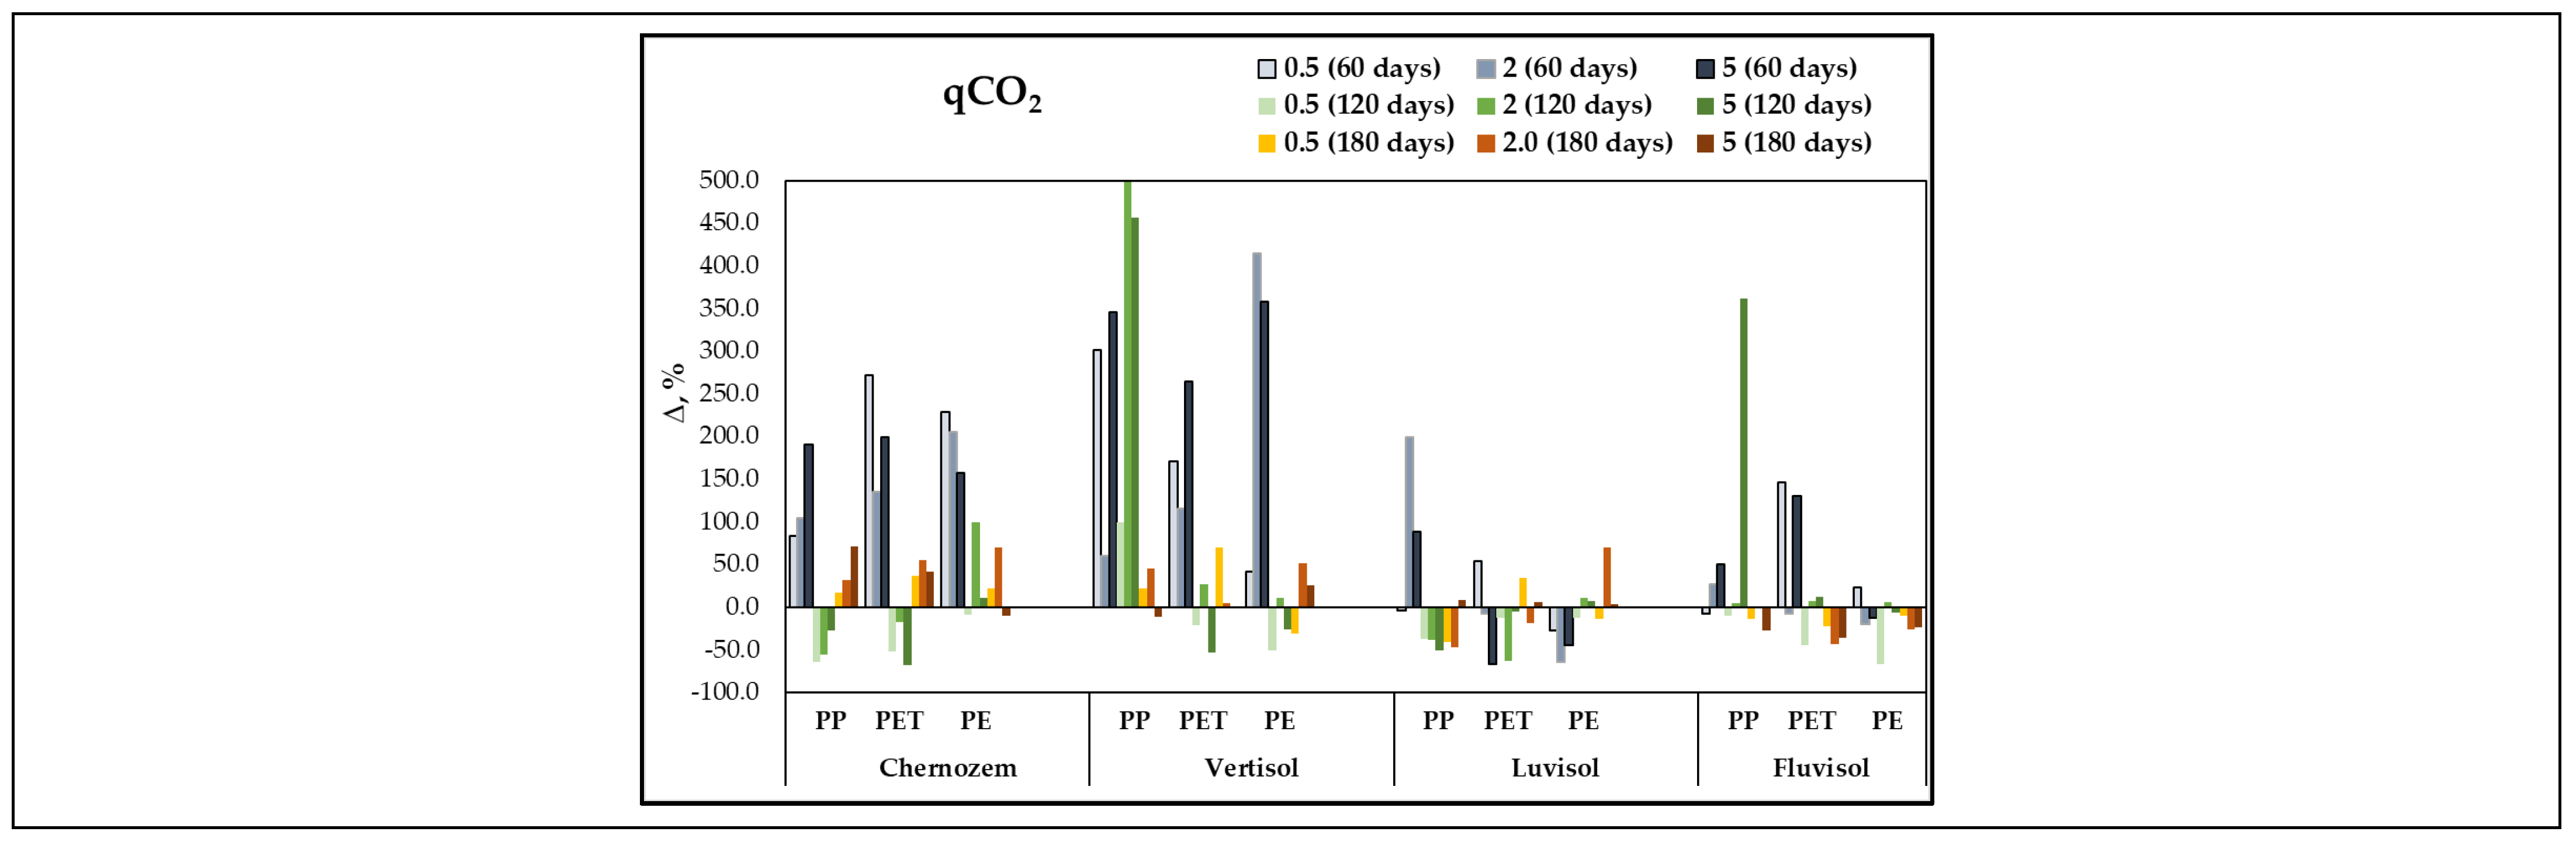
We studied the impact of soil contamination with microplastics on microbial biomass carbon, basal respiration, total carbon, as well as the enzymatic activity of two enzymes from the carbon cycle–peroxidase and polyphenol oxidase (Figure 7 and Figure 8). The activities of peroxidase (PO) and polyphenol oxidase (PPO) were determined on day 180 of incubation, while the remaining indicators were determined in three periods together with the determination of the number of microorganisms.
Figure 7.
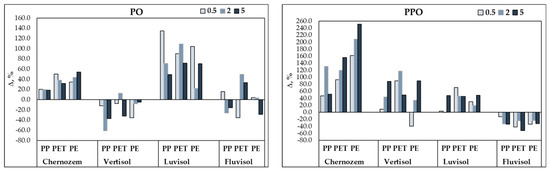
Impact of MPs contamination on soil peroxidase activity ΔPO (mg PPG g−1 soil 30 min−1), polyphenol oxidase ΔPPO (mg PPG g−1 soil 30 min−1).
Figure 8.
Impact of MPs contamination on soil microbial biomass carbon ΔCmic (μg C g−1), basal respiration ΔBR (μl CO2 g−1 h−1), metabolic quotient Δq CO2 (μg C MBC h−1). The figures represent the standardized differences (%Δ) to the control for each soil type.
Microplastic contamination induced varying responses in soil enzyme activities depending on the soil type. In Chernozem and Luvisol, peroxidase (PO) activity increased by 18–134% and polyphenol oxidase (PPO) activity by up to 2.5 times compared to the control. In Vertisol, peroxidase activity was consistently higher than the control (Figure 8). Conversely, in Fluvisol, although specific PET treatments (PET 2 and PET 5) stimulated peroxidase activity, the overall enzyme response was suppressed relative to the control. Regarding microbial respiration, MP pollution led to a distinct temporal dynamic: basal respiration (BR) and the metabolic quotient (qCO2) were highest on day 60, suppressed on day 120, and increased again by day 180. Elevated BR relative to Cmic and higher qCO2 values were recorded across most soil types after 120–180 days of incubation (Figure 9).
Figure 9.
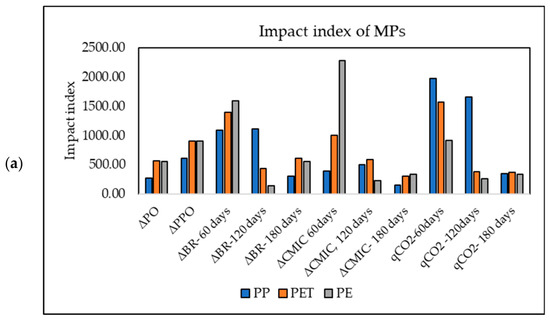
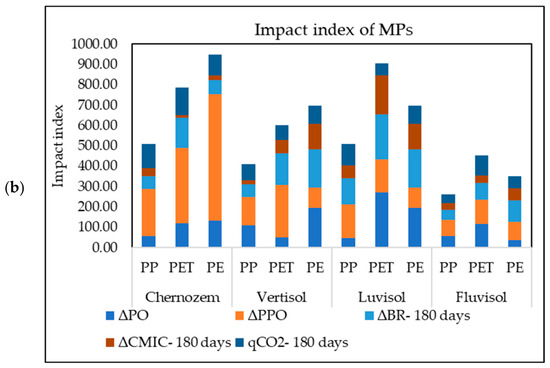
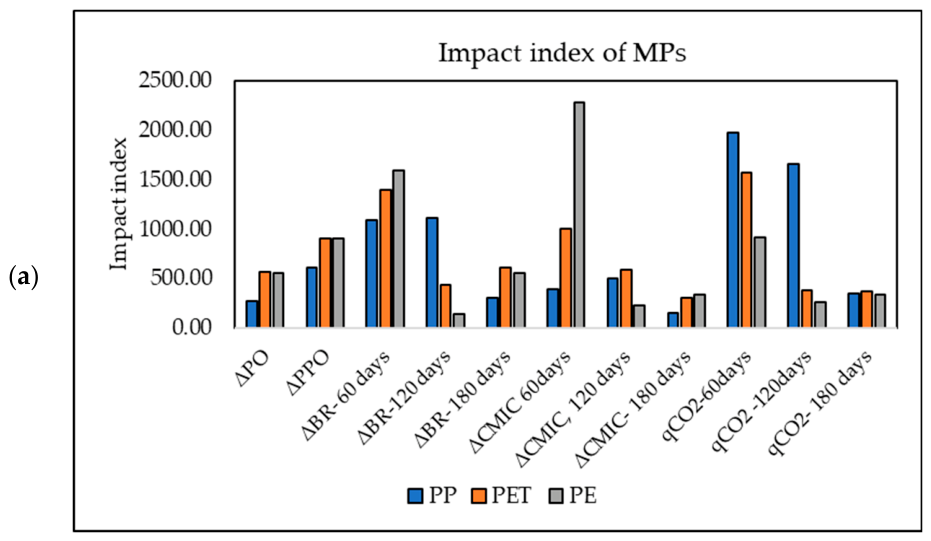
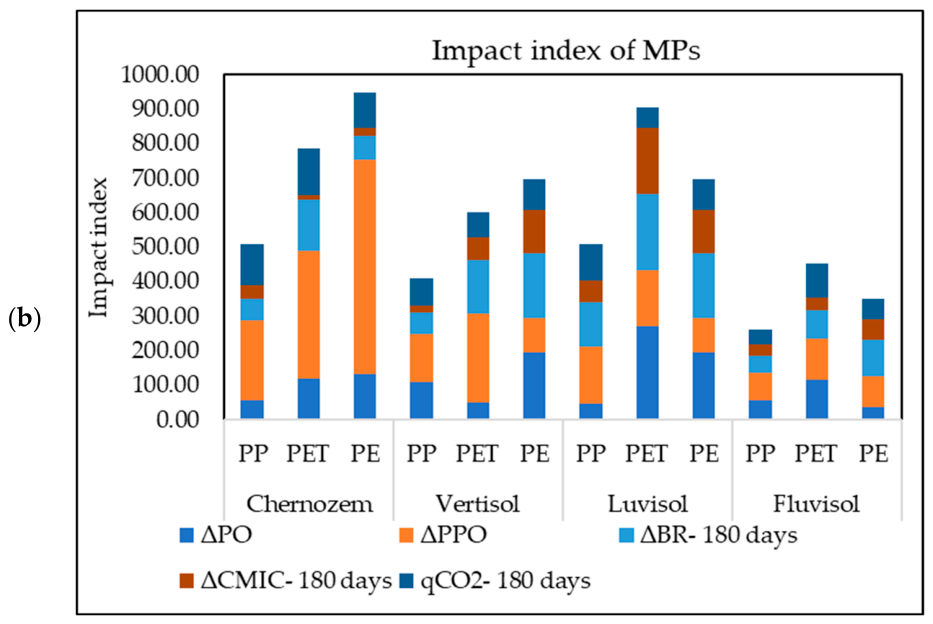
Cumulative Impact index: (a) sum of the absolute values of impacts of MPs contamination by polymer type and concentration (ΔPO, ΔPPO, ΔBR, ΔCmic, ΔqCO2); (b) sum of the absolute values of impacts on soil microbiological indices under the influence of MPs on the 60th, 120th, 180th days of incubation.
The effects of microplastics on metabolic parameters varied by polymer type, with polypropylene (PP) exerting the strongest influence, followed by PE and PET having a similar impact. Among the soil types, Chernozem demonstrated the highest sensitivity to pollution. Temporal dynamics were also evident: while the peak effect on basal respiration and microbial carbon occurred on day 60 (Figure 9), the statistical significance of the differences between treatments was most pronounced by day 180 (Table A1).
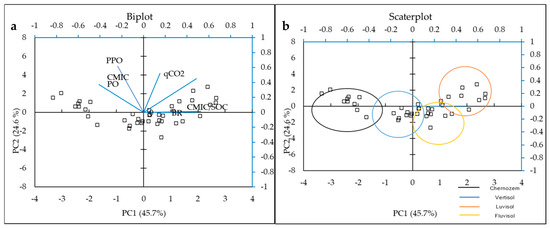
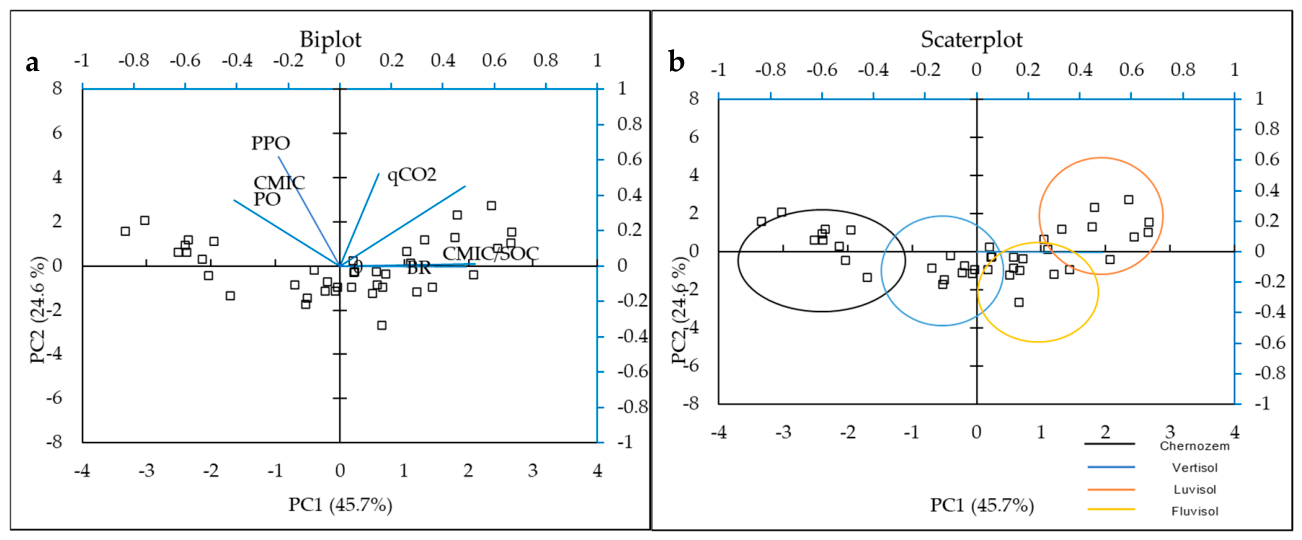
Principal Component Analysis (PCA) (Figure 10, Table 6) identified a primary axis of variation where basal respiration, microbial carbon, qCO2, and the microbial carbon-to-total carbon ratio all increased simultaneously within Component 1 (44.87%). This grouping could be interpreted as an accumulation of microbial biomass, likely driven by the colonization of microplastic surfaces. The elevated qCO2 is indicative of microbial stress and low carbon use efficiency [23,26]. The second component links an increase in qCO2 with higher respiration and polyphenol oxidase activity, suggesting a shift towards the degradation of more complex, recalcitrant organic matter.
Figure 10.
Biplot (a) and scatterplot (b) of the principal component analysis carried out on a dataset including peroxidase activity PO (mg PPG g−1 soil 30 min−1), polyphenol oxidase PPO (mg PPG g−1 soil 30 min−1), microbial biomass carbon Cmic (μg C g−1), basal respiration BR (μl CO2 g−1h−1), qCO2 (µg CO2-C µg−1 Cmic h−1), Cmic/SOC.
Table 6.
PCA-Variable loadings of the first two components of principal components analysis peroxidase activity PO (mg PPG g−1 soil 30 min−1), polyphenol oxidase PPO (mg PPG g−1 soil 30 min−1), microbial biomass carbon Cmic (μg C g−1), basal respiration BR (μl CO2 g−1h−1), qCO2 (µg CO2-C µg−1 Cmic h−1), Cmic/SOC.
Correlation analysis (Table 7) highlighted contrasting relationships between microbial groups and soil parameters. Cellulose-degrading microorganisms showed a medium positive correlation with BR and a weak positive correlation with microbial carbon, the Cmic/SOC ratio, and qCO2. Notably, their abundance was negatively correlated with the availability of key nutrients (N, P, K) and electrical conductivity (EC). In contrast, other microbial groups, including ammonifiers (AMM), fungi (FUNGI), and nitrogen-utilizers (NUTIL), were positively correlated with these same agrochemical indicators. These opposing trends suggest that a decline in readily available nutrients led to a reduction in AMM, FUNGI, and NUTIL populations. This, in turn, may have triggered a functional shift where the microbial community increasingly relied on decomposing more stable organic matter, a less efficient process that elevates both respiration and qCO2.
Table 7.
Spearman Rank Correlation matrix of peroxidase activity PO (mg PPG g−1 soil 30 min−1), polyphenol oxidase PPO (mg PPG g−1 soil 30 min−1), microbial biomass carbon Cmic (μg C g−1), basal respiration BR (μl CO2 g−1h−1), qCO2 (µg CO2-C µg−1 Cmic h−1), abundance of AMM (CFU × 106 g−1), nitrogen-utilizing bacteria NUTIL (CFU × 106 g−1), actinomycetes ACT (CFU × 106 g−1), microscopic fungi FUNGI (CFU × 106 g−1), cellulose-decomposing microorganisms CELLUL (CFU × 106 g−1), N-NO3 (mg kg−1), N-NH4 (mg kg−1), mineral N (mg kg−1), available P2O5 (mg 100g−1), available K2O (mg 100g−1), EC (µS cm−1), pH, SOC (%), TN (%), Cmic/SOC.
4. Discussion
In the present study, microplastics (MPs) exerted a suppressive effect on the abundance of the main microbial groups examined and induced nutrient deficiencies in the soil. The marked decrease in the availability of chemical elements compared to uncontaminated controls corresponds with the results of [37] and could be explained as a consequence of MP-induced alterations in microbial activity. Similarly, [38] reported reduced phosphatase, urease, and glucosidase activities, leading to decreased mineralization and a decline in the available forms of nitrogen and phosphorus. Suppression of genes associated with the nitrogen cycle under MP pollution has also been documented by [39,40].
Soil microbial communities are key drivers of carbon and nitrogen cycling. Consistent with our findings, several studies have reported an immediate increase in the soil C/N ratio under microplastic exposure [40]. An elevated C/N ratio may result in microbial nitrogen limitation, as observed by [20]. Bacteria secrete extracellular polymeric substances, primarily composed of proteins, polysaccharides, and humic substances. These extracellular organic compounds can adhere to the surface of microplastics, facilitating microbial colonization and potentially promoting polymer degradation [4,41,42]. Recent findings confirm that specific enzymes such as hydrolases, lipases, and proteases are actively involved in the breakdown of microplastic polymers [43,44]. Additionally, extracellular polymeric substances may serve as an initial catalyst for the bioaggregation of microplastics [4].
The increased abundance of ammonifying bacteria in the later stages (day 180) can be explained by the formation of a so-called “plastisphere”, where these microorganisms utilize the surface as a niche or carbon source [45,46]. The initial suppression observed on day 60 may be due to the toxicity of plastic additives, while the subsequent recovery indicates adaptation of the microbial community [47]. The observed increase in respiration intensity further suggests that the microbial community was under stress, characterized by low carbon efficiency and greater CO2 release per unit of microbial carbon. Additionally, the increase in Cmic observed in some treatments could be attributed to the colonization of MP surfaces, as suggested by other authors [48].
All these processes contribute to the release of organic components, which could explain the observed increase in SOC content after 180 days of incubation. The recorded higher SOC may also be related to dissolved organic matter originating from microplastics, containing labile and bioavailable additives such as plasticizers, colorants, and antioxidants released from the polymers themselves. Given the high carbon content of microplastics, this soluble carbon may represent an emerging source of soil organic carbon, potentially altering soil carbon pools and reshaping microbial communities [40].
Enzyme activities such as β-glucosidase, β-galactosidase, and β-glucosaminidase decreased in the study by [49], while soil respiration increased by 73.91% and the metabolic quotient (qCO2) increased by 239.82% [49]. In Chernozems and Vertisols, we also recorded an increase in respiration and qCO2, whereas in Luvisol and Fluvisol this effect was observed after 180 days. During the initial incubation stages, however, these parameters were suppressed. Increased activity of soil peroxidase and polyphenol oxidase is generally considered an indicator of intensive decomposition processes of persistent organic matter and changes in carbon cycling [50]. In Chernozems, the higher activity of both enzymes under MP contamination is probably related to the reduced availability of labile carbon forms, since MPs tend to adsorb soluble organic substances and promote microbial colonization on their surfaces [51]. This response may also reflect degradation of stable organic matter caused by a lack of labile substrates or detoxification processes. In addition, nitrogen deficiency may contribute to these effects.
Microplastics can also influence microbial communities indirectly altering soil pH [52]. In our experiment, no statistically significant overall change in pH was detected; however, soil-type-specific responses were observed. pH increased in Chernozem, Fluvisol, and Luvisol, while Vertisol showed a distinct trend, indicating strong soil-type dependency. Some studies report an increase in soil pH due to changes in aeration and porosity [53], whereas others describe a decrease in pH [49]. According to [54], microplastics may either increase or decrease soil pH depending on their concentration, shape, chemical composition, and duration of exposure.
The addition of 0.3–1% PVC to paddy soil reduced NH4-N and NO3-N levels by 16.1–55.9% and 23.9–28.9%, respectively, likely due to reduced activity of ammonia-oxidizing archaea, lower abundance of the amoA gene, and plasticizer leaching [55,56,57]. Results from a study on microplastic contamination at very high concentrations between 47 and 315 particles per 5 g soil [49] revealed significant changes in soil pH, ranging from 7.58 to 8.04, and in electrical conductivity (EC), ranging between 192 and 616 µS cm−1. Organic carbon content (0.68–0.59%) and total nitrogen (0.07–0.03%) decreased with increasing microplastic concentrations, while microbial biomass carbon (Cmic) declined by 43.75% [49]. These effects contrast with our findings regarding SOC and Cmic in Fluvisol and Luvisol under MP contamination. In our study, soil pH increased by up to 5.18%, although the increase was not statistically significant. A similar pattern was observed for EC, which decreased in Chernozem, Vertisol, and Luvisol but increased in Fluvisol.
Among the factors influencing soil responses to microplastic contamination, soil type appears to be the most decisive. MPs may affect the cycling of carbon compounds and other biogenic elements through their influence on the soil microbiome and enzyme activities. Studies report opposite or neutral effects depending on soil type as well as the type, shape, and size of the MPs applied [58]. The addition of microplastics differentially affected the chemical and microbiological properties of the examined soil types. This finding agrees with previous studies attributing such effects to changes in physical properties, particularly soil structure and mechanical composition, which subsequently influence chemical and microbiological processes [1,59]. Soil mechanical and physicochemical characteristics are major drivers of microbiological and chemical dynamics [60]. Furthermore, mineral composition also influences carbon cycling: quartz and montmorillonite enhance microbial carbon utilization, whereas kaolinite and goethite promote carbon preservation [59], thereby shaping microbial community structure.
In the present study, the analysis of variance revealed that microplastic concentration alone did not have a statistically significant effect. However, significant differences were observed when concentration interacted with microplastic type. Furthermore, the three-factor analysis showed that the interaction among all three factors was statistically significant for most parameters. The effects of different MP concentrations on soil parameters demonstrated a linear trend only in a few cases. Such relationships were observed in Chernozem for peroxidase and polyphenol oxidase activities and basal respiration, as well as in fungal abundance in Vertisol at 120 and 180 days. Nevertheless, responses were frequently divergent. For example, fungal abundance increased with rising concentrations of PP, whereas it decreased with increasing concentrations of PET. Some of the concentration effects were often nonlinear, likely due to cumulative influences on multiple soil indicators, resulting in more complex interactions. Previous research demonstrated that the impact on microbial communities intensifies with increasing MP concentrations, such as at 0.2% and 0.4% (w/w) PET and at 3% low-density PE [61]. A strong negative effect on aggregate formation and suppression of microbial activity has also been reported, becoming more pronounced with increasing polyethylene concentrations [62]. Additionally, high-density polyethylene contamination has been shown to increase pH proportionally within the 1–10% concentration range [63]. A similar trend was observed in our experiment for Chernozem under increasing concentrations of PP and PE. In contrast, increasing PP concentrations in Vertisol resulted in a proportional decrease in pH relative to the control (Figure 1).
The observed variations among polymers effects can be attributed to differences in their physicochemical properties. The stronger effect of PET compared to PP and PE is likely related to its chemical structure containing ester bonds, which are more susceptible to enzymatic hydrolysis and may therefore trigger a stronger microbial response, as suggested by [64,65]. It is important to note that the PET used in this experiment contained various dye additives, as shown in Figure A1, which may have also contributed to the observed effects. Conversely, the weaker effect of PP may be associated with its higher crystallinity (50–70%) and chemical inertness, which hinder microbial colonization compared to the more amorphous regions of PE and PET [66]. Furthermore, the irregular shape of PET and PP fragments provided a larger specific surface area for interaction with soil biota compared to the smooth, spherical PE pellets, thereby amplifying their environmental impact.
Overall, our findings confirm that microplastic contamination exerts heterogeneous and soil-dependent effects on soil microbial communities and nutrient dynamics. Microbiological indicators in Vertisol and Luvisol showed greater sensitivity to MP contamination, whereas the strongest effects on agrochemical indicators were observed in Fluvisol. The enzyme activities of PO and PPO, as well as qCO2, were most strongly affected in Chernozem. These results highlight the necessity of considering soil type and soil properties when assessing the long-term ecological consequences of microplastics in terrestrial ecosystems.
5. Conclusions
The effects of microplastic pollution on soil chemical and microbiological properties were highly dependent on both soil type and polymer composition. Polyethylene terephthalate (PET) and polyethylene (PE) exerted the most substantial influence, whereas polypropylene (PP) had a weaker effect. Differential impacts were observed across soil types: agrochemical indicators were most altered in Fluvisol; microbiological indicators in Vertisol and Luvisol; and oxidase activity, respiration, and microbial quotient in Chernozems. The contamination generally suppressed key microbial groups and disrupted nutrient cycling by reducing the availability of essential elements. Consequently, the microbial community exhibited significant physiological stress, as evidenced by elevated respiration, increased peroxidase and polyphenol oxidase activity, and a higher metabolic quotient (qCO2). These findings highlight the potential risks that microplastic contamination poses to soil biogeochemical cycling. However, it is important to acknowledge that this study was conducted under controlled laboratory conditions using relatively high MP concentrations. Therefore, further outdoor research is necessary to fully assess the long-term ecological implications at environmentally relevant concentrations.
Author Contributions
Conceptualization, J.P., M.K., L.T., H.V., G.K.; methodology, J.P., L.T., G.K., M.D. and M.K.; software G.K. and M.K.; formal analysis, G.K., J.P. and M.K.; investigation, J.P., L.T., H.V. and V.P.; data curation, G.K. and M.K.; writing—original draft preparation, G.K., L.T. and M.K.; writing—review and editing, G.K., L.T., M.K. and M.D.; visualization, G.K. and J.P.; funding acquisition, M.K. All authors have read and agreed to the published version of the manuscript.
Funding
This research was funded by the Bulgarian National Science Fund under grant agreement KΠ-06 H86/11 2024 (project “Impact of microplastics on soil functions”).
Institutional Review Board Statement
Not applicable.
Informed Consent Statement
Not applicable.
Data Availability Statement
The original contributions presented in this study are included in the article. Further inquiries can be directed to the corresponding author.
Acknowledgments
The authors acknowledge funding of research activities received from the Bulgarian National Science Fund under grant agreement KΠ-06 H86/11 2024 (project “Impact of microplastics on soil functions”).
Conflicts of Interest
The authors declare no conflicts of interest. The funders had no role in the design of the study; in the collection, analyses, or interpretation of data; in the writing of the manuscript; or in the decision to publish the results.
Abbreviations
The following abbreviations are used in this manuscript:
| ACT | Actinomycetes |
| AMM | Ammonifying bacteria |
| BR | Basal respiration |
| CELLUL | Cellulose-degrading microorganisms |
| Cmic | Microbial biomass carbon |
| Db | Bulck density |
| Ds | Soil particle density |
| FUNGI | Microscopic fungi |
| II | Cumulative impact index |
| MPs | Microplastics |
| NUTIL | Nitrogen-utilizing bacteria |
| PE | Polyethylene |
| PET | Polyethylene terephthalate |
| PO | Peroxidase activity |
| PP | Polypropylene |
| PPO | Polyphenol oxidase activity |
| qCO2 | Metabolic quotient |
| SIR | Substrate-induced respiration |
| SOC | Soil organic carbon |
| Wh | Hygroscopic water content |
| Δ | Standardized differences (%) to the control for each soil type |
Appendix A
Figure A1.
Photos of the applied secondary MPs (PP and PET) and primary MPs (PE) in trhe incubation experiment.
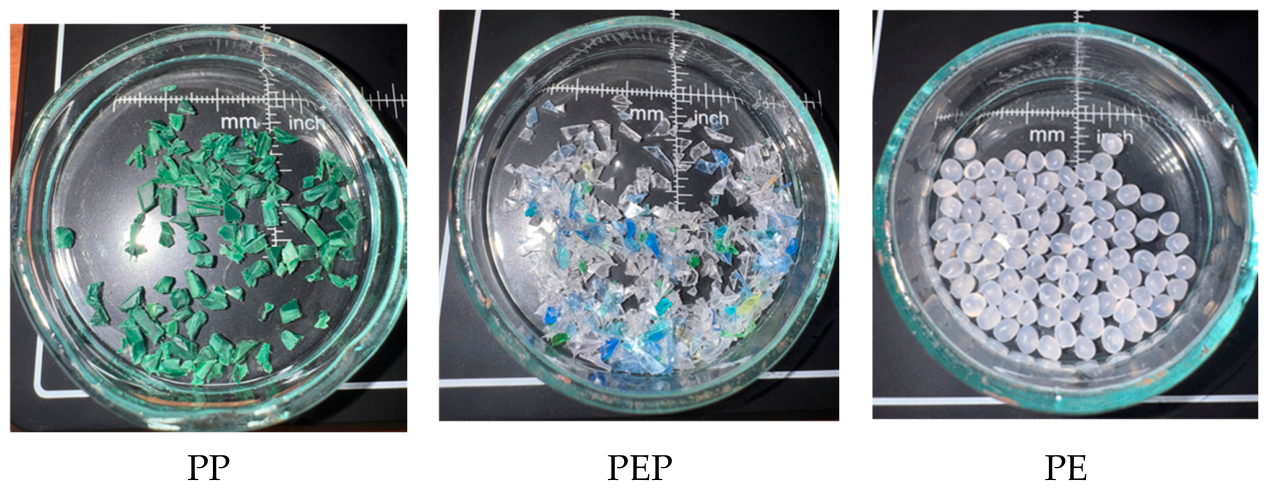
Table A1.
Three–way analyses of variance by treatment of mineral N (N-NO3, N-NH4) (mg kg−1), available P2O5 (mg 100g−1), available K2O (mg 100g−1), EC (µS cm−1), pH, SOC (%), TN (%), ammonifying bacteria AMM (CFU × 106 g−1), nitrogen-utilizing bacteria NUTIL (CFU × 106 g−1), actinomycetes ACT (CFU × 106 g−1), microscopic fungi FUNGI (CFU × 106 g−1), cellulose-decomposing microorganisms CELLUL (CFU × 106 g−1), peroxidase activity PO (mg PPG g−1 soil 30 min−1), polyphenol oxidase PPO (mg PPG g−1 soil 30 min−1), microbial biomass carbon Cmic (μg C g−1), basal respiration BR (μl CO2 g−1 h−1), qCO2 (µg CO2-C µg−1 Cmic h−1).
References
- Chen, Z.; Carter, L.J.; Banwart, S.A.; Kay, P. Microplastics in soil–plant systems: Current knowledge, research gaps, and future directions for agricultural sustainability. Agronomy 2025, 15, 1519. [Google Scholar] [CrossRef]
- Cheng, Y.; Wang, F.; Huang, W.; Li, J.; Zheng, J.; Wang, X. Response of soil biochemical properties and ecosystem function to microplastics pollution. Sci. Rep. 2024, 14, 28328. [Google Scholar] [CrossRef]
- Fuller, S.; Gautam, A. A procedure for measuring microplastics using pressurized fluid extraction. Environ. Sci. Technol. 2016, 50, 5774–5780. [Google Scholar] [CrossRef] [PubMed]
- Ma, J.; Xu, M.; Wu, J.; Yang, G.; Zhang, X.; Song, C.; Long, L.; Chen, C.; Xu, C.; Wang, Y. Effects of variable-sized polyethylene microplastics on soil chemical properties and functions and microbial communities in purple soil. Sci. Total Environ. 2023, 868, 161642. [Google Scholar] [CrossRef] [PubMed]
- En-Nejmy, K.; El Hayany, B.; Al-Alawi, M.; Jemo, M.; Hafidi, M.; El Fels, L. Microplastics in soil: A comprehensive review of occurrence, sources, fate, analytical techniques and potential impacts. Ecotoxicol. Environ. Saf. 2024, 288, 117332. [Google Scholar] [CrossRef]
- Briassoulis, D.; Hiskakis, M.; Scarascia, G.; Picuno, P.; Delgado, C.; Dejean, C. Labeling scheme for agricultural plastic wastes in Europe. Qual. Assur. Saf. Crops Foods 2010, 2, 93–104. [Google Scholar] [CrossRef]
- Qiu, G.; Wang, Q.; Wang, T.; Kang, Z.; Zeng, Y.; Yang, X.; Song, N.; Zhang, S.; Han, X.; Yu, H. Effects of polyethylene microplastics on properties, enzyme activities, and the succession of microbial community in Mollisol at the aggregate level. Environ. Res. 2023, 237, 116976. [Google Scholar] [CrossRef]
- Lwanga, E.H.; Gertsen, H.; Gooren, H.; Peters, P.; Salánki, T.; van der Ploeg, M.; Besseling, E.; Koelmans, A.A.; Geissen, V. Incorporation of microplastics from litter into burrows of Lumbricus terrestris. Environ. Pollut. 2017, 220, 523–531. [Google Scholar] [CrossRef]
- Weithmann, N.; Möller, J.N.; Löder, M.G.J.; Piehl, S.; Laforsch, C. Organic fertilizer as a vehicle for the entry of microplastics into the environment. Sci. Adv. 2018, 4, eaap8060. [Google Scholar] [CrossRef]
- Horton, A.A.; Walton, A.; Spurgeon, D.J.; Lahive, E.; Svendsen, C. Microplastics in freshwater and terrestrial environments: Evaluating the current understanding to identify the knowledge gaps and future research priorities. Sci. Total Environ. 2017, 586, 127–141. [Google Scholar] [CrossRef]
- Mohapatra, S.; Adamowicz, W.; Boxall, P. Dynamic technique and scale effects of economic growth on the environment. Energy Econ. 2016, 57, 256–264. [Google Scholar] [CrossRef]
- Gündoğdu, S.; Çevik, C.; Güzel, E.; Kilercioğlu, S. Microplastics in municipal wastewater treatment plants in Turkey: A comparison of the influent and secondary effluent concentrations. Environ. Monit. Assess. 2018, 190, 29. [Google Scholar] [CrossRef] [PubMed]
- Ng, E.L.; Huerta Lwanga, E.; Eldridge, S.M.; Johnston, P.; Hu, H.-W.; Geissen, V.; Chen, D.; Rout, S. An overview of microplastic and nanoplastic pollution in agroecosystems. Sci. Total Environ. 2018, 627, 1377–1388. [Google Scholar] [CrossRef]
- Chandel, R.; Singh, L.; Khan, N.A.; Ashraf, S.M.; Rahman, F.; Ahmad, S. Microbial remediation of microplastic-contaminated soil, focusing on mechanisms, benefits, and research gaps. npj Emerg. Contam. 2025, 1, 14. [Google Scholar] [CrossRef]
- Nizzetto, L.; Futter, M.; Langaas, S. Are agricultural soils dumps for microplastics of urban origin? Environ. Sci. Technol. 2016, 50, 10777–10779. [Google Scholar] [CrossRef]
- Gao, B.; Li, Y.; Zheng, N.; Liu, C.; Ren, H.; Yao, H. Interactive effects of microplastics, biochar, and earthworms on CO2 and N2O emissions and microbial functional genes in vegetable-growing soil. Environ. Res. 2022, 213, 113728. [Google Scholar] [CrossRef]
- Zhang, P.; Yuan, Y.; Zhang, J.; Wen, T.; Wang, H.; Qu, C.; Tan, W.; Xi, B.; Hui, K.; Tang, J. Specific response of soil properties to microplastics pollution: A review. Environ. Res. 2023, 232, 116427. [Google Scholar] [CrossRef]
- Wang, T.; Zhao, S.; Zhu, L.; McWilliams, J.C.; Galgani, L.; Md Amin, R.; Nakajima, R.; Jiang, W.; Chen, M. Accumulation, transformation and transport of microplastics in estuarine fronts. Nat. Rev. Earth Environ. 2022, 3, 795–805. [Google Scholar] [CrossRef]
- Yu, H.; Fan, P.; Hou, J.; Dang, Q.; Cui, D.; Xi, B. Inhibitory effect of microplastics on soil extracellular enzymatic activities by changing soil properties and direct adsorption: An investigation at the aggregate-fraction level. Environ. Pollut. 2020, 267, 115544. [Google Scholar] [CrossRef]
- Hou, J.; Xu, X.; Yu, H.; Xi, B.; Tan, W. Comparing the long-term responses of soil microbial structures and diversities to polyethylene microplastics in different aggregate fractions. Environ. Int. 2021, 149, 106398. [Google Scholar] [CrossRef] [PubMed]
- Khan, M.F. Microbial remediation of agrochemical-contaminated soils: Enzymatic mechanisms, quorum sensing, and emerging opportunities. Integr. Environ. Assess. Manag. 2025, vjaf167. [Google Scholar] [CrossRef] [PubMed]
- Nina, M.R.H.; Liu, J.; Zhang, X.; Fan, D.; Bai, Y. Quorum sensing-based long-term biodegradation of polyethylene terephthalate in contaminated soil by engineered Escherichia coli and Pseudomonas putida. ACS Synth. Biol. 2026, 15, 2107–2120. [Google Scholar] [CrossRef]
- Rillig, M.C.; Leifheit, E.F.; Lehmann, J. Microplastic effects on carbon cycling processes in soils. PLoS Biol. 2021, 19, e3001130. [Google Scholar] [CrossRef]
- Zhu, F.; Yan, Y.; Doyle, E.; Zhu, C.; Jin, X.; Chen, Z.; Wang, C.; He, H.; Zhou, D.; Gu, C. Microplastics altered soil microbiome and nitrogen cycling: The role of phthalate plasticizer. J. Hazard. Mater. 2022, 427, 127944. [Google Scholar] [CrossRef]
- Kuncheva, G.; Kercheva, M.; Enchev, E.; Paparkova, T.; Kolchakov, V. Factors controlling water-stable macroaggregation of Kastanozems exposed to water erosion. Bulg. J. Agric. Sci. 2023, 29, 262–271. [Google Scholar]
- Ya, H.; Xing, Y.; Zhang, T.; Lv, M.; Jiang, B. LDPE microplastics affect soil microbial community and form a unique plastisphere on microplastics. Appl. Soil Ecol. 2022, 180, 104623. [Google Scholar] [CrossRef]
- Grudeva, V.; Moncheva, P.; Nedeva, S.; Gocheva, B.; Antonova-Nedeva, S.; Naumova, S. Handbook of Microbiology; University Edition SU “St. Kl. Ohridski”: Sofia, Bulgaria, 2007. [Google Scholar]
- Galstian, A.S. Enzymatic activity of soils. Geoderma 1974, 12, 43–48. [Google Scholar] [CrossRef]
- Filcheva, E.; Tsadilas, C. Influence of clinoptilolite and compost on soil properties. Commun. Soil Sci. Plant Anal. 2002, 33, 595–607. [Google Scholar] [CrossRef]
- Murphy, J.; Riley, J.P. A modified single solution method for the determination of phosphate in natural waters. Anal. Chim. Acta 1962, 27, 31–36. [Google Scholar] [CrossRef]
- Ananyeva, N.D. Mikrobiologicheskie Aspekty Samoochishcheniya i Ustoychivosti Pochv (Microbiological Aspects of Self-Purification and Resilience of Soils); Nauka: Moscow, Russia, 2003. [Google Scholar]
- Ananyeva, N.D.; Susyan, E.A.; Gavrilenko, E.G. Determination of the soil microbial biomass carbon using the method of substrate-induced respiration. Eurasian Soil Sci. 2011, 44, 1215–1221. [Google Scholar] [CrossRef]
- Anderson, J.P.E.; Domsch, K.H. A physiological method for the quantitative measurement of microbial biomass in soils. Soil Biol. Biochem. 1978, 10, 215–221. [Google Scholar] [CrossRef]
- Greco, S.; Ishizaka, A.; Tasiou, M.; Torrisi, G. On the methodological framework of composite indices: A review of the issues of weighting, aggregation, and robustness. Soc. Indic. Res. 2019, 141, 61–94. [Google Scholar] [CrossRef]
- OECD. Handbook on Constructing Composite Indicators: Methodology and User Guide; OECD Publishing: Paris, France, 2008. [Google Scholar]
- Bae, S.; Yoo, K. Microplastic contamination and microbial colonization in coastal area of Busan City, Korea. Front. Mar. Sci. 2022, 9, 1030476. [Google Scholar] [CrossRef]
- Machado, A.A.S.; Lau, C.W.; Kloas, W.; Bergmann, J.; Bachelier, J.B.; Faltin, E.; Becker, R.; Görlich, A.S.; Rillig, M.C. Microplastics can change soil properties and affect plant performance. Environ. Sci. Technol. 2019, 53, 6044–6052. [Google Scholar] [CrossRef]
- Yu, H.; Zhang, Y.; Tan, W.B.; Zhang, Z. Microplastics as an emerging environmental pollutant in agricultural soils: Effects on ecosystems and human health. Front. Environ. Sci. 2022, 10, 855292. [Google Scholar] [CrossRef]
- Huang, S.Y.; Liu, X.P.; Zhang, T.C.; Wang, Y.; Zhou, D.M. Polyethylene and polyvinyl chloride microplastics promote soil nitrification and alter the composition of key nitrogen functional bacterial groups. J. Hazard. Mater. 2023, 453, 131391. [Google Scholar] [CrossRef]
- Shi, J.; Zhang, Q.; Sun, Y.; Peng, Y.; Wang, J.; Wang, X.; Rillig, M.C. Microplastic induces microbial nitrogen limitation and alters microbial nitrogen transformation: Insights from metagenomic analysis. Sci. Total Environ. 2025, 967, 178825. [Google Scholar] [CrossRef] [PubMed]
- Khan, M.F.; Rama, M.; Murphy, C.D. Biodegradation of fluorinated β-triketone herbicide tembotrione by a bacterial–fungal consortium. Biocatal. Agric. Biotechnol. 2025, 70, 103828. [Google Scholar] [CrossRef]
- Yadav, P.; Kumar, A.; Ram, K.; Kumar, A.; Gupta, R.K.; Dufossé, L. Microbial degradation of microplastics: Effectiveness, challenges, and sustainable solutions. Curr. Res. Microb. Sci. 2025, 9, 100495. [Google Scholar] [CrossRef]
- Gui, J.; Sun, Y.; Wang, J.; Chen, X.; Zhang, S.; Wu, D. Microplastics in composting of rural domestic waste: Abundance, characteristics, and release from the surface of macroplastics. Environ. Pollut. 2021, 274, 116553. [Google Scholar] [CrossRef] [PubMed]
- Rillig, M.C.; Lehmann, A. Microplastic in terrestrial ecosystems. Science 2020, 368, 1430–1431. [Google Scholar] [CrossRef] [PubMed]
- Yi, M.; Zhou, S.; Zhang, L.; Ding, S. The effects of three different microplastics on enzyme activities and microbial communities in soil. Water Environ. Res. 2021, 93, 24–32. [Google Scholar] [CrossRef] [PubMed]
- Amaral-Zettler, L.A.; Zettler, E.R.; Mincer, T.J. Ecology of the plastisphere. Nat. Rev. Microbiol. 2020, 18, 139–151. [Google Scholar] [CrossRef] [PubMed]
- Tokiwa, Y.; Calabia, B.P.; Ugwu, C.U.; Aiba, S. Biodegradability of plastics. Int. J. Mol. Sci. 2009, 10, 3722–3742. [Google Scholar] [CrossRef]
- Machado, A.A.S.; Lau, C.W.; Till, J.; Kloas, W.; Lehmann, A.; Becker, R.; Rillig, M.C. Impacts of microplastics on the soil biophysical environment. Environ. Sci. Technol. 2018, 52, 9656–9665. [Google Scholar] [CrossRef]
- Sakin, E.; Dilekoğlu, M.F.; Yanardağ, I.H. Unseen threat: The devastating impact of microplastics on soil health in agricultural lands. CATENA 2025, 253, 108904. [Google Scholar] [CrossRef]
- Burns, R.G.; DeForest, J.L.; Marxsen, J.; Sinsabaugh, R.L.; Stromberger, M.E.; Wallenstein, M.D.; Weintraub, M.N.; Zoppini, A. Soil enzymes in a changing environment: Current knowledge and future directions. Soil Biol. Biochem. 2013, 58, 216–234. [Google Scholar] [CrossRef]
- Aralappanavar, V.K.; Mukhopadhyay, R.; Yu, Y.; Liu, J.; Bhatnagar, A.; Praveena, S.M.; Li, Y.; Paller, M.; Adyel, T.M.; Rinklebe, J.; et al. Effects of microplastics on soil microorganisms and microbial functions in nutrients and carbon cycling: A review. Sci. Total Environ. 2024, 924, 171435. [Google Scholar] [CrossRef]
- Khalid, N.; Aqeel, M.; Noman, A.; Hashem, M.; Mostafa, Y.S.; Alhaithloul, H.A.S.; Alghanem, S.M. Linking effects of microplastics to ecological impacts in marine environments. Chemosphere 2021, 264, 128541. [Google Scholar] [CrossRef]
- Zhao, T.; Lozano, Y.M.; Rillig, M.C. Microplastics increase soil pH and decrease microbial activities as a function of microplastic shape, polymer type, and exposure time. Front. Environ. Sci. 2021, 9, 675803. [Google Scholar] [CrossRef]
- Chen, Y.; Gao, B.; Yang, Y.; Pan, Z.; Liu, J.; Sun, K.; Xing, B. Tracking microplastics biodegradation through CO2 emission: Role of photoaging and mineral addition. J. Hazard. Mater. 2022, 439, 129615. [Google Scholar] [CrossRef] [PubMed]
- Chang, N.; Chen, L.; Wang, N.; Cui, Q.; Qiu, T.; Zhao, S.; He, H.; Zeng, Y.; Dai, W.; Duan, C. Unveiling the impacts of microplastic pollution on soil health: A comprehensive review. Sci. Total Environ. 2024, 951, 175643. [Google Scholar] [CrossRef]
- Wang, K.; Wang, F.; Yu, Y.; Yang, S.; Han, Y.; Yao, H. Microplastics and soil microbiomes. BMC Biol. 2025, 23, 273. [Google Scholar] [CrossRef]
- Shen, H.; Sun, Y.; Duan, H.; Ye, J.; Zhou, A.; Meng, H.; Zhu, F.; He, H.; Gu, C. Effect of PVC microplastics on soil microbial community and nitrogen availability under laboratory-controlled and field-relevant temperatures. Appl. Soil Ecol. 2023, 184, 104794. [Google Scholar] [CrossRef]
- Vainberg, A.; Abakumov, E.; Nizamutdinov, T. Recent insights into microplastic pollution and its effects on soil carbon: A five-year ecosystem review. Microplastics 2025, 4, 18. [Google Scholar] [CrossRef]
- Wang, Z.; Li, W.; Li, W.; Yang, W.; Jing, S. Effects of microplastics on the water characteristic curve of soils with different textures. Chemosphere 2023, 317, 137762. [Google Scholar] [CrossRef]
- Ihezukwu, U.C.; Charoenpong, C.; Chotpantarat, S. Influence of mineralogical composition on the retention and loss of water-extractable organic carbon in tropical soils. Geoderma 2023, 432, 116375. [Google Scholar] [CrossRef]
- Ng, E.L.; Lin, S.Y.; Dungan, A.M.; Colwell, J.M.; Ede, S.; Huerta Lwanga, E.; Meng, K.; Geissen, V.; Blackall, L.L.; Chen, D. Microplastic pollution alters forest soil microbiome. J. Hazard. Mater. 2021, 409, 124606. [Google Scholar] [CrossRef] [PubMed]
- Fang, Z.; Sallach, J.B.; Hodson, M.E. Size- and concentration-dependent effects of microplastics on soil aggregate formation and properties. J. Hazard. Mater. 2024, 465, 133395. [Google Scholar] [CrossRef]
- Wang, F.; Wang, Q.; Adams, C.A.; Sun, Y.; Zhang, S. Effects of Microplastics on Soil Properties: Current Knowledge and Future Perspectives. J. Hazard. Mater. 2022, 424, 127531. [Google Scholar] [CrossRef] [PubMed]
- Urbanek, A.K.; Rymowicz, W.; Mirończuk, A.M. Degradation of plastics and plastic-degrading bacteria in cold marine habitats. Appl. Microbiol. Biotechnol. 2018, 102, 7669–7678. [Google Scholar] [CrossRef] [PubMed]
- Danso, D.; Chow, J.; Streit, W.R. Plastics: Environmental and biotechnological perspectives on microbial degradation. Appl. Environ. Microbiol. 2019, 85, e01095-19. [Google Scholar] [CrossRef] [PubMed]
- Fei, Y.; Huang, S.; Zhang, H.; Tong, Y.; Wen, D.; Xia, X.; Wang, H.; Luo, Y.; Barceló, D. Response of soil enzyme activities and bacterial communities to the accumulation of microplastics in an acid cropped soil. Sci. Total Environ. 2020, 707, 135634. [Google Scholar] [CrossRef] [PubMed]

Disclaimer/Publisher’s Note: The statements, opinions and data contained in all publications are solely those of the individual author(s) and contributor(s) and not of MDPI and/or the editor(s). MDPI and/or the editor(s) disclaim responsibility for any injury to people or property resulting from any ideas, methods, instructions or products referred to in the content. |
© 2026 by the authors. Licensee MDPI, Basel, Switzerland. This article is an open access article distributed under the terms and conditions of the Creative Commons Attribution (CC BY) license.