


Abstract
Current knowledge on the toxic effects of microplastics (MPs) on human health relies on the extrapolation of data collected from in vivo studies. These studies, however, present limitations, as the particles used often differ from their environmental counterparts. Nevertheless, they provide valuable insights into the mechanisms underlying MPs’ toxicity. In this study, we targeted the mitochondria to investigate the effects of two types of polyethylene microplastics (PE MPs, 27–32 µm), fluorescent and non-fluorescent, on kidneys from FVB/n mice. Animals were exposed for 28 days to two environmentally relevant concentrations of PE MPs (0.002% (w/w) and 0.006% (w/w)). Results reveal that both MPs induce mitochondrial dysfunction, as indicated by oxygen flux depletion in different coupling-controlled states. Complex II dysfunction, particularly at the highest concentration of fluorescent particles, and alterations in other components of the electron transport chain were identified as one of the causes of mitochondrial dysfunction. MPs’ exposure also induced subtle remodelling of the mitochondrial membrane lipid profile, marked by shifts in specific saturated and unsaturated fatty acids, suggesting an adaptive response to preserve membrane integrity. These alterations were accompanied by oxidative stress, evidenced by decreased SOD and CAT activities, particularly under high concentrations of fluorescent PE MPs. Overall, fluorescent MPs triggered stronger mitochondrial and metabolic disruptions in the kidney. All together, these findings reinforce mitochondria as pivotal targets of MPs’ toxicity and highlight the need for improved experimental models that better reflect environmentally relevant exposure scenarios.
1. Introduction
Microplastics (MPs), once considered solely an environmental concern, are now recognised as a one-health issue due to their widespread effects on ecosystems, animals, and human health [1]. Despite the recognition of human exposure to these particles by the World Health Organisation [2] and numerous studies characterising the routes and levels of MPs exposure, the data on their hazardous effects rely on extrapolation of results from in vivo investigations, using animal models, such as rodents and zebrafish, often combined with in vitro assays. These studies present several limitations that may overestimate the true impact of MPs on health, despite being the most practical approach to unveil MP-induced toxicity [3,4]. The use of extremely high concentrations and modified particles comprises some of the problems found and frequently overlooked. For instance, fluorescence labelling strategies, although primarily developed for tracing and bioaccumulation studies, have been extensively employed in toxicological studies to evaluate the biological effects of MPs. Therefore, fluorescent MPs should not be regarded as completely inert tracers, as they may overestimate or modify the effects attributable to the polymer itself. In this context, alternative strategies, such as the incorporation of quantum dots within the polymer core, have emerged to improve photostability while minimising alterations to particle properties [5].
Emerging evidence from murine models suggests that MPs can induce adverse effects in various organ systems [6,7,8]. Recently, the toxic effects of MPs on the kidneys have garnered the attention of researchers. Studies have shown that MPs can accumulate in mouse kidneys, triggering oxidative stress and inflammatory responses [9,10]. Despite these findings, research on renal toxicity remains limited compared with investigations focused on organs traditionally recognised as primary targets of MPs, such as the liver and the gut. However, the kidney’s physiological role predisposes it to MPs-induced damage. As a vital organ involved in metabolism, excretion and endocrine function, the kidney plays a key role in maintaining homeostasis in mammals by regulating the electrolyte levels and maintaining acid-base balance [11]. Moreover, its function in filtering ultrafine particles suggests it may serve as a site of MP accumulation, where retained particles could cause tissue damage through mechanical irritation or immune activation [12,13]. Given that MPs are synthetic materials with no natural clearance pathways, the mechanisms by which the kidney handles or eliminates these particles remain poorly understood. Elucidating these mechanisms is therefore crucial to understanding the systemic impact of MPs’ exposure and to establishing the kidney as a sensitive indicator of MP-induced toxicity.
Mitochondria have been increasingly recognised as key targets for MPs’ action. Both in vitro and in vivo investigations have reported dysfunctional mitochondria across multiple organs, including the liver [6,14], lung [15], heart [16], small intestine [17], ovarian [18], brain [19], and skin [20]. The kidney, one of the most energy-demanding organs in the body, is highly packed with mitochondria, and mitochondrial dysfunction is a known feature of acute kidney injury and chronic kidney disease, alongside oxidative stress [21]. Evidence also indicates that MPs can disrupt renal mitochondrial function. Shen and collaborators [22] reported alterations in the expression of the subunits from the different complexes of the electron transport chain in C57BL/6 mice exposed to 1 μm PS-MPs for 8 weeks. In a similar approach, Xiong et al. [23] demonstrated ultrastructural mitochondrial damage in podocytes, characterised by swelling and fragmentation. Zhou et al. [24], using kidney organoids, observed profound alterations in mitochondrial function following PS MPs exposure, including changes in mitochondrial architecture, loss of mitochondrial membrane potential, disturbances in the tricarboxylic acid cycle and ATP accumulation.
In this study, we aimed to investigate the renal effects of MPs, with a particular focus on mitochondrial function as a central target of MPs-induced toxicity. Polyethylene (PE) was the polymer of choice due to its environmental relevance, as it represents the most abundant plastic pollutant worldwide. Despite this, toxicological studies have predominantly focused on polystyrene (PS), leaving the effects of PE largely unexplored. To address the gaps in MPs’ toxicological testing, both fluorescent and non-fluorescent PE MPs were evaluated to determine whether fluorescence labelling alters their biological behaviour and toxicological profile.
2. Materials and Methods
2.1. Polyethylene Microplastics Characterisation
Non-fluorescent blue (PE MPs) and fluorescent yellow polyethylene (f-PE MPs) microspheres, ranging in size from 27 to 32 µm, were obtained from Cospheric (Somis, CA, USA). The particle size and morphology of PE MPs were verified using scanning electron microscopy (SEM). The SEM images were obtained at 20 kV on a Hitachi S-3400N type II microscope equipped with a Bruker x-flash 5010 at high vacuum. The sample was coated with gold. To confirm the composition of the microsphere, Attenuated Total Reflection Fourier-Transform Infrared (ATR-FTIR) was performed in an IRAffinity 1S spectrophotometer (Shimadzu Corp., Kyoto, Japan). The spectra were collected over the 4000–500 cm−1 range by averaging 64 scans at a wavenumber resolution of 2 cm−1. Solid samples (2 mg) were finely ground, mixed with approximately 175 mg of dried potassium bromide and pressed into pellets. Measurements of the zeta potential in a 100 mM HEPES buffer solution were conducted using a Litesizer 500 dynamic light scattering (DLS) instrument (Anton Paar, Graz, Austria).
2.2. Animal Care and Treatment
Thirty FVB/n healthy and non-genetically modified male mice (26–32 weeks old) were randomly assigned to 5 experimental groups (n = 6): control, PE MPs 0.002%, PE MPs 0.006%, f-PE MPs 0.002% and f-PE MPs 0.006%. Male animals were selected to minimise potential variability associated with the female hormonal cycle. To ensure unbiased assignment across all groups, a randomisation sequence was created using Microsoft Excel. Cage placement and the order of the experimental group were varied to mitigate potential confounders. The size of MPs was grounded on the range of particles that have been detected in human biological samples, including stool and cardiac tissue [25,26]. The concentrations of 0.002% and 0.006% (w/w) correspond to the weight of MPs incorporated into the feeding diet. Their selection was based on previous estimates of human MPs exposure (0.1–5 g/week/person) [27]. The weekly intake of MPs for each mouse was 16.1 mg/week/kg BW and 44.1 mg/week/kg BW for exposure concentrations of 0.002% and 0.006%, respectively, for both MP types. To prevent the confounding effects of chronic stress associated with oral gavage, the MPs were administered ad libitum after incorporation into a standard chow diet (Diet Standard 4RF21®, Mucedola, Italy) (Supplementary Material). Throughout the 28 days of MP exposure, the animals were housed in polycarbonate cages (Eurostandart, Type 1264C, Tecniplast, Italy) within a climate-controlled environment, maintained at a temperature of 23 2 °C, 50 10% humidity, and a 12 h light/dark cycle. Animals’ weight was monitored weekly. Food and water intake were monitored weekly at the cage level and normalised to the number of animals, allowing the estimation of average daily consumption per animal throughout the exposure period. Food consumption was used to estimate the average MP intake per experimental group. No humane endpoints were assessed because dietary microplastics exposure was not predicted to cause distress to the animals.
Animals were euthanised via intracardiac exsanguination under xylazine anaesthesia (40U—Rompum®, Bayer Healthcare S.A., Kiel, Germany). Blood samples were collected in plain tubes for serum biochemistry assessment and performed only in a subset of samples due to sample availability limitations (n = 3). Kidney, liver, testis and heart tissues were harvested, weighed, and stored (80 °C) until further analysis. Small portions of kidney tissues were preserved for future high-resolution respirometry analysis. Details of the protocol are provided in the Supplementary Material [28].
All animal procedures were approved by the Ethics Committee of the University of Trás-os-Montes and Alto Douro (ORBEA) and the Portuguese Veterinary Directorate (DGAV) under approval number 0421/000/000/2023, granted on 28 March 2023. These protocols complied with Portuguese legislation (Artigo 44º, Decreto-Lei n°113/7 August 2013) and European regulations (EU Directive 2010/63/EU).
2.3. Histologic Analysis
Kidney samples were fixed in 10% neutral buffered formalin and routinely processed for light microscopy. Paraffin-embedded samples were sectioned at 2 μm and stained with hematoxylin and eosin (HE). Samples were examined for the presence of tubular injury and interstitial inflammatory infiltrate. For tubular injury, a semiquantitative score was used by a blinded pathologist, who examined 10 cortical fields (200 magnification) per HE-stained section for each sample (adapted from Takaori et al. [29]). Tubular injury was defined as tubular dilation, tubular cast formation, vacuolization, cell degeneration/necrosis, sloughing off of tubular epithelial cells or loss of the brush border and thickening of the tubular basement membrane. The tubules were evaluated according to the following scoring system: 0 no tubular injury; 1 10% tubules injured; 2 11–25% tubules injured; 3 26–50% tubules injured; 4 51–74% tubules injured; and 5 75% tubules injured. For inflammatory infiltrate evaluation, a semiquantitative score was used: 0—no interstitial inflammatory infiltrate; 1—less than five multifocal inflammatory aggregates; 2—five or more multifocal inflammatory aggregates [30].
2.4. Serum Biochemistry Analysis
Whole blood samples were allowed to clot at room temperature for approximately 5 min and were subsequently centrifuged at 800 g for 3 min. The obtained serum was collected and stored at −20 °C until further biochemical analyses. Serum urea and creatinine levels, as well as serum albumin, were measured to assess the presence of kidney damage. These parameters were analysed by the certified external veterinary diagnostic laboratory Cedivet (Matosinhos, Porto, Portugal), according to their standardised and validated procedures.
2.5. High-Resolution Respirometry Measurements
Oxygen flux and concentration were followed in real-time in an oxygraph-2k high-resolution respirometer (OROBOROS® Instruments; Innsbruck, Austria) operated at 37 °C, using the software Oroboros DatLab 7.0. To prevent respiratory limitation, the oxygen concentration was kept above 90 nmol O2/mL [31].
Briefly, preserved kidney aliquots were thawed, washed and homogenised in ice-cold respiration buffer (220 mM mannitol, 75 mM sucrose, 0.5 mM EGTA, 0.3 mM magnesium chloride (MgCl2), 10 mM KH2PO4, 10 mM HEPES, 0.1% BSA (w/v), pH 7.4). The tissue homogenate (0.5–2 mg of protein) was added to both chambers containing respiratory medium, and measurements were taken following the sequential addition of substrates, inhibitors and uncouplers as specified in the applied SUIT protocol (Figure 1I. Pyruvate (5 mM) and malate (1 mM) were used for activation of Complex I, assessing the non-phosphorylating mitochondrial respiratory state (LEAK respiration, L—classic state 2, LCI). The oxidative phosphorylation capacity (OXPHOS capacity, P—classic state 3) supported by Complex I (PCI) was assessed in the presence of saturating concentrations of ADP (1–5 mM). Cytochrome c (10 µM) was introduced in the chamber to evaluate the integrity of the inner mitochondrial membrane. Increased respiratory flux after cytochrome c addition suggests that the outer mitochondrial membranes are not intact. To obtain maximal phosphorylating capacity supported by Complex I + II (PCI+II), succinate was added (5 mM), followed by titration of Complex I inhibitor, rotenone, to assess Complex II-driven respiration (PCII). Oligomycin (5 µM), an ATP synthase inhibitor, was then added to measure LEAK respiration in the presence of adenylates (ADP) (LOmy CII). Mitochondrial respiration was then completely inhibited by adding Complex III inhibitor antimycin A, allowing residual oxygen consumption (ROX) evaluation. To assess non-phosphorylating respiration supported by Complex IV (LOmy CIV), 1 mM TMPD (N,N,N’,N’—tetramethyl-p-phenylenediamine) and 2 mM ascorbate were introduced into the chamber. A Complex IV inhibitor, sodium azide (40 mM), was used to assess oxygen consumption linked to the autoxidation of ascorbate and TMPD. Because freezing is known to compromise the integrity of the inner mitochondrial membrane, classic respiratory control ratios were not used as indicators of coupling efficiency [32]. Citrate synthase activity was used to normalise results to mitochondrial content, and results were expressed as pmol O2/CS activity.
2.6. Renal Mitochondrial Enzymes Evaluation
Kidney mitochondrial-enriched fractions were isolated via differential centrifugation as described by Peixoto et al. [33] with alterations proposed by Silva et al. [34]. Briefly, the kidney was homogenised in an ice-cold isolation medium (250 mM sucrose, 0.2 mM EGTA, 0.1 mM EDTA, and 0.1% BSA, pH 7.0), followed by 3 cycles of cycles to obtain a mitochondrial pellet. The mitochondrial-enriched fractions were washed and resuspended in a washing medium (250 mM sucrose, 5 mM HEPES, pH 7.4), at a protein concentration of 1–10 mg/mL, quantified by the Biuret method [35].
Mitochondrial enzymatic activities were assessed according to Spinazzi et al. [36], with minor modifications. Before kinetic assays for enzymatic evaluation, the renal mitochondrial-enriched fractions were disrupted by performing three freeze–thaw cycles. Assays were conducted for 5 min at 30 °C using 0.03–0.06 mg of protein from the mitochondria-enriched fraction. A microplate reader was used to assess the kinetic reactions (Multiskan™ Sky-High Microplate Spectrophotometer, Thermo Fisher Scientific, Waltham, MA, USA).
Briefly, for evaluation of mitochondrial mass and normalisation of mitochondrial complexes’ enzymatic activities, citrate synthase (CS) was assessed based on the reduction in DTNB (ε 13.6 mM−1·cm−1). CS was expressed as µM DTNB reduced·min−1·mg−1 protein. NADH dehydrogenase (Complex I) activity was measured by monitoring the oxidation of nicotinamide adenine nucleotide (NADH) at 340 nm (ε 6.2 mM−1·cm−1), with a parallel assay in the presence of 0.0125 mM rotenone, for Complex I specific activity determination. The reduction of 6-dichlorophenolindophenol (DCPIP) (ε 19.1 mM−1·cm−1) at 600 nm was followed to measure the enzymatic activity of succinate dehydrogenase (Complex II), considering only the activity sensitive to the presence of malonate, an inhibitor of Complex II. Complex II + III was measured by the reduction in oxidised cytochrome c catalysed by Coenzyme Q–cytochrome c-oxireductase (Complex III), at 550 nm (ε 29.5 mM−1·cm−1). Cytochrome c served as the electron carrier for succinate oxidation via Complex II. Only antimycin A-sensitive activity was considered. The enzymatic activity of cytochrome c oxidase (Complex IV) was specifically assessed by measuring the oxidation of reduced cytochrome c at 550 nm and running a parallel reaction in the presence of 1.25 mM KCN, a selective inhibitor of the enzyme.
2.7. Renal Oxidative Stress Evaluation
2.7.1. Antioxidant, Biotransformation and Metabolic Enzyme Activities
Sample processing and enzymatic kinetic reactions were carried out as previously described by our team [34]. Briefly, kidney tissue was homogenised in ice-cold homogenization buffer (50 mM KH2PO4, pH 7.0) and sonicated for 2 min (6 pulses of 20 s, 70 A). Differential centrifugation (1500, 8000 and 14,000 g, 10 min., 4 °C) was used to separate cytoplasmic, and both cellular- and mitochondrial-enriched lipidic fractions. Enzyme activity and glutathione levels were analysed in the cytoplasmic supernatant, while lipid peroxidation was assessed in the cellular and mitochondrial pellets. The biuret method was used for total protein measurement [35]. Cytoplasm was analysed immediately. Lipid fractions were stored at −20 °C until further analysis.
The xanthine–xanthine oxidase system was used to evaluate total and mitochondrial superoxide dismutase (t-SOD and mt-SOD) activities at 560 nm. A control assay without a sample-determined maximum nitroblue tetrazolium chloride (NBT) reduction by superoxide produced through the reaction system. For mt-SOD, 0.25 mM KCN was added to the reaction mixture. Results were expressed as U·min−1·mg−1 protein, with one unit corresponding to the amount of SOD capable of inhibiting 50% of NBT reduction to formazan. Catalase (CAT) activity was measured by tracking hydrogen peroxide reduction (H2O2) (ε 43.6 mM−1·cm−1) into water and oxygen at 240 nm. Results were expressed as mM H2O2 reduced·min−1·mg−1 protein. Glutathione peroxidase (GPx) activity was assessed at 340 nm by monitoring nicotinamide adenine dinucleotide phosphate oxidation (NADPH) (ε 6.2 mM−1·cm−1) via glutathione reductase (GR), and results were expressed as µM NADPH oxidised·min−1·mg−1 protein. Similarly, GR activity was assessed by monitoring NADPH oxidation and presented as µM NADPH oxidised·min−1·mg−1 protein.
The enzymatic activity of glutathioneS-transferase, a biotransformation enzyme, was evaluated at 340 nm following the conjugation of GSH (1 mM) with 2,4-dinitrochlorobenzene (CDNB, ε 9.6 mM−1·cm−1). The activity was reported as mM CDNB conjugated min−1 mg−1 protein. For the energy metabolism evaluation, lactate dehydrogenase (LDH) activity was assessed at 340 nm, following the NADH oxidation occurring in converting pyruvate to lactate. Results were expressed as mM NADH oxidised·min−1·mg−1 protein. All kinetic reactions were performed at 30 °C for 3 min using a microplate reader (Multiskan™ Sky-High Microplate Spectrophotometer, Thermo Fisher Scientific, Waltham, MA, USA).
2.7.2. Lipid Peroxidation and Glutathione Content Assessment
The thiobarbituric acid reactive substances (TBARS) were measured for lipid peroxidation evaluation, as proposed by Ottolenghi et al. [37], with adaptations. Cellular- and mitochondrial-enriched lipid fractions were added to 1 mL of thiobarbituric acid (TBA) reagent (37.5% (w/v) trichloroacetic acid (TCA), 0.38% (w/v), TBA and 0.015% (w/v) butylated hydroxytoluene (BHT)), incubated at 100 °C for 15 min., and cooled on ice. The mix was centrifuged at 1.600 g for 10 min., the supernatant was collected, and absorbance was read at 532 nm. Malondialdehyde (MDA) levels were calculated for lipid peroxidation estimation (ε 1.56 × 10⁵ M−1·cm−1), and results were presented as µM MDA mg−1 protein.
For evaluation of the cellular redox state, the reduced (GSH) and oxidised glutathione (GSSG) ratio was assessed, following the method by Hissin and Hilf [38], with modifications by Silva et al. [31], using ortho-phthalaldehyde (OPT) as a fluorochrome. Calibration curves were used to calculate GSH and GSSG concentrations. Fluorescence was measured at 339 nm (excitation) and 426 nm (emission). Results were expressed as the GSH/GSSG ratio.
2.8. Renal Lipid Profile Evaluation
2.8.1. Lipid Crude Isolation
Lipid crude from mitochondria-rich fractions was extracted using the modified Bligh and Dyer [39] method. Briefly, 2–3 mg of mitochondrial protein was mixed with H2O to a final volume of 800 µL, 2 mL of methanol, and agitated for 5 min. Then, 1 mL of chloroform was added to the mix under agitation, followed by centrifugation at 2000 g for 5 min. The supernatant was collected, treated with chloroform and water, vortexed, and centrifuged again. The organic phase was separated, dried under a nitrogen stream, and stored at −20 °C for further analysis.
2.8.2. Phospholipid Quantification Assay
Phospholipid (PL) content was quantified using the phosphorus assay method proposed by Bartlett and Lewis [40]. A volume of 650 µL of perchloric acid (70%) was added to 50 µL of lipid crude, previously dried under a nitrogen stream, and vortexed. The mixture was incubated for 2 h at 180 °C in a heating block system, cooled on ice before the addition of 3300 µL of H2O, 500 µL of ammonium molybdate (10% w/v) and 500 µL ascorbic acid (2.5% w/v), and incubated for another 10 min., at 100 °C. Absorbance at 800 nm was measured after the construction of a calibration curve of phosphate standard that underwent equivalent sample treatment.
2.8.3. Fatty Acid Analysis
A base-catalysed reaction was followed to prepare fatty acid methyl esters (FAME) [41]. Lipid-enriched fractions (10 µmol) were dried under nitrogen flow, followed by the addition of 200 µL of methanolic potassium hydroxide (2 M) and a methylated C19:0 internal standard (3 µg/mL in hexane). After vigorous vortexing for 2 min., 2 mL of NaCl solution (10 g/L) was added to the mix, which was then centrifugated at 900 g for 5 min. The organic phase was collected, dried under nitrogen, and reconstituted in 100 µL of hexane, for further analysis. GC-MS was employed to separate and identify the FAME. The analysis was performed using a Trace GC Ultra with a Polaris Q mass spectrometer operated in full scan mode (ThermoScientific, Waltham, MA, USA), and a DB-FFAP column (30 m × 0.32 mm, 0.25 µm film thickness). FAME samples (2 µL) were automatically injected in splitless mode (splitless time: 1 min.), using a CombiPAL autosampler (CTC Analytics AG, Zwingen, Switzerland), with helium as the carrier gas at a flow rate of 1.4 mL/min. The injector and ion source temperatures were set at 220 °C. The temperature programme started at 58 °C (2 min. hold), increased to 160 °C at 25 °C/min., then to 210 °C at 2 °C/min., and finally to 225 °C at 20 °C/min., with a 20 min. hold.
Fatty acid identification was achieved by comparing retention times and mass spectra with commercial FAME standards (Supelco 37 Component FAME Mix; Sigma-Aldrich, St. Louis, MO, USA). Data acquisition and results treatment were performed with Xcalibur data system 2.0 (ThermoScientific, Waltham, MA, USA). Relative fatty acid abundance was calculated by dividing each peak area by the sum of all identified fatty acid areas. All values were normalised to the area of the internal standard (C19:0). The peroxidability index (PI) and double bond index (DBI) were calculated as described elsewhere [42].
2.9. Statistical Analysis
All statistical analyses were conducted using GraphPad Prism version 10 (GraphPad Software, San Diego, CA, USA) and IBM SPSS Statistics version 30.0.0.0 (IBM Corp., Armonk, NY, USA). Assessments and analyses were performed on coded samples, with unblinding conducted after their completion. To assess the suitability of data for parametric testing, normality was tested using the Shapiro–Wilk test. Subsequently, the Brown–Forsythe test was applied to evaluate the homogeneity of variances across groups. When both assumptions of normal distribution and homogeneity of variances were verified, a one-way ANOVA was conducted. Post hoc comparisons were performed using Sidak’s multiple comparison test to evaluate specific group differences. When data did not meet the assumptions required for parametric testing, the non-parametric Kruskal–Wallis test was applied, followed by Dunn’s test for multiple comparisons. For repeated measures data, namely food and water consumption, a mixed-effects model was used, with a Geisser–Greenhouse correction. Tukey’s post hoc was used to compare means across time points and treatment groups. For the evaluation of histological lesion scores among different experimental conditions, the chi-square test was applied. Differences were considered statistically significant at p < 0.05. Outlier data points were identified and excluded based on the Grubbs’ test (α = 0.05).
3. Results
3.1. Characterisation of PE MPs and f-PE MPs
The physicochemical properties of PE and f-PE MPs were evaluated. The infrared spectral profiles obtained by FTIR (Figure S1G,H) confirmed that both materials exhibited the characteristic vibrational features of PE, including the expected C–C and C–H bonds associated with the repeating ethylene backbone. No additional absorption bands indicative of chemical modification were significantly detected, and the spectra matched those described for standard PE in previous reports [43,44]. The principal peaks and their assignments are summarised in Table S1. Morphological assessment using SEM showed that both particle types possessed a spherical shape (Figure S1A,B,D,E). Size analysis revealed comparable diameter distributions, with f-PE MPs averaging 29.4 2.2 µm and PE MPs 28.3 2.1 µm (Figure S1C,F). Surface charge analysis demonstrated that both materials carried a negative zeta potential measured at −39.14 mV for f-PE MPs and −42.83 mV for PE MPs.
3.2. Fluorescent PE-MP Exposure Alters Organ Weight and Reduces Weight Gain in Mice
Despite fluctuations in the values collected during the experimental period, water and food consumption showed no statistically significant differences (Figure S2). The animals exposed to the highest concentration of f-PE MPs were the only experimental group to show a statistically significant decrease in weight gain (CTL vs. f-PE MPs 0.006%, p = 0.0114), although a trend towards reduced weight gain was observed in all experimental groups (Table S2).
The relative organ weight of the kidney was impacted by the presence of PE MPs (Table S2). Kidneys of animals treated with the highest concentration of f-PE MPs showed increased relative weight compared to controls (CTL vs. f-PE MPs 0.006%, p = 0.0004). Similar results were observed for the relative weight of testicles (CTL vs. f-PE MPs 0.006%, p = 0.0002). This pattern was also observed when comparing non-fluorescent PE MPs to their fluorescent counterparts at the highest concentration tested, for the values obtained for kidney and heart relative weight (PE MPs 0.006% vs. f-PE MPs 0.006%, p = 0.0337 for kidneys; p = 0.0028 for heart). Additionally, when comparing the two concentrations of fluorescent microplastics, the kidney, testicle, and heart exhibited increased relative weight (f-PE MPs 0.002% vs. f-PE MPs 0.006%, p = 0.0118 for kidneys; p = 0.0313 for testicles; p = 0.0100 for heart), indicating a fluorescence-dependent response. The liver’s relative weight remained constant across all experimental groups.
3.3. Fluorescent PE MPs Enhance Local Renal Inflammation Without Affecting Classic Markers of Renal Dysfunction
Blood urea nitrogen (BUN) and creatinine, two biomarkers of kidney disease, showed no differences across all experimental groups (Table 1), showing the absence of acute renal dysfunction. Kidney histopathological evaluation revealed significant differences concerning inflammatory infiltrate and tubular injury across experimental groups, as summarised in Table S3. Representative histological images are present in Figure S3. The presence of an increased number of inflammatory infiltrate foci was more frequent in MP-exposed groups, especially in f-PE MPs groups. Notably, in the f-PE MPs 0.006% group, no animal was lesion-free. This suggests a potential pro-inflammatory effect of fluorescent MPs, more marked at higher doses. Concerning tubular injury, although the PE MPs 0.006% group exhibited a high score in some animals, similar results were found between groups, and no statistical differences were detected.
Table 1.
Assessment of serum biomarkers for renal function. CTL—Animals fed standard chow diet without MPs; PE MPs 0.002%—Animals fed standard chow diet with non-fluorescent PE MPs at 0.002% (w/w); PE MPs 0.006%—Animals fed standard chow diet with non-fluorescent PE MPs at 0.006% (w/w); f-PE MPs 0.002%—Animals fed standard chow diet with fluorescent PE MPs at 0.002% (w/w); f-PE MPs 0.006%—Animals fed standard chow diet with fluorescent PE MPs at 0.006% (w/w). Statistical analysis was performed using one-way ANOVA followed by Sidak’s multiple comparisons test. In the table, values sharing at least one common letter are not significantly different (p > 0.05). Values with no letters in common differ significantly (p < 0.05). Values are means SD (n 3).
3.4. PE MPs Exposure Alters Non-Phosphorylating Mitochondrial Respiration and Impairs Oxidative Phosphorylation Capacity in Renal Mitochondria
ROUTINE respiration, corresponding to oxygen consumption under physiological conditions, was reduced following exposure to both types and concentrations of MPs (CTL vs. PE MPs 0.002%, p = 0.0002; CTL vs. PE MPs 0.006%, p = 0.0004; CTL vs. f-PE MPs 0.002%, p = 0.0006; CTL vs. f-PE MPs 0.006%, p = 0.0125) (Figure 1A).
Figure 1.
High-resolution mitochondrial respirometry evaluation in the kidney from mice exposed to PE-MPs. (I). Schematic representation of the substrate uncoupler inhibitor titration (SUIT) protocol applied to kidney samples. Mitochondrial coupling states are depicted in green and red and described on the Y-axis of the representation. The ET-pathway control state following each titration is presented on the X-axis. Before the application of the SUIT protocol, bioenergetic parameters were assessed at baseline (classic state 1—(A) R: ROUTINE Respiration). SUIT protocol: 1—5 mM pyruvate and 1 mM malate ((B) LCI: CI-linked LEAK respiration, classic State 2); 2—1 mM ADP ((E)—PCI: CI-linked OXPHOS capacity, classic State 3); 3—5 mM succinate ((G)—PCI+II: CI + II-linked OXPHOS capacity, classic State 3); 4—2 µM rotenone ((F) PCII: CII-linked OXPHOS capacity, classic State 3); 5—5 µM oligomycin ((C) LOmy CII: CII-linked LEAK respiration with inhibition of ATP synthase, classic State 4); 6—5 µM antimycin A (ROX—residual oxygen consumption—non-mitochondrial respiration); 7—0.5 mM TMPD (+2 mM Ascorbate) ((D) LOmy CIV: CIV-linked LEAK respiration with inhibition of ATP synthase, classic State 4); 8—20 mM sodium azide. CTL—Animals fed standard chow diet without MPs; PE MPs 0.002%—Animals fed standard chow diet with non-fluorescent PE MPs at 0.002% (w/w); PE MPs 0.006%—Animals fed standard chow diet with non-fluorescent PE MPs at 0.006% (w/w); f-PE MPs 0.002%—Animals fed standard chow diet with fluorescent PE MPs at 0.002% (w/w); f-PE MPs 0.006%—Animals fed standard chow diet with fluorescent PE MPs at 0.006% (w/w). Statistical analysis was performed using one-way ANOVA followed by Sidak’s multiple comparisons test. Values are means SD (n 6), with two replicates (* p < 0.05; ** p < 0.01; *** p < 0.001; **** p < 0.0001).
This decrease was more pronounced in samples exposed to non-fluorescent particles, despite no statistical significance when comparing with their fluorescent counterparts. The oxygen consumption rate observed in the presence of reducing substrates for the different complexes, without the protonmotive force for ATP synthesis, depends on the flux of H+ across the inner mitochondrial membrane caused by inherent uncoupling. This allows for the assessment of the non-phosphorylating mitochondrial resting state, known as the LEAK state, which corresponds to the classic state 2.
CI,- CII-, and CIV-linked LEAK respiration show different oxygen flux patterns in the different experimental groups. LEAK respiration supported by CI showed an equivalent pattern to ROUTINE respiration results (CTL vs. PE MPs 0.002%, p = 0.0089; CTL vs. PE MPs 0.006%, p = 0.0057; CTL vs. f-PE MPs 0.002%, p = 0.0109; and CTL vs. f-PE MPs 0.006%, p = 0.0082) (Figure 1B). This trend was sustained when evaluating CII-dependent LEAK respiration (CTL vs. PE MPs 0.002%, p = 0.0235; CTL vs. PE MPs 0.006%, p = 0.0027; CTL vs. f-PE MPs 0.002%, p = 0.0015; CTL vs. f-PE MPs 0.006%, p = 0.0069) (Figure 1C). Complex IV-supported oxygen flux was increased in the lowest concentration of PE MPs (CTL vs. PE MPs 0.002%, p = 0.046) (Figure 1D).
To asses s mitochondria’s maximal generation capacity of a protonmotive force for ATP production, the so-called oxidative phosphorylation (OXPHOS) capacity, conditions of saturated ADP and oxygen concentrations were used, under the support of complex substrates. All the groups exposed to microplastics, despite the type or concentration of MPs tested, showed a decreased oxygen consumption rate at the different ET pathway control states compared to the control group (p < 0.0001) (Figure 1E–G).
3.5. Exposure to Both Fluorescent and Non-Fluorescent PE-MPs Increases Mitochondrial Mass but Impairs Electron Transport Chain Activity in Kidney Mitochondria
The enzymatic activity of Complex I appears to be reduced across all treatments in comparison to the control group (Figure 2A). Nevertheless, this decrease did not reach statistical significance. All experimental groups presented a diminution in Complex II activity in kidney mitochondrial fractions when compared with the control group (CTL vs. PE MPs 0.002% p < 0.0001; CTL vs. PE MPs 0.006% p < 0.0001; CTL vs. f-PE MPs 0.002% p < 0.0001; CTL vs. f-PE MPs 0.006% p < 0.0001) (Figure 2B). Animals exposed to fluorescent particles showed a diminution of Complex II activity compared to animals treated with non-fluorescent microplastics for the same concentration.
Figure 2.
Impact of PE MPs, fluorescent and non-fluorescent, on mitochondrial respiratory complexes. ((A) Complex I/CS; (B) Complex II/CS; (C) Complex II + III/CS; (D) Complex IV/CS) and citrate synthase (E) enzymatic activities. Citrate synthase was used for normalising the enzymatic activities of the complexes. CTL—Animals fed standard chow diet without MPs; PE MPs 0.002%—Animals fed standard chow diet with non-fluorescent PE MPs at 0.002% (w/w); PE MPs 0.006%—Animals fed standard chow diet with non-fluorescent PE MPs at 0.006% (w/w); f-PE MPs 0.002%—Animals fed standard chow diet with fluorescent PE MPs at 0.002% (w/w); f-PE MPs 0.006%—Animals fed standard chow diet with fluorescent PE MPs at 0.006% (w/w). Statistical analysis was performed using one-way ANOVA followed by Sidak’s multiple comparisons test. Values are means SD (n 6), with two replicates (* p < 0.05; ** p < 0.01; *** p < 0.001; **** p < 0.0001).
This decrease was only statistically significant among groups treated with the higher concentration of MPs (PE MPs 0.002% vs. f-PE MPs 0.002% p = 0.8810; PE MPs 0.006% vs. f-PE MPs 0.006% p = 0.003). A similar pattern was noted for Complex II + III with a decreased activity in all experimental groups compared to the control group (CTL vs. PE MPs 0.002% p = 0.0012; CTL vs. PE MPs 0.006% p = 0.0015; CTL vs. f-PE MPs 0.002% p = 0.0083; CTL vs. f-PE MPs 0.006% p = 0.0052) (Figure 2C). For Complex IV, similarly to Complex II and Complex II + III, animals exposed to microplastics presented a decreased activity (CTL vs. PE MPs 0.002% p = 0.0237; CTL vs. PE MPs 0.006% p = 0.0001; CTL vs. f-PE MPs 0.002% p < 0.0001; CTL vs. f-PE MPs 0.006% p = 0.0019) (Figure 2D). Fluorescence particles lead to a decrease in the enzymatic activity for the lowest concentration of MPs tested (PE MPs 0.002% vs. f-PE MPs 0.002% p = 0.0038). An opposite effect was observed for the highest concentrations of MPs; however, the increase observed was not statistically different (PE MPs 0.006% vs. f-PE MPs 0.006% p = 0.7931).
All treatments presented an increase in citrate synthase activity when compared to the control group (CTL vs. PE MPs 0.002% p = 0.0271; CTL vs. PE MPs 0.006% p = 0.0186; CTL vs. f-PE MPs 0.002% p = 0.0007; CTL vs. f-PE MPs 0.006% p = 0.0009), indicating a higher mitochondrial mass following exposure to both concentrations and types of PE MPs (Figure 2E).
3.6. PE MPs Differentially Modulate Kidney Antioxidant Enzyme Activities and Modulate Energy Metabolism
Total and mitochondrial SOD (tSOD and mtSOD, respectively) were impacted differently by PE MPs and their fluorescent counterparts. Total SOD showed a significant depletion in the renal cytosolic fraction of animals exposed to f-PE MPs 0.0002% (CTL vs. f-PE MPs 0.002%, p = 0.0081) (Figure 3A), whereas mitochondrial SOD was maintained constant across all experimental groups (Figure 3B).
Figure 3.
Renal enzymatic antioxidant system. ((A) tSOD—Total superoxide dismutase; (B) mtSOD—mitochondrial superoxide dismutase; (C) CAT—catalase; (D) GPx—glutathione peroxidase; (E) GR—glutathione reductase), phase II biotransformation enzymes ((F) GST—glutathione-S-transferase) and metabolic enzymes ((G) LDH—lactate dehydrogenase) response to PE MPs. CTL—Animals fed standard chow diet without MPs; PE MPs 0.002%—Animals fed standard chow diet with non-fluorescent PE MPs at 0.002% (w/w); PE MPs 0.006%—Animals fed standard chow diet with non-fluorescent PE MPs at 0.006% (w/w); f-PE MPs 0.002%—Animals fed standard chow diet with fluorescent PE MPs at 0.002% (w/w); f-PE MPs 0.006%—Animals fed standard chow diet with fluorescent PE MPs at 0.006% (w/w). Statistical analysis was performed using one-way ANOVA followed by Sidak’s multiple comparisons test. Values are means SD (n 6), with two replicates (* p < 0.05; ** p < 0.01; *** p < 0.001; **** p < 0.0001).
Catalase activity was found diminished in the kidneys of animals exposed to microplastics, but only the groups exposed to the highest concentration of PE MPs and the lowest concentration of f-PE MPs reached statistical significance (CTL vs. PE MPs 0.006%, p = 0.0095; and CTL vs. f-PE MPs 0.002% p = 0.0061) (Figure 3C). The highest concentration of f-PE MPs led to an increase in this enzyme activity compared to the lowest one (f-PE MPs 0.002% vs. f-PE MPs 0.006%, p = 0.0360). GR and GPx activity presented different patterns of response. The highest concentration of f-PE MPs presented a higher GPx activity when compared with the remaining groups (CTL vs. f-PE MPs 0.006%, p < 0.0001; PE MPs 0.006% vs. f-PE MPs 0.006%, p < 0.0001; f-PE MPs 0.002% vs. f-PE MPs 0.006%, p < 0.0001) (Figure 3D). GR activity was diminished in MPs-exposed groups, except in the group exposed to the lowest concentration of fluorescent microplastics (CTL vs. PE MPs 0.002%, p = 0.0032; CTL vs. PE MPs 0.006%, p = 0.0010; CTL vs. f-PE MPs 0.006%, p = 0.0062) (Figure 3E). The activity in this group was increased when compared to their non-fluorescent counterparts (PE MPs 0.002% vs. f-PE MPs 0.002%, p = 0.0002). However, the highest concentration of f-PE MPs led to a decreased activity (f-PE MPs 0.002% vs. f-PE MPs 0.006%, p = 0.0004).
Microplastics did not impact renal biotransformation capability as the GST activity was constant across groups compared to control, except for the increase observed in f-PE MPs 0.006—exposed animals compared to the lowest concentration (f-PE MPs 0.002% vs. f-PE MPs 0.006%, p = 0.0403) (Figure 3F). Furthermore, the renal energy metabolism, assessed through LDH activity, was found to be diminished following microplastic exposure (CTL vs. PE MPs 0.006%, p = 0.0019; CTL vs. f-PE MPs 0.002%, p = 0.0003; CTL vs. f-PE MPs 0.006%, p = 0.0103) (Figure 3G).
3.7. Exposure to Low and High Concentrations of PE MPs Induces Oxidative Damage and Redox Imbalance in Kidney Tissues
Lipid peroxidation showed distinct patterns, indicating varying levels of oxidative damage across the renal cellular and mitochondrial fractions. The highest concentration of f-PE MPs led to the highest levels of MDA, in the cellular fraction (CTL vs. f-PE MPs 0.006%, p < 0.0001; PE MPs 0.006% vs. f-PE MPs 0.006%, p < 0.0001; f-PE MPs 0.002% vs. f-PE MPs 0.006%, p < 0.0001) (Table 2). For the mitochondrial fraction, exposure to microplastics increased oxidative damage, as seen by the augmented levels of MDA, although statistical significance was only observed in the PE MPs 0.002% and f-PE MPs 0.006% groups (CTL vs. PE MPs 0.002%, p = 0.0093; CTL vs. f-PE MPs 0.006%, p = 0.0050) (Table 2).
Table 2.
Markers of cellular damage (lipid peroxidation) and redox state (GSH—glutathione reduced, GSSG—glutathione oxidised) evaluation in kidneys harvested from mice exposed to PE MPs. CTL—Animals fed standard chow diet without MPs; PE MPs 0.002%—Animals fed standard chow diet with non-fluorescent PE MPs at 0.002% (w/w); PE MPs 0.006%—Animals fed standard chow diet with non-fluorescent PE MPs at 0.006% (w/w); f-PE MPs 0.002%—Animals fed standard chow diet with fluorescent PE MPs at 0.002% (w/w); f-PE MPs 0.006%—Animals fed standard chow diet with fluorescent PE MPs at 0.006% (w/w). Statistical analysis was performed using one-way ANOVA followed by Sidak’s multiple comparisons test. In the table, values sharing at least one common letter are not significantly different (p > 0.05). Values with no letters in common differ significantly (p < 0.05). Values are means SD (n 6), with two replicates.
A disruption in the redox balance was observed in the group exposed to the highest concentration of non-fluorescent particles, as seen by the increase in GSH and GSSG ratio (CTL vs. PE MPs 0.006%, p = 0.0488; PE MPs 0.002% vs. PE MPs 0.006%, p = 0.0038; PE MPs 0.006% vs. f-PE MPs 0.006%, p = 0.0430) (Table 2).
3.8. Fluorescent PE MPs Affect Mitochondrial Fatty Acid Composition and PUFA Balance
A total of 14 fatty acid species were identified in the renal mitochondrial-enriched fraction, including five saturated (SFA) (Figure 4A), four monounsaturated (MUFA) (Figure 4B), and five polyunsaturated fatty acids (PUFA) (Figure 4C).
Figure 4.
Renal Fatty acid profile of mitochondrial-enriched fractions: (A) Saturated fatty acids (SFA) relative abundance; (B) Monounsaturated fatty acids (MUFA) relative abundance; (C) Polyunsaturated fatty acids (PUFA) relative abundance. C14:0—Myristic acid; C16:0—Palmitic acid; C16:1—Palmitoleic acid; C18:0—Stearic acid; trans-C18:1n-9—Elaidic acid; cis-C18:1n-9—Oleic acid; C18:2n-6—Linoleic acid; C18:3n-3—alpha-linolenic acid; C20:0—Arachidic acid; C20:1n-9—Gondoic acid; C20:2n-6—Eicosadienoic acid; C20:3n-6—Eicosatrienoic acid; C20:4n-6—Arachidonic acid; C24:0—Lignoceric acid. CTL—Animals fed standard chow diet without MPs; PE MPs 0.002%—Animals fed standard chow diet with non-fluorescent PE MPs at 0.002% (w/w); PE MPs 0.006%—Animals fed standard chow diet with non-fluorescent PE MPs at 0.006% (w/w); f-PE MPs 0.002%—Animals fed standard chow diet with fluorescent PE MPs at 0.002% (w/w); f-PE MPs 0.006%—Animals fed standard chow diet with fluorescent PE MPs at 0.006% (w/w). Statistical analysis was performed using one-way ANOVA followed by Sidak’s multiple comparisons test. Values are means SD (n 6), with two replicates (* p < 0.05; ** p < 0.01).
Palmitic acid (C16:0) represented the dominant SFA, with stearic acid (C18:0) as the second most abundant, followed by the lignoceric acid (C24:0). Linoleic acid (C18:2n-6) was the most prevalent PUFA and the dominant n-6 species, with arachidonic acid (C20:4n-6) contributing secondarily. Alpha-linolenic acid was the only n-3 FA identified, detected at levels below 1%. This low abundance was comparable to that of several FA, including myristic acid (C14:0), arachidic acid (C20:0), gondoic acid (C20:1n-9), and eicosadienoic acid (C20:2n-6).
MPs exposure induced minor alterations in mitochondrial FA profile, primarily affecting C18, C20 and C24 species. Lignoceric acid presented a decrease in MP-exposed groups (CTL vs. PE MPs 0.006%, p = 0.0038; CTL vs. f-PE MPs 0.002%, p = 0.0024). Stearic acid levels were increased following exposure to both concentrations of non-fluorescent PE MPs (CTL vs. PE MPs 0.002%, p = 0.018; CTL vs. PE MPs 0.006%, p = 0.0321) and the highest concentration of the fluorescent ones (CTL vs. f-PE MPs 0.006%, p = 0.0034). At the highest concentration, fluorescent particles led to a decrease in elaidic (trans-C18:1n-9) and oleic (cis-C18:1n-9) acids when compared to their non-fluorescent counterparts (PE MPs 0.006% vs. f-PE MPs 0.006%, p = 0.0209) and to their low concentration equivalents (f-PE MPs 0.002% vs. f-PE MPs 0.006%, p = 0.0276), respectively. Among C20 FA, several species were affected: (1) arachidic acid increased in a concentration-dependent manner across both types of MPs tested (PE MPs 0.002% vs. PE MPs 0.006%, p = 0.0109, f-PE MPs 0.002% vs. f-PE MPs 0.006%, p = 0.0265), and when compared with the control group (CTL vs. PE MPs 0.006%, p = 0.0379); (2) gondoic acid was significantly increased in animals exposed to PE MPs 0.006% (CTL vs. PE MPs 0.006%, p = 0.0440); (3) eicosadienoic acid content was the highest in the group exposed to the highest concentration of fluorescent MPs (CTL vs. f-PE MPs 0.006%, p = 0.0204; PE MPs 0.006% vs. f-PE MPs 0.006%, p = 0.0142).
Data presented in Figure 4 were used to quantify the total content of SFA, MUFA, PUFA, as well as n-3 and n-6 PUFA (Table 3). Key lipid ratios were also derived, including PUFA/SFA and n-3/n-6 (Table 3). The levels of SFA, MUFA, n-3 and n-6 species remained constant across all experimental groups, except for total PUFA levels, which present significant depletion at the highest concentration of fluorescent MPs (f-PE MPs 0.002% vs. f-PE MPs 0.006%, p = 0.0384). MPs exposure did not significantly affect the double bond and peroxidability index. Similarly, the PUFA/SFA remained constant across all experimental groups. The higher concentrations for both types of MPs had different effects on n-3/n-6 ratio: non-fluorescent PE MPs led to an increased ratio (PE MPs 0.002% vs. PE MPs 0.006%, p = 0.0369) whereas the fluorescent counterparts led to a depleted one (PE MPs 0.006% vs. f-PE MPs 0.006%, p = 0.0061).
Table 3.
Lipid characteristics of mitochondrial-enriched fractions isolated from the kidneys of mice treated with MPs. CTL—Animals fed standard chow diet without MPs; PE MPs 0.002%—Animals fed standard chow diet with non-fluorescent PE MPs at 0.002% (w/w); PE MPs 0.006%—Animals fed standard chow diet with non-fluorescent PE MPs at 0.006% (w/w); f-PE MPs 0.002%—Animals fed standard chow diet with fluorescent PE MPs at 0.002% (w/w); f-PE MPs 0.006%—Animals fed standard chow diet with fluorescent PE MPs at 0.006% (w/w). Statistical analysis was performed using one-way ANOVA followed by Sidak’s multiple comparisons test. In the table, values sharing at least one common letter are not significantly different (p > 0.05). Values with no letters in common differ significantly (p < 0.05). Values are means SD (n 6).
4. Discussion
Risk assessments on MPs’ toxicity often rely on unfitted models, which can misrepresent their true impact on human health [45,46]. In this study, we compared the toxic effects of an inadequate model—fluorescent PE MPs—with a more suitable one—non-fluorescent PE MPs. Using renal mitochondria as targets for toxicity evaluation, we used an in vivo model to assess how different MPs can influence the toxicological outcome. In this study, we demonstrated that PE MPs, when administered to mice for 28 days, impaired renal physiology by disrupting mitochondrial bioenergetics, compromising renal antioxidant defence system and promoting mitochondrial membrane lipid remodelling, leading to kidney injury reflected by local inflammation. Overall, these results indicate that PE MPs induce mitotoxicty, highlighting mitochondria as central targets in MP-induced renal toxicity. Notably, fluorescent PE MPs consistently induced stronger alterations across several endpoints when compared with their non-fluorescent counterparts, suggesting that fluorescent labelling itself may influence particle biological behaviour and toxicological outcomes, although the precise mechanisms underlying these differences remain unclear. Importantly, the chemical identity and conjugation strategy of the fluorophore used in the commercially available particles are not disclosed by the manufacturer, limiting further mechanistic interpretation of these effects. Nonetheless, fluorescent labelling may alter particle physicochemical properties and interactions with biological systems, potentially contributing to the enhanced mitochondrial and oxidative alterations observed with fluorescent MPs. In addition, possible dye leakage under biological conditions cannot be excluded.
The physiologic role of the kidney may increase its susceptibility to MPs, with previous studies reporting renal structure alterations following particle exposure [23,47]. Consistent with previous reports, our results revealed local inflammatory infiltrates and an increase in kidney weight, especially with fluorescent MPs. However, serum biomarkers of kidney tissue injury, namely BUN and serum creatinine, remained unchanged. Several studies have reported functional abnormalities following exposure to MPs, but the findings are inconsistent. Meng and collaborators [10] observed increased BUN and creatinine levels in mice exposed to four sizes of MPs (50, 300, 600 nm, and 4 µm) for four weeks, whereas Tang et al. [48] reported an opposite trend in a similar model. Together, these findings suggest that the observed renal local damage was likely insufficient to cause systemic alterations detectable by classical renal biomarkers.
Mitochondrial function has emerged as a key target in MPs-induced toxicity, with current findings underscoring the importance of investigating mitochondrial health in the kidney [22,23,24]. Mitochondrial bioenergetic capacity and efficiency can be assessed through the evaluation of mitochondrial respiration, providing an assessment of overall mitochondrial function [49,50]. In our study, both fluorescent and non-fluorescent MPs impaired mitochondrial respiration, reducing oxygen flux in most coupling control states. This reduction may reflect functional alterations in electron transport chain complexes or disturbances in membrane potential [51]. Furthermore, the decreased OXPHOS capacity detected—measured as mitochondrial oxygen flux under ADP-saturated conditions—may suggest a compromise ATP-generating potential, which can negatively impact upstream cellular processes. Changes in ATP content have been described in the literature following MPs exposure, indicating that the particles may impact mitochondrial respiration and, consequently, chemical energy production [9,19,52].
Our results revealed that evaluation of the electron transfer pathways control states relying on CI and CII showed similar patterns, suggesting functional impairment at both complexes. This dysfunction likely contributes to the observed reduction in endogenous mitochondrial respiratory activity, as reflected in diminished ROUTINE respiration. Although a decrease in CIV-dependent LEAK respiration was not observed, suggesting no immediate dysfunction at this complex level, this did not prevent the potential impairment of NADH- and FADH2-dependent pathways by PE MPs. In fact, an increase in LEAK respiration was observed at the lowest concentration of non-fluorescent particles. Since the efficacy of OXPHOS relies on the tight coupling of the electron transport chain and ADP phosphorylation, any uncoupling between these processes can compromise mitochondrial efficiency. Nonetheless, under physiologic conditions, OXPHOS is not entirely coupled, with a small number of protons bypassing ATP synthase and re-entering the matrix without generating ATP, a process known as proton leak [53]. Thus, an increase in LEAK respiration may indicate uncoupling, reflecting mitochondrial stress or damage. This has been widely reported under exposure to environmental stressors, including MPs. For instance, Peng and collaborators [54] described an augmented proton leak in A549 and Caco-2 cell lines following exposure to PS MPs, likely due to damage to ETC complexes or the inner mitochondrial membrane. Together, these findings support the hypothesis that MPs compromise renal mitochondrial bioenergetics, not only by impairing OXPHOS capacity, but possibly also by promoting uncoupling, ultimately disrupting energy homeostasis at the cellular level.
Enzymatic assays confirmed respiratory dysfunction and revealed particle-specific effects. Activities of Complex II and IV were reduced with toxicant exposure, particularly with fluorescent MPs, whereas Complex I remained unchanged. Complex II activity results support respiratory measurements that indicate dysfunction at this complex. This complex, also known as succinate dehydrogenase (SDH), plays a dual role in the mitochondrial electron transport chain and the tricarboxylic acid cycle, catalysing the oxidation of succinate to fumarate and contributing to reducing equivalents to ETC via FADH2 [53]. Micro- and nano-plastics seem to perturb different metabolic pathways of the TCA cycle. Consistent with this, Lin et al. [55] reported malate accumulation alongside decreased levels of fumarate. Furthermore, in an investigation by Tao et al. [56], a decrease in SDH activity was similarly reported following mice exposure to PS MPs, indicating that MPs exposure disturbs oxidative phosphorylation and the citrate cycle in the mitochondria.
Complex IV and Complex I activity did not fully align with the findings from high-resolution respirometry. While respiratory measurements suggested CI impairment and unaffected CIV activity, enzymatic assays revealed no alterations in CI activity, likely due to high data variability; however, they did reveal a decrease in CIV activity, particularly in groups exposed to fluorescent MPs. Nonetheless, mitochondrial respiration relies on the coordinated function of multiple key processes, and not exclusively on the integrity of the electron transport chain [57,58]. Indeed, findings on MPs’ renal mitotoxicity have revealed that MPs impacted the expression of different protein subunits of Complex IV, namely cytochrome c oxidase subunit 3 (MT-CO3), supporting our findings [22]. These results suggest that PE MPs, interfere with the integrity and function of key components of the ETC, thereby partially contributing to the compromised OXPHOS capacity observed. These effects were stronger in the exposure to fluorescent MPS, suggesting that fluorescence labelling influences stress responses at the mitochondrial level, probably as a consequence of altered surface properties. Interestingly, citrate synthase activity was increased in exposed groups, which may suggest mitochondrial biogenesis as a compensatory response to functional impairment, a phenomenon also described under other mitochondrial stressors [59]. Nonetheless, considering that citrate synthase activity was used as an indirect marker of mitochondrial content, these findings should be interpreted with caution.
The fatty acid composition of mitochondrial membranes shapes their biophysical properties, including fluidity and permeability, ultimately affecting the organelle’s function [60,61]. In our study, fatty acid remodelling was primarily observed at higher concentrations of MPs, with increases in C18:0 and C20:0 content and a decrease in C24:0 levels. Since SFA tend to rigidify biological membranes compared with unsaturated species, these changes likely reflect stress-induced remodelling of the mitochondrial membrane [60]. The depletion in C24:0, a very-long-chain fatty acid (VLCFA), may represent an adaptive response to counterbalance the increased rigidity from higher SFA incorporation and preserve mitochondrial function. The decrease in this VLCFA in mitochondria may also suggest perturbations in fatty acid elongation or mitochondrial import pathways. Indeed, previous studies have reported that MPs induce dysregulation of elongation-related genes such as Elovl5 (Elongation of very-long-chain fatty acid 5) [62,63]. Furthermore, MPs appear to dysregulate mitochondrial-associated endoplasmic reticulum membranes (MAMs), potentially impairing lipid transport from the endoplasmic reticulum to the mitochondria [64]. In parallel, the increase in unsaturated species, namely in C20:1n-9 and C20:2n-6, further supports a compensatory attempt to restore membrane fluidity under MP-induced stress. The total content of SFA, MUFA and PUFA remained constant across all experimental groups, reinforcing that, despite shifts in individual FA, mitochondrial membrane homeostasis was sustained and the membrane remodelling was adaptive rather than disruptive. Thus, the changes in mitochondrial membrane composition do not seem to cause the mitochondrial dysfunction observed. Nonetheless, these interpretations should be considered with caution, since mitochondrial-enriched fractions were obtained through differential centrifugation, a methodology that may allow residual contamination from other cellular compartments.
Beyond bioenergetics and lipid remodelling, oxidative stress is a major mechanism of MP-induced toxicity [7,14]. In our study, MPs impacted the renal antioxidant defence system in a concentration- and particle-type-dependent manner, with higher concentrations and fluorescent MPs exerting the strongest effect, reinforcing the influence of fluorescence labelling on enhancement of toxic effects. Total SOD activity was decreased following exposure, with CAT activity following a similar trend. This coordinated reduction is likely linked to their functional coupling, since the product of SOD activity (H2O2) serves as the substrate for CAT. A similar pattern of enzymatic response has been widely observed across various organs in murine models exposed to MPs [65,66,67]. These changes suggest a failure of the primary enzymatic defence against ROS, consistent with the overproduction of oxidative species frequently observed in MPs-induced toxicity [18,68]. Interestingly, mitochondrial SOD remained unchanged across all experimental groups, suggesting that, despite mitochondrial dysfunction, the intrinsic mitochondrial antioxidant defence was not directly compromised. Nevertheless, elevated MDA levels in the mitochondrial fraction indicate lipid peroxidation and oxidative damage at these levels, likely as a downstream consequence of impaired mitochondrial function [69]. Similar findings have been reported in human-derived cellular models exposed to MPs, supporting lipid peroxidation as a relevant mechanism underlying MPs-induced cellular toxicity [70].
The glutathione system plays a central role in maintaining cellular redox balance. Despite the importance of this biochemical pathway in redox homeostasis, studies on MPs’ toxicity have overlooked its full assessment. Most murine studies measure only GSH levels, often reporting a decrease in its content without evaluating the coordinated activity of GPx and GR [9,14]. In our study, GR activity decreased following exposure to MPs, except at the lowest concentration of fluorescent MPs. Despite this decrease, the GSH/GSSG ratio remained constant across all groups, except at the highest concentration of non-fluorescent particles, indicating that alterations in glutathione-cycle enzymes may not directly translate into shifts in redox status. This pattern suggests activation of compensatory mechanisms, such as the up-regulation of GSH biosynthesis and modulation of other thiol-dependent systems (e.g., thioredoxin), which can buffer oxidative insults and maintain redox balance [71]. GPx activity remained mostly unchanged, except in the high-concentration fluorescent MPs group, where an increase was detected alongside elevated cellular MDA, suggesting an adaptive response to lipid peroxidation [72]. Interestingly, despite changes in GPx activity, the GSH/GSSG ratio remained stable in this group, supporting the aforementioned conservation of cellular redox homeostasis despite enzymatic alterations.
GST activity also remained functional, reinforcing that detoxification capacity was not entirely lost under MP-induced stress. In contrast, intracellular LDH activity decreased with MPs exposure, likely reflecting renal cell damage and enzyme leakage, as LDH release into the circulation is a well-recognised marker of cellular injury [73]. Consistent with this, Cheng et al. [74] described an augmented content of serum LDH following PP-MPs exposure for 28 days in mice. Given the partial reliance of renal structures on anaerobic metabolism for energy production, changes in LDH activity may additionally suggest an impacted carbohydrate metabolism, although a more comprehensive investigation is required to confirm this. Taken together, our findings indicate that MPs’ exposure induced oxidative stress, as evidenced by increased lipid peroxidation and changes in antioxidant enzyme activities, particularly under high concentrations of fluorescent PE MPs, despite sustained cellular redox balance.
Overall, our findings indicate that MPs’ exposure compromises renal mitochondrial function at multiple levels: oxidative phosphorylation, membrane composition and antioxidant defences, with fluorescent MPs inducing stronger toxic effects than non-fluorescent ones, highlighting the much-needed improvement in the MP models for toxicological assessment, diving into the potential toxicity of the fluorophores used in plastic labelling. The observed oxidative stress appears both a cause and a consequence of mitochondrial dysfunction, reinforcing the central role of mitochondria in mediating MP-induced renal injury. Importantly, our findings are consistent with evidence from human-derived cellular models, demonstrating that both micro- and nano-plastics can induce metabolic stress responses, mitochondrial dysfunction, and oxidative damage, further supporting mitochondrial impairment as a central mechanism underlying MPs-induced toxicity and reinforcing the potential relevance of these findings for human health [75,76].
5. Conclusions
In summary, this study demonstrates that mitochondria can be considered key targets of MPs’ toxicity in the kidney, revealing that exposure to both fluorescent and non-fluorescent MPs impairs mitochondrial bioenergetics, changes respiratory complexes’ enzymatic activities, and disrupts redox homeostasis. Some of these effects seem to be more prominent following exposure to fluorescence particles. Moreover, our findings revealed that the kidney, due to its physiological and metabolic characteristics, should be accounted as a critical target of MP exposure in a similar way to the liver and the gut. These results highlight the need to refine the MP model in toxicological testing to better reflect real environmental exposure conditions, as well as to adopt integrative, multi-organ, and multidisciplinary approaches that capture the impact of MPs on organisms as a whole.
Supplementary Materials
The following supporting information can be downloaded at https://www.mdpi.com/article/10.3390/microplastics5020113/s1, Figure S1: Characterisation of PE MPs. (A) SEM image of PE MPs at 200× magnification; (B) SEM image of PE MPs at 1000× magnification; (C) Size distribution of PE MPs; (D) SEM image of f-PE MPs at 200× magnification; (E) SEM image of f-PE MPs at 1000× magnification; (F) Size distribution of f-PE MPs; (G) FTIR spectrum of PE MPs; (H) FTIR spectrum of f-PE MPs; Figure S2: Effect of PE-MPs on animals’ food (A) and water (B) intake. Weekly food and water consumption was monitored during the experiment. CTL—Animals fed standard chow diet without MPs; PE MPs 0.002%—Animals fed standard chow diet with non-fluorescent PE MPs at 0.002% (w/w); PE MPs 0.006%—Animals fed standard chow diet with non-fluorescent PE MPs at 0.006% (w/w); f-PE MPs 0.002%—Animals fed standard chow diet with fluorescent PE MPs at 0.002% (w/w); f-PE MPs 0.006%—Animals fed standard chow diet with fluorescent PE MPs at 0.006% (w/w). Statistical analysis was performed using a mixed-effects model with Geisser–Greenhouse correction, followed by Tukey’s multiple comparisons test. Values are means ± SD (n = 6), with two replicates (* p < 0.05; ** p < 0.01; *** p <0.001; **** p < 0.0001). Figure S3: Representative images of kidney histopathological changes identified in mice exposed to PE MPs and f-PE MPs. (A) Kidney with tubular cell injury characterised by mild degeneration (Group f-PE MPs 0.002%); (B) Presence of multifocal inflammatory cell aggregates, characterised by the presence of mononuclear cells (Group PE MPs 0.006%). CTL—Animals fed standard chow diet without MPs; PE MPs 0.002%—Animals fed standard chow diet with non-fluorescent PE MPs at 0.002% (w/w); PE MPs 0.006%—Animals fed standard chow diet with non-fluorescent PE MPs at 0.006% (w/w); f-PE MPs 0.002%—Animals fed standard chow diet with fluorescent PE MPs at 0.002% (w/w); f-PE MPs 0.006%—Animals fed standard chow diet with fluorescent PE MPs at 0.006% (w/w). Table S1: Main absorption bands of non-fluorescent polyethylene microplastics (PE MPs) and fluorescent polyethylene microplastics (f-PE MPs) and their assignments. Table S2: Effect of two fluorescent and non-fluorescent PE MPs concentrations on ponderal gain and mean relative organ weight. CTL—Animals fed standard chow diet without MPs; PE MPs 0.002%—Animals fed standard chow diet with non-fluorescent PE MPs at 0.002% (w/w); PE MPs 0.006%—Animals fed standard chow diet with non-fluorescent PE MPs at 0.006% (w/w); f-PE MPs 0.002%—Animals fed standard chow diet with fluorescent PE MPs at 0.002% (w/w); f-PE MPs 0.006%—Animals fed standard chow diet with fluorescent PE MPs at 0.006% (w/w). Statistical analysis was performed using one-way ANOVA followed by Sidak’s multiple comparisons test. In the table, values sharing at least one common letter are not significantly different (p > 0.05). Values with no letters in common differ significantly (p < 0.05). Values are means ± SD (n = 6). Table S3: Percentage and number of animals with inflammatory infiltrate and tubular injury, and respective scores. PE MPs 0.002%—Animals fed standard chow diet with non-fluorescent PE MPs at 0.002% (w/wm/m); PE MPs 0.006%—Animals fed standard chow diet with non-fluorescent PE MPs at 0.006% (w/wm/m); f-PE MPs 0.002%—Animals fed standard chow diet with fluorescent PE MPs at 0.002% (w/wm/m); f-PE MPs 0.006%—Animals fed standard chow diet with fluorescent PE MPs at 0.006% (w/wm/m). Statistical analysis was performed using the chi-square test. In the table, values sharing at least one common letter are not significantly different (p > 0.05). Values with no letters in common differ significantly (p < 0.05). Values are means ± SD (n = 6).
Author Contributions
Conceptualization, M.G.S., M.M.O. and F.P.; methodology, M.G.S., A.G., S.C.N., M.F., M.M.O. and F.P.; software, M.G.S.; validation, M.G.S., A.G., S.C.N., M.F., M.M.O. and F.P.; formal analysis, M.G.S.; investigation, M.G.S.; resources, A.G., S.C.N., M.F., M.M.O. and F.P.; data curation, M.G.S.; writing—original draft preparation, M.G.S.; writing—review and editing, M.G.S., A.G., S.C.N., M.F., M.M.O. and F.P.; visualisation, M.G.S.; supervision, M.M.O. and F.P.; project administration, M.M.O. and F.P.; funding acquisition, M.G.S., M.M.O. and F.P. All authors have read and agreed to the published version of the manuscript.
Funding
Mónica G. Silva benefited from PhD grant (UI/BD/151320/2021) by National Funds through FCT—Portuguese Foundation for Science and Technology. This work was also financially supported by Chemistry Research Centre of Vila Real (CQ-VR) (UIDB/00616/2020 + UIDP/00616/2020).
Institutional Review Board Statement
The animal study protocol was approved by the University of Trás-os-Montes and Alto Douro Ethics Committee (ORBEA) and the Portuguese Veterinary Directorate (DGAV) (approval no. 0421/000/000/2023, approved on 28 March 2023), according to the Portuguese (Artigo 44º, Decreto-Lei n°113/2013, 7 August) and European (EU Directive 2010/63/EU) Legislation.
Data Availability Statement
The raw data supporting the conclusions of this article will be made available by the authors on request.
Acknowledgments
The authors would like to express their sincere gratitude to Beatriz Medeiros and Paula Oliveira for their valuable assistance during the animal procedures.
Conflicts of Interest
The authors declare no conflicts of interest.
References
- Prata, J.C.; Da Costa, J.P.; Lopes, I.; Andrady, A.L.; Duarte, A.C.; Rocha-Santos, T. A One Health perspective of the impacts of microplastics on animal, human and environmental health. Sci. Total Environ. 2021, 777, 146094. [Google Scholar] [CrossRef] [PubMed]
- World Health Organization. Dietary and Inhalation Exposure to Nano- and Microplastic Particles and Potential Implications for Human Health; World Health Organization: Geneva, Switzerland, 2022. [Google Scholar]
- Da Silva Brito, W.A.; Mutter, F.; Wende, K.; Cecchini, A.L.; Schmidt, A.; Bekeschus, S. Consequences of nano and microplastic exposure in rodent models: The known and unknown. Part. Fibre Toxicol. 2022, 19, 28. [Google Scholar] [CrossRef] [PubMed]
- Silva, M.G.; Oliveira, M.M.; Peixoto, F. Assessing micro and nanoplastics toxicity using rodent models: Investigating potential mitochondrial implications. Toxicology 2023, 499, 153656. [Google Scholar] [CrossRef]
- Zingaro, F.; Gianoncelli, A.; Ceccone, G.; Birarda, G.; Cassano, D.; La Spina, R.; Agostinis, C.; Bonanni, V.; Ricci, G.; Pascolo, L. Morphological and lipid metabolism alterations in macrophages exposed to model environmental nanoplastics traced by high-resolution synchrotron techniques. Front. Immunol. 2023, 14, 1247747. [Google Scholar] [CrossRef]
- Huang, J.; Sun, X.; Wang, Y.; Su, J.; Li, G.; Wang, X.; Yang, Y.; Zhang, Y.; Li, B.; Zhang, G.; et al. Biological interactions of polystyrene nanoplastics: Their cytotoxic and immunotoxic effects on the hepatic and enteric systems. Ecotoxicol. Environ. Saf. 2023, 264, 115447. [Google Scholar] [CrossRef]
- Li, X.; Zhang, T.; Lv, W.; Wang, H.; Chen, H.; Xu, Q.; Cai, H.; Dai, J. Intratracheal administration of polystyrene microplastics induces pulmonary fibrosis by activating oxidative stress and Wnt/β-catenin signaling pathway in mice. Ecotoxicol. Environ. Saf. 2022, 232, 113238. [Google Scholar] [CrossRef] [PubMed]
- Wei, Z.; Wang, Y.; Wang, S.; Xie, J.; Han, Q.; Chen, M. Comparing the effects of polystyrene microplastics exposure on reproduction and fertility in male and female mice. Toxicology 2022, 465, 153059. [Google Scholar] [CrossRef]
- Fan, X.; Wei, X.; Hu, H.; Zhang, B.; Yang, D.; Du, H.; Zhu, R.; Sun, X.; Oh, Y.; Gu, N. Effects of oral administration of polystyrene nanoplastics on plasma glucose metabolism in mice. Chemosphere 2022, 288, 132607. [Google Scholar] [CrossRef]
- Meng, X.; Zhang, J.; Wang, W.; Gonzalez-Gil, G.; Vrouwenvelder, J.S.; Li, Z. Effects of nano- and microplastics on kidney: Physicochemical properties, bioaccumulation, oxidative stress and immunoreaction. Chemosphere 2022, 288, 132631. [Google Scholar] [CrossRef]
- Silva, P.H.I.; Mohebbi, N. Kidney metabolism and acid–base control: Back to the basics. Pflügers Arch.—Eur. J. Physiol. 2022, 474, 919–934. [Google Scholar] [CrossRef]
- Jakic, K.; Selc, M.; Razga, F.; Nemethova, V.; Mazancova, P.; Havel, F.; Sramek, M.; Zarska, M.; Proska, J.; Masanova, V.; et al. Long-Term Accumulation, Biological Effects and Toxicity of BSA-Coated Gold Nanoparticles in the Mouse Liver, Spleen, and Kidneys. Int. J. Nanomed. 2024, 19, 4103–4120. [Google Scholar] [CrossRef]
- Wardoyo, A.Y.; Juswono, U.P.; Noor, J.A. Varied dose exposures to ultrafine particles in the motorcycle smoke cause kidney cell damages in male mice. Toxicol. Rep. 2018, 5, 383–389. [Google Scholar] [CrossRef]
- Mu, Y.; Sun, J.; Li, Z.; Zhang, W.; Liu, Z.; Li, C.; Peng, C.; Cui, G.; Shao, H.; Du, Z. Activation of pyroptosis and ferroptosis is involved in the hepatotoxicity induced by polystyrene microplastics in mice. Chemosphere 2022, 291, 132944. [Google Scholar] [CrossRef]
- Yang, S.; Zhang, T.; Ge, Y.; Cheng, Y.; Yin, L.; Pu, Y.; Chen, Z.; Liang, G. Ferritinophagy Mediated by Oxidative Stress-Driven Mitochondrial Damage Is Involved in the Polystyrene Nanoparticles-Induced Ferroptosis of Lung Injury. ACS Nano 2023, 17, 24988–25004. [Google Scholar] [CrossRef]
- Li, Z.; Zhu, S.; Liu, Q.; Wei, J.; Jin, Y.; Wang, X.; Zhang, L. Polystyrene microplastics cause cardiac fibrosis by activating Wnt/β-catenin signaling pathway and promoting cardiomyocyte apoptosis in rats. Environ. Pollut. 2020, 265, 115025. [Google Scholar] [CrossRef] [PubMed]
- Jia, R.; Han, J.; Liu, X.; Li, K.; Lai, W.; Bian, L.; Yan, J.; Xi, Z. Exposure to Polypropylene Microplastics via Oral Ingestion Induces Colonic Apoptosis and Intestinal Barrier Damage through Oxidative Stress and Inflammation in Mice. Toxics 2023, 11, 127. [Google Scholar] [CrossRef]
- Zhang, Y.; Wang, X.; Zhao, Y.; Zhao, J.; Yu, T.; Yao, Y.; Zhao, R.; Yu, R.; Liu, J.; Su, J. Reproductive toxicity of microplastics in female mice and their offspring from induction of oxidative stress. Environ. Pollut. 2023, 327, 121482. [Google Scholar] [CrossRef]
- Ma, Y.; Xu, D.; Wan, Z.; Wei, Z.; Chen, Z.; Wang, Y.; Han, X.; Chen, Y. Exposure to different surface-modified polystyrene nanoparticles caused anxiety, depression, and social deficit in mice via damaging mitochondria in neurons. Sci. Total Environ. 2024, 919, 170739. [Google Scholar] [CrossRef]
- Han, W.; Cui, J.; Sun, G.; Miao, X.; Pufang, Z.; Nannan, L. Nano-sized microplastics exposure induces skin cell senescence via triggering the mitochondrial localization of GSDMD. Environ. Pollut. 2024, 349, 123874. [Google Scholar] [CrossRef] [PubMed]
- Bhargava, P.; Schnellmann, R.G. Mitochondrial energetics in the kidney. Nat. Rev. Nephrol. 2017, 13, 629–646. [Google Scholar] [CrossRef] [PubMed]
- Shen, T.; Zhang, W.; Wang, Y.; Li, H.; Wu, J.; Wang, Q.; Qin, L.; Zhang, L.; Liu, C.; Li, R. Effects of Microplastic (MP) Exposure at Environmentally Relevant Doses on the Structure, Function, and Transcriptome of the Kidney in Mice. Molecules 2023, 28, 7104. [Google Scholar] [CrossRef]
- Xiong, X.; Gao, L.; Chen, C.; Zhu, K.; Luo, P.; Li, L. The microplastics exposure induce the kidney injury in mice revealed by RNA-seq. Ecotoxicol. Environ. Saf. 2023, 256, 114821. [Google Scholar] [CrossRef]
- Zhou, B.; Zhang, A.; Wang, Y.; Feng, S.; Xue, Q.; Liu, Z.; Zhao, H.; Jing, Z.; Xie, J. Microplastics induce human kidney development retardation through ATP-mediated glucose metabolism rewiring. J. Hazard. Mater. 2025, 486, 137002. [Google Scholar] [CrossRef]
- Yang, Y.; Xie, E.; Du, Z.; Peng, Z.; Han, Z.; Li, L.; Zhao, R.; Qin, Y.; Xue, M.; Li, F.; et al. Detection of Various Microplastics in Patients Undergoing Cardiac Surgery. Environ. Sci. Technol. 2023, 57, 10911–10918. [Google Scholar] [CrossRef]
- Schwabl, P.; Köppel, S.; Königshofer, P.; Bucsics, T.; Trauner, M.; Reiberger, T.; Liebmann, B. Detection of Various Microplastics in Human Stool: A Prospective Case Series. Ann. Intern. Med. 2019, 171, 453–457. [Google Scholar] [CrossRef]
- Senathirajah, K.; Attwood, S.; Bhagwat, G.; Carbery, M.; Wilson, S.; Palanisami, T. Estimation of the mass of microplastics ingested—A pivotal first step towards human health risk assessment. J. Hazard. Mater. 2021, 404, 124004. [Google Scholar] [CrossRef]
- García-Roche, M.; Casal, A.; Carriquiry, M.; Radi, R.; Quijano, C.; Cassina, A. Respiratory analysis of coupled mitochondria in cryopreserved liver biopsies. Redox Biol. 2018, 17, 207–212. [Google Scholar] [CrossRef] [PubMed]
- Takaori, K.; Nakamura, J.; Yamamoto, S.; Nakata, H.; Sato, Y.; Takase, M.; Nameta, M.; Yamamoto, T.; Economides, A.N.; Kohno, K.; et al. Severity and Frequency of Proximal Tubule Injury Determines Renal Prognosis. J. Am. Soc. Nephrol. 2016, 27, 2393–2406. [Google Scholar] [CrossRef] [PubMed]
- Ribeiro-Silva, C.M.; Faustino-Rocha, A.I.; Gil da Costa, R.M.; Medeiros, R.; Pires, M.J.; Gaivão, I.; Gama, A.; Neuparth, M.J.; Barbosa, J.V.; Peixoto, F.; et al. Pulegone and Eugenol Oral Supplementation in Laboratory Animals: Results from Acute and Chronic Studies. Biomedicines 2022, 10, 2595. [Google Scholar] [CrossRef] [PubMed]
- Ziak, J.; Krajcova, A.; Jiroutkova, K.; Nemcova, V.; Dzupa, V.; Duska, F. Assessing the function of mitochondria in cytosolic context in human skeletal muscle: Adopting high-resolution respirometry to homogenate of needle biopsy tissue samples. Mitochondrion 2015, 21, 106–112. [Google Scholar] [CrossRef] [PubMed]
- Acin-Perez, R.; Benador, I.Y.; Petcherski, A.; Veliova, M.; A Benavides, G.; Lagarrigue, S.; Caudal, A.; Vergnes, L.; Murphy, A.N.; Karamanlidis, G.; et al. A novel approach to measure mitochondrial respiration in frozen biological samples. EMBO J. 2020, 39, e104073. [Google Scholar] [CrossRef] [PubMed]
- Peixoto, F.; Carvalho, M.J.M.; Almeida, J.; Matos, P.A.C. Daphnetoxin Interacts with Mitochondrial Oxidative Phosphorylation and Induces Membrane Permeability Transition in Rat Liver. Planta Medica 2004, 70, 1064–1068. [Google Scholar] [CrossRef]
- Silva, M.G.; Nunes, P.; Oliveira, P.; Ferreira, R.; Fardilha, M.; Moreira-Gonçalves, D.; Duarte, J.A.; Oliveira, M.M.; Peixoto, F. Long-Term Aerobic Training Improves Mitochondrial and Antioxidant Function in the Liver of Wistar Rats Preventing Hepatic Age-Related Function Decline. Biology 2022, 11, 1750. [Google Scholar] [CrossRef]
- Gornall, A.G.; Bardawill, C.J.; David, M.M. Determination of serum proteins by means of the biuret reaction. J. Biol. Chem. 1949, 177, 751–766. [Google Scholar] [CrossRef]
- Spinazzi, M.; Casarin, A.; Pertegato, V.; Salviati, L.; Angelini, C. Assessment of mitochondrial respiratory chain enzymatic activities on tissues and cultured cells. Nat. Protoc. 2012, 7, 1235–1246. [Google Scholar] [CrossRef]
- Ottolenghi, A. Interaction of ascorbic acid and mitochondrial lipides. Arch. Biochem. Biophys. 1959, 79, 355–363. [Google Scholar] [CrossRef]
- Hissin, P.J.; Hilf, R. A fluorometric method for determination of oxidized and reduced glutathione in tissues. Anal. Biochem. 1976, 74, 214–226. [Google Scholar] [CrossRef]
- Bligh, E.G.; Dyer, W.J. A rapid method of total lipid extraction and purification. Can. J. Physiol. Pharmacol. 1959, 37, 911–917. [Google Scholar]
- Bartlett, E.M.; Lewis, D.H. Spectrophotometric determination of phosphate esters in the presence and absence of orthophosphate. Anal. Biochem. 1970, 36, 159–167. [Google Scholar] [CrossRef]
- Aued-Pimentel, S.; Lago, J.H.G.; Chaves, M.H.; Kumagai, E.E. Evaluation of a methylation procedure to determine cyclopropenoids fatty acids from Sterculia striata St. Hil. Et Nauds seed oil. J. Chromatogr. A 2004, 1054, 235–239. [Google Scholar] [CrossRef]
- Peixoto, F.; Vicente, J.; Madeira, V.M. A comparative study of plant and animal mitochondria exposed to paraquat reveals that hydrogen peroxide is not related to the observed toxicity. Toxicol. Vitr. 2004, 18, 733–739. [Google Scholar] [CrossRef]
- Atugoda, T.; Wijesekara, H.; Werellagama, D.; Jinadasa, K.; Bolan, N.S.; Vithanage, M. Adsorptive interaction of antibiotic ciprofloxacin on polyethylene microplastics: Implications for vector transport in water. Environ. Technol. Innov. 2020, 19, 100971. [Google Scholar] [CrossRef]
- Ołdak, D.; Kaczmarek, H.; Buffeteau, T.; Sourisseau, C. Photo- and Bio-Degradation Processes in Polyethylene, Cellulose and their Blends Studied by ATR-FTIR and Raman Spectroscopies. J. Mater. Sci. 2005, 40, 4189–4198. [Google Scholar] [CrossRef]
- Silva, M.G.; Medeiros-Fonseca, B.; Gama, A.; Gaivão, I.; Nunes, S.; Fernandes, M.; Oliveira, P.A.; Monedero, V.; Zúñiga, M.; Oliveira, M.M.; et al. Hepatic Mitochondrial Dysfunction and Gut Dysbiosis Induced by Polyethylene Microplastics in FVB/n Mice: A Comparative Study of Fluorescent and Non-Fluorescent Particles. Toxics 2026, 14, 386. [Google Scholar] [CrossRef]
- Malafaia, G.; Da Luz, T.M.; Ahmed, M.A.I.; Karthi, S.; Da Costa Araújo, A.P. When toxicity of plastic particles comes from their fluorescent dye: A preliminary study involving neotropical Physalaemus cuvieri tadpoles and polyethylene microplastics. J. Hazard. Mater. Adv. 2022, 6, 100054. [Google Scholar] [CrossRef]
- Deng, Y.; Zhang, Y.; Lemos, B.; Ren, H. Tissue accumulation of microplastics in mice and biomarker responses suggest widespread health risks of exposure. Sci. Rep. 2017, 7, 46687. [Google Scholar] [CrossRef] [PubMed]
- Tang, Y.; Zhao, R.; Pu, Q.; Jiang, S.; Yu, F.; Yang, Z.; Han, T. Investigation of nephrotoxicity on mice exposed to polystyrene nanoplastics and the potential amelioration effects of DHA-enriched phosphatidylserine. Sci. Total Environ. 2023, 892, 164808. [Google Scholar] [CrossRef]
- Gnaiger, E. Mitochondrial Pathways and Respiratory Control: An Introduction to OXPHOS Analysis. 5th ed. Bioenerg. Commun. 2020, 2020, 2. [Google Scholar] [CrossRef]
- Pietka, T.A.; Brookheart, R.T. Measurement of Mitochondrial Respiration in Human and Mouse Skeletal Muscle Fibers by High-Resolution Respirometry. J. Vis. Exp. 2024, 66834. [Google Scholar] [CrossRef]
- Fontanesi, F. Mitochondria: Structure and Role in Respiration. In Encyclopedia of Life Sciences, 1st ed.; John Wiley & Sons: Hoboken, NJ, USA, 2015; pp. 1–13. [Google Scholar] [CrossRef]
- Liu, T.; Hou, B.; Wang, Z.; Yang, Y. Polystyrene microplastics induce mitochondrial damage in mouse GC-2 cells. Ecotoxicol. Environ. Saf. 2022, 237, 113520. [Google Scholar] [CrossRef]
- Zhao, R.-Z.; Jiang, S.; Zhang, L.; Yu, Z.-B. Mitochondrial electron transport chain, ROS generation and uncoupling (Review). Int. J. Mol. Med. 2019, 44, 3–15. [Google Scholar] [CrossRef]
- Peng, M.; Vercauteren, M.; Grootaert, C.; Rajkovic, A.; Boon, N.; Janssen, C.; Asselman, J. Cellular and bioenergetic effects of polystyrene microplastic in function of cell type, differentiation status and post-exposure time. Environ. Pollut. 2023, 337, 122550. [Google Scholar] [CrossRef]
- Lin, S.; Zhang, H.; Wang, C.; Su, X.-L.; Song, Y.; Wu, P.; Yang, Z.; Wong, M.-H.; Cai, Z.; Zheng, C. Metabolomics Reveal Nanoplastic-Induced Mitochondrial Damage in Human Liver and Lung Cells. Environ. Sci. Technol. 2022, 56, 12483–12493. [Google Scholar] [CrossRef]
- Tao, M.; Wang, C.; Zheng, Z.; Gao, W.; Chen, Q.; Xu, M.; Zhu, W.; Xu, L.; Han, X.; Guo, X.; et al. Nanoplastics exposure-induced mitochondrial dysfunction contributes to disrupted stem cell differentiation in human cerebral organoids. Ecotoxicol. Environ. Saf. 2024, 285, 117063. [Google Scholar] [CrossRef]
- Nolfi-Donegan, D.; Braganza, A.; Shiva, S. Mitochondrial electron transport chain: Oxidative phosphorylation, oxidant production, and methods of measurement. Redox Biol. 2020, 37, 101674. [Google Scholar] [CrossRef]
- Westermann, B. Bioenergetic role of mitochondrial fusion and fission. Biochim. Biophys. Acta (BBA)—Bioenerg. 2012, 1817, 1833–1838. [Google Scholar] [CrossRef]
- Chowanadisai, W.; Bauerly, K.A.; Tchaparian, E.; Wong, A.; Cortopassi, G.A.; Rucker, R.B. Pyrroloquinoline Quinone Stimulates Mitochondrial Biogenesis through cAMP Response Element-binding Protein Phosphorylation and Increased PGC-1α Expression. J. Biol. Chem. 2010, 285, 142–152. [Google Scholar] [CrossRef]
- De Carvalho, C.; Caramujo, M. The Various Roles of Fatty Acids. Molecules 2018, 23, 2583. [Google Scholar] [CrossRef]
- Ferreri, C.; Masi, A.; Sansone, A.; Giacometti, G.; Larocca, A.V.; Menounou, G.; Scanferlato, R.; Tortorella, S.; Rota, D.; Conti, M.; et al. Fatty Acids in Membranes as Homeostatic, Metabolic and Nutritional Biomarkers: Recent Advancements in Analytics and Diagnostics. Diagnostics 2016, 7, 1. [Google Scholar] [CrossRef]
- Cui, H.; Jiang, X.; Cao, J.; Yang, W.; Yang, B.; Li, M. Comparative Analysis of Metabolic Dysfunctions Associated with Pristine and Aged Polyethylene Microplastic Exposure via the Liver-Gut Axis in Mice. ACS Nano 2025, 19, 14272–14283. [Google Scholar] [CrossRef]
- Liu, M.; Wang, M.; Sun, X.; Mu, J.; Teng, T.; Jin, N.; Song, J.; Li, B.; Zhang, D. Polypropylene microplastics triggered mouse kidney lipidome reprogramming combined with ROS stress as revealed by lipidomics and Raman biospectra. Chemosphere 2025, 370, 143926. [Google Scholar] [CrossRef]
- Grillo, G.; Falvo, S.; Latino, D.; Baccari, G.C.; Venditti, M.; Di Fiore, M.M.; Minucci, S.; Santillo, A. Polystyrene microplastics impair the functions of cultured mouse Leydig (TM3) and Sertoli (TM4) cells by inducing mitochondrial-endoplasmic reticulum damage. Ecotoxicol. Environ. Saf. 2024, 274, 116202. [Google Scholar] [CrossRef]
- An, R.; Wang, X.; Yang, L.; Zhang, J.; Wang, N.; Xu, F.; Hou, Y.; Zhang, H.; Zhang, L. Polystyrene microplastics cause granulosa cells apoptosis and fibrosis in ovary through oxidative stress in rats. Toxicology 2021, 449, 152665. [Google Scholar] [CrossRef]
- Li, L.; Lv, X.; He, J.; Zhang, L.; Li, B.; Zhang, X.; Liu, S.; Zhang, Y. Chronic exposure to polystyrene nanoplastics induces intestinal mechanical and immune barrier dysfunction in mice. Ecotoxicol. Environ. Saf. 2024, 269, 115749. [Google Scholar] [CrossRef]
- Lu, T.; Liu, H.; Yuan, X.; Li, D.; Zhang, G.; Wang, Y.; Xie, Q.; Wang, X.; Chi, J.; Wang, Z.; et al. Chronic exposure to polyethylene terephthalate microplastics induces gut microbiota dysbiosis and disordered hepatic lipid metabolism in mice. Ecotoxicol. Environ. Saf. 2025, 298, 118330. [Google Scholar] [CrossRef]
- Fan, J.; Liu, L.; Lu, Y.; Chen, Q.; Fan, S.; Yang, Y.; Long, Y.; Liu, X. Acute exposure to polystyrene nanoparticles promotes liver injury by inducing mitochondrial ROS-dependent necroptosis and augmenting macrophage-hepatocyte crosstalk. Part. Fibre Toxicol. 2024, 21, 20. [Google Scholar] [CrossRef] [PubMed]
- Teodoro, J.S.; Duarte, F.V.; Gomes, A.P.; Varela, A.T.; Peixoto, F.M.; Rolo, A.P.; Palmeira, C.M. Berberine reverts hepatic mitochondrial dysfunction in high-fat fed rats: A possible role for SirT3 activation. Mitochondrion 2013, 13, 637–646. [Google Scholar] [CrossRef] [PubMed]
- Cheng, W.; Li, X.; Zhou, Y.; Yu, H.; Xie, Y.; Guo, H.; Wang, H.; Li, Y.; Feng, Y.; Wang, Y. Polystyrene microplastics induce hepatotoxicity and disrupt lipid metabolism in the liver organoids. Sci. Total Environ. 2022, 806, 150328. [Google Scholar] [CrossRef]
- Chai, Y.-C.; Mieyal, J.J. Glutathione and Glutaredoxin—Key Players in Cellular Redox Homeostasis and Signaling. Antioxidants 2023, 12, 1553. [Google Scholar] [CrossRef]
- Rodríguez-Martínez, M.A.; Alonso, M.J.; Redondo, J.; Salaíces, M.; Marín, J. Role of lipid peroxidation and the glutathione-dependent antioxidant system in the impairment of endothelium-dependent relaxations with age. Br. J. Pharmacol. 1998, 123, 113–121. [Google Scholar] [CrossRef]
- Legrand, C.; Bour, J.; Jacob, C.; Capiaumont, J.; Martial, A.; Marc, A.; Wudtke, M.M.; Kretzmer, G.; Demangel, C.; Duval, D.; et al. Lactate dehydrogenase (LDH) activity of the number of dead cells in the medium of cultured eukaryotic cells as marker. J. Biotechnol. 1992, 25, 231–243. [Google Scholar] [CrossRef]
- Cheng, W.; Chen, H.; Zhou, Y.; You, Y.; Lei, D.; Li, Y.; Feng, Y.; Wang, Y. Aged fragmented-polypropylene microplastics induced ageing statues-dependent bioenergetic imbalance and reductive stress: In vivo and liver organoids-based in vitro study. Environ. Int. 2024, 191, 108949. [Google Scholar] [CrossRef] [PubMed]
- Li, Y.; Guo, M.; Niu, S.; Shang, M.; Chang, X.; Sun, Z.; Zhang, R.; Shen, X.; Xue, Y. ROS and DRP1 interactions accelerate the mitochondrial injury induced by polystyrene nanoplastics in human liver HepG2 cells. Chem.-Biol. Interact. 2023, 379, 110502. [Google Scholar] [CrossRef] [PubMed]
- Pontecorvi, P.; Cassandri, M.; Gianoncelli, A.; Pascolo, L.; Cece, F.; Niccolai, E.; Camero, S.; Bonanni, V.; Bozzer, S.; Romano, E.; et al. Polyethylene nano- and microplastics trigger metabolic stress responses in human vaginal epithelial cells. Cell Death Discov. 2026, 12, 173. [Google Scholar] [CrossRef] [PubMed]
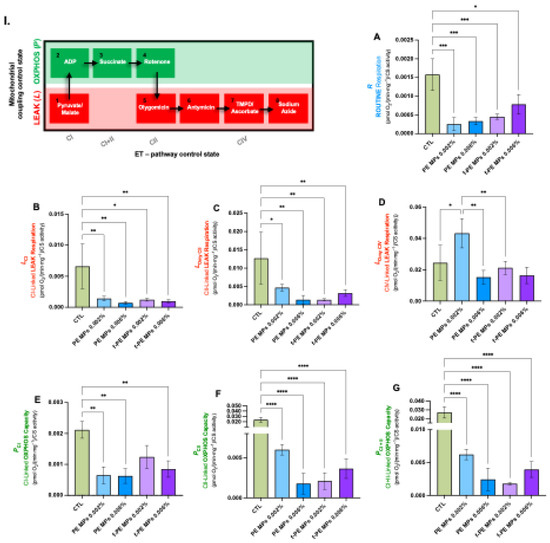
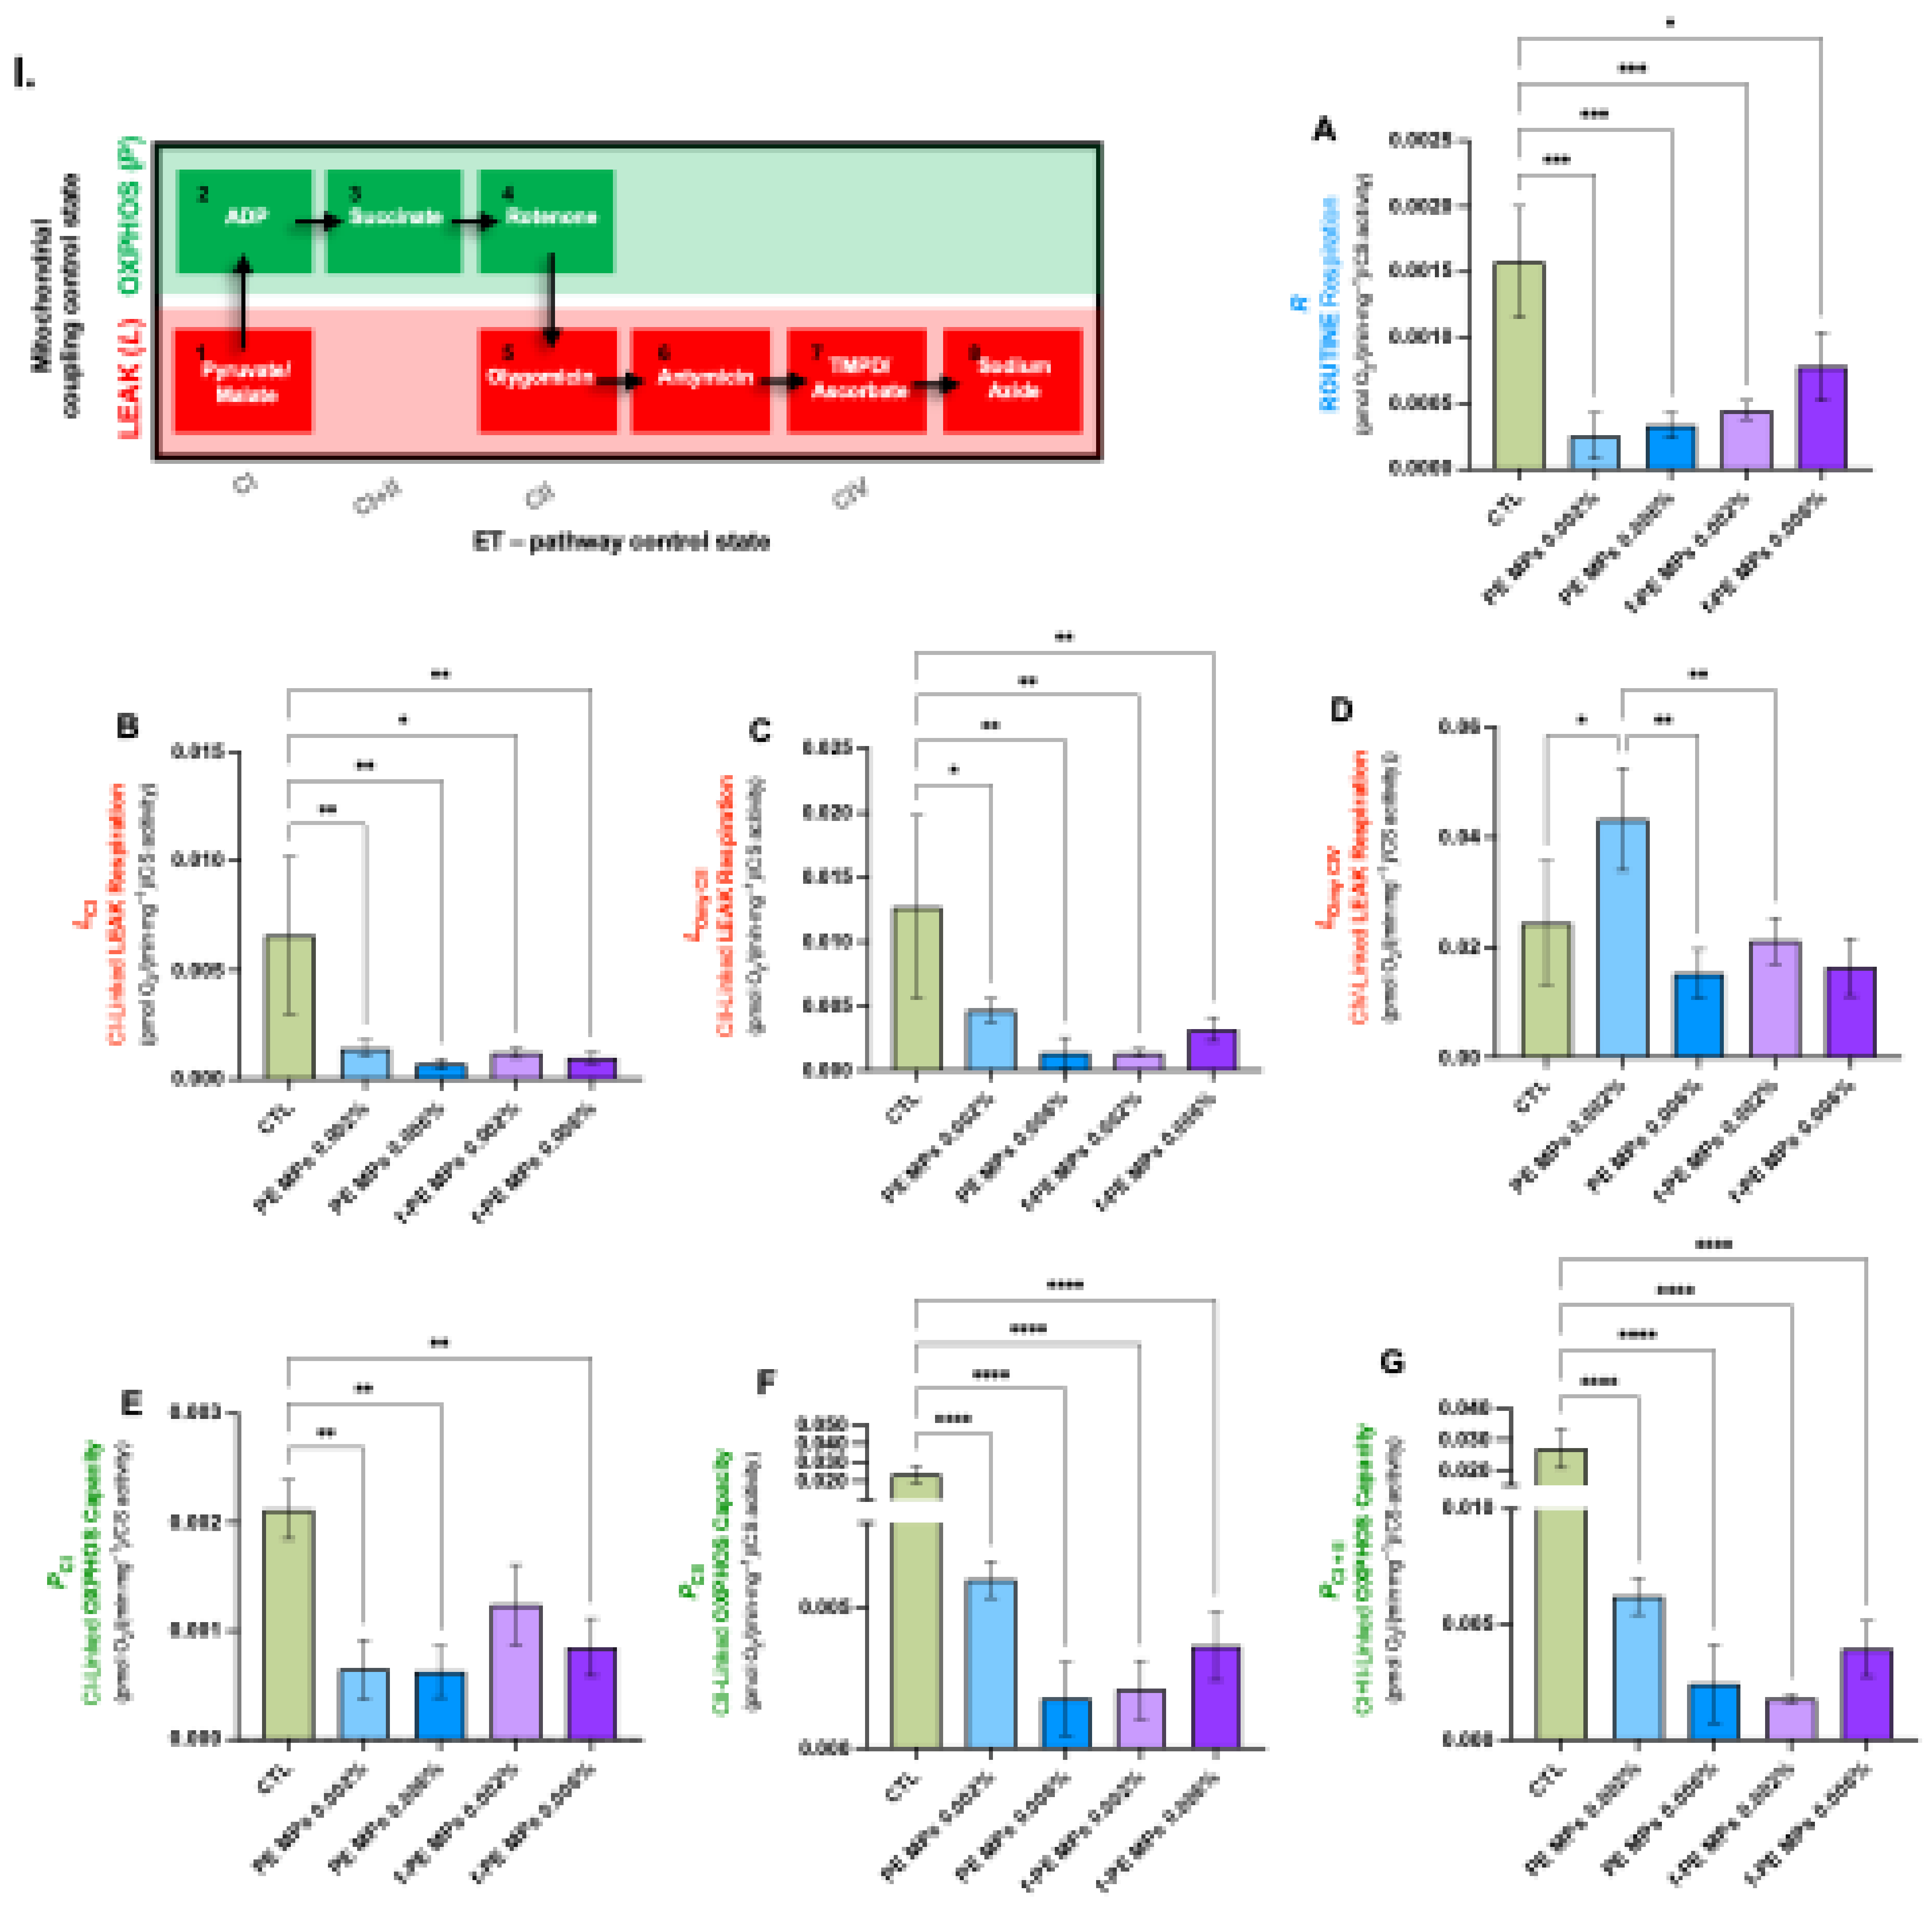
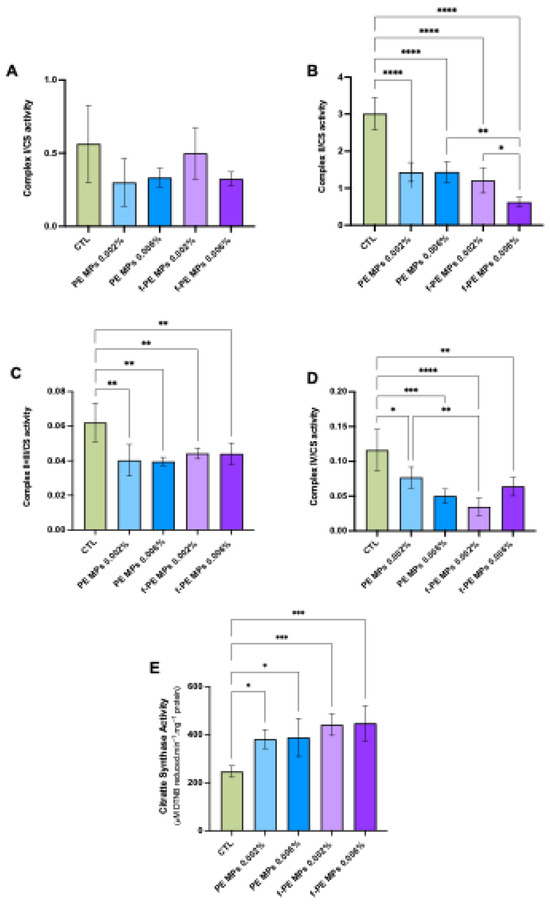
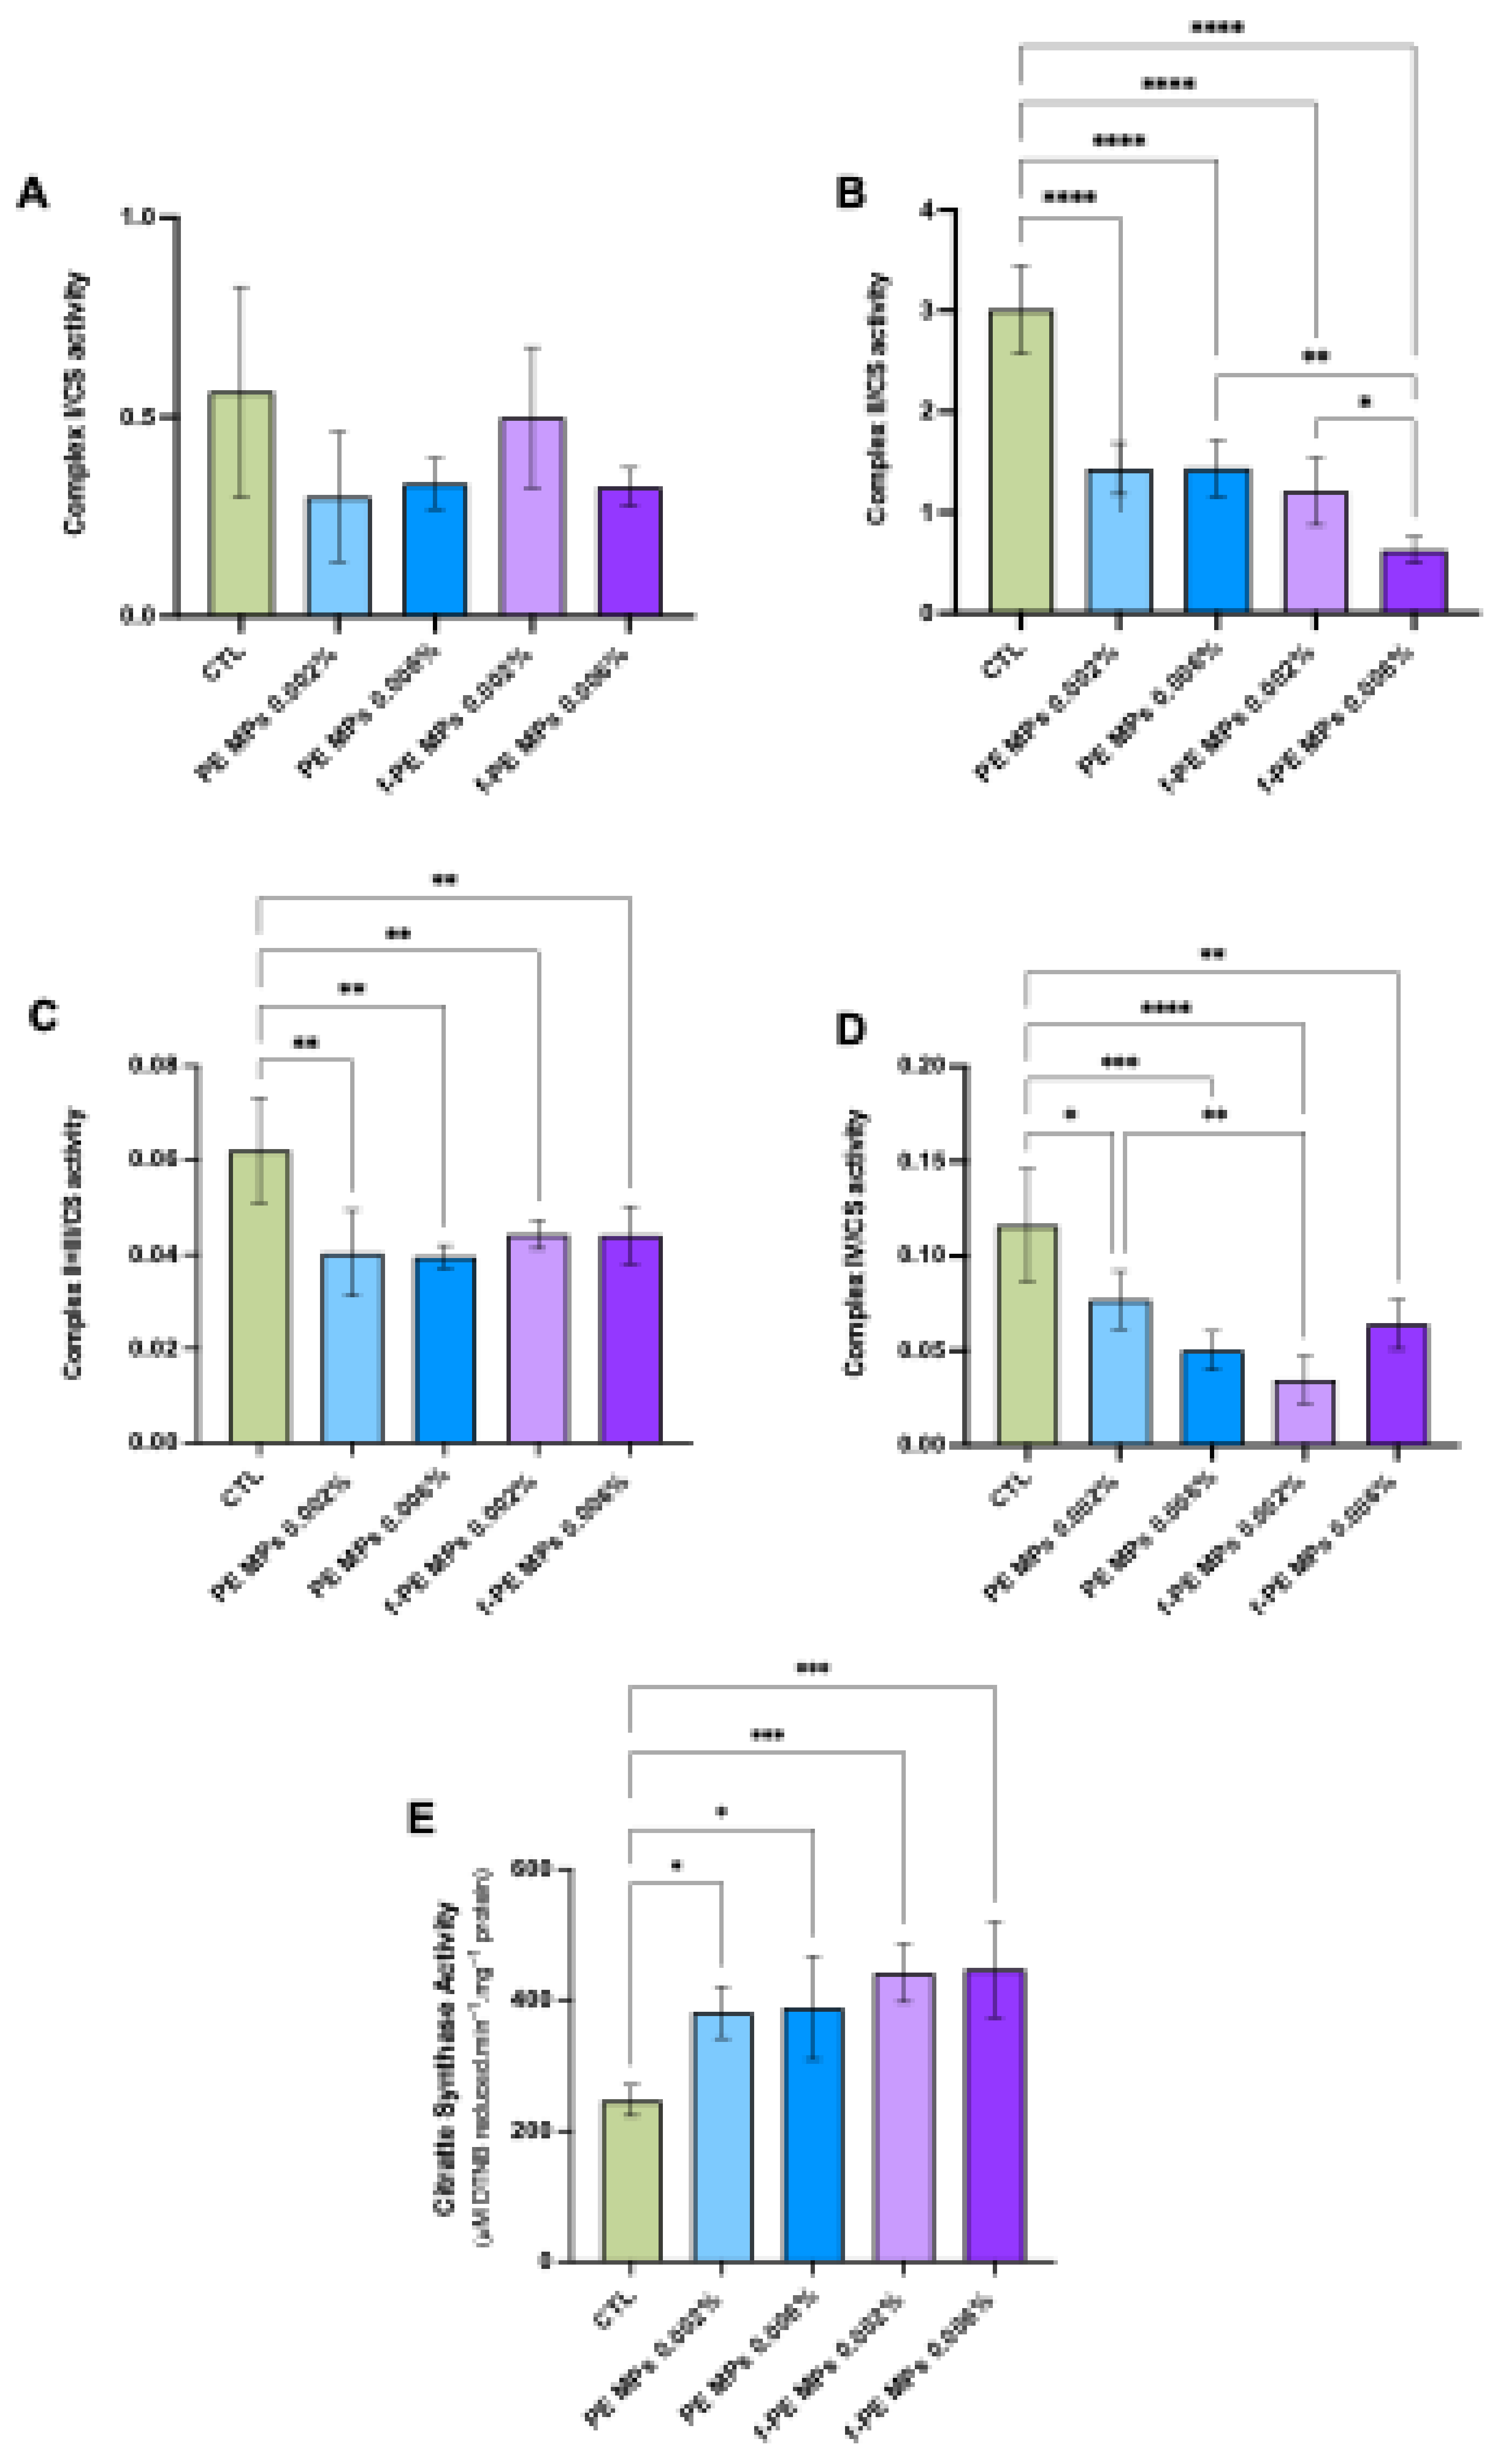
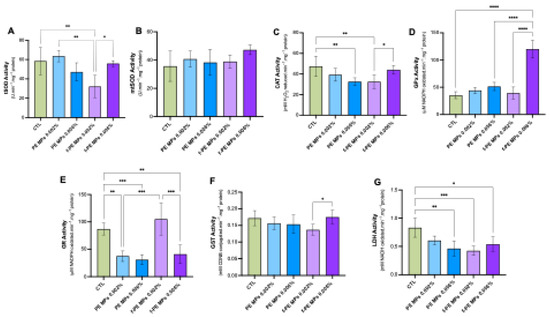
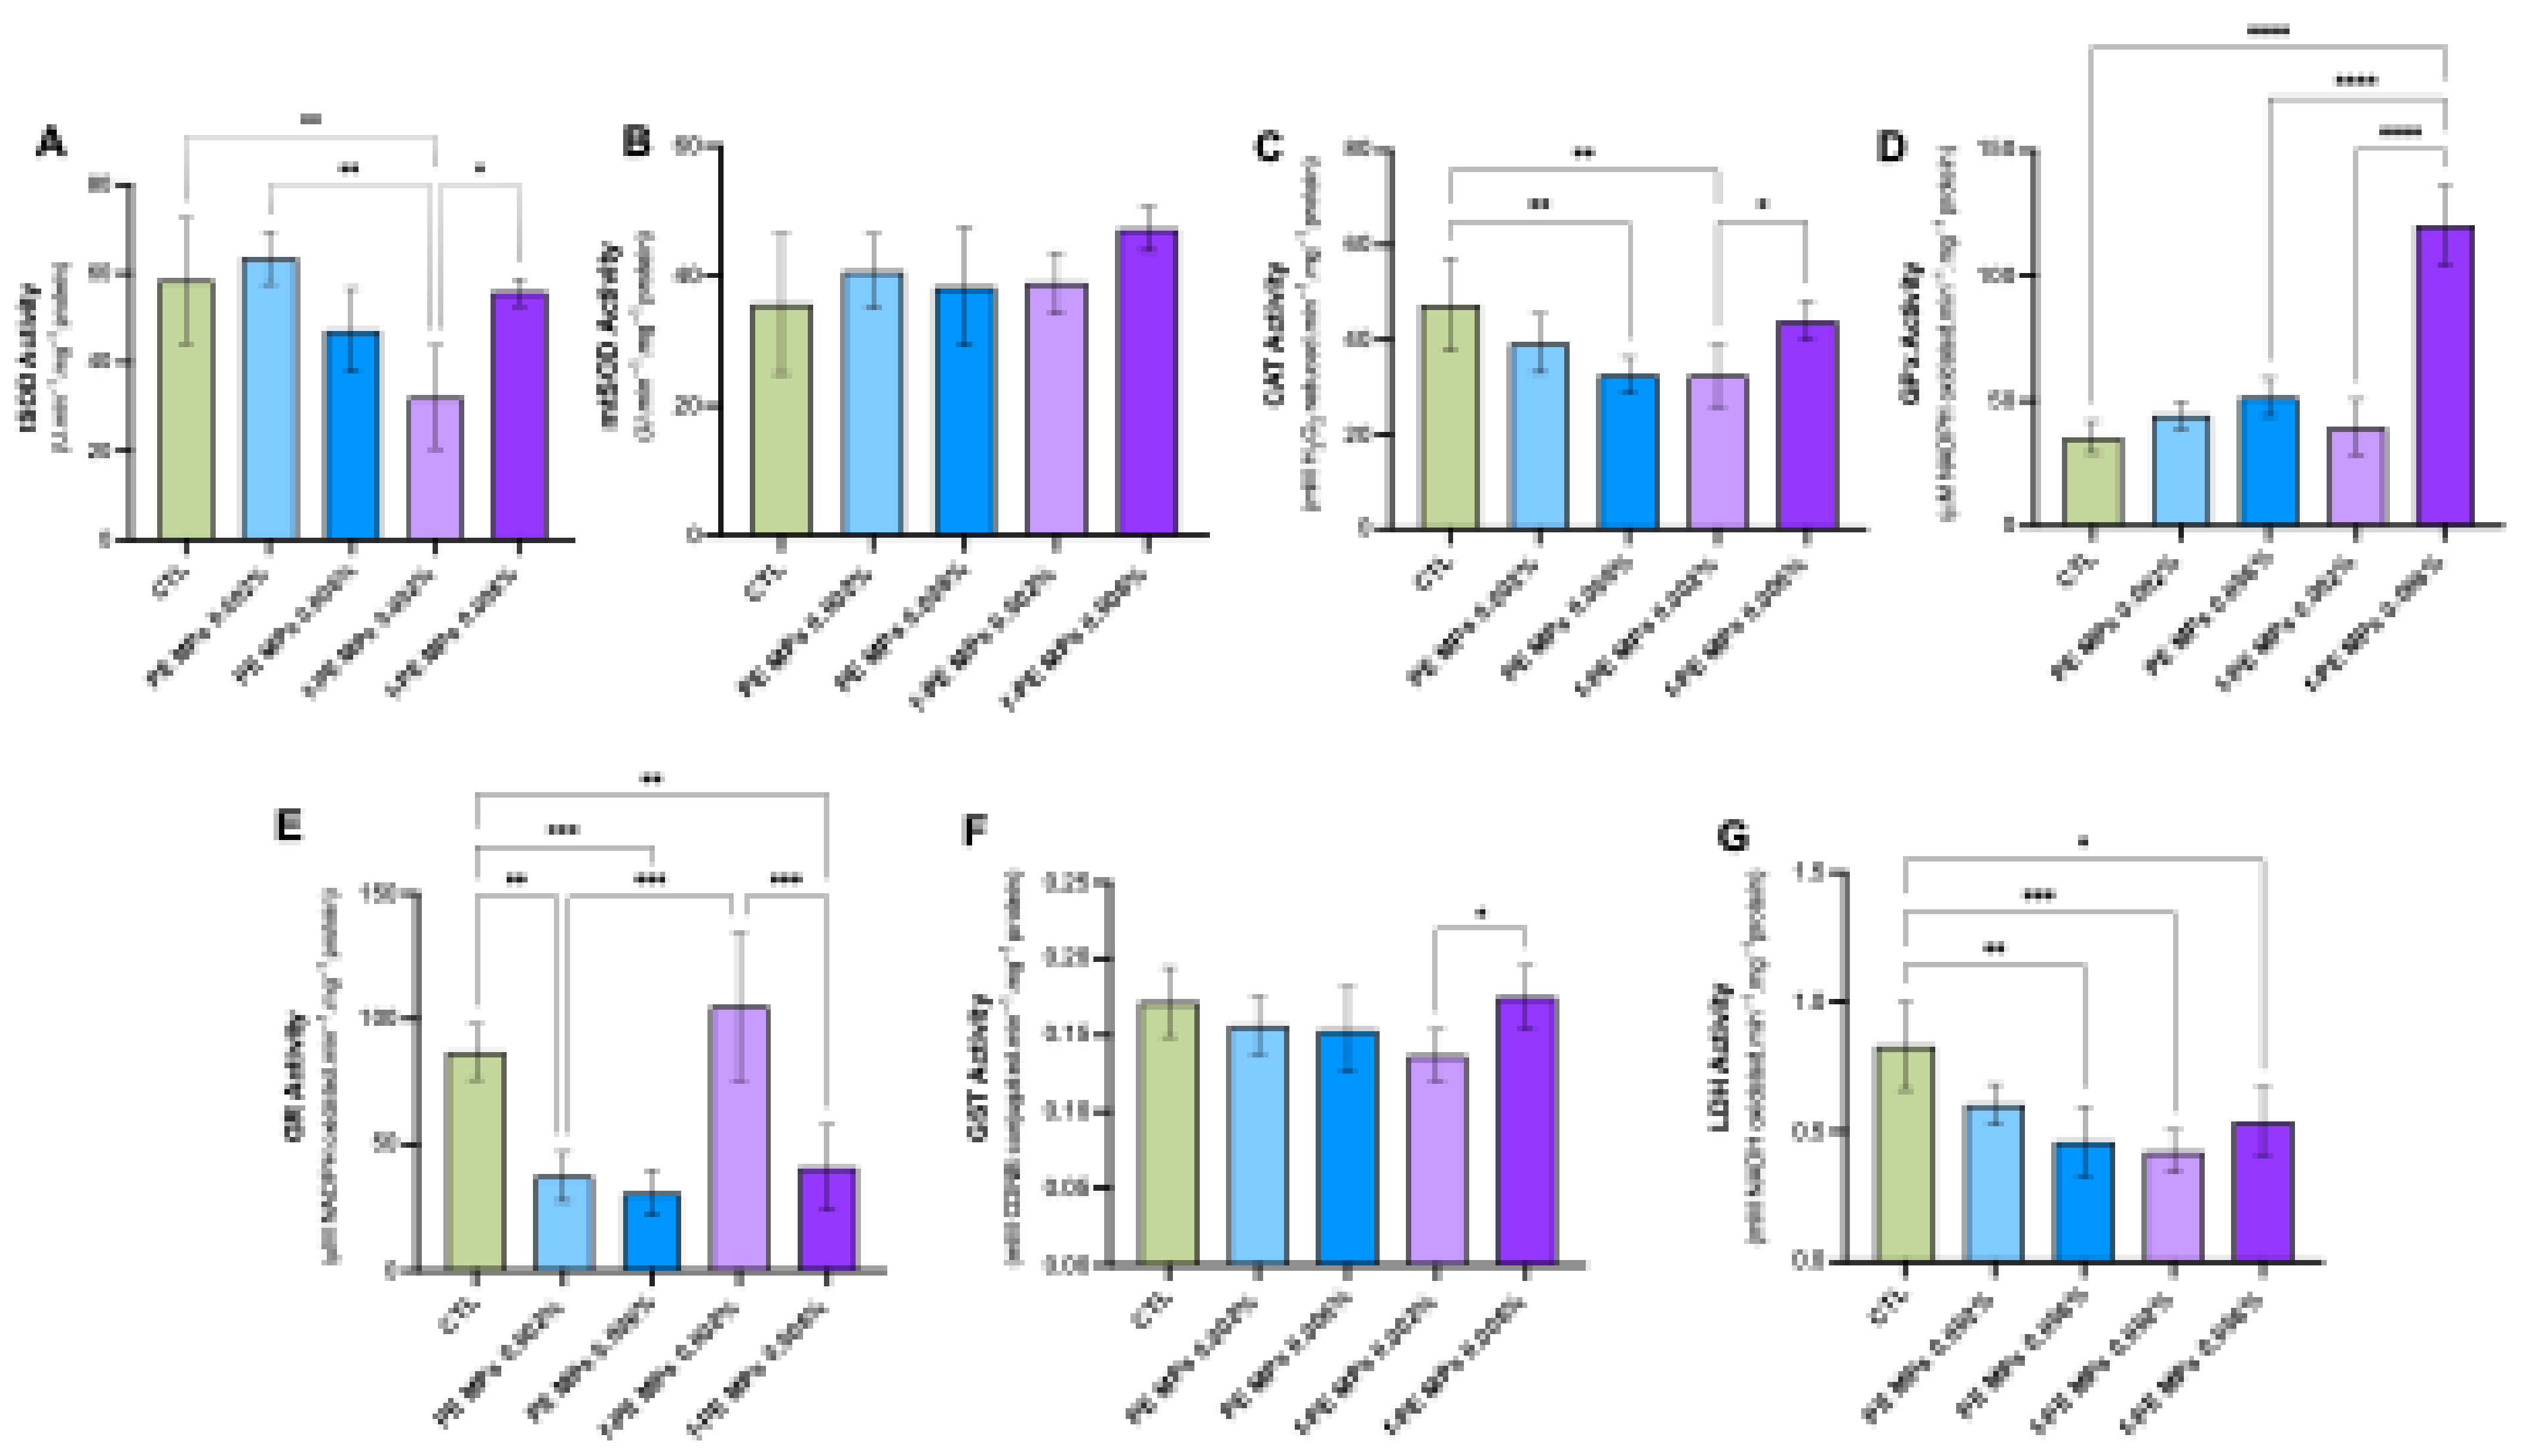
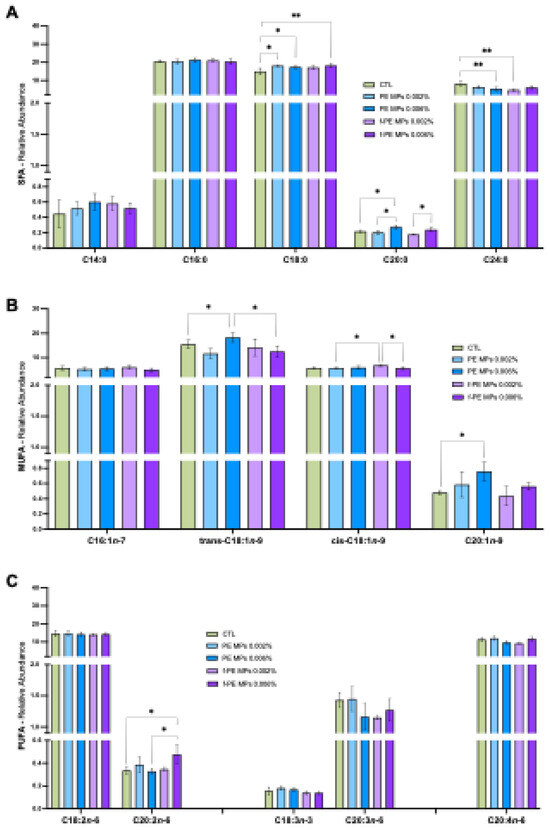
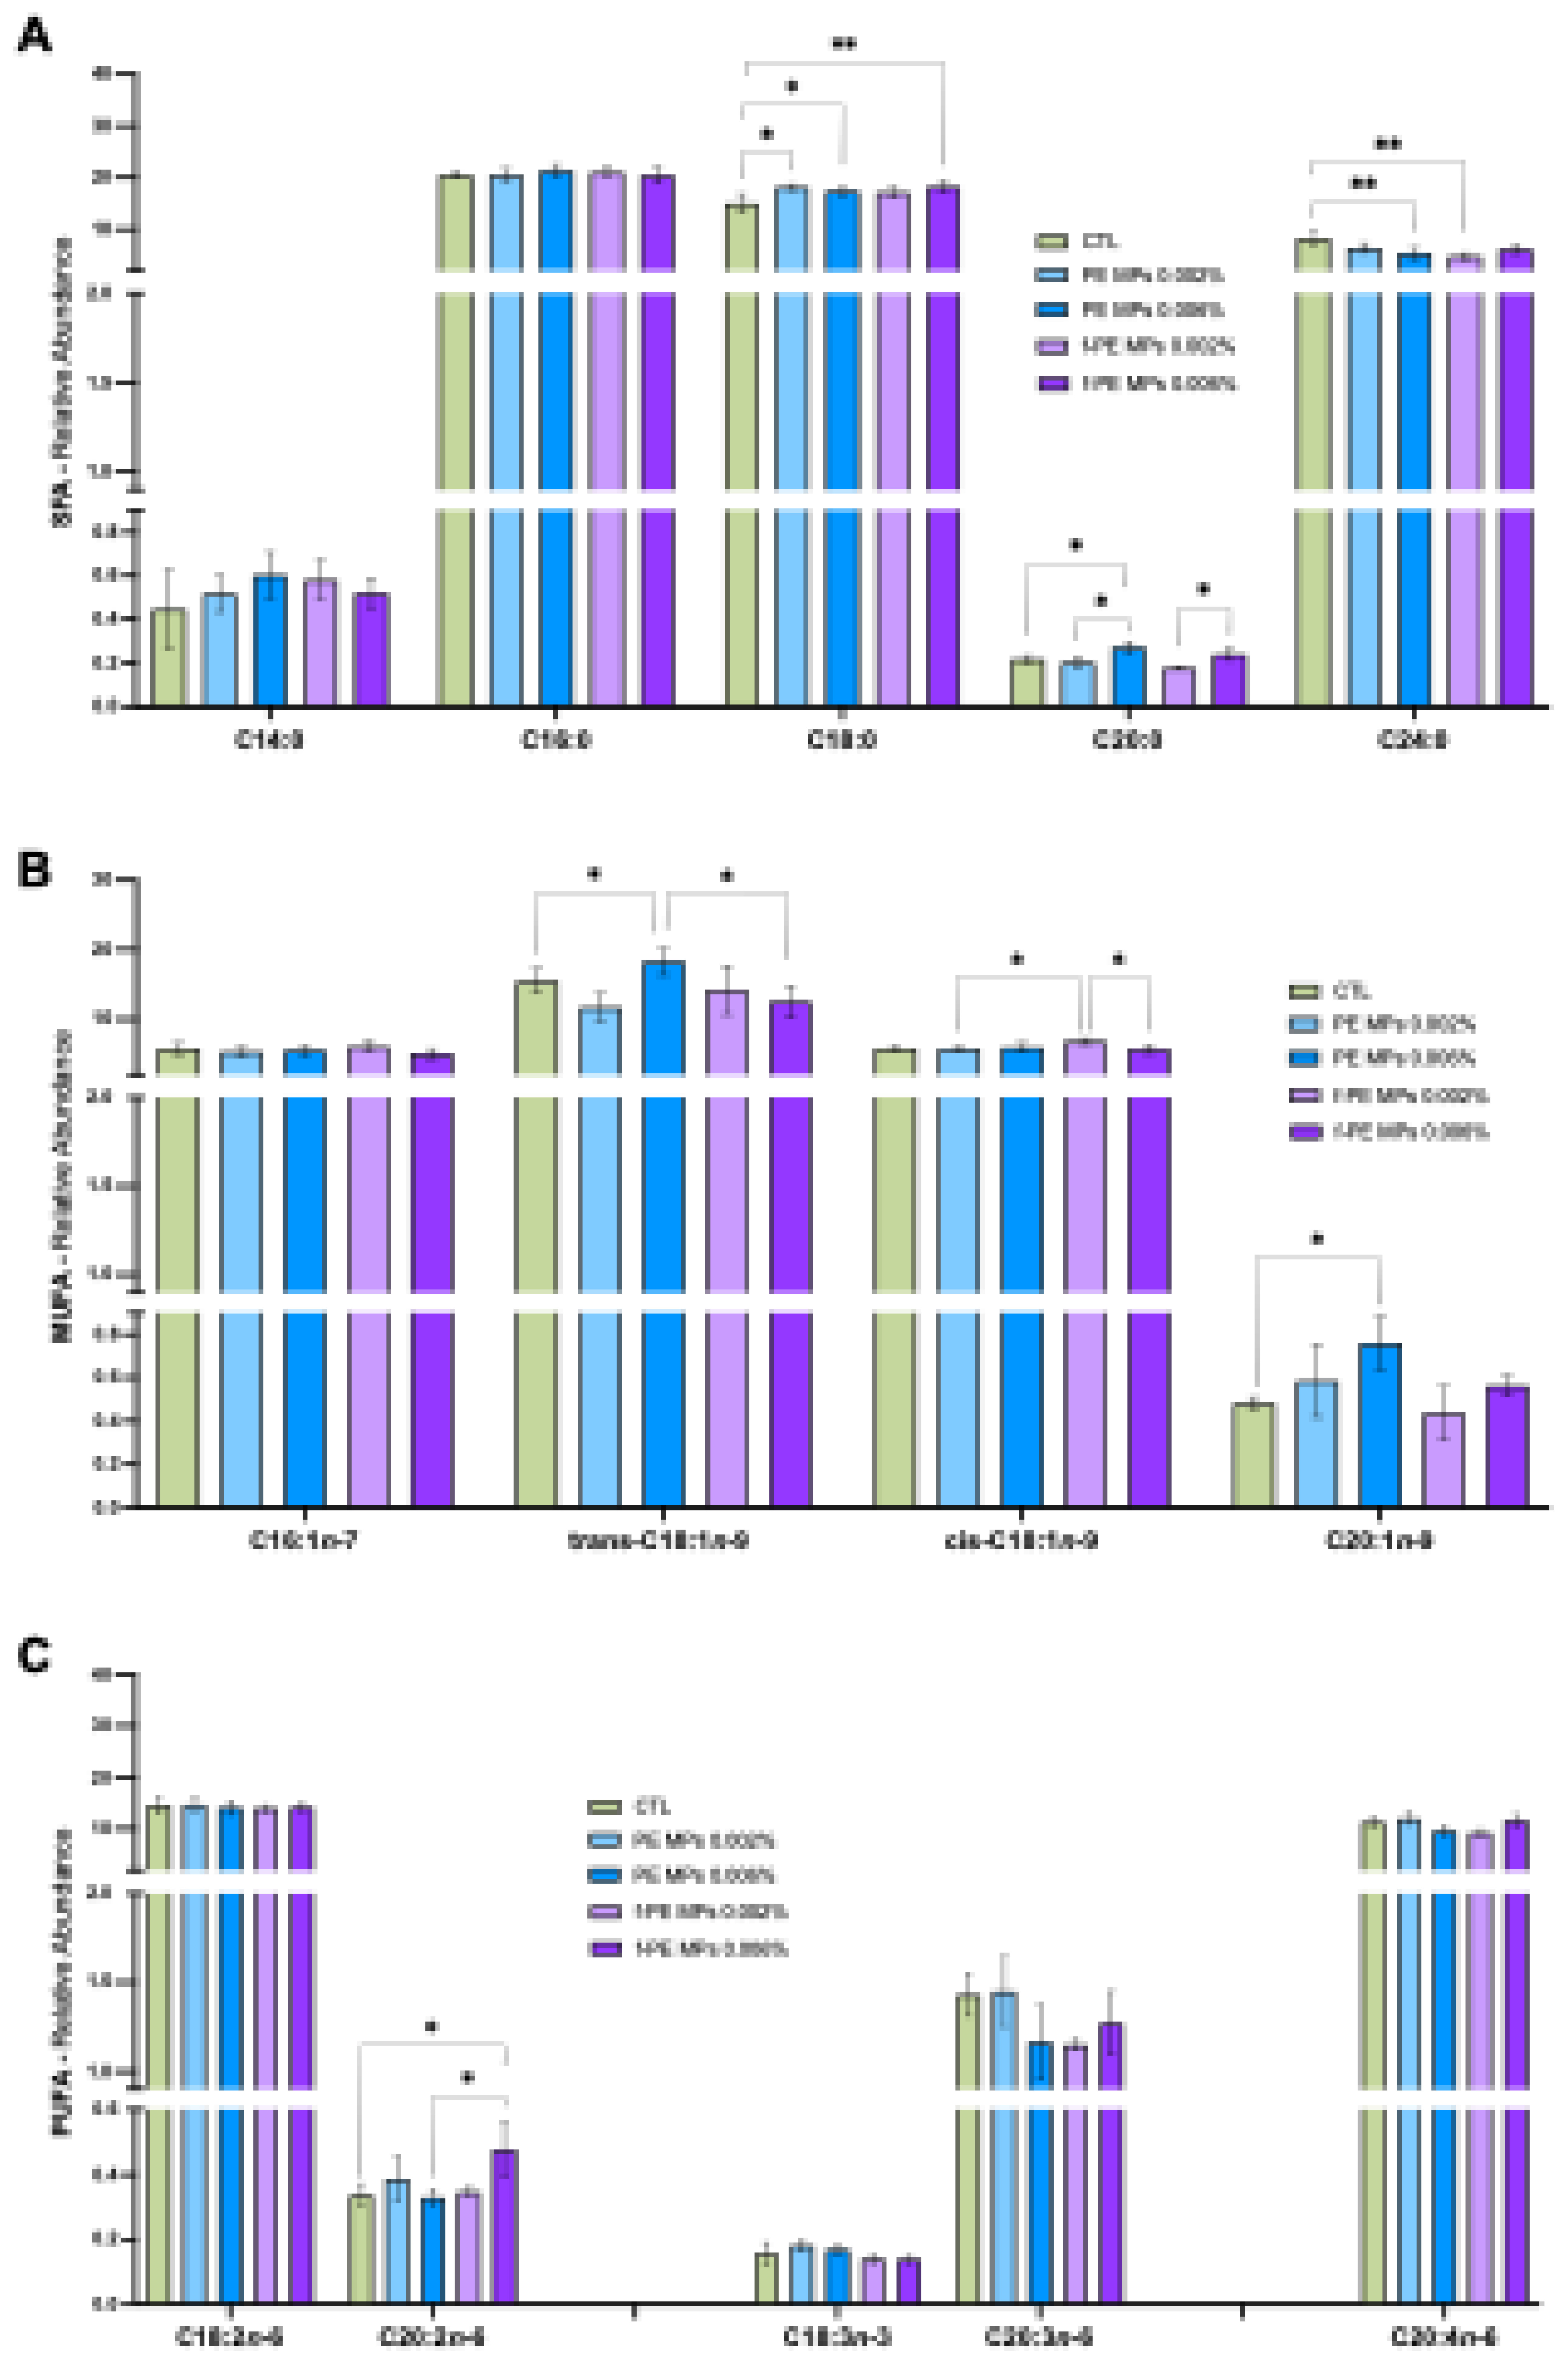

Disclaimer/Publisher’s Note: The statements, opinions and data contained in all publications are solely those of the individual author(s) and contributor(s) and not of MDPI and/or the editor(s). MDPI and/or the editor(s) disclaim responsibility for any injury to people or property resulting from any ideas, methods, instructions or products referred to in the content. |
© 2026 by the authors. Licensee MDPI, Basel, Switzerland. This article is an open access article distributed under the terms and conditions of the Creative Commons Attribution (CC BY) license.