


Abstract
Microplastic contamination in coral reef environments is increasingly recognized as a global concern; however, the extent to which polymer composition can help distinguish contamination sources and transport-related processes remains poorly understood. In this study, we assessed the abundance, composition, and diversity of microplastics (20–300 µm) across multiple reef systems in the Cuban archipelago using high-resolution Laser Direct Infrared (LDIR) spectroscopic analysis. Microplastic abundance varied substantially among sites, with a median concentration of 66 particles L−1 (IQR: 45–115 particles L−1), ranging from 8 to 218 particles L−1. A total of 11 polymer types were identified, with polyethylene (PE), polypropylene (PP), and polyamide (PA) dominating the assemblages and accounting for approximately 77% of detected particles. While these polymers were consistently observed across all sites, suggesting a pervasive regional background signal, highly impacted reefs exhibited more heterogeneous polymer profiles, including increased contributions of polyurethane (PU), polytetrafluoroethylene (PTFE), and polyvinyl chloride (PVC), consistent with localized anthropogenic influence. Multivariate analysis revealed moderate compositional structuring among reef sites and suggested broad differences in polymer assemblages associated with contrasting contamination settings. Notably, some reefs exhibited elevated microplastic abundances while remaining dominated by common polymers, indicating a partial decoupling between contamination levels and polymer-specific signatures. This pattern is consistent with the influence of regional transport and mixing processes across the Caribbean basin, potentially including circulation associated with the Yucatán Channel, although hydrodynamic processes were not directly assessed in this study. Overall, the findings highlight the value of polymer-resolved analysis for improving interpretation of microplastic contamination patterns in coral reef environments. The integration of polymer composition with abundance and diversity metrics provides a useful framework for distinguishing between localized contamination signals and broader regional background influences. This study represents a regional baseline assessment of small microplastics in Caribbean coral reef systems using high-resolution spectroscopic characterization.
1. Introduction
Microplastic (MP) pollution, defined as plastic particles smaller than 5 mm [1], has emerged as a pervasive and persistent form of contamination in marine environments. These particles originate from both primary sources, such as industrial pellets and microbeads, and secondary processes involving the fragmentation of larger plastic debris [2]. Due to their small size, durability, and widespread distribution, MPs are now recognized as a significant concern for marine ecosystems, affecting biogeochemical processes, food webs, and ecosystem health [3,4]. Coastal environments, which act as interfaces between terrestrial and marine systems, are particularly vulnerable, receiving substantial inputs of land-based plastic waste [5].
Coral reefs are among the most biodiverse and socio-economically valuable ecosystems on Earth, yet they are increasingly threatened by multiple stressors, including climate change, ocean acidification, and pollution [6]. In recent years, MPs have been identified as an additional and potentially significant stressor in reef environments [7,8]. Interactions between MPs and corals include ingestion, surface adhesion, and physical abrasion, which may lead to tissue damage, increased susceptibility to disease, and reduced physiological performance [9,10]. In addition, the structural complexity and hydrodynamic conditions of reef systems may promote the retention and accumulation of MPs, suggesting that coral reefs can act as both sinks and dynamic reservoirs within coastal environments [8].
Despite growing attention, significant knowledge gaps remain regarding the distribution and characteristics of MPs in coral reef waters. A major limitation of existing studies is the predominant focus on particles larger than 300 µm, whereas smaller MPs, expected to dominate in number and potentially exert greater ecological impacts, remain largely underrepresented [7,11]. This limitation is primarily driven by methodological constraints associated with conventional sampling and analytical techniques, which often lack the resolution required for reliable detection and identification of smaller particles.
Recent advances in vibrational spectroscopic techniques, particularly Laser Direct Infrared (LDIR) imaging, have enabled automated, high-throughput detection and chemical identification of MPs down to tens of micrometers [12,13,14,15,16]. These approaches overcome limitations associated with conventional methods and provide a more accurate characterization of small MP fractions, which are frequently underestimated in net-based surveys [11,17]. Recent high-resolution spectroscopic studies have further demonstrated that particles smaller than 100 µm dominate numerically in marine environments, highlighting the importance of incorporating lower detection thresholds (~20 µm) to improve environmental assessments and cross-study comparability. Beyond size-related constraints, there is an increasing need to integrate MP abundance with polymer-specific composition. While abundance data provide a measure of contamination levels, polymer identity offers critical insights into potential sources, transport pathways, and environmental behaviour. Polymer composition has been shown to reflect dominant inputs, including urban runoff, wastewater discharge, and industrial activities, as well as environmental processes such as hydrodynamic sorting and degradation [18,19]. However, polymer-resolved analyses remain limited in reef-associated environments, where most studies still focus primarily on particle abundance rather than compositional signatures.
Furthermore, the effectiveness of marine protected areas (MPAs) in mitigating MP contamination remains uncertain. While MPAs can reduce local anthropogenic pressures, their capacity to limit MP exposure is constrained by regional oceanographic transport, which can introduce particles from distant sources [20,21]. This highlights the need to disentangle the relative influence of local inputs and large-scale transport processes when assessing MP contamination in reef ecosystems.
The Cuban archipelago hosts extensive coral reef systems that are considered among the best preserved in the Caribbean basin [22]. This condition has been attributed to relatively low coastal development, the predominance of offshore reef systems, and the presence of large marine protected areas, particularly in remote regions such as Jardines de la Reina. However, these ecosystems are not exempt from anthropogenic pressures, which vary spatially and are more pronounced near urbanized and industrialized coastal zones.
Despite their ecological importance, no study to date has provided a large-scale, high-resolution assessment of small MPs (<300 µm) integrating abundance, polymer composition, and spatial variability across Cuban coral reef systems. This represents a critical gap in understanding both the magnitude and the drivers of MP contamination in reef environments.
To address this gap, the present study provides a comprehensive assessment of MPs (20–300 µm) in surface waters across 22 coral reef sites along the Cuban shelf using LDIR imaging. Specifically, the objectives were to (i) quantify MP abundance and characterize polymer composition, size distribution, and morphology; (ii) identify spatial patterns of contamination using multivariate analysis; (iii) investigate the influence of local inputs and regional transport processes on polymer composition; and (iv) evaluate differences between protected and non-protected reef systems. By integrating high-resolution analytical techniques with compositional and spatial analyses, this study advances the use of polymer-specific signatures as a diagnostic tool to better understand MP contamination in coral reef ecosystems.
2. Materials and Methods
2.1. Study Area and Sampling Design
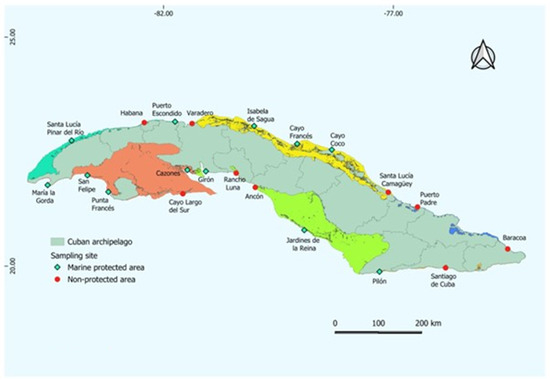
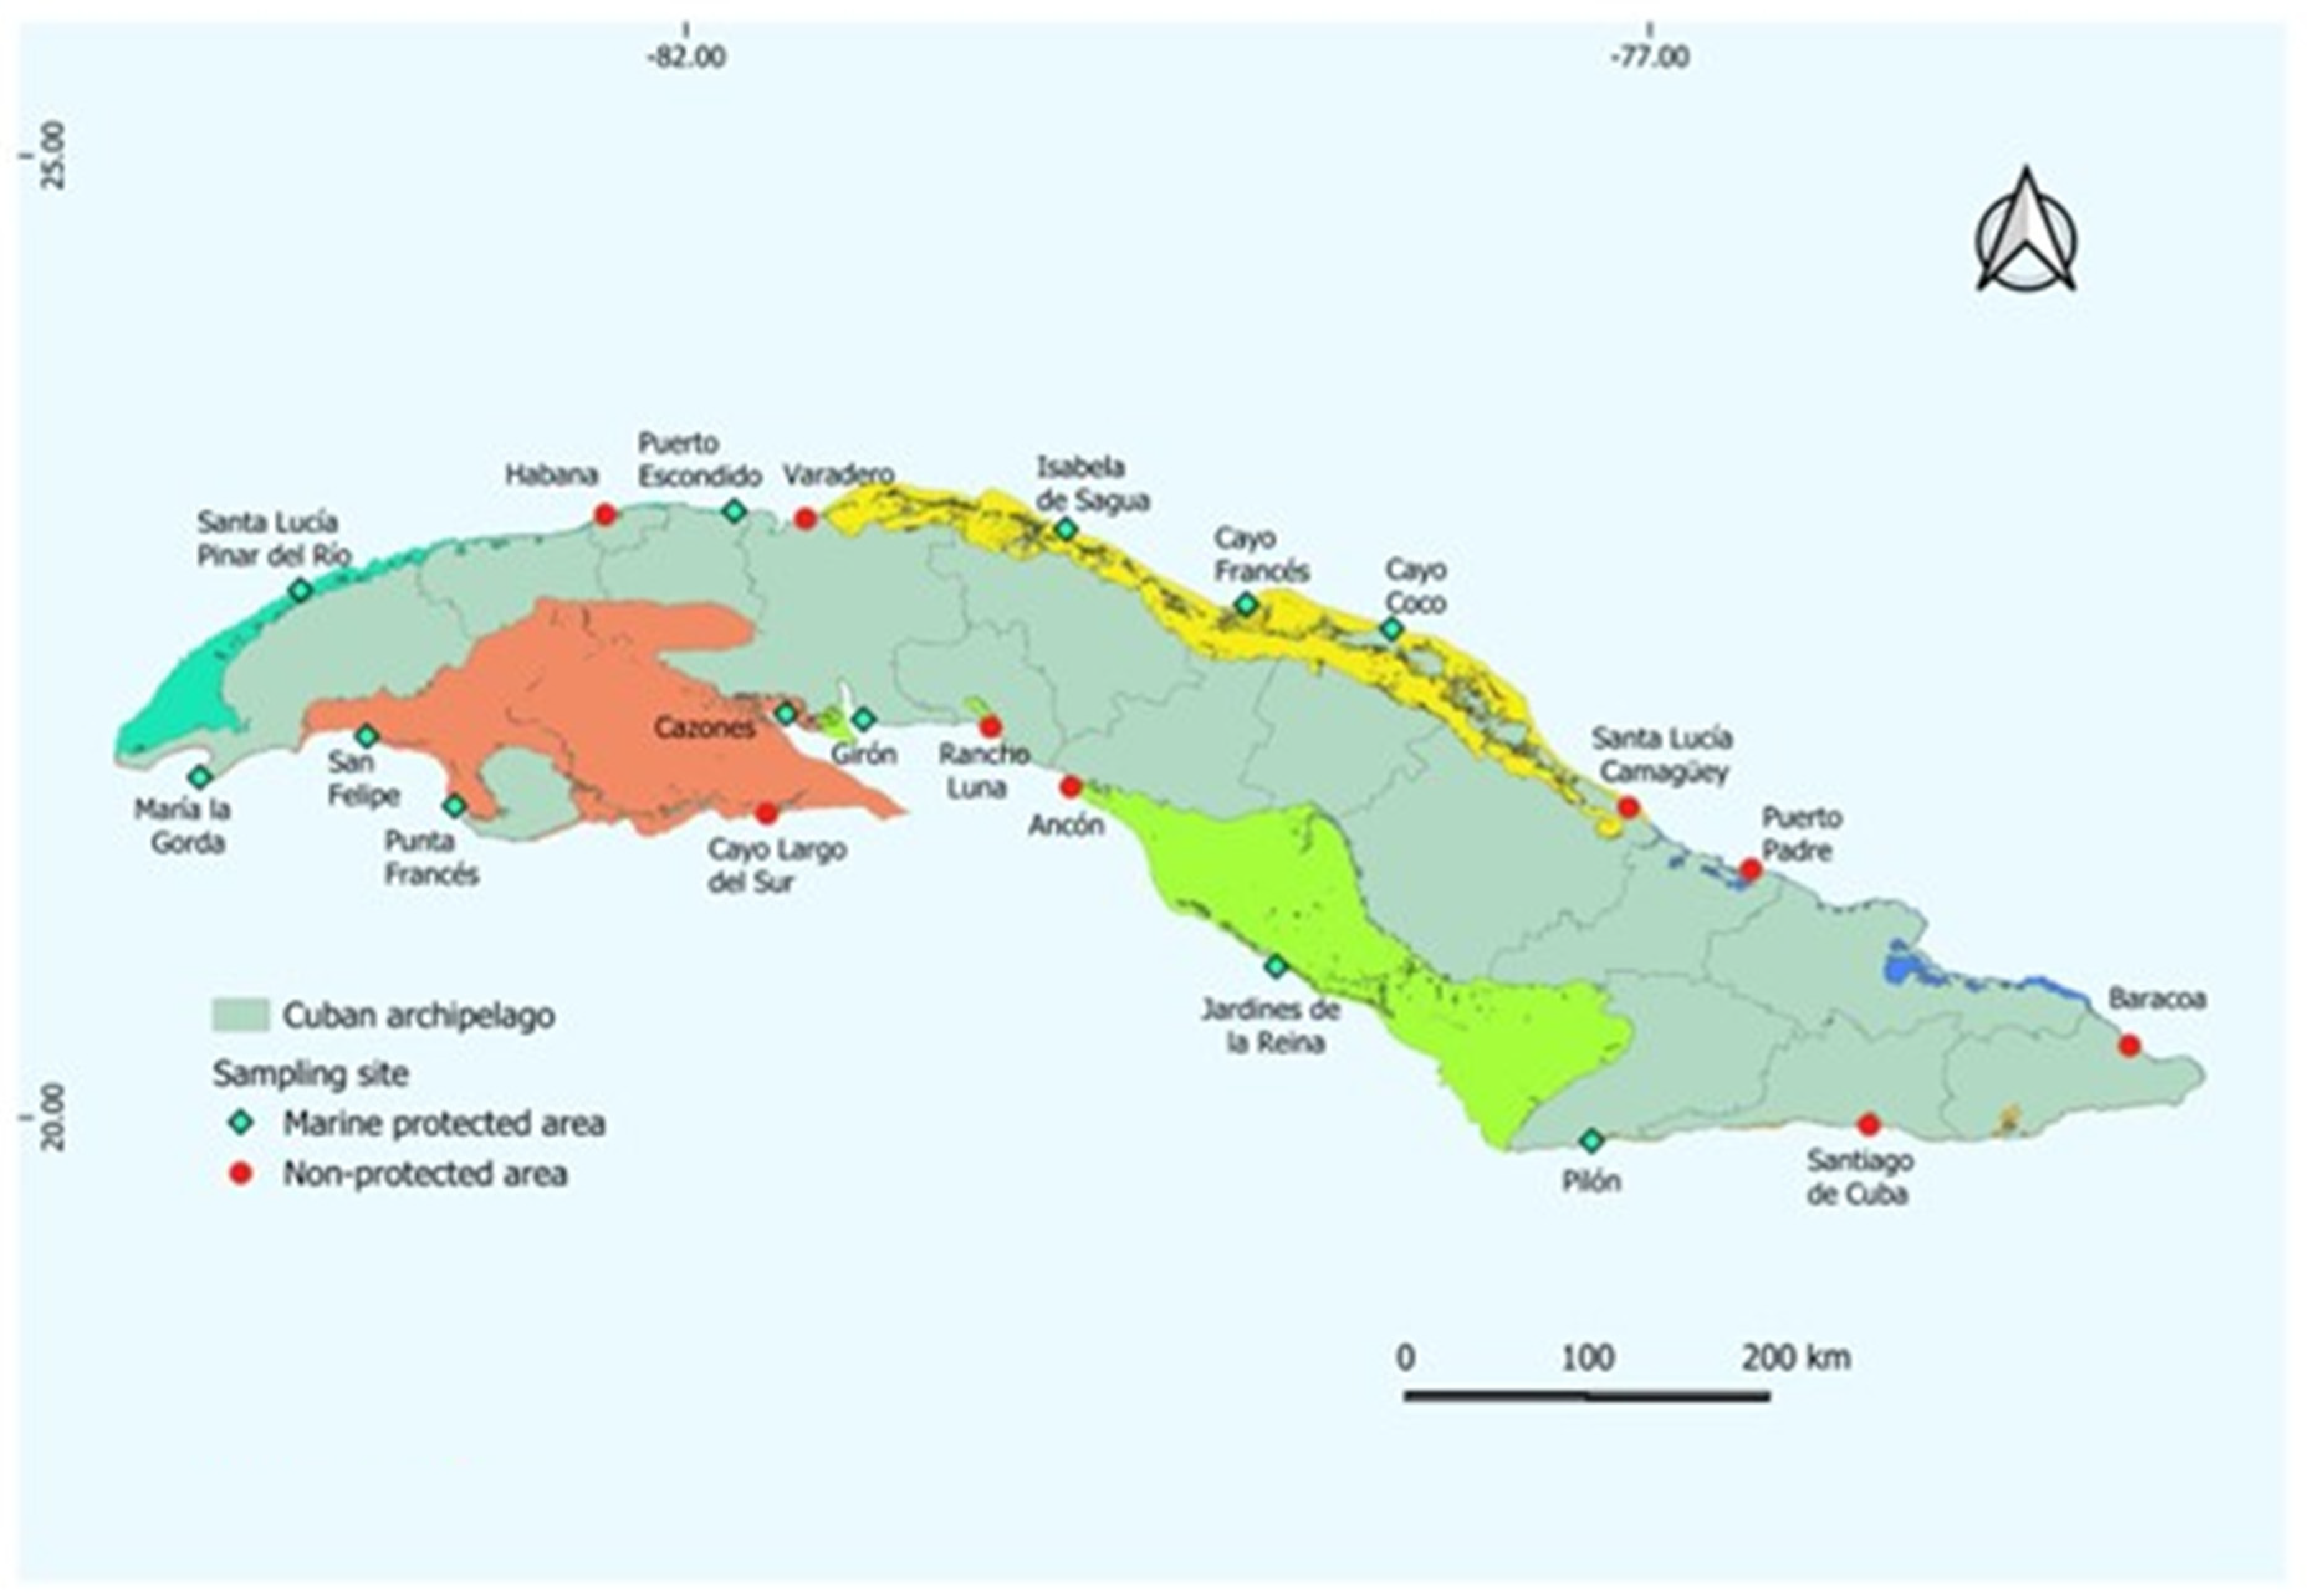
A survey was conducted in 2023 along the Cuban shelf, covering approximately 6000 km of coastline across both northern and southern regions of the archipelago. A total of 40 sampling stations distributed across 22 coral reef sites were selected to represent a gradient of environmental conditions and anthropogenic influence, including 12 MPAs, urbanized coastal zones, industrial regions, and relatively remote reef systems (Figure 1; Table S1). At each station, duplicate surface seawater samples were collected (n = 80) to account for small-scale variability.
Figure 1.
Map of the Cuban archipelago showing the 22 sampled coral reef sites. Sites are classified as marine protected areas (green diamonds) and non-protected areas (red circles).
2.2. Sample Collection
Surface seawater samples were collected at approximately 20 cm depth using pre-cleaned 1 L glass bottles. Sampling followed international guidelines for MP monitoring in water (ISO 5667-27; ISO 16094-2).
At each reef, at least two stations were sampled, and three replicate samples were collected per station. Two replicates were processed for MP analysis, while the third was preserved for future analysis of smaller particle fractions (1–20 µm).
All individual analytical results were used to characterize each reef, without prior averaging at the station level.
2.3. Sample Handling, Transport, and Initial Processing
Samples were transported to the laboratory without filtration and processed under controlled conditions. Filtration was performed using a 20 µm stainless steel mesh under a laminar flow hood.
Microplastic extraction followed an adapted enzymatic digestion protocol [16], using Corolase® 7089 protease (AB Enzymes GmbH, Darmstadt, Germany) at 55 °C for 48 h with intermittent ultrasonication. After digestion, samples were filtered, rinsed, and resuspended prior to final filtration onto 0.8 µm gold-coated polycarbonate filters for spectroscopic analysis.
2.4. Microplastic Identification and Characterization
Microplastics were identified using an automated Laser Direct Infrared (LDIR) imaging system (Agilent 8700, Agilent Technologies Inc., Santa Clara, CA, USA) [16]. Spectra were acquired in the 1800–975 cm−1 range at 8 cm−1 resolution and processed using Clarity software (Agilent Technologies Inc., Santa Clara, CA, USA).
Polymer identification was based on spectral matching against a validated reference library, and only particles with a hit quality index (HQI) ≥ 0.85 were considered.
Particles in the size range of 20–300 µm were included in the analysis. The lower size threshold of 20 µm was selected based on the validated detection capability and spectral reliability of the LDIR imaging system [14,15,16]. This threshold also allowed inclusion of the small-size microplastic fraction frequently underestimated in conventional net-based surveys, thereby improving comparability with recent high-resolution spectroscopic studies.
2.5. Quality Assurance and Quality Control
All laboratory procedures were conducted under ISO Class 5 laminar flow hood to minimize airborne contamination. Airborne particles were monitored using a JUNRAY airborne particle counter (model ZR-1630; Qingdao Junray Intelligent Instrument Co., Ltd., Qingdao, China). Air monitoring was performed by sampling 1 m3 of air at a flow rate of 28.3 L min−1 during and after filtration procedures. No particles larger than 1 µm were detected during monitoring.
Laboratory personnel wore cotton laboratory coats, and laboratory access was restricted during sample processing. Work surfaces were cleaned with 70% ethanol before each analytical session. Only glass and stainless-steel materials were used during sample processing.
Glassware was washed at 75 °C, wrapped in aluminum foil, and combusted at 400 °C for 4 h to remove contaminants. Stainless-steel filters were cleaned with isopropanol followed by ultrasonication. All reagents were filtered through 1 µm stainless-steel filters prior to use.
Analytical control blanks (n = 20) consisting of 3 L of particle-free water were subjected to the complete analytical workflow, including filtration and spectroscopic analysis, to assess laboratory background contamination. Following ISO 16094-2:2025, Water quality—Analysis of microplastics in water—Part 2: Vibrational spectroscopy methods for waters with low content of suspended solids, including drinking water, the reporting limit (RL) was calculated as the mean blank abundance plus three standard deviations (RL = CB + 3σ), resulting in a value of 2.55 MP L−1. Detailed blank data are provided in Table S2.
Cross-contamination during LDIR analysis was evaluated by introducing clean gold-coated filters between sample analyses, and no particles were detected.
Recovery efficiency was evaluated following ISO 16094-2:2025, Water quality—Analysis of microplastics in water—Part 2: Vibrational spectroscopy methods for waters with low content of suspended solids, including drinking water, by spiking particle-free water with microplastic standards (Cospheric LLC, Santa Barbara, CA, USA; 30–150 µm), yielding a mean recovery of 86.0 ± 3.48%.
2.6. Data Analysis and Statistical Treatment
MP abundance was expressed as particles per liter (MP L−1) by dividing the number of identified particles by the filtered sample volume.
Data normality was assessed using the Shapiro–Wilk test. As MP abundance data were non-normally distributed, results are reported as medians and interquartile ranges.
Differences among sites and contamination categories were evaluated using Kruskal–Wallis tests followed by Dunn’s post hoc multiple comparison test with Bonferroni correction. Differences between protected and non-protected reefs were assessed using the Mann–Whitney U test.
Polymer diversity was quantified using the Shannon–Wiener index based on relative polymer contributions at the reef level.
Hierarchical cluster analysis (HCA) and principal component analysis (PCA) were applied to explore spatial patterns in polymer composition using standardized data.
All statistical analyses were performed using OriginPro 2025 (OriginLab Corporation, Northampton, MA, USA), and LDIR data handling was conducted using YABE version 3.0, a Python-based application developed within the framework of the IAEA NUTEC Plastics initiative [23]. YABE was executed using Python version 3.13 (Python Software Foundation, Wilmington, DE, USA).
3. Results
3.1. Microplastic Abundance
Microplastics were detected in 100% of the surface water samples collected from the 22 coral reef sites (Table S3), confirming their ubiquitous presence across the study area. All measured abundances exceeded the method reporting limit (RL = 2.55 MP L−1).
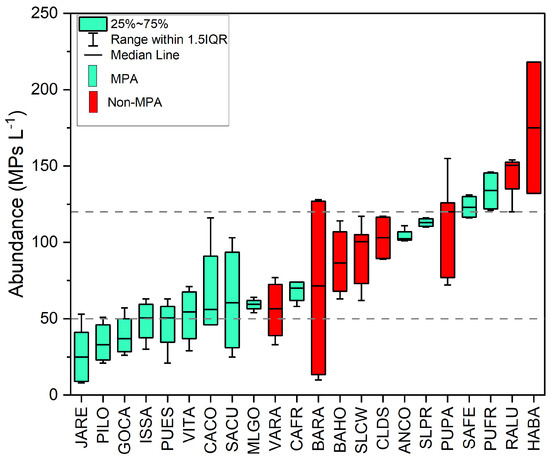
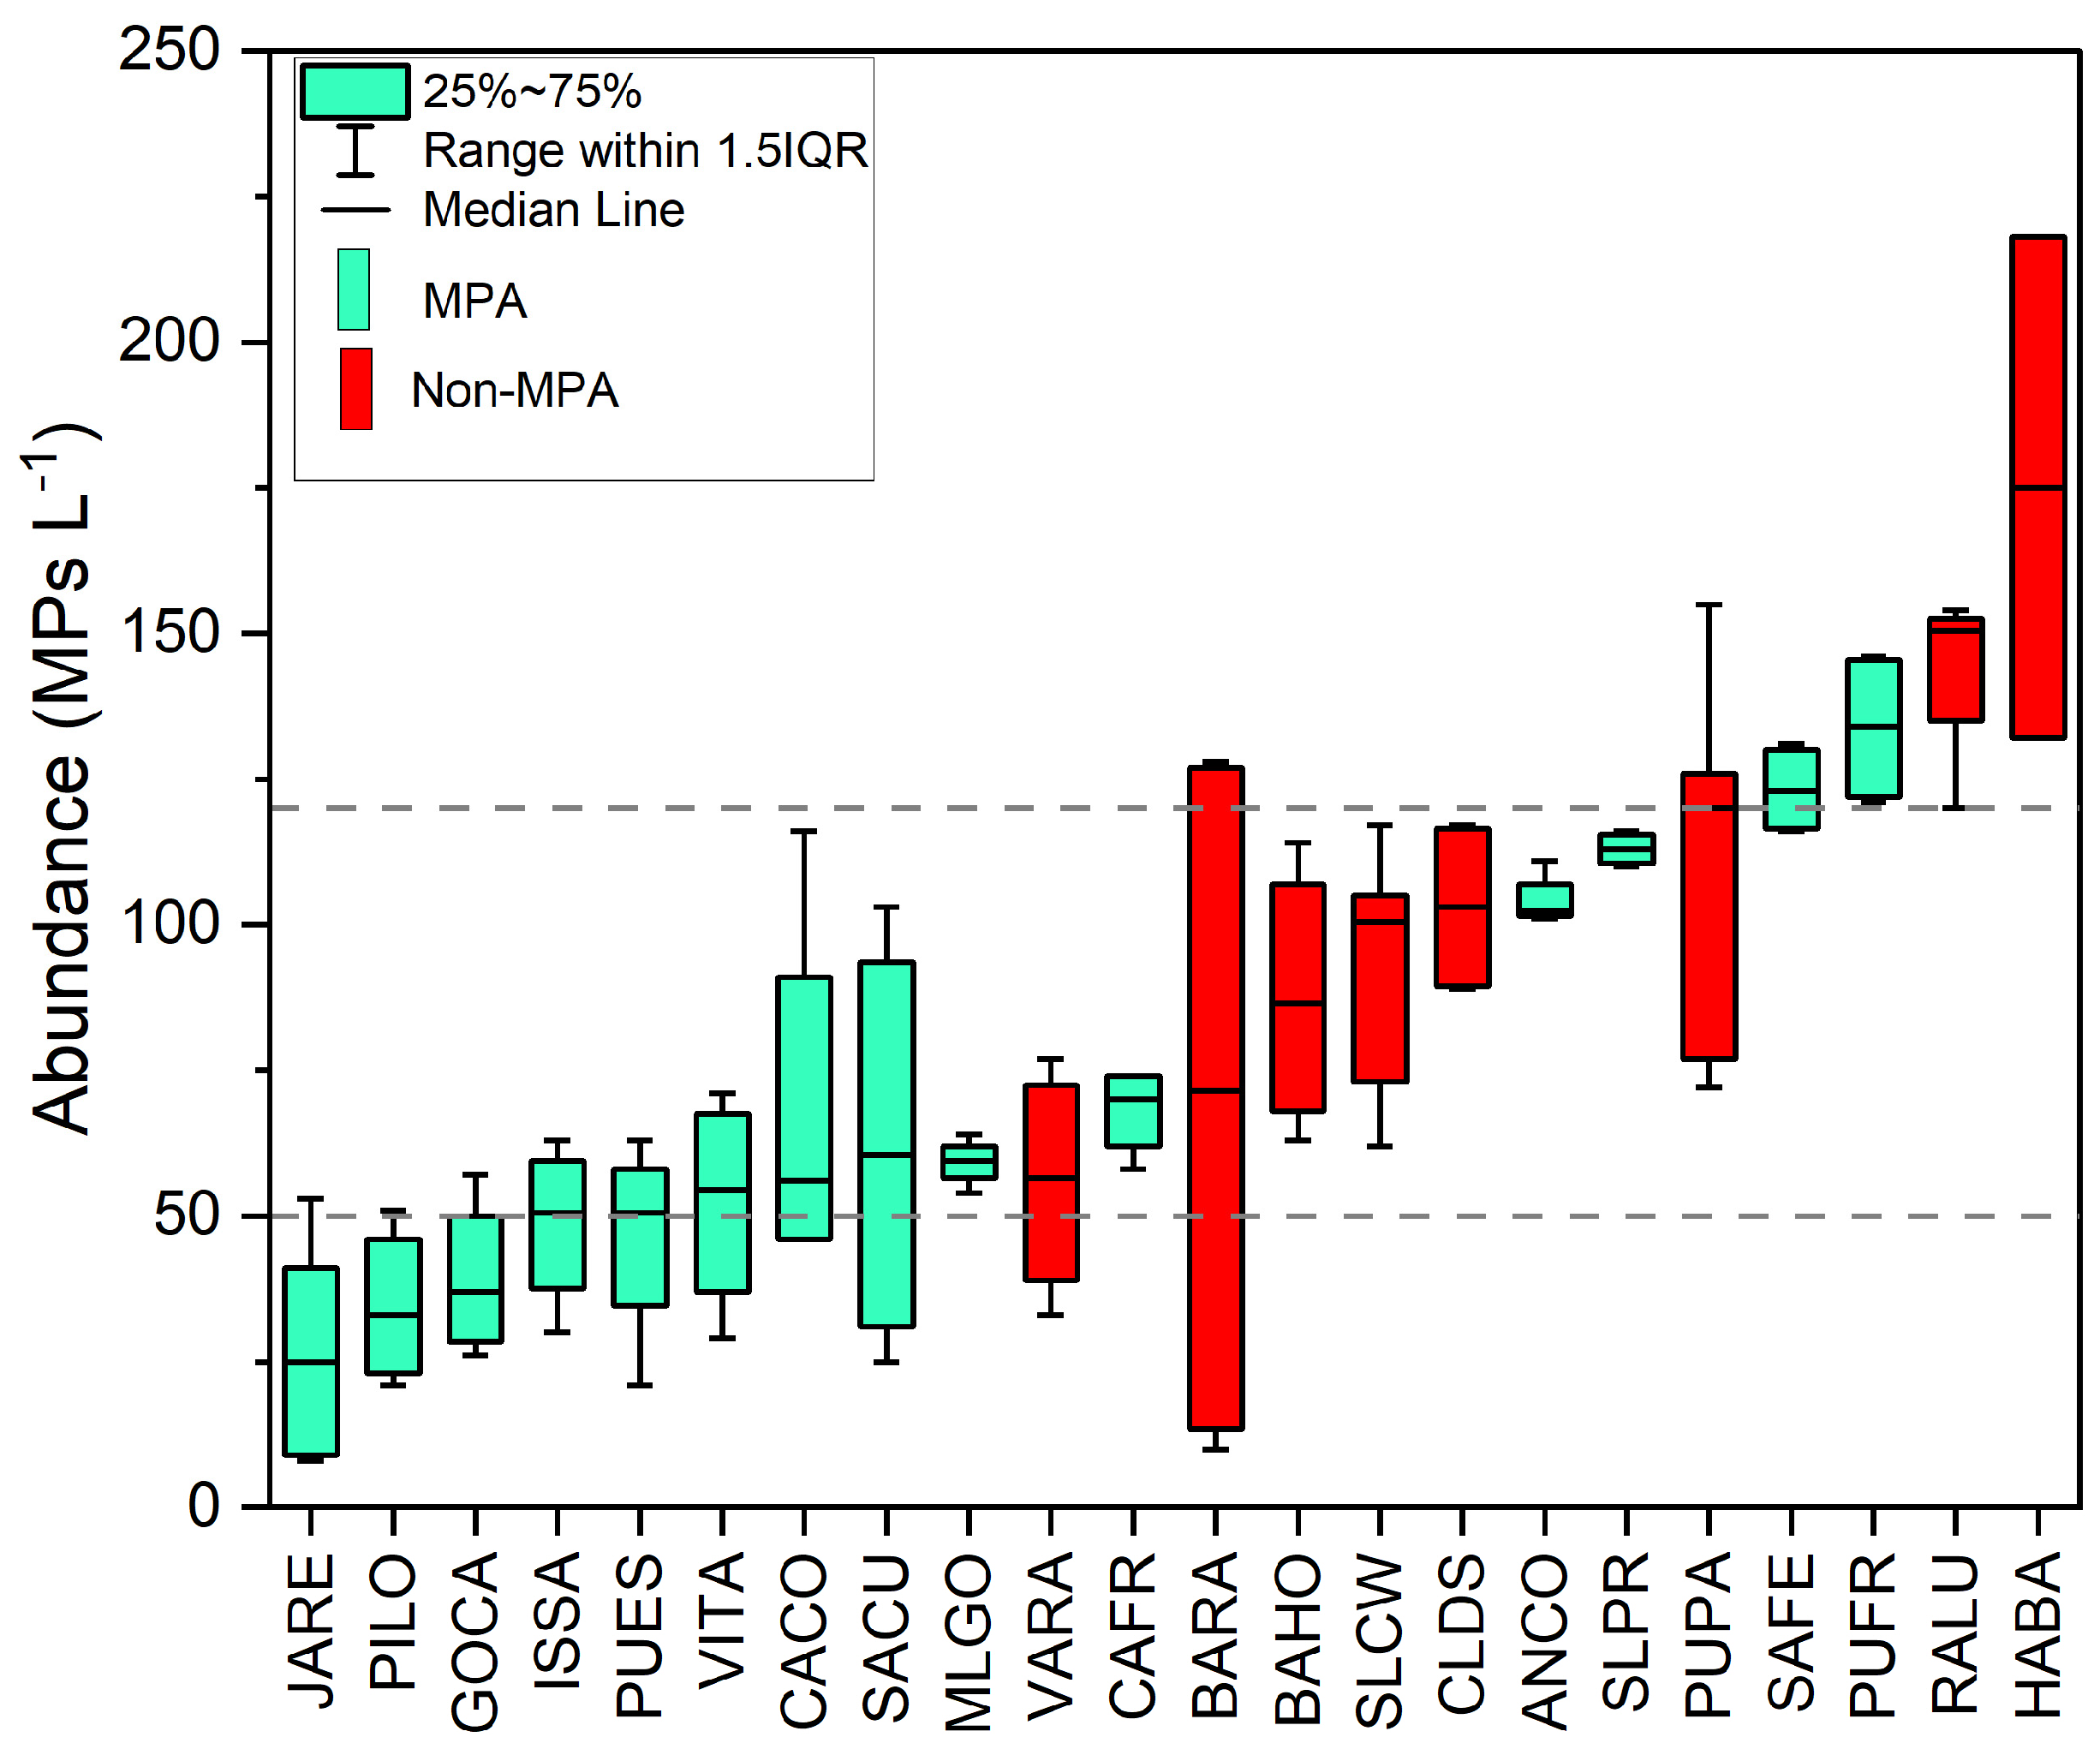
MP abundances were non-normally distributed (Shapiro–Wilk test, p = 0.0062); therefore, robust descriptive statistics were used. Median abundance was 66 MPs L−1 (Q1–Q3: 50–120 MPs L−1), ranging from 8 MPs L−1 at JARE to 218 MPs L−1 at HABA. The data exhibited moderate positive skewness (0.525) and slight negative kurtosis (–0.199), consistent with a moderately right-skewed distribution.
Median MP abundances varied markedly among sampling sites (Figure 2), ranging from 25 MPs L−1 at JARE to 175 MPs L−1 at HABA. The lowest abundances were recorded at JARE, PILO, and GOCA, whereas HABA, RALU, and PUFR exhibited the highest MP abundances. Most sites displayed intermediate abundances, highlighting pronounced spatial heterogeneity in MP distribution. Spatial differences in MP abundances were highly significant (Kruskal–Wallis test: H = 70.02, p < 0.0001).
Figure 2.
Box plot showing the variability of microplastic abundances (MP L−1) across the 22 studied coral reef sites. Black horizontal lines indicate the 25th (Q1; 50 MP L−1) and 75th (Q3; 120 MP L−1) percentiles of site medians, used to classify reefs into low, medium, and high contamination categories. Sites on the x-axis are ordered by increasing median concentration. Green indicates protected areas, whereas red indicates non-protected areas.
Post hoc Dunn pairwise comparisons indicated that significant differences (p < 0.05) were primarily driven by contrasts between low-abundance stations (JARE and PILO) and high-abundance stations (HABA, RALU, PUFR, and SAFE), whereas most intermediate-abundance stations showed no significant differences.
Comparison between protected and non-protected reef sites revealed significantly lower MP abundances in protected areas (Mann–Whitney U test, p < 0.001). Median MP abundances were 55.5 MP L−1 in protected reefs and 104.5 MP L−1 in non-protected reefs, indicating nearly a twofold increase in MP abundance in non-protected areas, although MPs were consistently detected across all sites.
3.2. Polymer Composition, Size, and Morphology
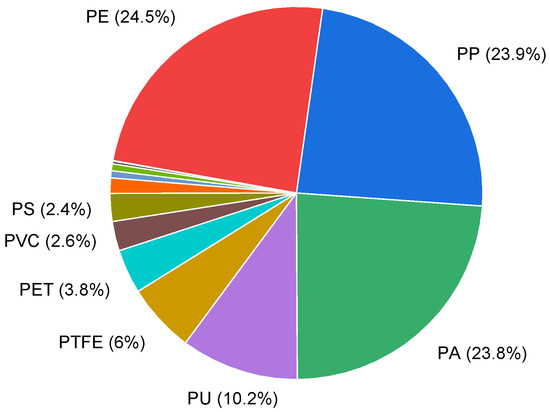
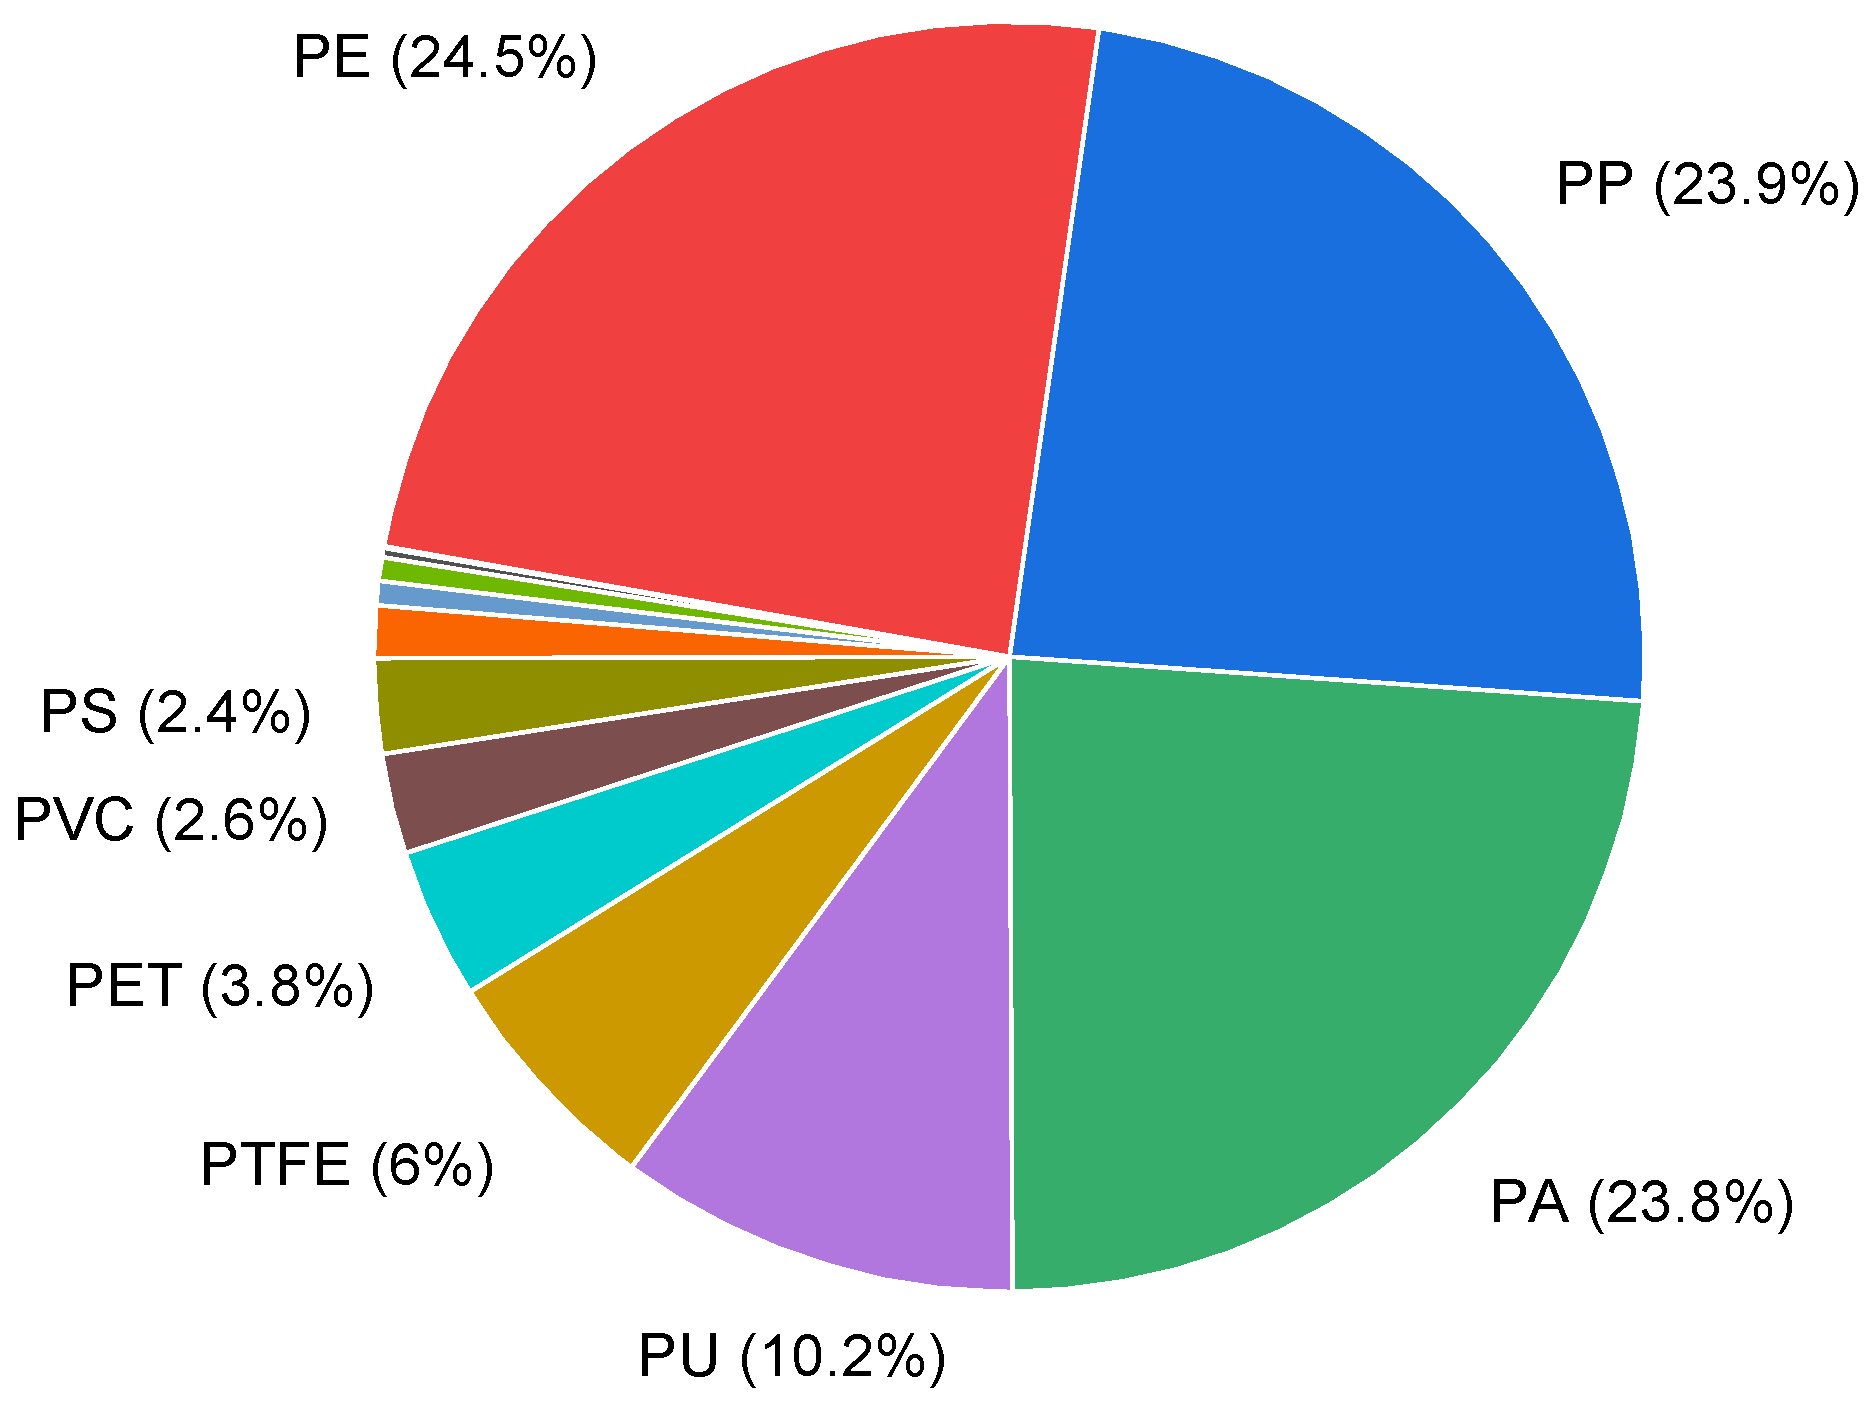
A total of 11 polymer types were identified, with polyethylene (PE, 27%), polyamide (PA, 26%), and polypropylene (PP, 24%) dominating the assemblage (Figure 3).
Figure 3.
Relative polymer composition of microplastic particles (n = 5788) identified across all reef samples. Polyethylene (PE), polypropylene (PP), and polyamide (PA) were the dominant polymers, collectively accounting for 77% of the total.
Polymer composition varied across contamination levels (Table S3). Low-contamination reefs were dominated by PE, PA, and PP (79%), whereas high-contamination reefs showed a reduced contribution of these polymers (56%) and increased proportions of polyurethane (PU, 19%) and polytetrafluoroethylene (PTFE, 8%).
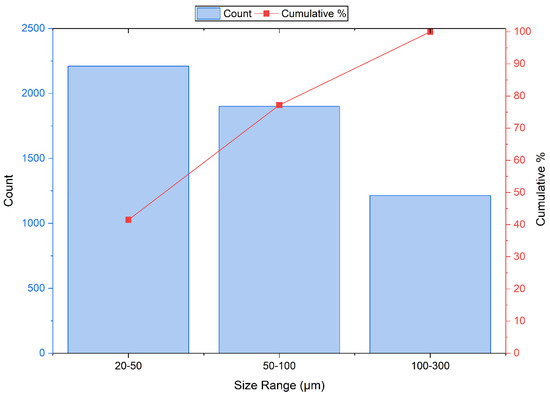
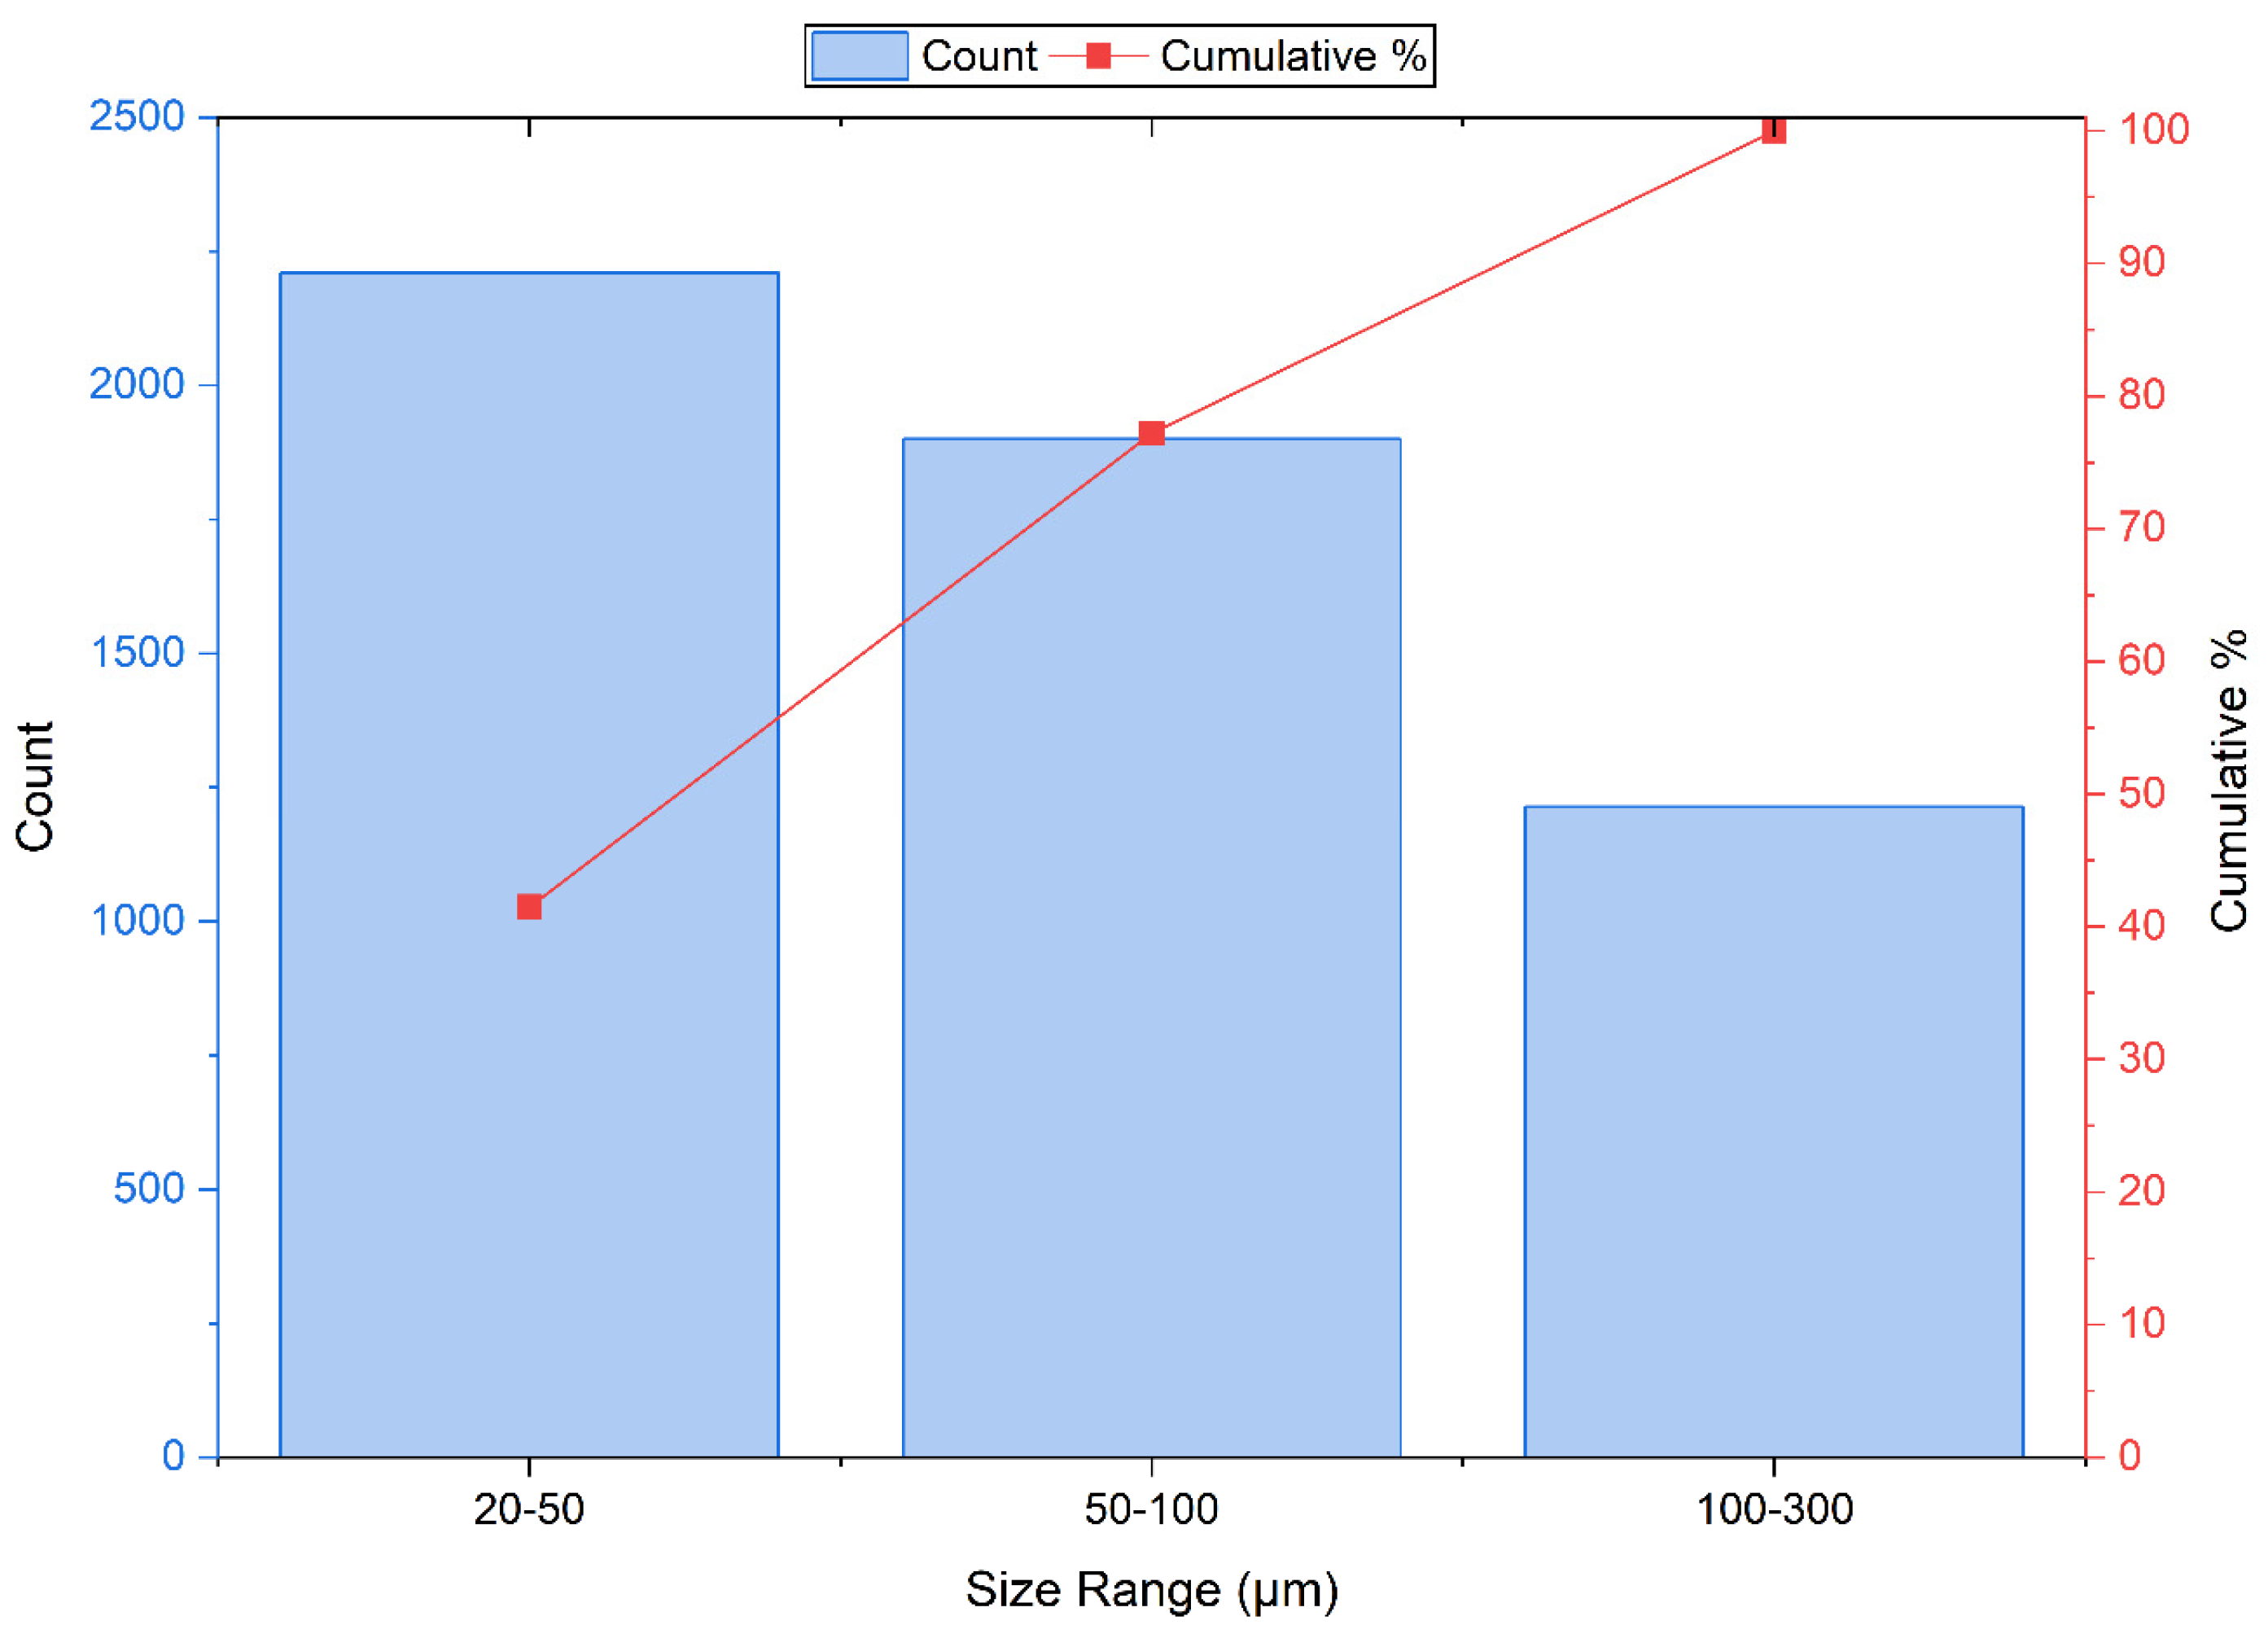
Microplastics were predominantly found in smaller size fractions, with particles < 100 µm accounting for approximately 80% of total MPs (Figure 4). Particle morphology was dominated by irregular fragments (89%), with minor contributions from rounded particles and fibres.
Figure 4.
Size distribution of microplastic particles across all reef sites. Size classes are grouped into 20–50 µm, 50–100 µm, and 100–300 µm. The red line indicates the cumulative percentage.
3.3. Similarity of Reefs Based on Microplastic Profiles
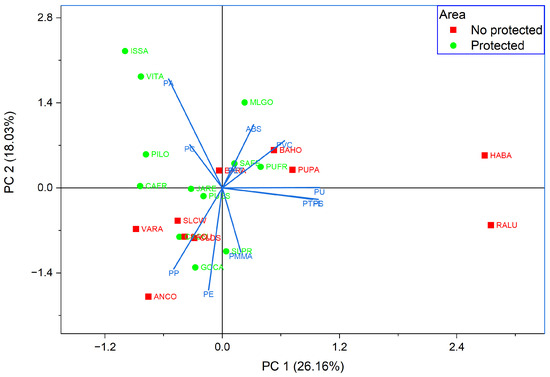
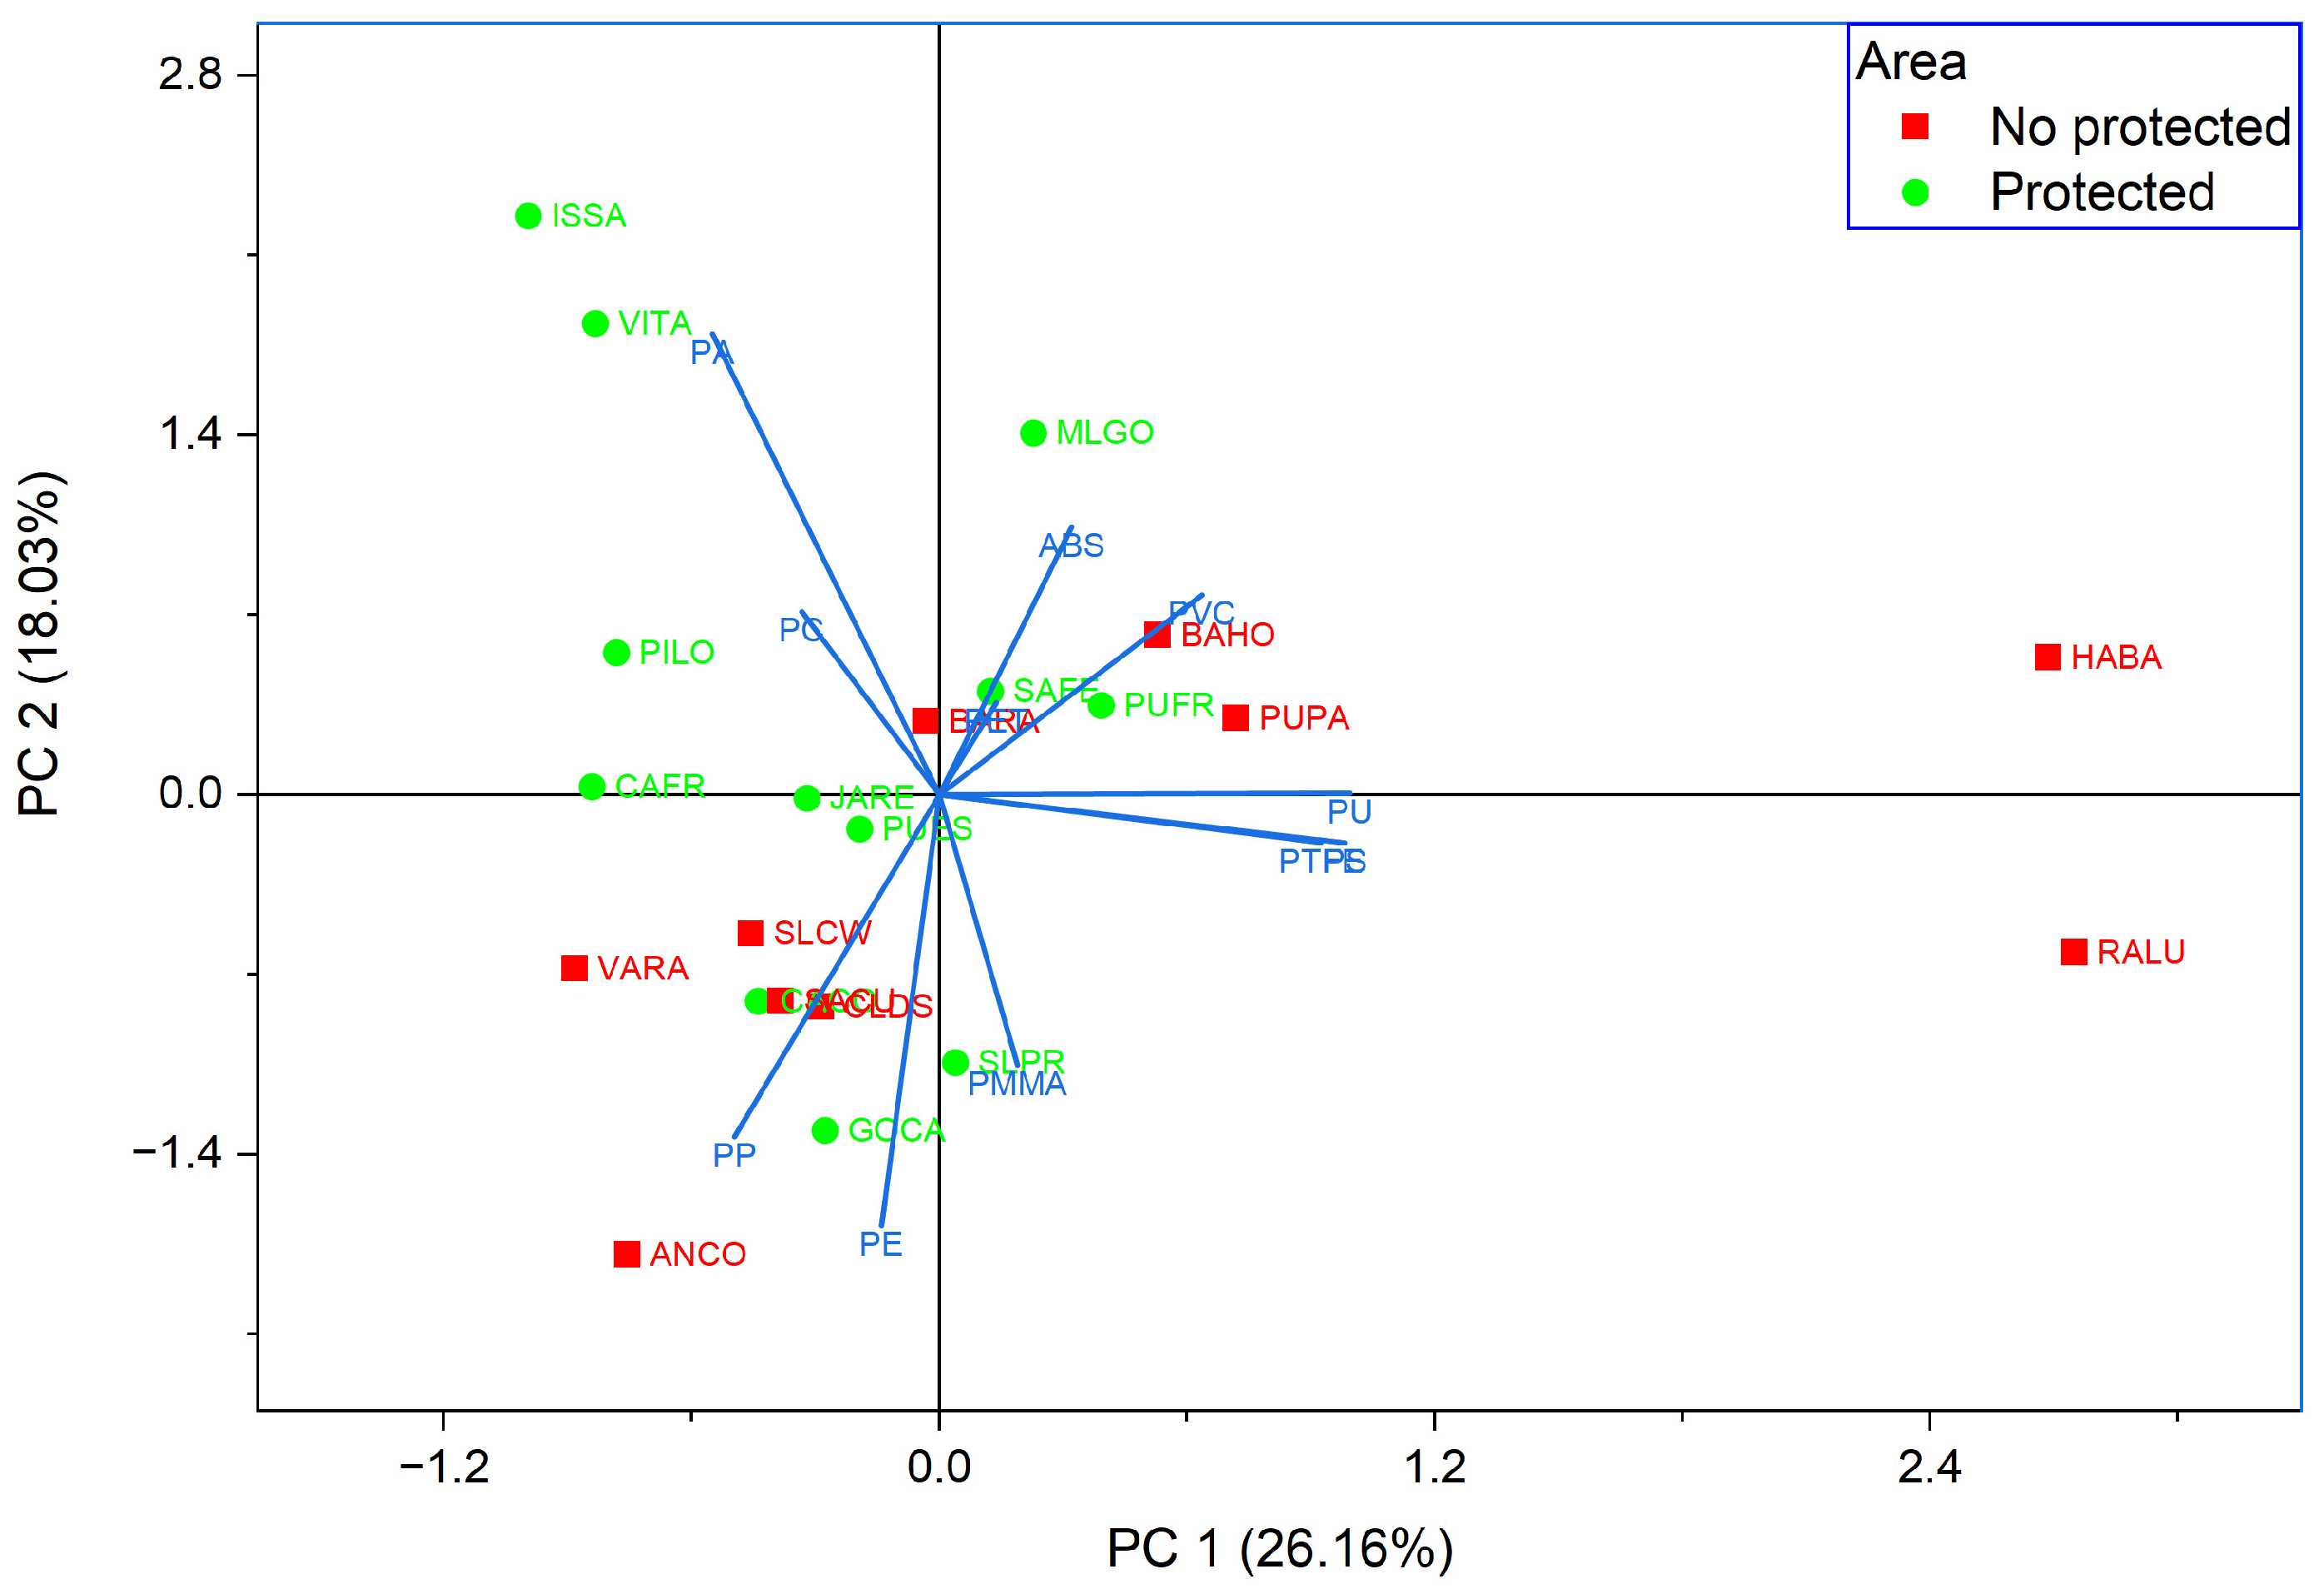
Principal component analysis (PCA) based on polymer composition revealed moderate structuring of sampling stations (Figure 5). The first two components explained 22.6% (PC1) and 19.4% (PC2) of the total variance, indicating that a substantial proportion of variability was distributed across additional dimensions not represented in the two-dimensional ordination. This remaining variance likely reflects the influence of multiple overlapping sources, local environmental heterogeneity, and complex transport and mixing processes characteristic of coral reef environments.
Figure 5.
Principal component analysis (PCA) of polymer composition across reef sites. The first two components explain 22.6% (PC1) and 19.4% (PC2) of the total variance. Arrows represent polymer loadings, indicating their contribution and direction along the principal components. Sampling sites are colored according to protection status (blue: protected areas; orange: non-protected areas).
Within this context, PC1 separated stations with higher contributions of PTFE and PU from those dominated by common-use polymers such as PA, PE, and PP, while PC2 discriminated PA from polyolefins (PE and PP), highlighting variability within common-use polymer assemblages. Rather than defining distinct environmental regimes, the PCA suggested three broad and partially overlapping compositional tendencies: (i) PTFE- and PU-enriched sites, (ii) PA-dominated sites, and (iii) sites characterized by more balanced PE–PP composition. No clear separation was observed in the PCA space between protected and non-protected sites.
Polymer diversity assessed using the Shannon–Wiener index (H′) showed marked spatial variability across reef sites. Higher diversity was observed in sites such as MLGO, PUFR, HABA, and RALU, characterized by a more even distribution of polymer types, whereas lower diversity occurred in sites dominated by a limited number of polymers, such as ISSA (PA-dominated) and SLPR (PE-dominated). Most sites displayed intermediate diversity, with PE, PP, and PA consistently contributing alongside secondary polymers. However, no consistent pattern in polymer diversity was observed between protected and non-protected reef sites, as both groups included sites spanning the full range from low to high diversity.
4. Discussion
4.1. Spatial Patterns of Microplastic Abundance
This study provides the first high-resolution assessment of MP contamination (20–300 µm) across Cuban coral reef ecosystems, revealing the pervasive presence of MPs and pronounced spatial variability in their abundance. Microplastics were detected in all sampled sites, confirming that even relatively remote and protected reef environments are chronically exposed to MP pollution.
The observed spatial variability reflects the combined influence of local anthropogenic inputs, coastal geomorphology, and hydrodynamic conditions, which together control the accumulation and redistribution of MPs in reef environments [7,8]. In this context, the results highlight that MP distribution is not governed by a single process, but rather by the interaction between source intensity and environmental retention capacity. Low-contamination sites (<50 MPs L−1), including JARE, PILO, and GOCA, were consistently associated with remote reef environments characterized by minimal direct anthropogenic influence. These sites are located far from major urban centers, lack significant riverine inputs, and are not affected by industrial or port activities. In addition, all low-contamination sites correspond to marine protected areas, where reduced local pressures and enhanced water exchange likely limit MP accumulation. Similar patterns were observed in reefs with slightly higher but still relatively low abundances (e.g., ISSA, PUES, VITA, and CACO), suggesting that low contamination levels are primarily controlled by the absence of local sources rather than by complete isolation from regional inputs.
In contrast, the highest MP abundances were consistently observed in reef systems adjacent to semi-enclosed bays subject to intense anthropogenic pressure. Sites such as PUPA (Puerto Padre), RALU (Cienfuegos), and HABA (Havana) are directly influenced by urban, industrial, and port-related discharges, as well as riverine inputs, which are widely recognized as major pathways of MPs to coastal environments [24,25]. The semi-enclosed nature of these bays promotes the retention and accumulation of contaminants due to reduced water exchange and continuous pollutant inputs, resulting in elevated MP abundances in adjacent reef areas. This pattern is consistent with previous studies demonstrating that coastal embayment can act as accumulation zones for marine debris and MPs [24].
An important exception to this general pattern was observed in the reefs SAFE and PUFR, which exhibited relatively high MP abundances despite being located within marine protected areas and characterized by limited local anthropogenic influence. This suggests that local sources alone cannot fully explain contamination patterns in these systems. Instead, regional oceanographic processes likely play a significant role. Both sites are influenced by circulation associated with the Yucatán Channel, a key pathway connecting the Caribbean Sea and the Gulf of Mexico and characterized by strong northward flow [26,27]. This circulation has been associated with the large-scale transport of water masses and suspended particles, including MPs, across the Caribbean basin [21,24]. The elevated abundances observed in these otherwise low-impact sites are therefore consistent with the potential influence of regional transport processes contributing to MP accumulation even in protected reef environments.
Overall, these results indicate that MP abundance in coral reef systems is controlled by a hierarchical combination of processes: (i) local inputs associated with urban, industrial, and riverine sources; (ii) geomorphological and hydrodynamic conditions that regulate retention and accumulation; and (iii) regional oceanographic transport that redistributes MPs across the basin. This framework highlights the need to consider both local and large-scale processes when assessing MP contamination in coastal ecosystems and explains the widespread presence of MPs even in protected reef environments.
Because sampling was conducted during a single survey period, the present study should be interpreted as a regional baseline assessment of microplastic contamination in Cuban coral reef environments rather than a characterization of seasonal or diurnal variability. Future multi-temporal studies integrating seasonal and hydrodynamic variability will be important to further constrain temporal changes in microplastic abundance and polymer composition.
4.2. Global Context: Positioning Caribbean Coral Reef Systems Within the Global Microplastic Spectrum
Comparisons of MP abundances across studies remain inherently challenging due to differences in sampling strategies, analytical techniques, and size detection limits. To reduce methodological inconsistencies, the present comparison was restricted to studies applying automated micro-spectroscopic techniques (e.g., LDIR, µFTIR, or µRaman) with comparable lower size thresholds (~20 µm). This approach minimizes biases associated with the underrepresentation of small MP fractions and enables a more robust cross-study evaluation. Based on these criteria, data from 25 peer-reviewed studies worldwide were compiled (Table S4), and the global distribution of MP abundances is presented in the Supplementary Information (Figure S1).
Within this harmonized framework, MP abundances observed in Cuban coral reef systems span a wide range of values, encompassing conditions from relatively low contamination to highly impacted environments. Low-contamination sites fall within the lower range of values reported for coastal systems worldwide, comparable to remote or minimally impacted marine environments. In contrast, highly impacted sites such as HABA and RALU exhibited MP abundances comparable to those reported for urbanized coastal zones and semi-enclosed systems influenced by strong anthropogenic inputs. (see Figure S1).
This broad distribution suggests that Cuban coral reef systems encompass a wide range of MP contamination conditions, including both relatively low-contamination reefs and sites comparable to impacted coastal environments reported in other high-resolution studies. In this sense, the study area encompasses reef environments influenced by both diffuse background contamination and localized anthropogenic pressures associated with urban and industrial activities.
Importantly, the coexistence of relatively low-contamination reef environments and highly impacted sites within the same regional system highlights the pronounced spatial heterogeneity that characterizes MP distribution in coastal ecosystems. These observations suggest that coral reef systems, including marine protected areas, may still be exposed to substantial MP contamination despite relatively low local anthropogenic pressure. Furthermore, these results suggest that MP contamination in reef systems may reflect the combined influence of both local conditions and broader regional transport processes. While elevated abundances are clearly associated with local anthropogenic inputs, the widespread presence of MPs across all sites, including remote and protected reefs, indicates a significant contribution from regional oceanographic transport. This dual influence of local sources and basin-scale processes reinforces the need for integrated monitoring frameworks that account for both source-driven inputs and large-scale connectivity.
Overall, the findings highlight the complexity of MP contamination in Caribbean coral reef systems, where regional background contamination, localized anthropogenic pressures, and transport-related processes likely interact to shape observed distribution patterns. These results also underscore the relevance of the Caribbean as an important region for investigating MP dynamics in coastal ecosystems and emphasize the need for standardized, high-resolution assessments to improve cross-study comparability. Despite efforts to improve comparability by restricting the analysis to studies applying high-resolution spectroscopic techniques with similar lower size thresholds, methodological differences among studies—including sampling strategies, filtration procedures, analytical workflows, and reporting approaches—still limit direct quantitative comparisons across regions. Therefore, the global comparison presented here should be interpreted primarily as a broad contextual reference rather than as a precise ranking of contamination levels among coral reef systems worldwide.
4.3. Size Distribution and Morphology of Microplastics
Microplastic size distributions were strongly skewed toward smaller particles, with approximately 80% of detected MPs measuring <100 µm and the 20–50 µm fraction alone accounting for the majority of particles (Figure 4). This pattern was consistent across all sampling sites, indicating that the dominance of small MPs is a pervasive feature of reef-associated environments rather than a site-specific characteristic. The use of a 20 µm lower threshold was therefore critical to adequately capture the dominant small-particle fraction that is often overlooked in studies using larger mesh sizes or lower-resolution analytical approaches.
The predominance of small particles has important implications for both environmental assessment and ecological risk. Smaller MPs exhibit higher surface-area-to-volume ratios and greater bioavailability, increasing the likelihood of ingestion across multiple trophic levels and enhancing their potential for biological interactions [28,29,30]. In addition, their numerical dominance suggests that studies focusing on larger size fractions may substantially underestimate total MP abundance in marine systems.
Morphologically, irregular fragments overwhelmingly dominated the dataset (~89%), with only minor contributions from fibers and rounded particles. This fragment-dominated profile is consistent with advanced stages of environmental degradation, reflecting the progressive fragmentation of larger plastic debris under mechanical and photochemical processes. Recent evidence also suggests that intrinsic stress-driven degradation processes in semicrystalline plastics such as PE and PP may contribute to the release of amorphous polymer micropollutants into aquatic systems, representing an additional pathway for the formation of small plastic particles beyond classical fragmentation mechanisms. In contrast, fibers (commonly associated with wastewater and textile sources) are more frequently reported in studies targeting larger size fractions, suggesting a size-dependent bias in morphological composition.
Overall, these results highlight the importance of incorporating small MP fractions into monitoring frameworks, as their exclusion may lead to significant underestimation of contamination levels and misrepresentation of particle characteristics in coral reef environments.
4.4. Polymer Composition and Environmental Drivers
Polymer composition showed clear spatial variability associated with contamination gradients and provided useful insights into the relative influence of diffuse background inputs and source-related anthropogenic contributions. A total of 11 polymer types were identified, with PE, PA, and PP dominating the assemblage and jointly accounting for approximately 77% of the detected particles (Figure 3). These polymers were consistently observed across all sampling sites, supporting their role as ubiquitous background components of MP contamination in reef-associated environments. Their widespread occurrence is consistent with global production patterns and their dominance in marine environments, where PE, PP, and PA are among the most frequently reported polymers due to their extensive use, buoyancy, and environmental persistence [2,18].
Despite this general consistency, polymer composition varied markedly across contamination gradients. Low-contamination reefs were characterized by relatively homogeneous assemblages dominated by PE, PA, and PP, whereas highly contaminated sites exhibited a clear shift toward more complex and heterogeneous profiles, with increasing contributions from polymers such as PU, PTFE, and PVC. This transition is consistent with a shift from diffuse, regionally distributed inputs toward more localized anthropogenic influences under elevated contamination conditions [18,19]. This shift in polymer composition across contamination gradients suggests differences between regionally homogenized background contamination and sites potentially influenced by stronger local anthropogenic inputs, reinforcing the value of polymer-resolved analysis as a tool for source discrimination.
This pattern was particularly evident in the most impacted sites (PUPA, RALU, and HABA), which are located adjacent to semi-enclosed bay systems receiving substantial urban, industrial, and port-related discharges, as well as riverine inputs. Large rivers are widely recognized as major pathways transporting plastic debris and MPs from terrestrial environments to the ocean [31], while semi-enclosed bays can act as accumulation and transformation zones due to limited water exchange and continuous pollutant inputs [32]. The combined influence of these processes may promote both retention and redistribution of MPs, potentially contributing to more heterogeneous polymer assemblages in adjacent reef environments.
The enrichment of less commonly reported polymers such as PTFE, PU, and PVC is consistent with localized anthropogenic influence. PTFE is a high-performance fluoropolymer widely used in industrial and consumer applications, including non-stick coatings, electrical insulation, and high-resistance materials. Recent studies have shown that PTFE can release micro- and nanoplastics through thermal degradation and mechanical wear, suggesting previously underrecognized pathways of environmental contamination [33]. Similarly, PU is commonly associated with urban materials and infrastructure, and its increased contribution in impacted sites is consistent with inputs from urban runoff and wastewater systems [34,35,36]. PVC, which is widely used in construction and industrial applications, is typically denser than seawater and therefore less prone to long-range surface transport. Its presence and enrichment in impacted sites are also consistent with the potential influence of local inputs and retention processes within semi-enclosed coastal environments. Overall, the combined occurrence of these polymers suggests compositional patterns associated with urban and industrial activities, distinguishing impacted reef systems from those primarily influenced by diffuse background inputs.
Multivariate analysis further reinforced these patterns. PCA suggested three broad and partially overlapping compositional tendencies: (i) sites enriched in PTFE and PU, (ii) PA-dominated sites, and (iii) sites characterized by a more balanced PE–PP composition (Figure 5). These compositional tendencies are consistent with differences in contamination settings and potential source influences and highlight the combined influence of localized sources and regional background inputs. Notably, no clear separation was observed between protected and non-protected reef sites, indicating that protection status does not exert a strong control on polymer-specific composition. Importantly, the lack of clear separation between protected and non-protected reefs in compositional space is also consistent with the potential influence of regional-scale processes over local management measures in shaping polymer distributions.
Polymer diversity patterns further support these findings. Sites with higher diversity exhibited more even polymer distributions, consistent with the influence of multiple and overlapping sources, whereas low-diversity sites were dominated by one or few polymer types, reflecting more homogeneous inputs or selective retention processes [18].
Notably, SAFE and PUFR exhibited elevated MP abundances but were dominated by common polymers such as PE, PP, and PA, with no detection of less frequently occurring polymers such as PTFE or PU. This suggests that contamination at these locations may not be primarily driven by localized inputs but could instead reflect the accumulation of regionally transported MPs. The predominance of widely distributed polymers is consistent with long-range transport and mixing processes across the Caribbean basin [20,21], potentially influenced by circulation associated with the Yucatán Channel. Although hydrodynamic modelling was beyond the scope of the present study, these observations support a possible contribution of regional transport processes to MP accumulation at these remote reef sites. Therefore, elevated MP abundance should not necessarily be interpreted as direct evidence of local contamination sources.
Together, these results suggest that MP contamination in coral reef environments may not be explained solely by local sources. Instead, they indicate that MP pollution in coral reef environments likely reflects the interplay between ubiquitous background contamination, localized anthropogenic inputs, and regional oceanographic transport processes. The observed decoupling between MP abundance and polymer-specific composition highlights the limitations of relying solely on abundance-based metrics to assess contamination sources. Instead, polymer-resolved analysis provides a useful framework for distinguishing between patterns potentially associated with regional transport and localized anthropogenic influence.
These findings have important implications for monitoring and management strategies in coral reef systems, as they indicate that even remote or protected reefs may be significantly impacted by regionally transported MPs. Consequently, effective mitigation efforts must consider not only local pollution control but also transboundary inputs and large-scale circulation patterns. Furthermore, the integration of polymer composition with abundance and diversity metrics provides a useful approach for improving source apportionment and understanding MP dynamics in complex coastal environments.
Future research should integrate polymer-resolved observations with hydrodynamic modelling to better constrain source–transport relationships in reef-associated environments.
5. Conclusions
This study indicates that polymer composition provides critical insights into the sources and processes governing MP distribution in coral reef environments, beyond what can be inferred from abundance alone. The dominance of PE, PP, and PA across all sites reflects a pervasive regional background signal, while the enrichment of polymers such as PU, PTFE, and PVC in impacted areas indicates localized anthropogenic inputs associated with urban and industrial activities.
The decoupling between microplastic abundance and polymer composition highlights contrasting contamination patterns, where elevated abundances do not necessarily correspond to local sources. In particular, sites such as SAFE and PUFR suggest how regionally transported MPs may accumulate in reef systems while maintaining a homogeneous polymer signature.
These findings emphasize the importance of integrating polymer-specific analysis with abundance and diversity metrics to improve source identification and better understand MP dynamics in complex coastal environments. Effective monitoring and mitigation strategies in coral reef systems should therefore consider both local pollution sources and large-scale transport processes that influence contaminant distribution.
Supplementary Materials
The following supporting information can be downloaded at: https://www.mdpi.com/article/10.3390/microplastics5020124/s1, Table S1: Microplastic abundances (MPs L−1) across the 22 coral reef sites; Table S2. Control blanks; Table S3: Relative polymer composition (%) of microplastic particles identified at each reef site; Table S4: Global comparison of microplastic characteristics in surface waters using LDIR-based analysis, including abundance, size distribution, polymer composition, and particle morphology; Figure S1: Global comparison of microplastic abundances (MPs L−1) reported in surface waters across different marine and riverine environments.
Author Contributions
Conceptualization, Y.H.P. and C.A.-H.; methodology, Y.H.P., N.B. and C.A.-H.; validation, Y.H.P., N.B. and C.A.-H.; formal analysis, A.G.C., Y.H.P., N.B. and C.A.-H.; investigation, Y.H.P., N.B., A.F.R.R., D.R.N., J.I.H.-A., A.A.V., M.A.G.V., M.M., L.R., F.O. and C.A.-H.; resources, Y.H.P. and C.A.-H.; data curation, Y.H.P., N.B. and C.A.-H.; writing—original draft preparation, Y.H.P., N.B. and C.A.-H.; writing—review and editing, Y.H.P., N.B., A.F.R.R., D.R.N., J.I.H.-A., A.A.V., M.A.G.V., M.M., L.R., F.O. and C.A.-H.; visualization, Y.H.P. and C.A.-H.; supervision, Y.H.P. and C.A.-H.; project administration, Y.H.P. and C.A.-H. All authors have read and agreed to the published version of the manuscript.
Funding
This work was partially supported by project ISOVIDA of the Cuban Nuclear Agency and Advanced Technologies and the national project CUB7011 of the International Atomic Energy Agency.
Data Availability Statement
All data supporting the findings of this study are available within the manuscript and Supplementary Materials.
Acknowledgments
This work was partially supported by project ISOVIDA of the Cuban Nuclear Agency and Advanced Technologies and the national project CUB7011 of the International Atomic Energy Agency. The authors thank the participants in BOJEO CUBA 2024 for their assistance during sample collection, as well as the captain and crew of the R/V Oceans for Youth for facilitating the monitoring work at all times. The IAEA is grateful to the Government of the Principality of Monaco for the support provided to its Marine Environment Laboratories.
Conflicts of Interest
The authors declare no conflicts of interest.
Abbreviations
The following abbreviations are used in this manuscript:
| JARE | Jardines de la Reina |
| PILO | Pilon |
| GOCA | Cazones |
| ISSA | Isabela de Sagua |
| PUES | Puerto Escondido |
| VITA | Guardalavaca |
| CACO | Cayo Coco |
| SACU | Santiago de Cuba |
| MLGO | Maria la Gorda |
| VARA | Varadero |
| CAFR | Cayo Frances |
| BARA | Baracoa |
| SLCW | Santa Lucia de Camaguey |
| CLDS | Cayo Largo del Sur |
| ANCO | Ancon |
| SLPR | Santa Lucia Pinar del Rio |
| BAHO | Bahia la Honda |
| PUPA | Puerto Padre |
| SAFE | San Felipe |
| PUFR | Punta Frances |
| RALU | Rancho Luna |
| HABA | Habana |
References
- Thompson, R.C.; Olsen, Y.; Mitchell, R.P.; Davis, A.; Rowland, S.J.; John, A.W.; McGonigle, D.; Russell, A.E. Lost at Sea: Where Is All the Plastic? Science 2004, 304, 838. [Google Scholar] [CrossRef] [PubMed]
- Andrady, A.L. The plastic in microplastics: A review. Mar. Pollut. Bull. 2017, 119, 12–22. [Google Scholar] [CrossRef] [PubMed]
- Gall, S.C.; Thompson, R.C. The impact of debris on marine life. Mar. Pollut. Bull. 2015, 92, 170–179. [Google Scholar] [CrossRef] [PubMed]
- Wright, R.J.; Erni-Cassola, G.; Zadjelovic, V.; Latva, M.; Christie-Oleza, J.A. Marine Plastic Debris: A New Surface for Microbial Colonization. Environ. Sci. Technol. 2020, 54, 11657–11672. [Google Scholar] [CrossRef] [PubMed]
- Borrelle, S.B.; Ringma, J.; Law, K.L.; Monnahan, C.C.; Lebreton, L.; McGivern, A.; Murphy, E.; Jambeck, J.; Leonard, G.H.; Hilleary, M.A.; et al. Predicted growth in plastic waste exceeds efforts to mitigate plastic pollution. Science 2020, 369, 1515–1518. [Google Scholar] [CrossRef] [PubMed]
- Hughes, T.P.; Kerry, J.T.; Baird, A.H.; Connolly, S.R.; Dietzel, A.; Eakin, C.M.; Heron, S.F.; Hoey, A.S.; Hoogenboom, M.O.; Liu, G.; et al. Global warming transforms coral reef assemblages. Nature 2018, 556, 492–496. [Google Scholar] [CrossRef] [PubMed]
- Huang, W.; Chen, M.; Song, B.; Deng, J.; Shen, M.; Chen, Q.; Zeng, G.; Liang, J. Microplastics in the coral reefs and their potential impacts on corals: A mini-review. Sci. Total Environ. 2021, 762, 143112. [Google Scholar] [CrossRef] [PubMed]
- Reichert, J.; Arnold, A.L.; Hammer, N.; Miller, I.B.; Rades, M.; Schubert, P.; Ziegler, M.; Wilke, T. Reef-building corals act as long-term sink for microplastic. Glob. Chang. Biol. 2022, 28, 33–45. [Google Scholar] [PubMed]
- Lamb, J.B.; Willis, B.L.; Fiorenza, E.A.; Couch, C.S.; Howard, R.; Rader, D.N.; True, J.D.; Kelly, L.A.; Ahmad, A.; Jompa, J.; et al. Plastic waste associated with disease on coral reefs. Science 2018, 359, 460–462. [Google Scholar] [CrossRef] [PubMed]
- de Carvalho-Souza, G.F.; Llope, M.; Tinôco, M.S.; Medeiros, D.V.; Maia-Nogueira, R.; Sampaio, C.L.S. Marine litter disrupts ecological processes in reef systems. Mar. Pollut. Bull. 2018, 133, 464–471. [Google Scholar] [CrossRef] [PubMed]
- Lindeque, P.K.; Cole, M.; Coppock, R.L.; Lewis, C.N.; Miller, R.Z.; Watts, A.J.; Wilson-McNeal, A.; Wright, S.L.; Galloway, T.S. Are we underestimating microplastic abundance in the marine environment? A comparison of microplastic capture with nets of different mesh-size. Environ. Pollut. 2020, 265, 114721. [Google Scholar] [CrossRef] [PubMed]
- Primpke, S.; Lorenz, C.; Rascher-Friesenhausen, R.; Gerdts, G. An automated approach for microplastics analysis using focal plane array (FPA) FTIR microscopy and image analysis. Anal. Methods 2017, 9, 1499–1511. [Google Scholar] [CrossRef]
- Cowger, W.; Steinmetz, Z.; Gray, A.; Munno, K.; Lynch, J.; Hapich, H.; Primpke, S.; De Frond, H.; Rochman, C.; Herodotou, O. Microplastic Spectral Classification Needs an Open Source Community: Open Specy to the Rescue! Anal. Chem. 2021, 93, 7543–7548. [Google Scholar] [CrossRef] [PubMed]
- Hansen, J.; Hildebrandt, L.; Zimmermann, T.; El Gareb, F.; Fischer, E.K.; Pröfrock, D. Quantification and characterization of microplastics in surface water samples from the Northeast Atlantic Ocean using laser direct infrared imaging. Mar. Pollut. Bull. 2023, 190, 114880. [Google Scholar] [CrossRef] [PubMed]
- Ghanadi, M.; Joshi, I.; Dharmasiri, N.; Jaeger, J.E.; Burke, M.; Bebelman, C.; Symons, B.; Padhye, L.P. Quantification and characterization of microplastics in coastal environments: Insights from laser direct infrared imaging. Sci. Total Environ. 2024, 912, 168835. [Google Scholar] [CrossRef] [PubMed]
- Bernard, N.; Metian, M.; Oberhaensli, F.; Sznaider, F.; Ruberto, L.; Vodopivez, C.; Mac Cormack, W.; Hernandez, C.A. Identification and quantification of microplastics in the Antarctic coastal waters using laser direct infrared (LDIR). Mar. Pollut. Bull. 2025, 221, 118534. [Google Scholar] [CrossRef] [PubMed]
- Medina Faull, L.E.; Zaliznyak, T.; Taylor, G.T. From the Caribbean to the Arctic, the most abundant microplastic particles in the ocean have escaped detection. Mar. Pollut. Bull. 2024, 202, 116338. [Google Scholar] [CrossRef] [PubMed]
- Erni-Cassola, G.; Zadjelovic, V.; Gibson, M.I.; Christie-Oleza, J.A. Distribution of plastic polymer types in the marine environment; A meta-analysis. J. Hazard Mater. 2019, 369, 691–698. [Google Scholar] [CrossRef] [PubMed]
- Hale, R.C.; Seeley, M.E.; La Guardia, M.J.; Mai, L.; Zeng, E.Y. A Global Perspective on Microplastics. J. Geophys Res. Ocean. 2020, 125, e2018JC014719. [Google Scholar] [CrossRef]
- Cózar, A.; Echevarría, F.; González-Gordillo, J.I.; Irigoien, X.; Úbeda, B.; Hernández-León, S.; Palma, Á.T.; Navarro, S.; García-De-Lomas, J.; Ruiz, A.; et al. Plastic debris in the open ocean. Proc. Natl. Acad. Sci. USA 2014, 111, 10239–10244. [Google Scholar] [CrossRef] [PubMed]
- van Sebille, E.; Aliani, S.; Law, K.L.; Maximenko, N.; Alsina, J.M.; Bagaev, A.; Bergmann, M.; Chapron, B.; Chubarenko, I.; Cózar, A.; et al. The physical oceanography of the transport of floating marine debris. Environ. Res. Lett. 2020, 15, 023003. [Google Scholar] [CrossRef]
- Pina-Amargós, F.; González-Díaz, P.; González-Sansón, G.; Aguilar-Betancourt, C.; Rodríguez-Cueto, Y.; Olivera-Espinosa, Y.; Figueredo-Martín, T.; Rey-Villiers, N.; Barreto, R.A.; Cobián-Rojas, D.; et al. Status of Cuban Coral Reefs. Bull. Mar. Sci. 2018, 94, 229–247. [Google Scholar] [CrossRef]
- Morera-Gómez, Y.; García-Varens, M.A.; Pescoso-Torres, B.M.; Helguera-Pedraza, Y.; García-Chamero, A.; Alonso-Morejón, A.; Bernard, N.; Alonso-Hernández, C.M. Advancing data processing for microplastics characterization: Laser direct infrared (LDIR) analysis of atmospheric deposition in Cienfuegos, Cuba. Atmos. Pollut. Res. 2025, 17, 102715. [Google Scholar] [CrossRef]
- Lebreton, L.C.M.; Van Der Zwet, J.; Damsteeg, J.W.; Slat, B.; Andrady, A.; Reisser, J. River plastic emissions to the world’s oceans. Nat. Commun. 2017, 8, 15611. [Google Scholar] [CrossRef] [PubMed]
- Meijer, L.J.J.; van Emmerik, T.; van der Ent, R.; Schmidt, C.; Lebreton, L. More than 1000 rivers account for 80% of global riverine plastic emissions into the ocean. Sci. Adv. 2021, 7, eaaz5803. [Google Scholar] [CrossRef] [PubMed]
- Candela, J.; Ochoa, J.; Sheinbaum, J.; López, M.; Pérez-Brunius, P.; Tenreiro, M.; Pallàs-Sanz, E.; Athié, G.; Arriaza-Oliveros, L. The flow through the gulf of Mexico. J. Phys. Oceanogr. 2019, 49, 1381–1401. [Google Scholar] [CrossRef]
- Sheinbaum, J.; Candela, J.; Badan, A.; Ochoa, J. Flow structure and transport in the Yucatan Channel. Geophys Res. Lett. 2002, 29, 10-1–10-4. [Google Scholar] [CrossRef]
- Wright, S.; Thompson, R.C.; Galloway, T.S. The physical impacts of microplastics on marine organisms: A review. Environ. Pollut. 2013, 178, 483–492. [Google Scholar] [CrossRef] [PubMed]
- Galloway, T.S.; Cole, M.; Lewis, C. Interactions of microplastic debris throughout the marine ecosystem. Nat. Ecol. Evol. 2017, 1, 0116. [Google Scholar] [CrossRef] [PubMed]
- Koelmans, A.A.; Redondo-Hasselerharm, P.E.; Nor, N.H.M.; de Ruijter, V.N.; Mintenig, S.M.; Kooi, M. Risk assessment of microplastic particles. Nat. Rev. Mater. 2022, 7, 138–152. [Google Scholar] [CrossRef]
- Schmidt, N.; Thibault, D.; Galgani, F.; Paluselli, A.; Sempéré, R. Occurrence of microplastics in surface waters of the Gulf of Lion (NW Mediterranean Sea). Prog. Oceanogr. 2018, 163, 214–220. [Google Scholar] [CrossRef]
- Browne, M.A.; Crump, P.; Niven, S.J.; Teuten, E.; Tonkin, A.; Galloway, T.; Thompson, R. Accumulation of microplastic on shorelines woldwide: Sources and sinks. Environ. Sci. Technol. 2011, 45, 9175–9179. [Google Scholar] [CrossRef] [PubMed]
- Alaraby, M.; Abass, D.; Velázquez, A.; Hernández, A.; Marcos, R. Polytetrafluoroethylene microplastic properties, pollution, toxicity and analysis: A review. Environ. Chem. Lett. 2025, 24, 27–59. [Google Scholar] [CrossRef]
- Lithner, D.; Larsson, A.; Dave, G. Environmental and health hazard ranking and assessment of plastic polymers based on chemical composition. Sci. Total Environ. 2011, 409, 3309–3324. [Google Scholar] [CrossRef] [PubMed]
- Dris, R.; Gasperi, J.; Rocher, V.; Saad, M.; Renault, N.; Tassin, B. Microplastic contamination in an urban area: A case study in Greater Paris. Environ. Chem. 2015, 12, 592–599. [Google Scholar] [CrossRef]
- Horton, A.A.; Walton, A.; Spurgeon, D.J.; Lahive, E.; Svendsen, C. Microplastics in freshwater and terrestrial environments: Evaluating the current understanding to identify the knowledge gaps and future research priorities. Sci. Total Environ. 2017, 586, 127–141. [Google Scholar] [CrossRef] [PubMed]
Disclaimer/Publisher’s Note: The statements, opinions and data contained in all publications are solely those of the individual author(s) and contributor(s) and not of MDPI and/or the editor(s). MDPI and/or the editor(s) disclaim responsibility for any injury to people or property resulting from any ideas, methods, instructions or products referred to in the content. |
© 2026 by the authors. Licensee MDPI, Basel, Switzerland. This article is an open access article distributed under the terms and conditions of the Creative Commons Attribution (CC BY) license.