


Abstract
With the global increase in microplastic pollution, even environments considered pristine have shown signs of being affected by these contaminants. In this context, it becomes essential to conduct studies that identify and quantify the presence of microplastics in remote regions such as Antarctica. This continent is particularly relevant due to its low anthropogenic influence and its essential role in regulating planetary ecosystems and biodiversity. In this study, 49 Antarctic samples were analyzed using pretreatment techniques with NaCl and ZnCl2 saline solutions, followed by fluorescence microscopy using Nile Red dye to estimate the microplastic abundance index. Both solutions showed good performance in the separation and identification of particles. Approximately 37% of the samples showed contamination by potential microplastics (PMPs), with a higher concentration of particles retained on paper filters and fibers observed in the supernatants. The results indicate that the presence of MPs in Antarctica is irregular and not ubiquitous, differing from other studies that suggest a wider distribution. It is speculated that the observed contamination results from oceanic transport from other regions of the planet and from sources associated with human activities on the Antarctic continent (e.g., tourism and research).
1. Introduction
Antarctica is considered a pristine environment, largely isolated from most anthropogenic disturbances. Several studies indicate that the increase in human activities, such as tourism and scientific research, can introduce various contaminants [1,2,3,4]. One of the contamination indicators that has been increasingly discussed in recent studies is the presence of microplastics (MPs) [5,6].
The impact of MPs in Antarctica differs from other regions due to the continent’s geographic isolation and oceanographic and cryospheric barriers, which constrain the transport and deposition of particles (e.g., ocean currents and sea ice dynamics). Thus, the introduction of MPs into the Antarctic environment may be associated with some known sources, including the use of synthetic clothing by researchers and tourists. In this context, scientific activities—such as expeditions, the operation and maintenance of research stations, and seasonal field campaigns—require the continuous transport and use of materials and equipment, which can inadvertently contribute to the release and dispersion of contaminants, including microplastics, into this environment [7,8]. In many cases, these contaminants can be preserved for long periods due to the extreme cold and the presence of ice, which can slow down their degradation [9,10,11]. The impacts of MPs in Antarctica can vary from environmental pollution to stress in birds and other animals that ingest them, and they may even be transferred along the food chain [12,13].
The identification and quantification of MPs show high variability, both in the results obtained and in the methodologies applied. Among the main factors contributing to this inconsistency, there is the wide diversity of measurement units used to detect the presence of MPs in soils and marine environments, such as g/km, particles/m2, items/km2, particles/L, and others. This methodological heterogeneity hinders direct comparison between studies conducted in different regions of the world and constitutes one of the greatest challenges for consolidating scientific knowledge on MPs [14,15,16,17,18]. Due to the lack of standardization and the multiple measurement approaches, some authors describe MPs as ubiquitous contaminants, suggesting that they are globally distributed—a perception reinforced by the detection of these materials in various areas of Antarctica [11,19,20,21]. The literature indicates that MPs have been detected mainly in specific Antarctic locations, particularly ice-free coastal areas associated with research stations, logistics, and tourism [8,22,23]. In contrast, much of the Antarctic interior and remote regions show no detectable MPs or only very low and spatially inconsistent concentrations, indicating a heterogeneous continental distribution [24,25]. In this context, the improvement and refinement of existing analytical techniques become indispensable to increase precision, reliability, and scientific acceptance in the detection of MPs across different environmental matrices [26,27].
To address the challenges associated with the quantification and identification of MPs, fluorescence microscopy (FM) is commonly used as a complementary technique to spectroscopic approaches and is well established within the scientific community. This potential stems from the use of the Nile Red dye, whose affinity for plastic materials enables selective staining and preferential visualization of particles with a high likelihood of being MPs [28,29]. The technique involves using saline solutions—with NaCl and ZnCl2, among others, the most commonly used—to promote density-based separation of MPs [30,31]. However, the diversity of polymers and the lack of standard procedures still pose significant challenges, especially in the determination of the most suitable saline solution for each type of sample [32,33,34]. Furthermore, this technique presents limitations due to interference from other materials with similar chemical composition which may also be stained by Nile Red, leading some authors to classify the detected particles as PMPs rather than confirmed MPs [35,36,37].
It is conjectured that different saline solutions, such as NaCl and ZnCl2, when used in combination with FM are capable of identifying MPs in sediment samples from Antarctica, especially when associated with appropriate pretreatment techniques. This approach would allow the validation of MP occurrence in an environment considered pristine, even if distributed heterogeneously due to localized human activities (e.g., near scientific stations and tourism) and environmental transport processes. This study aims to apply FM to optimize the identification and characterization of microplastics through the comparison of two saline solutions, seeking to enhance the efficiency and precision of the process and to enable a more reliable initial screening of particles with plastic potential.
2. Materials and Methods
2.1. Sampling Area
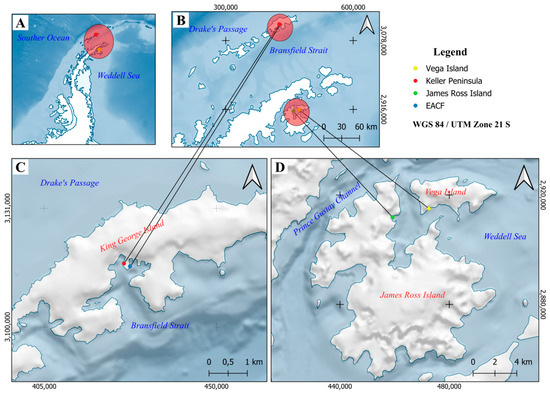
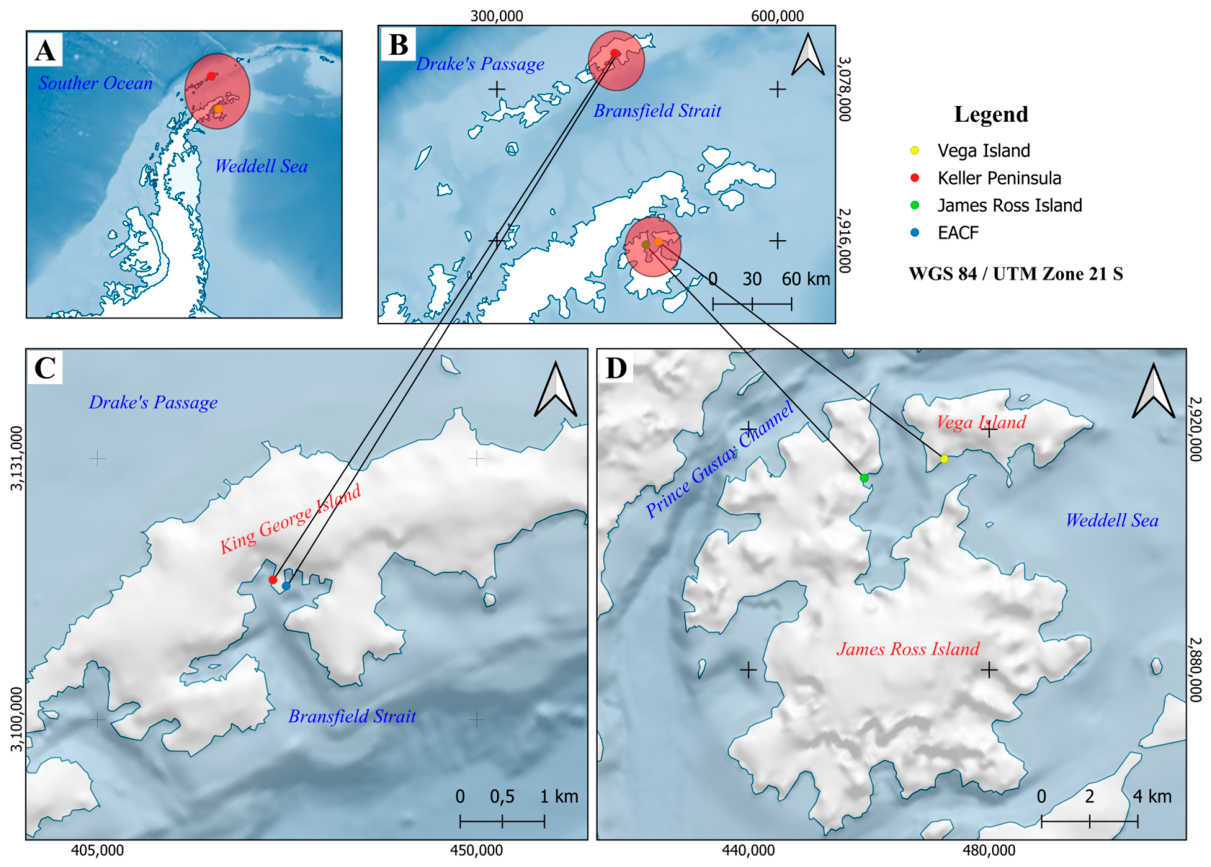
The sampling was conducted on the Antarctic continent during the austral summer (December 2023), covering areas of the Maritime and Peninsular regions, as shown in Figure 1. In the Maritime region, samples were collected in the South Shetland Islands, specifically on Keller Peninsula (425,809 m E, 3,116,560 m S), where the Comandante Ferraz Antarctic Station is also located (427,329 m E, 3,115,898 m S). These areas are located between Bransfield Strait and the Drake Passage, the region that separates the southern tip of South America from the Antarctic Peninsula. This geographic location is considered strategic, as it lies within a zone of convergence of oceanic and atmospheric currents. In the Peninsular region, sampling was conducted on James Ross Island (459,077 m E, 2,911,765 m S) and Vega Island (472,569 m E, 2,914,941 m S), an area that extends into the Antarctic continent. Consequently, the maritime regions are more directly exposed to influences from the Atlantic and Pacific Oceans, whereas the Peninsular regions are somewhat protected by the continent and are also characterized by sea ice formation during most of the year.
Figure 1.
Location of the study area. (A) Location of the study area in the Maritime and Peninsular regions of Antarctica (B). Regional detail showing the sampling areas. (C). Maritime region: South Shetland Islands. (D). Peninsular region: James Ross Island and Vega Island.
2.2. Sample Processing and Extraction of Microplastics
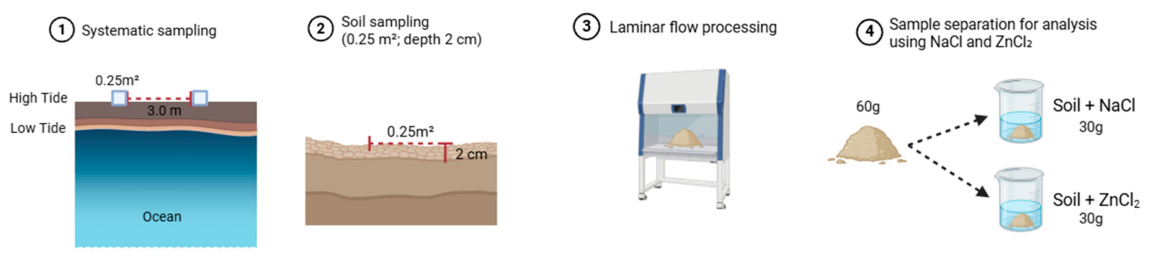
The samples were collected within an area delimited by a 0.25 m2 polygon, maintaining approximately 3.0 m between sampling points and a depth of 2 cm, meaning approximately 300 g of material was collected per sample location. At the laboratory, this material was subsampled to 60 g for every analysis, as shown in Figure 2. The sampling points were located along the upper high-tide line, and the collected material was stored in paper bags and aluminum containers. Subsequently, the samples were transported from Antarctica to Brazil in a Brazilian Navy vessel as part of the 42nd Antarctic Operation (OPERANTAR XLII). In the laboratory, the opening and processing of the samples were carried out under a laminar flow hood previously cleaned with 70% alcohol and exposed to UV light for 15 min, ensuring clean conditions and minimizing contamination.
Figure 2.
Sediment sampling design and density-based separation.
The density separation methodology was executed and adapted according to the Crawford and Quinn protocol [30]. NaCl (1.2 g/cm3) and ZnCl2 (1.5–1.7 g/cm3) solutions were prepared. In some cases, hydrochloric acid (HCl) was used to facilitate the dissolution of ZnCl2, assisting in the solubilization of the solution under specific environmental conditions particularly due to low ambient temperatures in southern Brazil during certain periods of the year. Additionally, it helped reduce solution turbidity, improving analytical performance. Drops of HCl were added until the point of solubilization was reached. The 60 g samples were divided into two subsamples of approximately 30 g each, with one portion processed using ZnCl2 and the other using NaCl, in order to compare the performance of the two saline solutions. The samples from the four collection areas were submitted to the same density separation procedure with both saline solutions, and the measurement units were evaluated per sample prepared for each saline solution and then standardized for analysis according to the sampling area (m2). After the sediment had been agitated, the solution was left to rest until complete stabilization of the supernatant. Later, the vacuum filtration was performed using qualitative paper filters acquired from J.Prolab, with an average pore size of 14 µm and a thickness of 0.2 mm. Paper filters were used to retain the particles present in the supernatant and separate the liquid fraction. Physical and chemical analyses were not performed at this stage, as the primary objective was to evaluate the methodology. Furthermore, the samples were not subjected to drying, as they did not present significant moisture upon receipt and were in suitable condition for direct use.
2.3. Quality Assurance/Quality Control (QA/QC)
Before beginning the process and applying the methodology, a blank test was carried out [10,34,38]. These tests were performed in triplicate using only Milli-Q water, without the addition of soil or any other material [39,40,41], in order to verify that no contamination or interference occurred at any stage of the process from density separation to Nile Red staining. Additionally, each saline solution (NaCl and ZnCl2) was prepared using Milli-Q water and subjected to the same filtration and staining procedures applied to the sediment samples. The solutions were subsequently stained with Nile Red and analyzed under fluorescence microscopy to validate the methodology, with all observations performed in triplicate. It was observed that none of the filters showed the presence of plastic particles, either in fibrous or granular form. Therefore, the authors developed protocols and techniques to standardize methods ranging from the cleaning of equipment with Milli-Q water and/or 70% alcohol, followed by proper drying, to the preparation of the laboratory environment where analyses of sediment samples were to be conducted—measures essential for avoiding interference in the experiments. All samples were handled under laminar flow conditions with UV light and controlled air circulation. Nitrile gloves were used throughout, and all equipment was cleaned with an HCl solution followed by Milli-Q water then wrapped in aluminum foil or paper towels and dried in an oven. At no stage was there any contact with plastic materials, and the entire team maintained rigorous contamination control procedures [32,42]. Additionally, it was crucial to control the movement of people in the laboratory, ensure the use of appropriate clothing, and guarantee that researchers wore cotton lab coats, thereby maintaining proper conditions before starting any experimental activity [43,44,45]. These contamination control and mitigation procedures were conducted in accordance with established protocols, following the recommendations of Crawford and Quinn protocol [30], as in the density separation step.
2.4. Fluorescence Microscopy
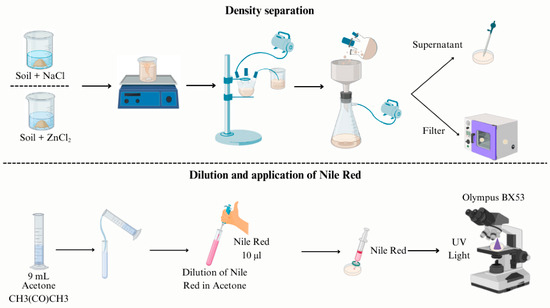
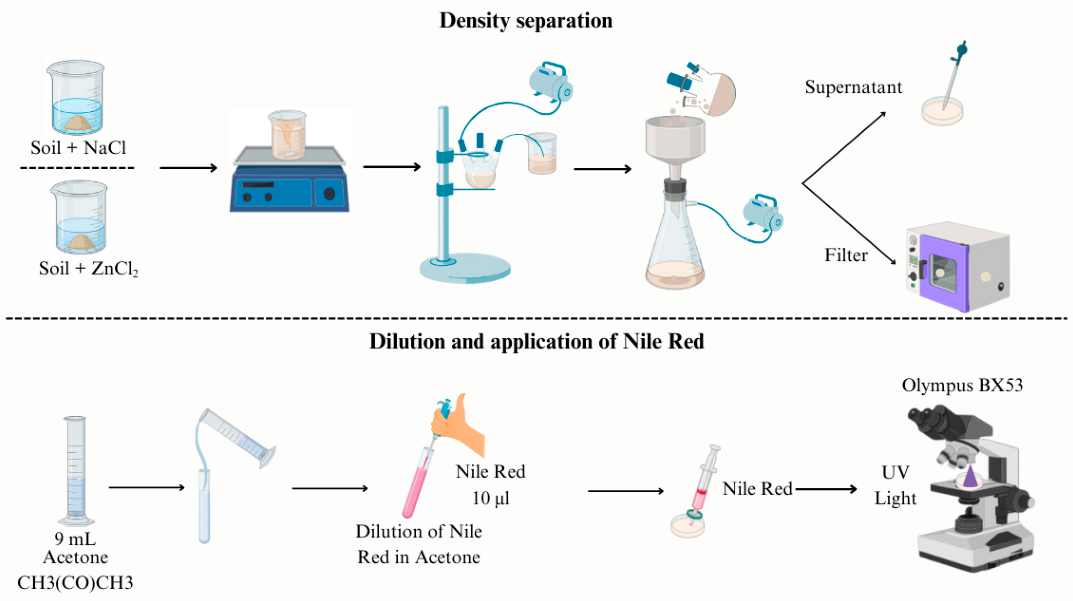
Before the microscopy stage, the Nile Red dye was prepared for the fluorescence process. The dye was diluted at a ratio of 10 µL in 9 mL of acetone and stored in a closed container wrapped in aluminum foil to prevent light exposure and preserve its characteristics. A glass syringe fitted with a Millipore syringe filter (PTFE, 0.22 µm) was used to filter the solution and apply the dye efficiently, both to the supernatant (2 to 3 drops) and to the paper filter (2 to 6 drops), hence facilitating the identification of the MPs present [46,47,48]. After ensuring that all materials were thoroughly cleaned and organized, the supernatant was placed in a Büchner funnel, and the filters were arranged in steel and aluminum trays for FM (Figure 3).
Figure 3.
Illustrative scheme of the experimental procedure used for the extraction and identification of PMPs using Nile Red.
In order to certify accurate documentation, a camera attached to a digital eyepiece for Biofocus microscopes was used. Additionally, to avoid contamination, safety measures such as wearing a cotton lab coat and nitrile gloves were adopted, in accordance with established protocols. The dye was applied to the paper filters to check for the presence of MPs that did not pass through the filter pores. Microscopic analysis was implemented using an Olympus BX53 microscope (EVIDENT CORPORATION, Tokyo, Japan) with a UV light filter, emitting wavelengths in the range of 300–500 nm (10×/0.30 Ph 1 magnification). The Future Winjoe camera software was used to capture images of the MPs and to add scales and annotations. The ImageJ software was employed, allowing for scale calibration (mm or µm) to indicate the approximate size of the MPs. After the preparation and execution of the MP extraction process, the FM identification stage was conducted by organizing the data into two tables, separating the collected samples according to their location in Antarctica: Maritime (Figure 1C) and Peninsular (Figure 1D).
2.5. Identification and Quantification of PMPs
After density separation of PMPs using saline solutions and subsequent fluorescence application, the PMPs were qualitatively identified according to their shape and classified as fragments or fibers in each sample. The particles were then photographed, and the images were calibrated to scale. The identified PMPs were recorded, counted, and organized in spreadsheets enabling the analysis of relative abundance among the different regions. Quantification considered the sampling location, the type of solution used, and the medium in which the PMPs were found (filter and supernatant), ultimately resulting in the creation of abundance graphs.
Generative AI was used to create the graphical abstract.
3. Results
3.1. Characterization of PMPs
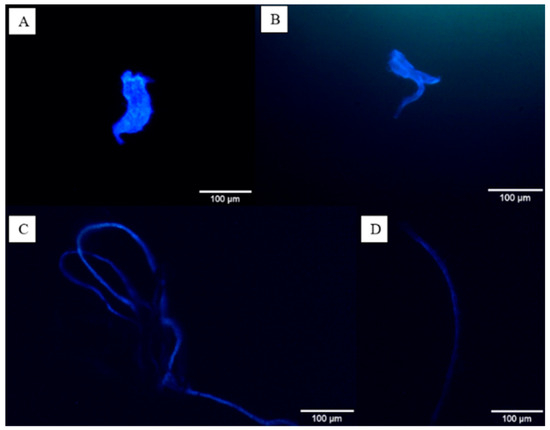
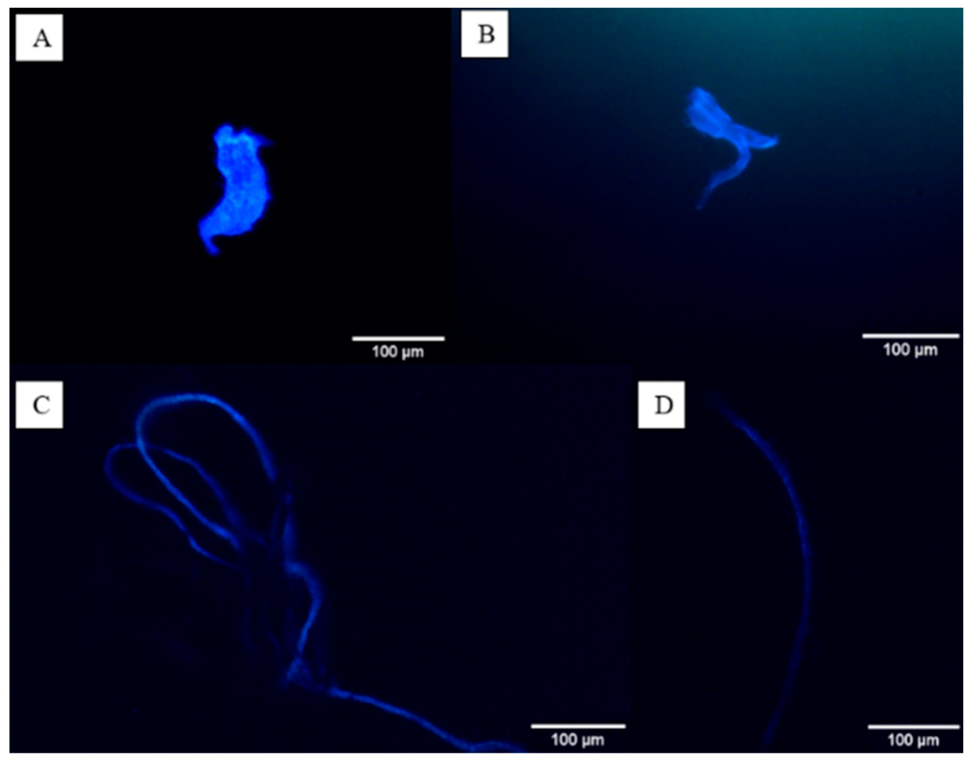
FM enabled the identification and quantification of PMPs, as well as image recording and scale calibration of the particles present (Figure 4). The data were organized into tables for clearer presentation (Table 1 and Table 2). The plastics appeared in different forms, both as granules and as fibers. In the supernatants, where the paper filter acted as a sink, the presence of fibers became more evident. The fibers exhibited an irregular, elongated, thin, and flexible shape which made microscope lens adjustment more challenging and their identification more complex compared to granules. The granules, on the other hand, with their well-defined structure and denser topology, were more easily identified, especially when stained with Nile Red [49,50].
Figure 4.
Samples of PMPs analyzed under FM. (A). Vega Island—Filter 06; (B). Keller Peninsula—Filter 15; (C). Vega Island—Supernatant 1; (D). Comandante Ferraz Station—EACF Supernatant 02.
Table 1.
Analysis of the samples collected in two peninsular regions of Antarctica, James Ross Island and Vega Island, as identified by FM. Table values are expressed in particles per m2.
Table 2.
Analysis of the samples collected in two maritime regions, at EACF and Keller Peninsula, identified by FM.
The filters were examined using the microscope, and the UV filter provided the best performance, as reported in the literature [9,51]. The visualization of microplastics occurred when the Nile Red dye interacted with both the supernatant and with the paper filter. After locating the PMPs, image recording and abundance analysis were carried out for each identified sample.
3.2. Abundance of PMPs
The preliminary analysis of PMP abundance in the peninsular regions of Vega Island and James Ross Island considered the different sampling points and the extent of the sampled area (Table 1). The samples were evenly divided, receiving equal amounts of NaCl and ZnCl2 solutions. It is important to note that NaCl is limited to the extraction of low-density polymers (<1.2 g cm−3), whereas ZnCl2 enables the recovery of denser polymers, such as PET and PVC, due to its higher density [52].
This approach was adopted because the sampling sites were geographically close, allowing both methodologies to be applied without compromising the representativeness or integrity of the results. For each 30 g aliquot, after density separation using NaCl and ZnCl2 solutions, abundance quantification was performed, and the results were expressed as particles per sample. To further assess the method’s ability to detect microplastics, selected samples were intentionally spiked with equal amounts of reference particles produced from plastic sheets (PE, PET, PP, and PVC). These samples were subjected to the full analytical procedure, including density separation using saline solutions and Nile Red staining. A complete recovery of the spiked particles was observed on the paper filters. Based on previous studies and the literature, particles were classified as granules or fibers according to their visual morphology under microscopy [53].
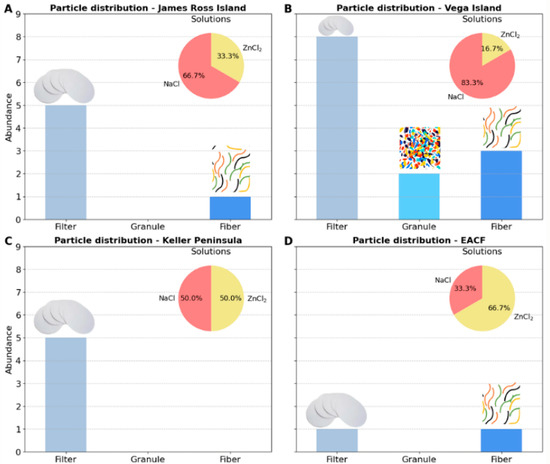
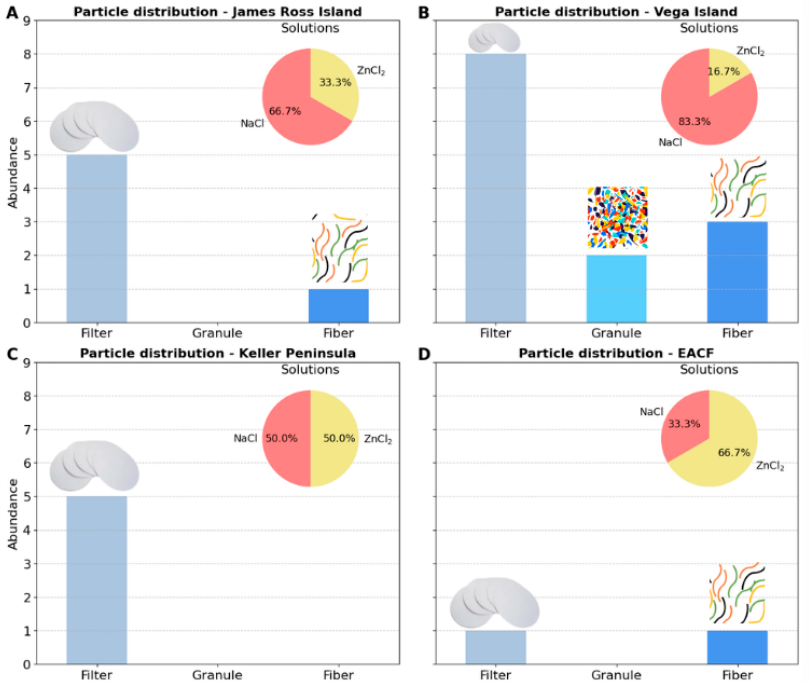
On Vega Island, 54% of the samples showed the presence of PMPs, while on James Ross Island this percentage was lower, corresponding to 33% (Table 1). The preliminary analysis of PMP abundance in the maritime regions of Antarctica (Table 2) indicated that in the vicinity of the Comandante Ferraz Antarctic Station (EACF), 22% of the samples contained PMPs, whereas on Keller Peninsula this value was 36%. Accordingly, the PMPs identified by FM in the peninsular regions of Antarctica correspond to the samples collected on Vega Island and James Ross Island (Table 1), while those observed in the maritime regions are associated with samples from the surroundings of EACF and Keller Peninsula (Table 2). It was observed, through extrapolation to particles per square meter, that both the peninsular region, represented by Keller Peninsula, and the maritime region, represented by Vega Island, exhibited significant levels of potential microplastics, with some samples reaching approximately 8 particles per m2. To obtain these values, appropriate proportional adjustments were applied to the samples collected from the supernatant. Specifically, a mass of 30 g of supernatant was considered representative of a sampling area of 0.25 m2, allowing for the extrapolation of results to particles per square meter in a consistent and standardized manner. The graphs unveil the abundance of PMPs in each solution, considering the different regions individually (Figure 5). The comparison between the saline solutions used allowed for the separate evaluation of the performance of each methodology.
Figure 5.
Distribution of MPs by region. (A,B) Peninsular regions. (C,D) Maritime regions.
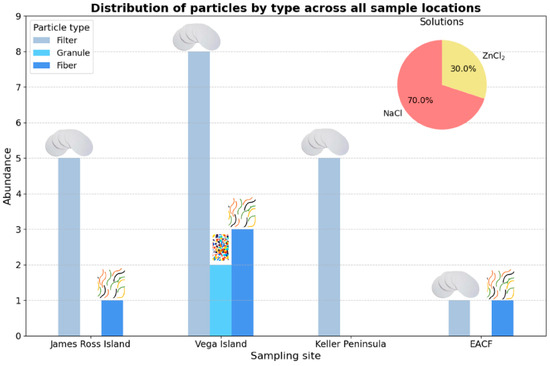
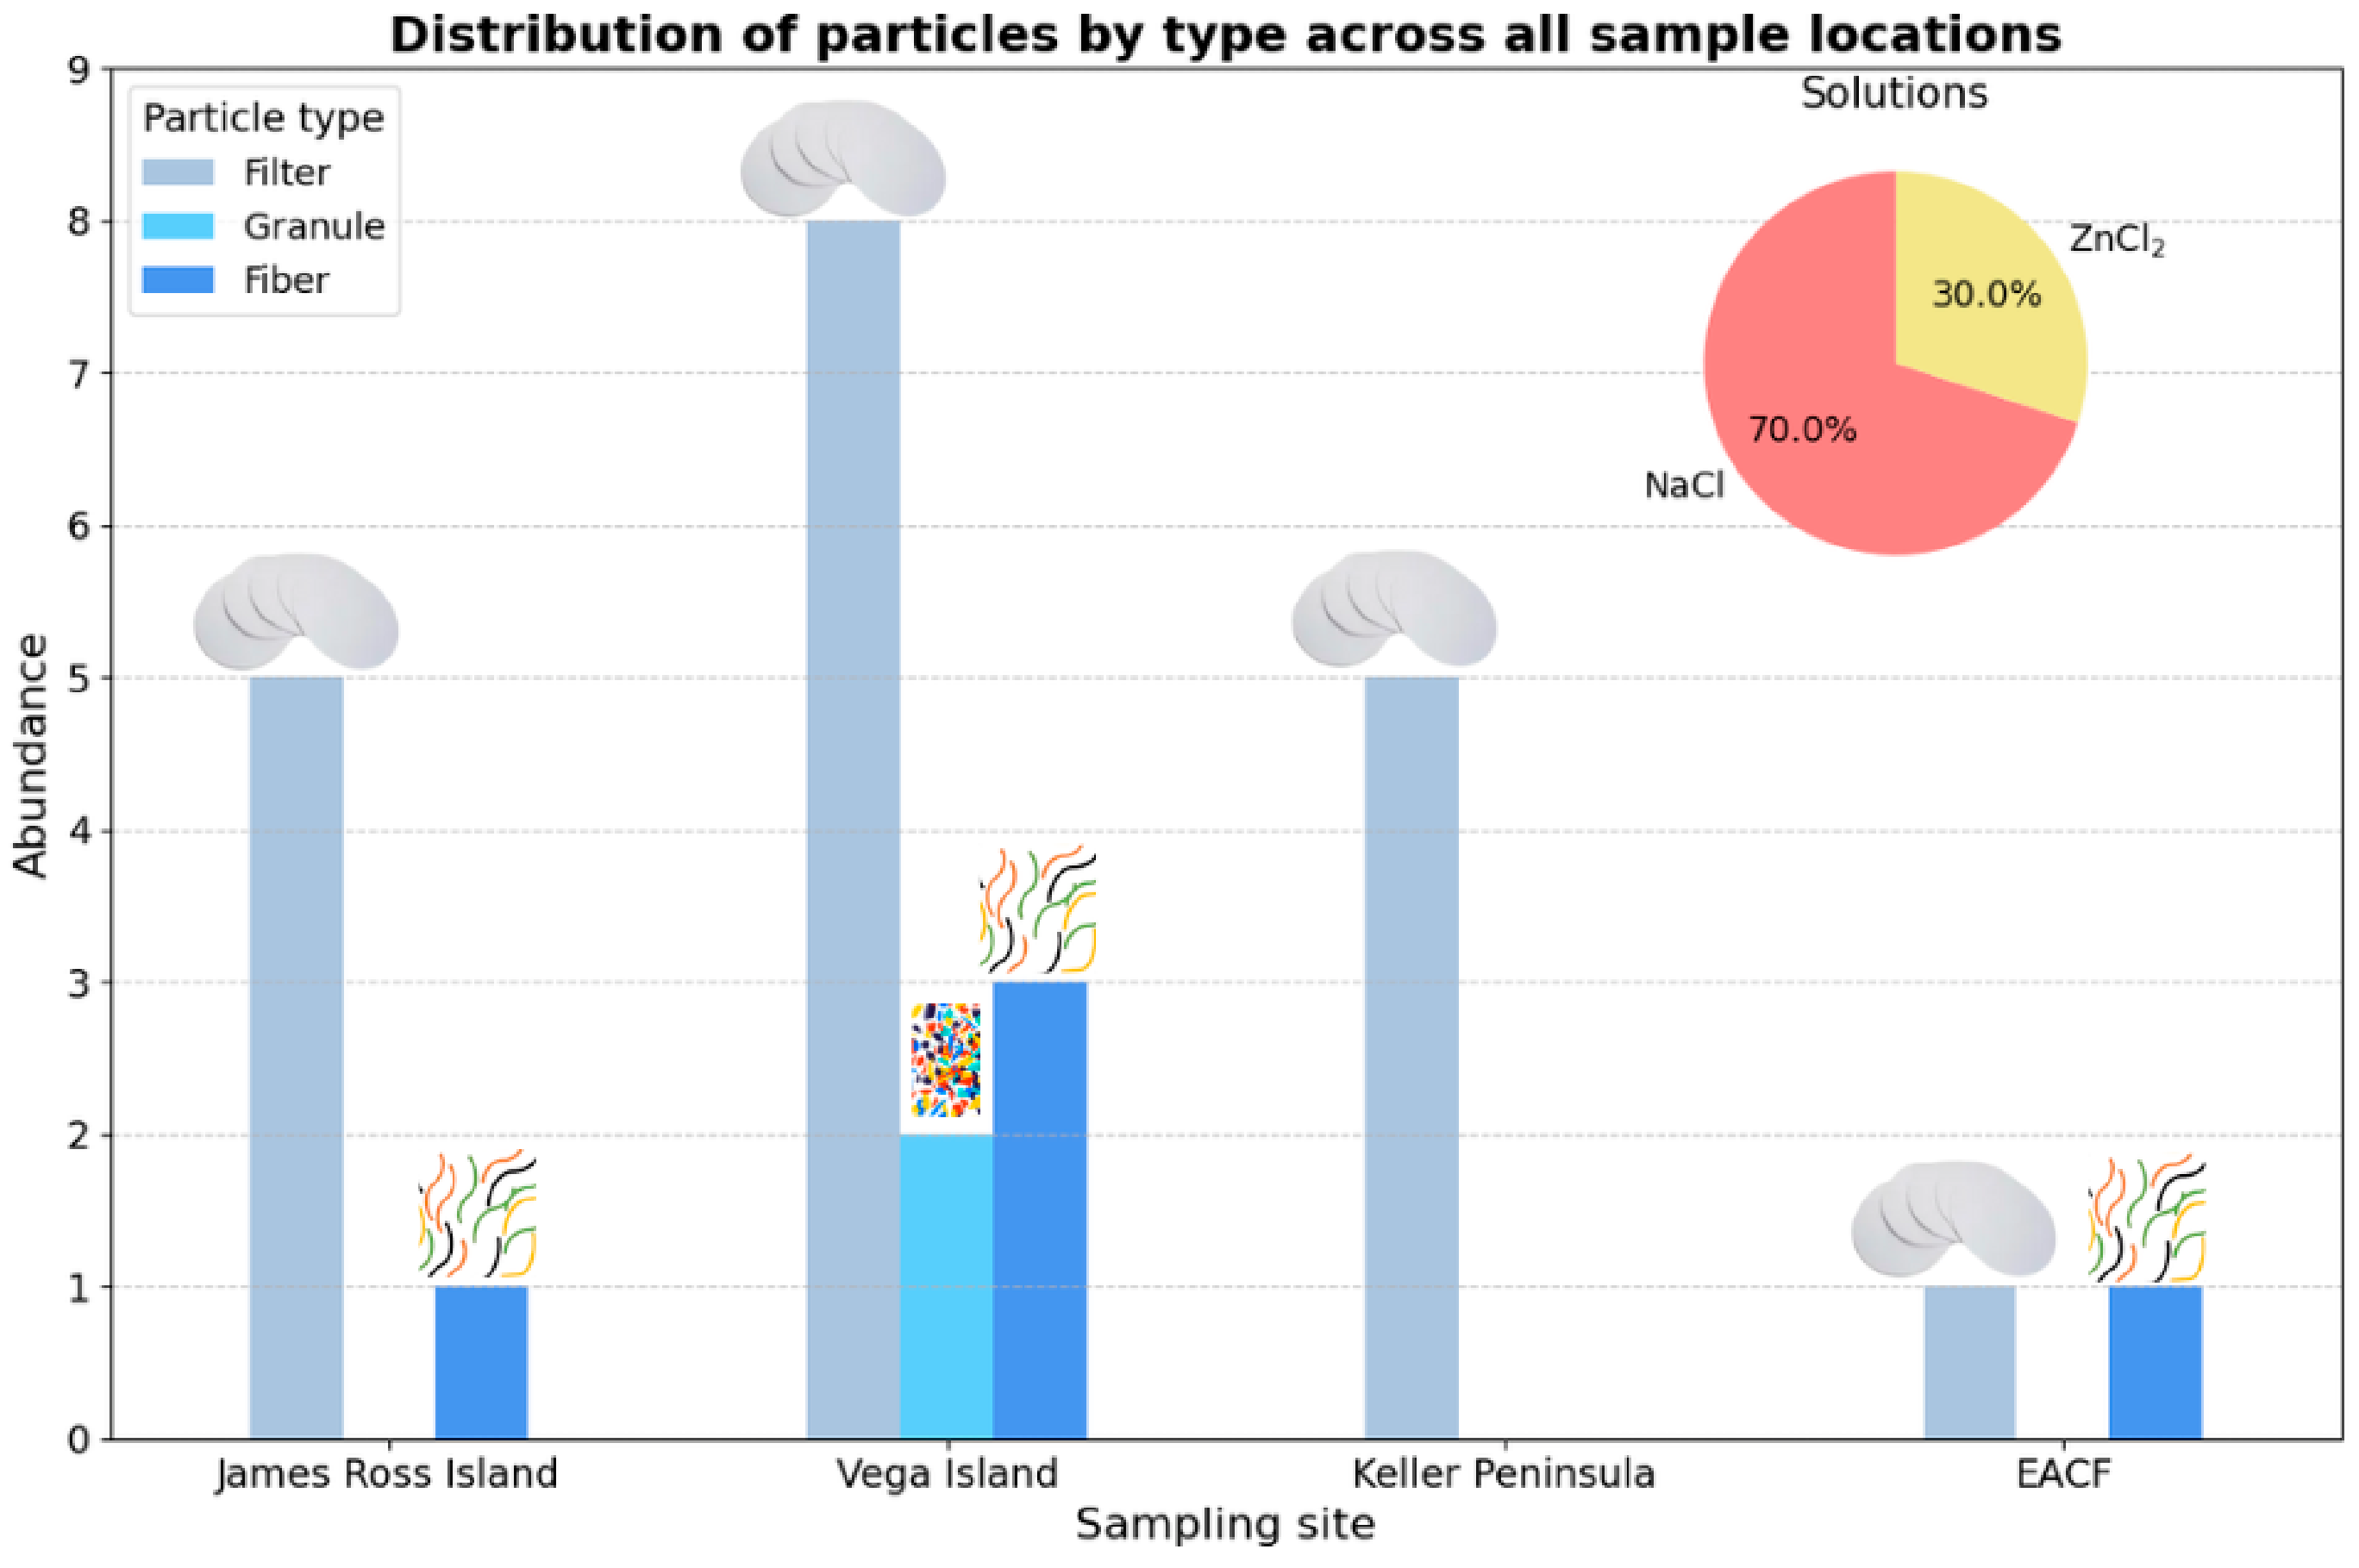
The results indicated consistent performance for both saline solutions. In the peninsular regions, it was observed that the NaCl solution showed better performance in the recovery of PMPs. On the other hand, in the maritime regions, the ZnCl2 solution demonstrated greater efficiency in the distribution of the extracted PMPs (Figure 5). The quantity of PMPs in the EACF and James Ross Island regions remained similar, as evidenced by the linear trend observed in the cumulative concentration curve. On average, the paper filter retained the highest proportion of PMPs. In contrast, a more expressive variation was observed in Keller Peninsula and Vega Island, with particular emphasis on points Vega_01 and Vega_03, where four PMPs per sample were identified. Overall, 83% of the samples showed PMP retention on the paper filter. Based on the data obtained at each sampling site in Antarctica, it was possible to perform a general analysis (Figure 6) of PMP abundance and the respective solutions across all studied islands.
Figure 6.
Distribution of MPs across all sampled locations.
The presence of PMPs was observed in both solutions in general, with 70% identified in the NaCl solution and 30% in the ZnCl2 solution. It was also found that Vega Island was the only location to present PMPs both on paper filter and in the supernatant, differing from the other sampled regions. Following that, James Ross Island and Comandante Ferraz Station stood out, whereas Keller Peninsula showed PMPs only on the paper filter. Therefore, approximately 37% of the 49 samples collected showed the presence of microplastics mainly in areas influenced by anthropogenic activities.
4. Discussion
This study demonstrated that the presence of PMPs is occurring even in environments considered pristine, such as Antarctica. The sediments from the four Antarctic locations analyzed revealed the presence of PMPs, with particular emphasis on Vega Island, which showed a possible diversity of PMPs. This variability was indicated by both NaCl and ZnCl2 solutions and the use of the paper filter and supernatant (Table 1 and Table 2), suggesting the presence of distinct PMPs. This also includes particles possibly smaller than the micro scale, such as nanoplastics (NPs), given that the processing steps may interfere with and fragment the detected MPs. Additionally, the morphology of the PMPs varied, with both granules and fibers being found (Figure 4) and identified through the application of pre-processing techniques based on the existing literature [54,55,56], including the use of dyes such as Nile Red [57] to support MF. Fibers were most evident in the supernatants, possibly due to the vacuum filtration process [58,59,60]. The pressure applied to draw the liquid through the paper filter may force the passage of fibers—because they are flexible structures—through the filter pores, causing them to be carried along with the filtered liquid. The saline solutions NaCl and ZnCl2 were employed in order to evaluate the efficiency of PMP extraction methodologies in Antarctic sediments, assessing whether different sediment types would exhibit distinct behaviors depending on the method applied.
As expected, the paper filter showed a higher quantity of PMPs per samples: there were 13 in the peninsular regions (Table 1) and 8 in the maritime regions (Table 2). In comparison, the supernatant contained six PMPs in the peninsular regions (Table 1) and three in the maritime regions (Table 2), predominantly in the form of granules or fibers. Notably, through extrapolation to particles per m2, both Keller Peninsula and Vega Island exhibited significant levels of PMPs, with some samples reaching approximately 8 particles/m2, reinforcing the relevance of contamination in both peninsular and maritime environments. This difference may be related to the unique environmental conditions of Antarctica, such as intense ultraviolet radiation, the presence and intensity of human activities, and interactions with local fauna and microbiota [8,61]. These factors can promote the fragmentation of plastics and alter their physicochemical characteristics, resulting in the formation of PMPs with different sizes, shapes, and densities. Moreover, such processes may influence the spatial distribution of PMPs: while some fragments may percolate over the ice-covered surface, others may become buried or trapped by seasonal freeze–thaw cycles. Consequently, certain regions with high potential for PMP accumulation may not exhibit clear evidence of their presence, particularly depending on the separation method used, which may favor the recovery of specific polymer types according to their physicochemical properties [62]. The methodology used for microplastic quantification through particle counting proved to be one of the most accessible. This is partly due to the extremely small size of these particles, whose mass and density are very low, making precise measurements by other methods difficult [9,63,64].
The results revealed that, in the Antarctic maritime regions, 22% of the samples collected near the EACF and 36% of those from Keller Peninsula showed the presence of PMPs. In the peninsular areas, PMPs were identified in 33% of the samples from James Ross Island and in 54% of those from Vega Island. The preliminary abundance analysis suggests that the peninsular areas, especially Vega Island, may be more susceptible to PMP pollution possibly due to factors such as ocean currents, human activities, or long-term accumulation. The difference in PMP presence between the peninsular and maritime regions highlights the need for further investigations to understand the sources and mechanisms of dispersion of these pollutants and the need to develop effective mitigation strategies and environmental conservation measures [65,66].
The distance between the sampled locations, both at the EACF and on Vega Island, did not prevent these regions from exhibiting a remarkable similarity in the presence and composition of microplastics. This pattern suggests that, even in distinct Antarctic areas, common sources or processes of dispersion and accumulation of PMPs may occur, resulting in similar pollution characteristics. This outcome diverged from the initial hypothesis that PMPs would appear in similar proportions among sampling points within the maritime region and within the peninsular region. Theoretically, the peninsular and maritime zones are distinct, since in the peninsular region the Weddell Sea remains frozen for most of the year, which may restrict the arrival of PMPs via ocean currents. Conversely, in the maritime areas, where the sea does not freeze, there is direct contact with other oceanic regions mainly because of the influence of the Drake Passage—a potential pathway for PMP transport [67,68,69,70]. Most of the PMPs were retained by the paper filter, indicating that those passing through likely had dimensions smaller than the pore size. In the case of fibers, their passage may be related to both their length and diameter as well as to the pressure applied by the saline solution, which may force them through the filter [71,72]. The evidence presented indicates that the occurrence of PMPs in Antarctica was neither uniform nor standardized, contrasting with studies suggesting their presumed ubiquity in the environment [14,73,74]. In addition to factors related to ocean currents, geographic position likely also contributes to the observed results. In this context, Vega Island, located further north than James Ross Island, may play a key role in explaining the higher abundance of MPs detected [75,76,77].
It is important to highlight that some hypotheses were considered to explain the divergence in the results. One possibility was contamination of the samples during the methodological process. However, tests were performed to verify the reliability of the methodology, which followed rigorous protocols and was supported by existing literature [31]. Another potential source of interference could have occurred during sample collection in Antarctica. Nevertheless, precautions were taken to minimize any biases. Some challenges emerged throughout the process, such as camera focusing issues due to the irregular shape of certain PMPs particularly in fibers. Even so, the generated images were able to visually represent PMPs in the form of granules or fibers, highlighting the irregular topology of the particles identified. Therefore, if plastics are used as reference materials for testing, it is essential to conduct additional experiments, especially those involving degradation processes, considering that Antarctica’s environmental conditions may influence the weathering of plastics [70,78].
Limitations
Samples must be analyzed with caution to avoid contamination that could interfere with identification using Nile Red dye, as it is lipophilic and may react with materials of similar characteristics, thereby compromising the exclusive detection of PMPs. In addition, the use of complementary equipment and higher-resolution cameras is essential to ensure better image quality and to enable the observation of details that assist in determining the origin of the materials. Qualitative analysis also represents a limitation, as it depends on visual inspection and the analyst’s perception. Thus, the use of appropriate solutions and Nile Red dye is crucial to minimize biases and ensure greater reliability in MP identification [27,79,80,81]. Polymer confirmation was not performed (e.g., µFTIR or Raman spectroscopy), and therefore the detected particles should be interpreted as potential microplastics [82,83,84,85]. No organic matter digestion step was applied, as the samples consisted of beach shoreline sediments collected at high tide. This decision was based on the potential drawbacks of additional chemical treatment, which may increase the risk of contamination or lead to alterations in the physicochemical properties of polymeric particles. Furthermore, such treatments can significantly influence the integrity of microplastics present in the samples. Therefore, avoiding chemical digestion was considered appropriate, particularly given the importance of carefully selecting and validating digestion techniques to ensure accurate recovery and characterization of microplastics [58,86,87,88].
5. Conclusions and Perspectives
This study demonstrated that the initial analyses conducted in the maritime and peninsular regions of Antarctica indicate the presence of PMPs both in the form of granules and fibers, possibly as a result of anthropogenic interference. In addition, it was observed that the PMPs are distributed in a uniform manner and that factors such as coastal ice dynamics and tidal movement may promote leaching or percolation of PMPs due to freeze–thaw cycles, which may have reduced the expected evidence of plastics in the maritime regions. In this context, the PMPs may have been concealed within the sediment matrix. However, even with the detection of PMPs in remote regions, it is not possible to categorically affirm the so-called omnipresence of these contaminants in all seacoast locations of Antarctica, since there are still locations with no evidence of their occurrence. This study showed that despite the presence of PMPs in Antarctica, there are still locations free from significant contamination, without localized or widespread indications. The recorded evidence was restricted to a few sampling points which are considerably distant from each other, and the factors explaining this distribution have been discussed in the study. Thus, considering plastics as omnipresent in Antarctica may be a somewhat premature statement, given that some samples showed no detectable presence of PMPs. Future studies will incorporate radiometric techniques (such as µFTIR and Raman) and provide greater clarity regarding blank control procedures. Nevertheless, all analyses were conducted with strict care, using materials free of plastic components, equipment cleaning protocols based on the literature, and procedures carried out without any laboratory contamination.
It is undeniable that the continuous growth in plastic production and consumption has driven the increasing presence of MPs on a global scale. What stands out, however, is that this advance has not yet impacted some regions as severely. In this context, proposals have been discussed by UNESCO, through the SDGs, as well as by other organizations, with the aim of mitigating the exponential consumption of plastics. Even so, further studies are needed to validate the methodologies already applied, adapting them when necessary, in order to refine analyses, reduce experimental errors, and consolidate standardized techniques. This would allow for the establishment of criteria for measuring MP contamination and, consequently, defining levels of severity across different areas of Antarctica.
Author Contributions
Conceptualization, M.S.S. and A.t.C.; methodology, M.S.S. and A.t.C.; software, M.S.S.; validation, M.S.S., A.t.C. and K.M.E.O.; formal analysis, M.S.S.; investigation, M.S.S. and A.t.C.; resources, A.t.C. and M.R.F.; data curation, M.S.S.; writing—original draft preparation, M.S.S.; writing—review and editing, M.S.S., A.t.C., K.M.E.O. and M.R.F.; visualization, M.S.S., A.t.C. and K.M.E.O.; supervision, A.t.C.; project administration, A.t.C. and M.R.F.; funding acquisition, A.t.C. and M.R.F. All authors have read and agreed to the published version of the manuscript.
Funding
This research was supported by CNPq Research Productivity Grant (PQ) 304642/2022-3.
Data Availability Statement
The original contributions presented in this study are included in the article. Further inquiries can be directed to the corresponding author. All data will be made available upon request.
Acknowledgments
This work was supported by the Coordination for the Improvement of Higher Education Personnel (CAPES, Brazil), funded by the National Council for Scientific and Technological Development (CNPq) of the Ministry of Science, Technology, Innovation and Communications (MCTIC), within the scope of the SensNexus project; by the United Nations Educational, Scientific and Cultural Organization (UNESCO); by the Federal University of Santa Catarina (UFSC) and its research laboratories; by the Brazilian Antarctic Program (PROANTAR); and by the Brazilian Navy. We acknowledge the collaboration of Daniel Sedorko and Claudio Eduardo Lana during the Antarctic field campaign. During the preparation of this manuscript, the authors used Generative AI for the purposes of creating the graphical abstract. The authors have reviewed and edited the output and take full responsibility for the content of this publication. We thank the anonymous reviewers for their insightful comments and the editors for their thorough revisions, which together helped improve this article.
Conflicts of Interest
The authors declare no conflicts of interest.
Abbreviations
The following abbreviations are used in this manuscript:
| EACF | Comandante Ferraz Antarctic Station |
| MP | Microplastic |
| FM | Fluorescence Microscopy |
| PMP | Potential Microplastic |
References
- Mishra, A.K.; Singh, J.; Mishra, P.P. Microplastics in Polar Regions: An Early Warning to the World’s Pristine Ecosystem. Sci. Total Environ. 2021, 784, 147149. [Google Scholar] [CrossRef]
- Wu, D.; Van Goethem, M.W.; Graham, D.W.; Zhang, X.; Li, Z.; Shi, G. Antarctic Environmental Resistomes Closely Associated with Human and Animal Waste Releases. Environ. Sci. Technol. 2025, 59, 22832–22841. [Google Scholar] [CrossRef] [PubMed]
- Filonchyk, M.; Peterson, M.P.; Hurynovich, V.; Zhang, L.; He, Y. Aerosol Composition and Properties in Antarctica: Optical, Microphysical, and Radiative Characteristics. Glob. Planet. Change 2025, 253, 104935. [Google Scholar] [CrossRef]
- Bargagli, R.; Rota, E. Environmental Contamination and Climate Change in Antarctic Ecosystems: An Updated Overview. Environ. Sci. Adv. 2024, 3, 543–560. [Google Scholar] [CrossRef]
- Pellegrino, D.; La Russa, D.; Barberio, L. Pollution Has No Borders: Microplastics in Antarctica. Environments 2025, 12, 77. [Google Scholar] [CrossRef]
- Taurozzi, D.; Scalici, M. Seabirds from the Poles: Microplastics Pollution Sentinels. Front. Mar. Sci. 2024, 11, 1343617. [Google Scholar] [CrossRef]
- Rota, E.; Bergami, E.; Corsi, I.; Bargagli, R. Macro- and Microplastics in the Antarctic Environment: Ongoing Assessment and Perspectives. Environments 2022, 9, 93. [Google Scholar] [CrossRef]
- Díaz, M.; Lagomarsino, L.; Mataloni, G.; Beltrán, M.; Libertelli, M.; Fermani, P. Environmental Changes Affect Picoplanktonic Composition in Antarctic Peninsula Ponds. Antarct. Sci. 2024, 36, 101–112. [Google Scholar]
- Aves, A.R.; Revell, L.E.; Gaw, S.; Ruffell, H.; Schuddeboom, A.; Wotherspoon, N.E.; McDonald, A.J. First evidence of microplastics in Antarctic snow. Cryosphere 2022, 16, 2127–2145. [Google Scholar] [CrossRef]
- Jones-Williams, K.; Rowlands, E.; Primpke, S.; Galloway, T.; Cole, M.; Waluda, C.; Manno, C. Mps in Antarctica: A plastic legacy in the Antarctic snow. Sci. Total Environ. 2025, 966, 178543. [Google Scholar] [CrossRef]
- González-Pleiter, M.; Lacerot, G.; Edo, C.; Pablo Lozoya, J.; Leganés, F.; Fernández-Piñas, F.; Rosal, R.; Teixeira-de-Mello, F. A pilot study about microplastics and mesoplastics in an Antarctic glacier. Cryosphere 2021, 15, 2531–2539. [Google Scholar] [CrossRef]
- Stefanelli-Silva, G.; Friedemann, P.; Rocha de Moraes, B.; Ando, R.A.; de Siqueira Campos, L.; Varella Petti, M.A.; Smith, C.R.; Sumida, P.Y.G. Bottom-feeders eat their fiber: Ingestion of anthropogenic microdebris by Antarctic deep-sea invertebrates depends on feeding ecology. Environ. Sci. Technol. 2024, 58, 22355–22367. [Google Scholar] [CrossRef]
- Kukharchyk, T.I.; Kakareka, S.V.; Rabychyn, K.O. Microplastics in Soils of the Thala Hills, East Antarctica. Eurasian Soil Sci. 2024, 57, 502–512. [Google Scholar] [CrossRef]
- Bernard, N.; Metian, M.; Oberhaensli, F.; Sznaider, F.; Ruberto, L.; Vodopivez, C.; Mac Cormack, W.; Alonso Hernandez, C. Identification and Quantification of Microplastics in Antarctic Coastal Waters Using Laser Direct Infrared (LDIR). Mar. Pollut. Bull. 2025, 221, 118534. [Google Scholar] [CrossRef]
- Müller, Y.K.; Wernicke, T.; Pittroff, M.; Witzig, C.S.; Storck, F.R.; Klinger, J.; Zumbülte, N. Microplastic Analysis—Are We Measuring the Same? Anal. Bioanal. Chem. 2020, 412, 555–560. [Google Scholar] [CrossRef]
- Bhardwaj, L.K. Occurrence of Microplastics (MPs) in Antarctica and Its Impact on the Health of Organisms. Preprints 2023, 2023100334. [Google Scholar] [CrossRef]
- Gurumoorthi, K.; Luis, A.J. Recent Trends on Microplastics Abundance and Risk Assessment in Coastal Antarctica: Regional Meta-Analysis. Environ. Pollut. 2023, 324, 121385. [Google Scholar] [CrossRef]
- Cunningham, E.M.; Ehlers, S.M.; Dick, J.T.A.; Sigwart, J.D.; Linse, K.; Dick, J.J.; Kiriakoulakis, K. High Abundances of Microplastic Pollution in Deep-Sea Sediments: Evidence from Antarctica and the Southern Ocean. Environ. Sci. Technol. 2020, 54, 13661–13671. [Google Scholar] [CrossRef]
- Ho, D.; Prabhakar, P.; Karthikeyan, K.G.; Feng, H. Shedding Light on the Polymer’s Identity: Microplastic Detection through Nile Red Staining and Multispectral Imaging. J. Environ. Chem. Eng. 2025, 13, 117944. [Google Scholar] [CrossRef]
- Yeo, B.G.; Mizukawa, K.; Takada, H. Microplastics in Global Marine Waters and Biota: Effectiveness of Potential Bioindicators. Environ. Monit. Contam. Res. 2023, 3, 43–68. [Google Scholar] [CrossRef]
- Bargagli, R.; Rota, E. Microplastic Interactions and Possible Combined Biological Effects in Antarctic Marine Ecosystems. Animals 2022, 13, 162. [Google Scholar] [CrossRef] [PubMed]
- Lancaster, E.; Lancaster, Z.; Marasinghe, V. Polar Pollution: Protecting Antarctic Marine Ecosystems from Microplastics. Ukr. Antarct. J. 2025, 23, 90–99. [Google Scholar] [CrossRef]
- Garcia-Garin, O.; García-Cuevas, I.; Drago, M.; Rita, D.; Parga, M.; Gazo, M.; Cardona, L. No Evidence of Microplastics in Antarctic Fur Seal Scats. Sci. Total Environ. 2020, 737, 140210. [Google Scholar] [CrossRef]
- Reed, S.; Clark, M.; Thompson, R.; Hughes, K.A. Microplastics in Marine Sediments near Rothera Research Station, Antarctica. Mar. Pollut. Bull. 2018, 133, 460–463. [Google Scholar] [CrossRef]
- Gratzl, J.; Seifried, T.M.; Stolzenburg, D.; Grothe, H. A Fluorescence Approach for Online Measurement of Atmospheric Microplastics. Environ. Sci. Atmos. 2024, 4, 601–610. [Google Scholar] [CrossRef]
- Wohlschläger, M.; Versen, M.; Löder, M.G.J.; Laforsch, C. Fast Identification of Microplastic Particles Using Fluorescence Lifetime Imaging Microscopy. Heliyon 2024, 10, e25133. [Google Scholar] [CrossRef] [PubMed]
- Zhou, F.; Wang, X.; Wang, G.; Zuo, Y. Rapid Detection of Microplastics Based on Fluorescence Lifetime Imaging Technology. Toxics 2022, 10, 118. [Google Scholar] [CrossRef]
- Bianco, A.; Carena, L.; Peitsaro, N.; Sordello, F.; Vione, D.; Passananti, M. Rapid Detection of Nanoplastics and Small Microplastics by Nile Red Staining and Flow Cytometry. Environ. Chem. Lett. 2023, 21, 647–653. [Google Scholar] [CrossRef]
- Idehara, W.; Haga, Y.; Tsujino, H.; Ikuno, Y.; Manabe, S.; Hokaku, M.; Asahara, H.; Higashisaka, K.; Tsutsumi, Y. Exploring Nile Red Staining as an Analytical Tool for Surface-Oxidized Microplastics. Environ. Res. 2025, 269, 120934. [Google Scholar] [CrossRef]
- Crawford, C.B.; Quinn, B. Microplastic Pollutants; Elsevier: Amsterdam, The Netherlands, 2017. [Google Scholar]
- Chun, S.; Gopal, J.; Muthu, M. Portable Analytics as a Contemporary Environmental Microplastic Research Tool. Trends Environ. Anal. Chem. 2024, 43, e00234. [Google Scholar] [CrossRef]
- Gao, Z.; Wontor, K.; Cizdziel, J.V. Labeling Microplastics with Fluorescent Dyes. Molecules 2022, 27, 7415. [Google Scholar] [CrossRef]
- Karbalaei, S.; Hanachi, P.; Walker, T.R.; Cole, M. Occurrence, Sources, Human Health Impacts and Mitigation of Microplastic Pollution. Environ. Sci. Pollut. Res. 2018, 25, 36046–36063. [Google Scholar] [CrossRef] [PubMed]
- Kiran, B.R.; Kopperi, H.; Mohan, S.V. Micro/Nano-Plastics: Occurrence, Identification and Mitigation. Rev. Environ. Sci. Biotechnol. 2022, 21, 169–203. [Google Scholar] [CrossRef] [PubMed]
- Prasad, S.; Bennett, A.; Triantafyllou, M. Characterization of Nile Red-Stained Microplastics through Fluorescence Spectroscopy. J. Mar. Sci. Eng. 2024, 12, 1403. [Google Scholar] [CrossRef]
- Shruti, V.C.; Pérez-Guevara, F.; Roy, P.D.; Kutralam-Muniasamy, G. Analyzing Microplastics with Nile Red: Emerging Trends, Challenges, and Prospects. J. Hazard. Mater. 2022, 423, 127171. [Google Scholar] [CrossRef] [PubMed]
- Sun, J.; Dai, X.; Wang, Q.; van Loosdrecht, M.C.; Ni, B.-J. Microplastics in Wastewater Treatment Plants: Detection, Occurrence and Removal. Water Res. 2019, 152, 21–37. [Google Scholar] [CrossRef]
- Kundu, M.N.; Komakech, H.C.; Lugomela, G. Analysis of Macro- and Microplastics in Riverine Systems. Arch. Environ. Contam. Toxicol. 2022, 82, 142–157. [Google Scholar] [CrossRef]
- Munno, K.; Lusher, A.L.; Minor, E.C.; Gray, A.; Hof, K.; Hankett, J.; Lee, C.-F.T.; Primpke, S.; McNeish, R.E.; Wong, C.S.; et al. Patterns of Microparticles in Blank Samples. Chemosphere 2023, 333, 138883. [Google Scholar] [CrossRef]
- Dawson, A.L.; Santana, M.F.M.; Nelis, J.L.D.; Motti, C.A. Control and Blank Data Correction Methods in Microplastics Research. J. Hazard. Mater. 2023, 443, 130218. [Google Scholar] [CrossRef]
- Niu, J.; Xu, D.; Wu, W.; Gao, B. Tracing Microplastic Sources in Urban Water Bodies. npj Clean Water 2024, 7, 37. [Google Scholar] [CrossRef]
- Cross, R.K.; Cox, R.; Roberts, S.L.; Howard, A.; Sharps, K.; Hayes, F. Monitoring Moss Reveals Widespread Deposition of Airborne Microplastics across the UK. Microplast. Nanoplast. 2026, 6, 31. [Google Scholar] [CrossRef]
- Shim, W.J.; Song, Y.K.; Hong, S.H.; Jang, M. Identification and Quantification of Microplastics Using Nile Red Staining. Mar. Pollut. Bull. 2016, 113, 469–476. [Google Scholar] [CrossRef] [PubMed]
- Leistenschneider, C.; Wu, F.; Primpke, S.; Gerdts, G.; Burkhardt-Holm, P. High Concentrations of Small Microplastics in the Southern Weddell Sea. Sci. Total Environ. 2024, 927, 172124. [Google Scholar] [CrossRef]
- Frias, J.P.G.L.; Pagter, E.; Nash, R.; O’Connor, I. Standardised Protocol for Monitoring Microplastics in Sediments; GMIT: Galway, Ireland, 2018. [Google Scholar] [CrossRef]
- Erni-Cassola, G.; Gibson, M.I.; Thompson, R.C.; Christie-Oleza, J.A. Lost, but Found with Nile Red: A Novel Method for Detecting and Quantifying Small Microplastics (1 Mm to 20 Μm) in Environmental Samples. Environ. Sci. Technol. 2017, 51, 13641–13648. [Google Scholar] [CrossRef]
- Anderson, Z.T.; Cundy, A.B.; Croudace, I.W.; Warwick, P.E.; Celis-Hernandez, O.; Stead, J.L. Rapid Assessment of Microplastics in the Sea Surface Microlayer. Sci. Rep. 2018, 8, 9428. [Google Scholar] [CrossRef] [PubMed]
- Kelly, A.; Rodemann, T.; Meiners, K.M.; Auman, H.J.; Moreau, S.; Fripiat, F.; Delille, B.; Lannuzel, D. Microplastics in Southern Ocean Sea Ice. Water Emerg. Contam. Nanoplast. 2024, 3, 26. [Google Scholar] [CrossRef]
- Maes, T.; Jessop, R.; Wellner, N.; Haupt, K.; Mayes, A.G. Rapid-Screening Detection of Microplastics Using Nile Red. Sci. Rep. 2017, 7, 44501. [Google Scholar] [CrossRef] [PubMed]
- Kutralam-Muniasamy, G.; Shruti, V.C. Microplastic Diagnostics in Humans: The 3Ps. Sci. Total Environ. 2023, 856, 159164. [Google Scholar] [CrossRef]
- Shruti, V.C.; Kutralam-Muniasamy, G. Blanks and Bias in Microplastic Research. Trends Environ. Anal. Chem. 2023, 38, e00203. [Google Scholar] [CrossRef]
- Carvalho, A.B.; Floresta, D.C.B.; Passos, G.N.B.; da Silva, A.N.; Wollmann, C.A.; Galvani, E.; Chiquetto, J.B.; Dris, R.; Gobo, J.P.A. Identification and Analysis of Microplastics: A Systematic Review of Methods and Techniques. SSRN 2024, 23, 347. [Google Scholar] [CrossRef]
- Cesa, F.S.; Turra, A.; Baruque-Ramos, J. Synthetic Fibers as Microplastics in the Marine Environment. Sci. Total Environ. 2017, 598, 1116–1129. [Google Scholar] [CrossRef]
- Sarker, M.A.B.; Imtiaz, M.H.; Holsen, T.M.; Baki, A.B.M. Real-Time Detection of Microplastics Using an AI Camera. Sensors 2024, 24, 4394. [Google Scholar] [CrossRef]
- Sierra, I.; Rodríguez Chialanza, M.; Faccio, R.; Carrizo, D.; Fornaro, L.; Pérez-Parada, A. Identification of Microplastics by Polarized Light Optical Microscopy. Environ. Sci. Pollut. Res. 2020, 27, 7409–7419. [Google Scholar] [CrossRef]
- Oliveira de Miranda, C.; de Souza, J.J.L.L.; Schaefer, C.E.G.R.; Huerta Lwanga, E.; Villela, F.N.J. Short-Term Impacts of Microplastics on Antarctic Soils. Environ. Pollut. 2024, 347, 123791. [Google Scholar] [CrossRef]
- Prata, J.C.; Alves, J.R.; da Costa, J.P.; Duarte, A.C.; Rocha-Santos, T. Quantification of Nile Red Stained Microplastics. Sci. Total Environ. 2020, 719, 137498. [Google Scholar] [CrossRef] [PubMed]
- Ho, D.; Liu, S.; Wei, H.; Karthikeyan, K.G. The Glowing Potential of Nile Red for Microplastics Identification. Microchem. J. 2024, 197, 109708. [Google Scholar] [CrossRef]
- Ribeiro, F.; Duarte, A.C.; Costa, J.P. Staining Methodologies for Microplastics Screening. TrAC Trends Anal. Chem. 2024, 172, 117555. [Google Scholar] [CrossRef]
- Labbe, A.B.; Bagshaw, C.R.; Uttal, L. Inexpensive Adaptations of Microscopes for Microplastic Identification. J. Chem. Educ. 2020, 97, 4026–4032. [Google Scholar] [CrossRef]
- Corami, F.; Rosso, B.; Bravo, B.; Gambaro, A.; Barbante, C. Quantitative Analysis of Microplastic Fibers Using Micro-FTIR. Chemosphere 2020, 238, 124564. [Google Scholar] [CrossRef]
- Tin, T.; Fleming, Z.L.; Hughes, K.A.; Ainley, D.G.; Convey, P.; Moreno, C.A.; Pfeiffer, S.; Scott, J.; Snape, I. Impacts of Local Human Activities on the Antarctic Environment. Antarct. Sci. 2009, 21, 3–33. [Google Scholar] [CrossRef]
- Zhang, S.; Zhang, W.; Ju, M.; Qu, L.; Chu, X.; Huo, C.; Wang, J. Distribution of Microplastics in Antarctic Seawater. Sci. Total Environ. 2022, 838, 156051. [Google Scholar] [CrossRef] [PubMed]
- Nerland, I.L.; Halsband, C.; Allan, I.J.; Thomas, K.V. Microplastics in Marine Environments: Occurrence, Distribution and Effects; Report No. 6754-2014; Norwegian Institute for Water Research (NIVA): Oslo, Norway, 2014; Available online: https://www.miljodirektoratet.no/publikasjoner/2015/februar/microplastics-in-marine-environments-occurrence-distribution-and-effects/ (accessed on 30 April 2026).
- Tocháček, J.; Láska, K.; Bálková, R.; Krmíček, L.; Merna, J.; Tupý, M.; Kapler, P.; Poláček, P.; Čížková, K.; Buráň, Z. Polymer Weathering in Antarctica. Polym. Test. 2019, 77, 105898. [Google Scholar] [CrossRef]
- Fragão, J.; Bessa, F.; Otero, V.; Barbosa, A.; Sobral, P.; Waluda, C.M.; Guímaro, H.R.; Xavier, J.C. Penguins as Biological Samplers of Microplastics. Sci. Total Environ. 2021, 788, 147698. [Google Scholar] [CrossRef] [PubMed]
- Bhattacharjee, S.; Rathore, C.; Naik, A.; Saha, M.; Tudu, P.; Ghosh Dastidar, P.; Bhattacharyya, S.; de Boer, J.; Chaudhuri, P. Microplastics in Penguin Internal Organs. Sci. Total Environ. 2024, 951, 175361. [Google Scholar] [CrossRef]
- Coria, S.H.; Pérez Catán, S.; Pasquini, A.I.; Arribere, M.; Vieira, R.; Rosa, L.H.; Lirio, J.M.; Lecomte, K.L. Geochemistry of Lake Sediments from the Antarctic Peninsula. Antarct. Sci. 2024, 36, 160–180. [Google Scholar] [CrossRef]
- Villanova-Solano, C.; Hernández-Sánchez, C.; Díaz-Peña, F.J.; González-Sálamo, J.; González-Pleiter, M.; Hernández-Borges, J. Microplastics in Snow of a High Mountain National Park. Sci. Total Environ. 2023, 873, 162276. [Google Scholar] [CrossRef]
- Arndt, S. Sensitivity of Sea Ice Growth to Snow Properties. Geophys. Res. Lett. 2022, 49, e2022GL099653. [Google Scholar] [CrossRef]
- Arndt, S.; Haas, C.; Meyer, H.; Peeken, I.; Krumpen, T. Superimposed Ice and Snow Ice on Sea Ice. Cryosphere 2021, 15, 4165–4178. [Google Scholar] [CrossRef]
- Hunter, A.; Thorpe, S.E.; McCarthy, A.H.; Manno, C. Microplastic Hotspots across the Southern Ocean. Sci. Rep. 2024, 14, 31599. [Google Scholar] [CrossRef]
- Lozoya, J.P.; Rodríguez, M.; Azcune, G.; Lacerot, G.; Pérez-Parada, A.; Lenzi, J.; Rossi, F.; Teixeira de Mello, F. Stranded Pellets in Fildes Peninsula, Antarctica. Sci. Total Environ. 2022, 838, 155830. [Google Scholar] [CrossRef]
- Möller, J.N.; Heisel, I.; Satzger, A.; Vizsolyi, E.C.; Oster, S.D.J.; Agarwal, S.; Laforsch, C.; Löder, M.G.J. Extracting Microplastics from Soils for Spectroscopic Analysis. Environ. Toxicol. Chem. 2022, 41, 844–857. [Google Scholar] [CrossRef]
- Cai, H.; Chen, M.; Chen, Q.; Du, F.; Liu, J.; Shi, H. Microplastic Quantification Affected by Filter Structure. Chemosphere 2020, 257, 127198. [Google Scholar] [CrossRef]
- Chrást, P.; Komendová, R.; Barták, M.; Zvěřina, O. Metal Allocation Patterns in Antarctic Lichens. SSRN 2025. [Google Scholar] [CrossRef]
- Hamilton, B.; Erdle, L.; Afaq, A.; Ward, E.; Barrows, A. Microplastics along Antarctic Tourism Routes. SSRN 2024. [Google Scholar] [CrossRef]
- Nedbalová, L.; Nývlt, D.; Lirio, J.M.; Kavan, J.; Elster, J. Distribution of Branchinecta gaini in Antarctica. Antarct. Sci. 2017, 29, 341–342. [Google Scholar] [CrossRef]
- Svigruha, R.; Fodor, I.; Németh, Z.; Farkas, A.; Pirger, Z.; Ács, A. Effects of Microplastics on Daphnia magna. Environ. Sci. Pollut. Res. 2025, 32, 4841–4855. [Google Scholar] [CrossRef]
- Perfetti-Bolaño, A.; Araneda, A.; Muñoz, K.; Barra, R.O. Microplastics in Soils and Intertidal Sediments at Fildes Bay. Front. Mar. Sci. 2022, 8, 774055. [Google Scholar] [CrossRef]
- Lusher, A.L.; Bråte, I.L.N.; Munno, K.; Hurley, R.R.; Welden, N.A. Importance of Visual Classification in Microplastic Characterization. Appl. Spectrosc. 2020, 74, 1139–1153. [Google Scholar] [CrossRef]
- Zhu, Y.; Li, Y.; Huang, J.; Zhang, Y.; Ho, Y.-W.; Fang, J.K.-H.; Lam, E.Y. Advanced Optical Imaging Technologies for Microplastics Identification. Adv. Photonics Res. 2024, 5, 2400038. [Google Scholar] [CrossRef]
- Shruti, V.C.; Pérez-Guevara, F.; Kutralam-Muniasamy, G. Metro Station Free Drinking Water Fountain—A Potential “Microplastics Hotspot” for Human Consumption. Environ. Pollut. 2020, 261, 114227. [Google Scholar] [CrossRef]
- Le, Q.N.P.; Halsall, C.; Peneva, S.; Wrigley, O.; Braun, M.; Amelung, W.; Ashton, L.; Surridge, B.W.J.; Quinton, J. Towards Quality-Assured Measurements of Microplastics in Soil Using Fluorescence Microscopy. Anal. Bioanal. Chem. 2025, 417, 2225–2238. [Google Scholar] [CrossRef]
- Ziajahromi, S.; Pratt, C.; Slynkova, N.; Leusch, F.D.L. Microplastic Uptake and Impacts on Crops under Realistic Exposure: Implications for Soil–Plant Systems. Environ. Sci. Pollut. Res. 2026, 33, 6259–6273. [Google Scholar] [CrossRef]
- Ritz-Meuret, M.E.; Lippert, A.R.; Ritz, T. An Economical Fluorescent Method for Microplastic Detection in Soil Samples. Anal. Methods 2025, 17, 2389–2397. [Google Scholar] [CrossRef]
- Gupta, E.; Mishra, V.K.; Patel, A.; Srivastava, P.K. A Modified Methodology for Extraction and Quantification of Microplastics in Soil. NanoImpact 2024, 35, 100525. [Google Scholar] [CrossRef]
- Munno, K.; Helm, P.A.; Jackson, D.A.; Rochman, C.; Sims, A. Impacts of Temperature and Selected Chemical Digestion Methods on Microplastic Particles. Environ. Toxicol. Chem. 2017, 37, 91–98. [Google Scholar] [CrossRef]

Disclaimer/Publisher’s Note: The statements, opinions and data contained in all publications are solely those of the individual author(s) and contributor(s) and not of MDPI and/or the editor(s). MDPI and/or the editor(s) disclaim responsibility for any injury to people or property resulting from any ideas, methods, instructions or products referred to in the content. |
© 2026 by the authors. Licensee MDPI, Basel, Switzerland. This article is an open access article distributed under the terms and conditions of the Creative Commons Attribution (CC BY) license.