


Abstract
Soil micro- and nanoplastic contamination is escalating globally, yet its potential to interfere with routine agrochemical analyses remains poorly quantified. Standard operating procedures (SOPs) were calibrated for natural soil matrices and may not account for synthetic, carbon-rich polymers. This controlled model study quantified the analytical sensitivity of FAO/GLOSOLAN/ISO standard procedures to polystyrene nanoparticle (50 nm) contamination across a 0–0.5% (w/w) gradient in a Luvic Chernozem. Key parameters—pH, soil carbon, total nitrogen (TN), cation exchange capacity (CEC), and clay fraction—were measured following standardized protocols. The Walkley–Black method exhibited a strong dose-dependent increase in measured SOC (r = 0.93), reflecting systematic overestimation due to dichromate co-oxidation of polymer matrix, likely facilitated by exothermic heating above polystyrene’s glass transition temperature. The Dumas method showed moderate correlation (r = 0.59) but higher replicate variability driven by small aliquot size and heterogeneous nanoparticle distribution. The pH measurements displayed non-linear responses and elevated variability at low doses, whereas TN, CEC, and clay content remained statistically stable. These findings demonstrate that nanoplastic contamination can introduce significant analytical artifacts in oxidation-based SOC determinations, potentially leading to misinterpretation of soil carbon trends. Given the single-soil, single-polymer design, results represent a system-specific proof of analytical vulnerability rather than a universally quantified bias. Laboratories analyzing potentially contaminated soils should exercise caution with wet-oxidation SOC data, and broader SOP revisions must await multi-soil, multi-polymer validation campaigns.
1. Introduction
Micro- and nanoplastics (MPs/NPs), conventionally defined as plastic particles < 5 mm, have emerged as a pervasive global contaminant [1,2]. Originating from macroplastic fragmentation and industrial emissions, they accumulate across ecosystems, with terrestrial soils potentially retaining up to 20 times more MPs than marine environments [3,4,5,6]. Recent evidence also indicates that environmental stressors can induce phase separation in polymers, releasing amorphous micropollutants and dynamically altering their physicochemical behavior in soil matrices [7].
Beyond passive accumulation, MPs actively modify soil physicochemical properties. Controlled experiments demonstrate that MP addition alters bulk density, water retention, hydraulic conductivity, and aggregate stability, with effects strongly modulated by soil texture and polymer chemistry [8,9,10]. MPs also influence cation exchange capacity (CEC), either increasing it via oxygen-containing functional groups [11,12,13] or decreasing it through surface oxidation and masking of native exchange sites [14]. In biogeochemical cycles, MPs can deplete total nitrogen [15] while simultaneously increasing measured soil organic carbon (SOC), dissolved organic carbon, microbial biomass, and CO2 emissions [16]. However, these responses are highly context-dependent [15], and crucially, apparent increases in soil carbon pools may reflect analytical interference from carbon-rich polymers rather than genuine accumulation of native soil organic matter. Similarly, MP contamination yields contrasting pH responses, ranging from alkalinization due to additive leaching and aeration [17] to acidification linked to aggregate disruption and colloidal alterations [18].
Despite rapid advances in understanding micro- and nanoplastic effects on soil biophysical properties, the potential interference of plastic particles with routine agrochemical analyses remains insufficiently quantified. Standard operating procedures (SOPs) developed by FAO/GLOSOLAN/ISO were calibrated for natural soil matrices and do not account for the presence of synthetic, carbon-rich polymers. Recent evidence indicates that chemical oxidation methods, in particular, may co-oxidize polymer-derived carbon, leading to systematic overestimation of soil organic carbon (SOC) and misinterpretation of soil fertility trends [15]. Similarly, microplastic-induced alterations in colloidal behavior, surface charge, and reagent accessibility may introduce non-linear variability in pH, total nitrogen (TN), and cation exchange capacity (CEC) measurements [17]. These analytical uncertainties are especially relevant for nutrient-rich, agriculturally critical soils such as Chernozems, which are simultaneously exposed to intensive management, organic matter depletion, and increasing plastic inputs from mulching films, biosolids, and atmospheric deposition.
The present study was designed as a controlled model experiment to evaluate the analytical sensitivity of standard FAO/GLOSOLAN procedures to nanoplastic contamination across a defined concentration gradient, rather than to simulate field-realistic exposure scenarios. A Luvic Chernozem was selected due to its high agronomic importance, strong buffering capacity, and well-characterized organo-mineral matrix, which provides a conservative test system for detecting methodological interference. Because the experiment relies on a single composite soil sample and one polymer type (polystyrene latex, 50 nm), the findings should be interpreted as system-specific proof of analytical vulnerability. Extrapolation to other pedogenetic settings, polymer classes, or weathering states requires dedicated multi-soil validation. Accordingly, this work aimed to quantify how standardized additions of polystyrene nanoparticles influence the determination of pH, soil carbon (Walkley–Black vs. Dumas), TN, clay fraction, and CEC, and to identify which routine metrics are most susceptible to plastic-induced analytical artifacts.
2. Materials and Methods
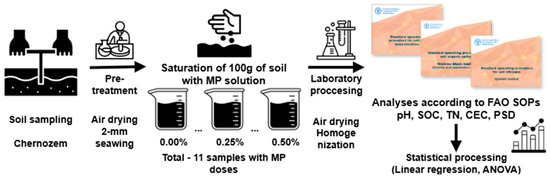
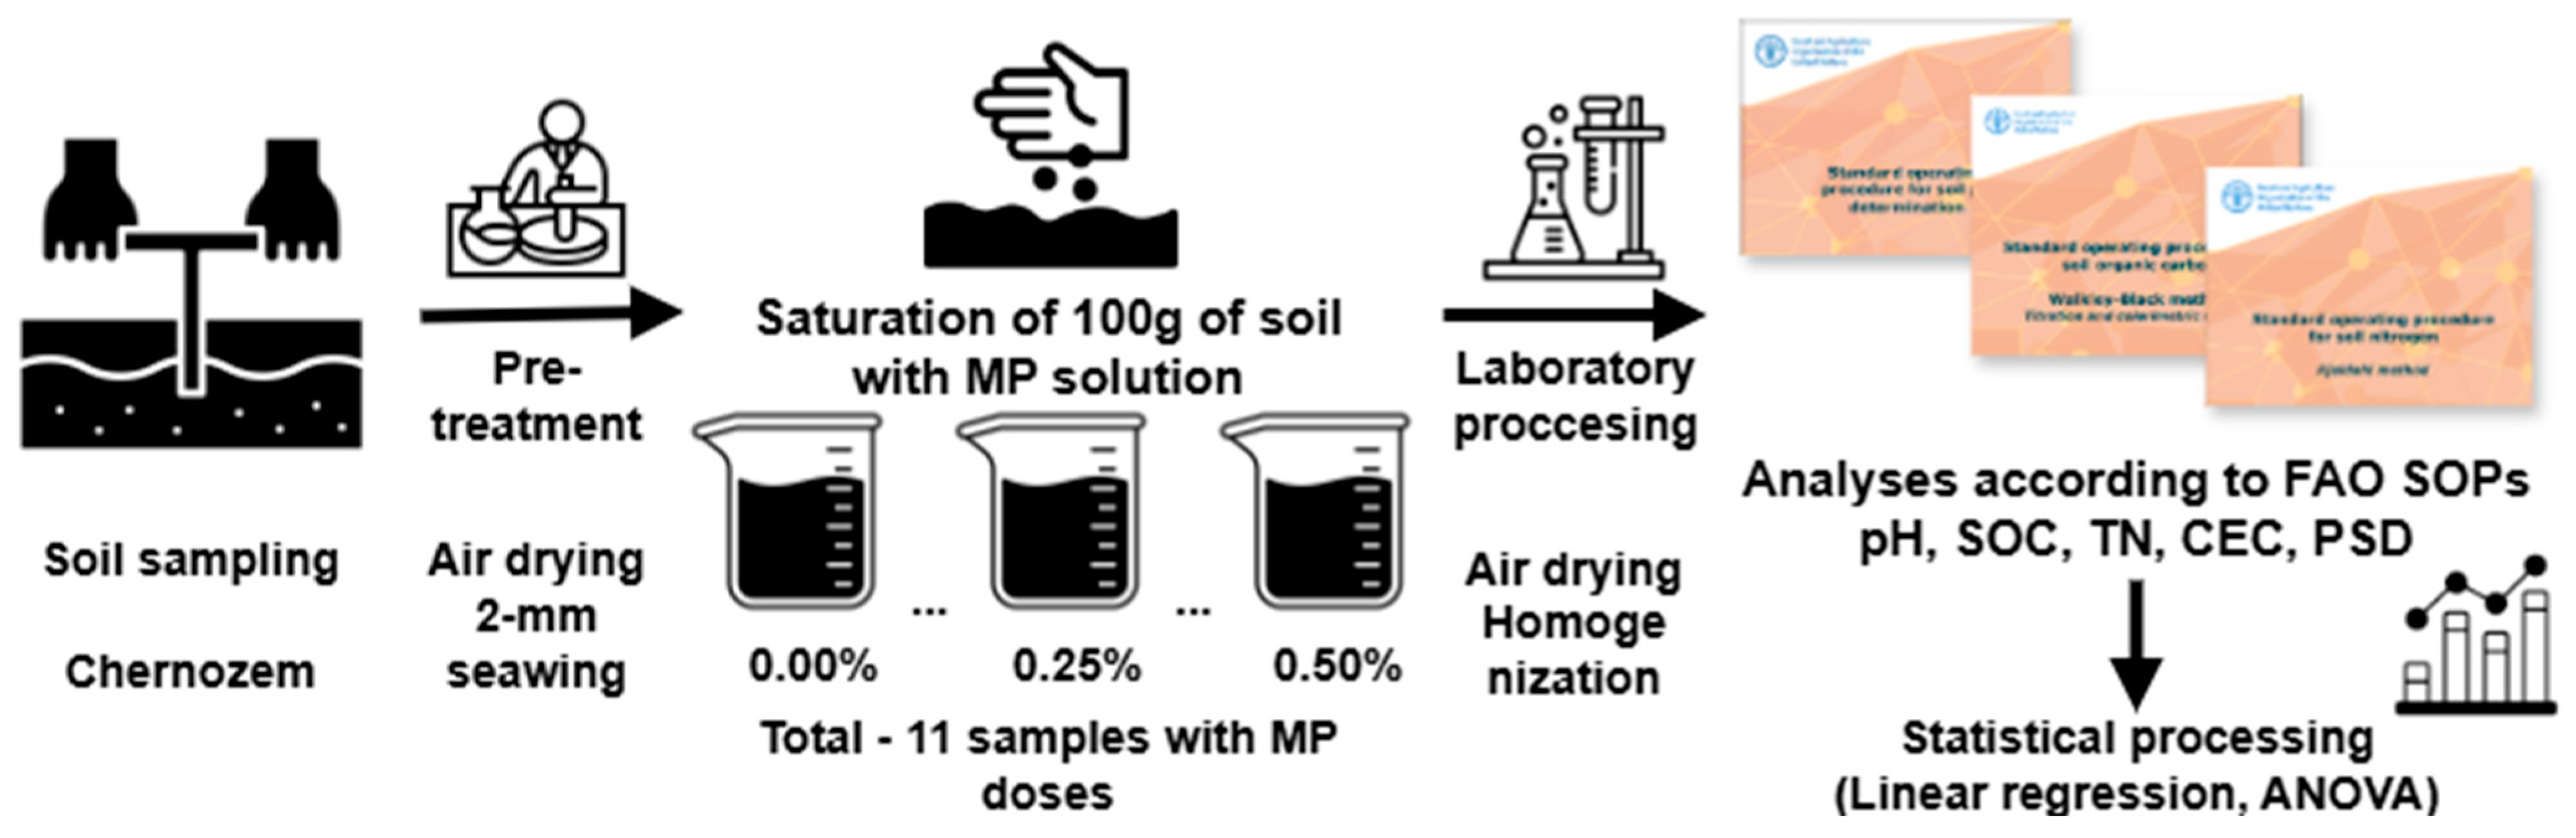
A laboratory experiment was conducted to assess the effect of polystyrene latex (PS) nanoparticles on the results of basic physicochemical analyses performed according to standard procedures recommended by the FAO (Figure 1). A Luvic Chernozem from fallow land under mixed woody-shrub vegetation was selected as the model soil for this controlled experiment. Soil samples were collected in May 2025 in the Tambov Region (Russia). Sampling was carried out over a 10-m2 area, where 1 kg of soil was collected from each of five randomly selected points to prepare a single composite soil sample. This design was intended to minimize within-site heterogeneity in a model experiment; it does not represent a survey of regional variability. After homogenization, the soil was air-dried at room temperature to constant weight. The dried soil was sieved through a 2 mm sieve and thoroughly cleaned of root residues.
Figure 1.
Experimental scheme; abbreviations are explained in the text.
Following preliminary preparation, eleven subsamples of 100 g each were taken from the bulk sample. Subsequently, 50 mL of distilled water containing nanoplastic particles was added to each of the eleven subsamples. Nanoplastic doses were preliminarily calculated, ranging from 0.0 to 0.5% of soil mass, with increments of 0.05%. Polystyrene latex nanoparticles (PS) with a particle size of 0.05 µm and a concentration of 1000 µg/mL in solution were used to simulate contamination. Accordingly, the experiment tested one polymer type (polystyrene latex) and one nominal particle size (0.05 µm) under controlled laboratory conditions.
The selected nanoplastic dose range (0–0.5% w/w) was intended to establish a controlled contamination gradient for assessing analytical sensitivity and detection thresholds of standard SOPs, rather than to replicate ambient field concentrations. A single homogenized composite sample was used to minimize intrinsic spatial heterogeneity and isolate methodological interference from natural pedogenic variability. This design enables direct attribution of observed measurement shifts to polymer–soil–reagent interactions under standardized laboratory conditions.
A set of routine analytical tests widely employed in agroecological monitoring of agricultural soils was selected as a representative model analysis. The guiding documents primarily comprised SOPs recommended by the Global Soil Laboratory Network (GLOSOLAN) and the FAO:
- The pH was determined in an aqueous suspension at a soil-to-water ratio of 1:2.5, following the Standard Operating Procedure for soil pH determination [19], using a Milwaukee Mi106 pH/Redox/Temp tester (Milwaukee Electronics, Milwaukee, WI, USA).
- Soil carbon was determined by two methods. The first measured soil organic carbon (SOC) using the Walkley–Black colorimetric method, as modified by the FAO [20]. The second determined total carbon (TC) via the Dumas dry combustion method [21], using a LECO TruSpec Micro CHNS Elemental Analyzer (LECO Corporation, St. Joseph, MI, USA).
- Total nitrogen (TN) content was determined by the Kjeldahl method, following the FAO-modified titrimetric procedure [22]. Mineralization and distillation were performed using a semi-automated analysis system comprising an LK-100 Automatic Kjeldahl Decomposition Unit (LOIP, St. Petersburg, Russia) and an LK-500 Automatic Kjeldahl Distillation Unit (LOIP, St. Petersburg, Russia).
- Cation exchange capacity (CEC) was determined in a 1 N ammonium acetate (Lenreactiv, Russia) extract (pH 7.0) according to the FAO/GLOSOLAN protocol [23].
- Particle-size distribution (PSD) was measured by the sedimentation method following pre-treatment of the soil with a 4% sodium pyrophosphate (Lenreactiv, Russia) solution [24].
All glassware was pre-cleaned before analysis to remove organic contaminants (to rule out contamination artifacts in SOC measurement).
Statistical processing and visualization of the obtained data were performed using Origin(Pro) (Version 2024, OriginLab Corporation, Northampton, MA, USA) software. Linear regression analysis, correlation analysis and one-way analysis of variance (ANOVA) with Tukey’s HSD post hoc test were applied. The significance level for comparing mean values was set at α = 0.05 (5%).
3. Results
During the model experiment, data were obtained on the effect of various plastic doses (0–0.5% by soil mass) on the measured properties of the studied Luvic Chernozem when standard analytical procedures (GLOSOLAN/FAO SOPs) were applied.
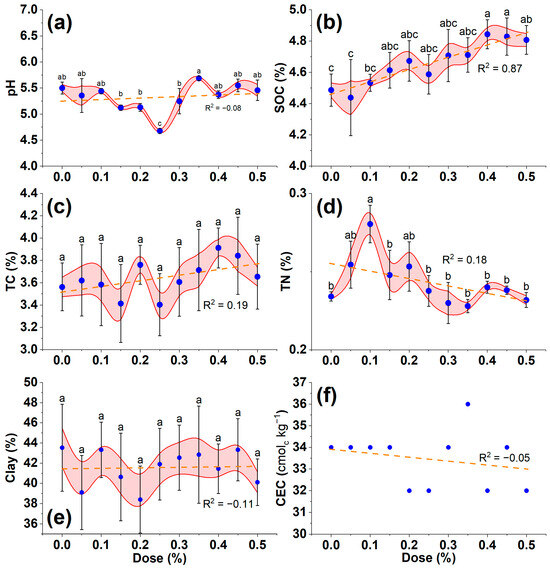
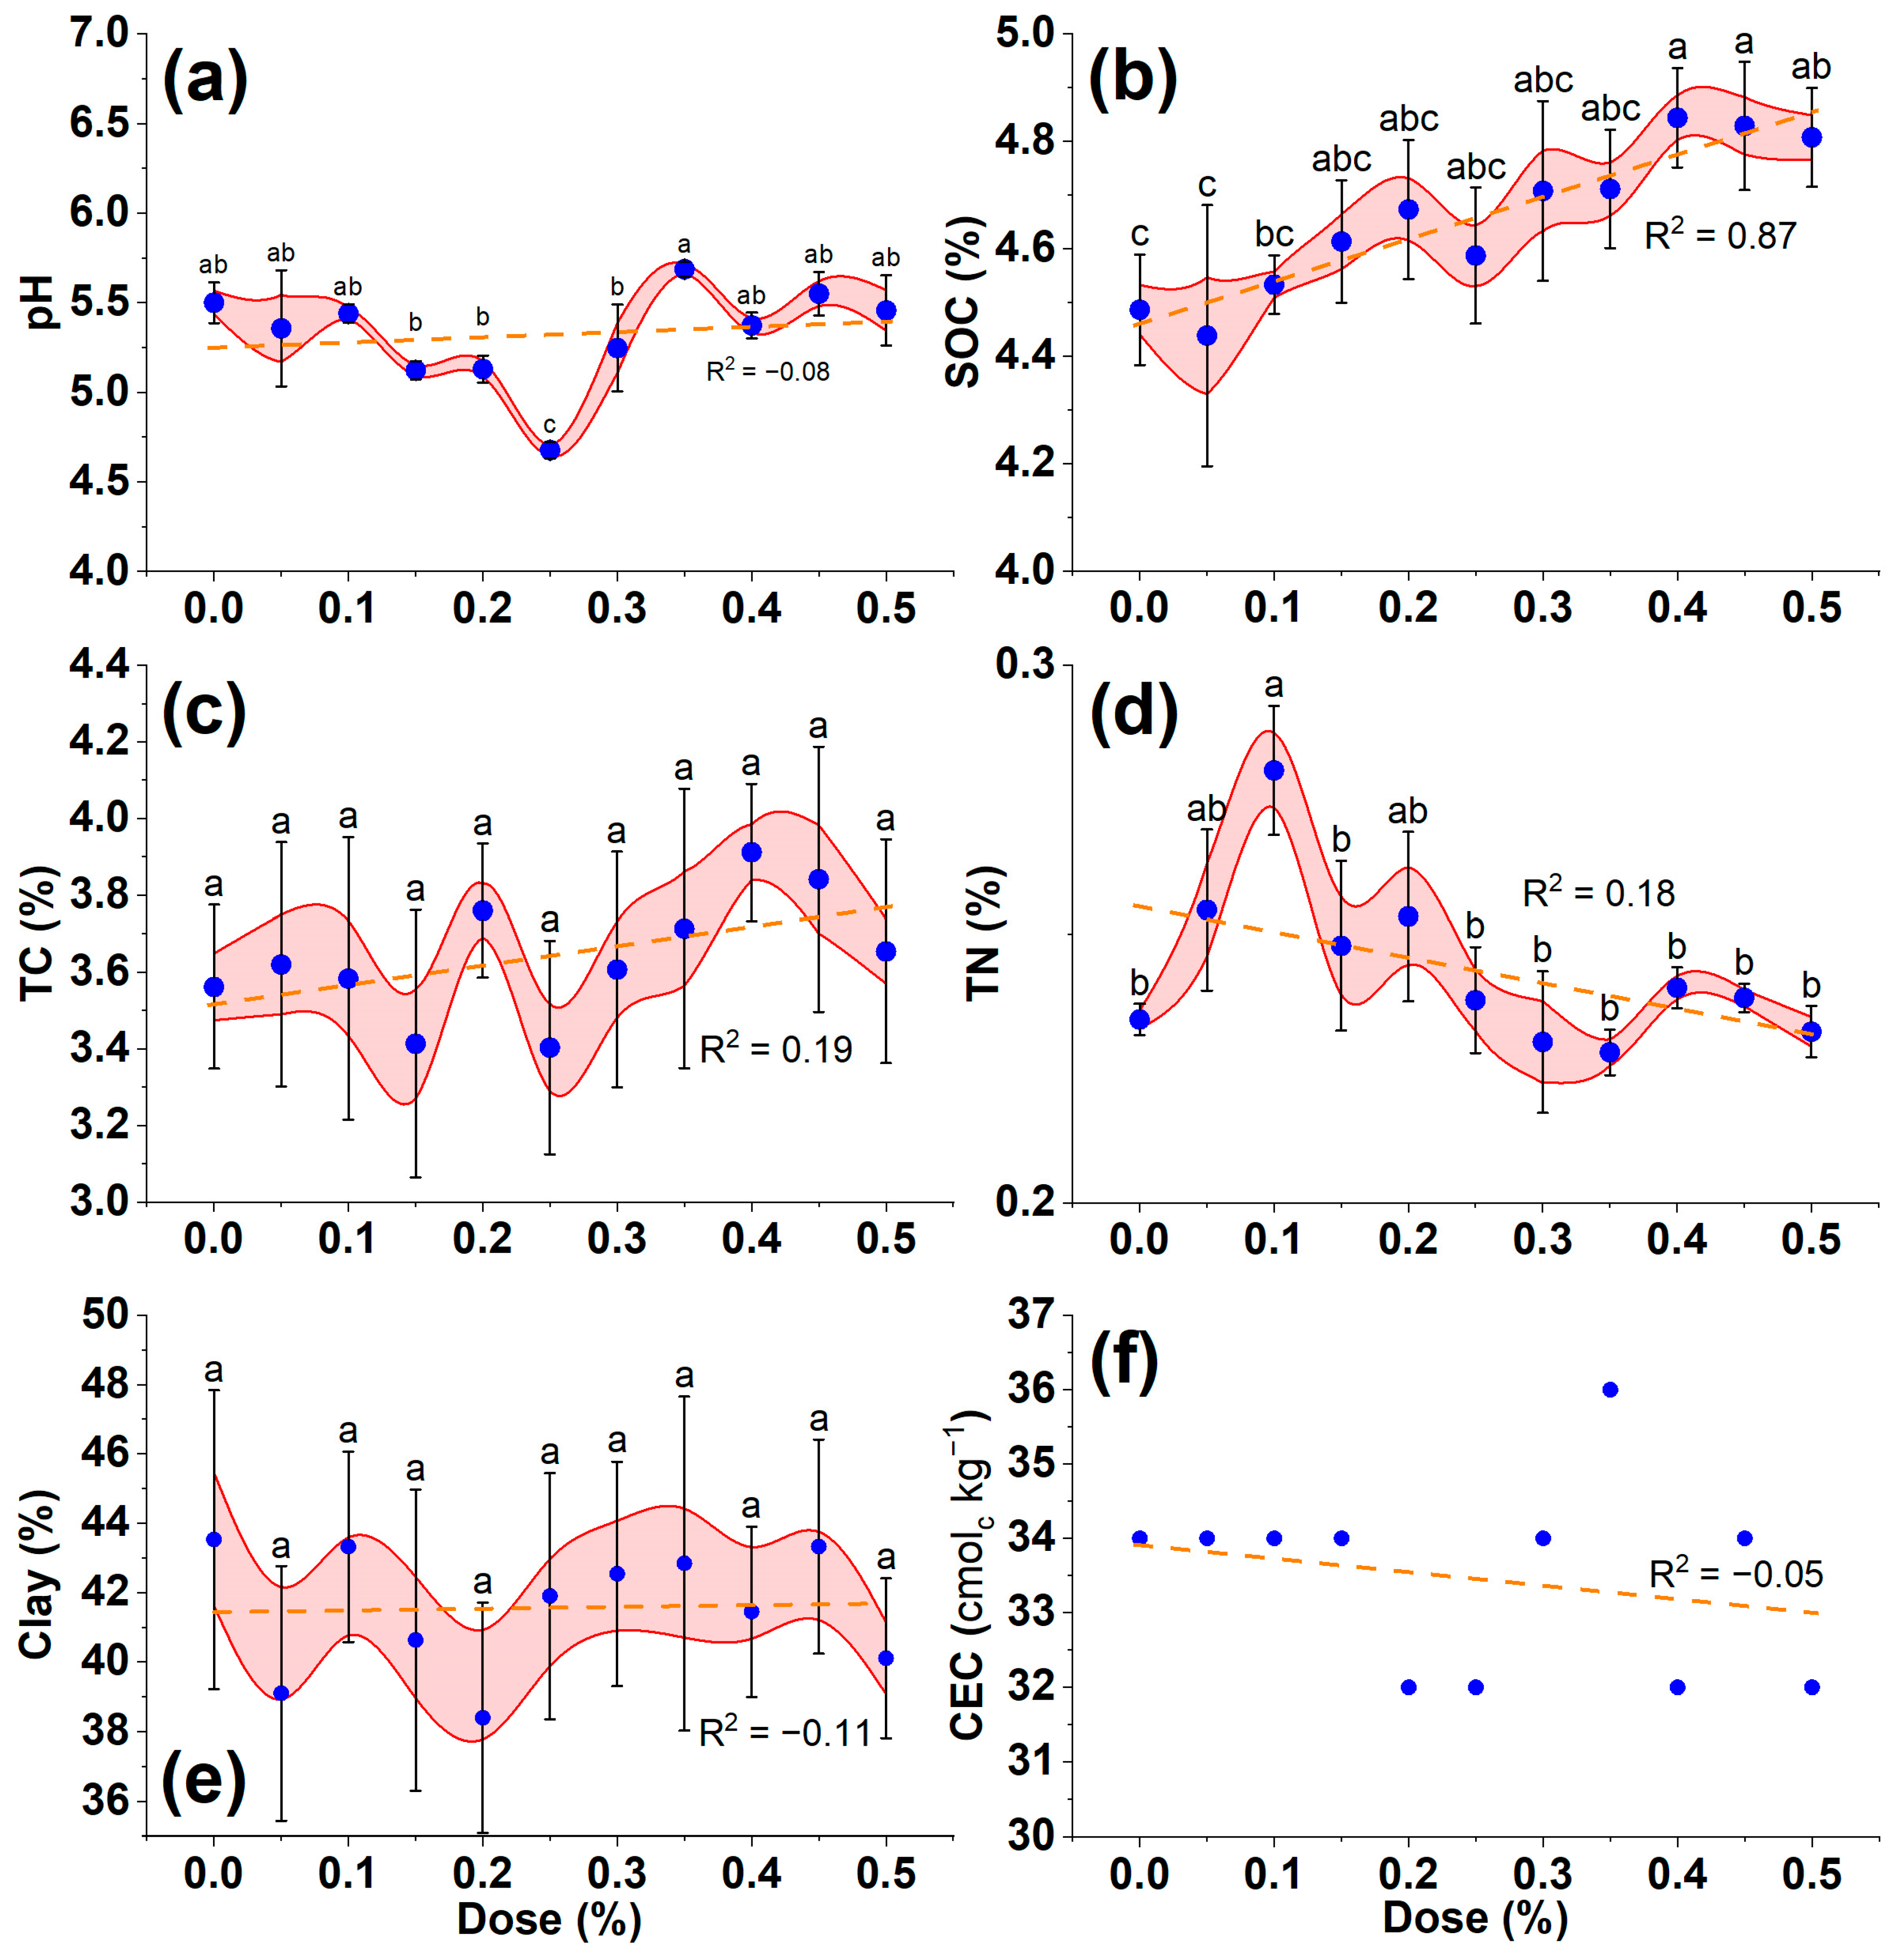
The pH value of the aqueous suspension in the control sample (without plastic addition) was 5.50 ± 0.11 units. Across the tested plastic doses, pH values varied within the range of 4.68 ± 0.05 to 5.69 ± 0.04 units (Figure 2a). The minimum pH value was recorded at a dose of 0.25%, and the maximum at 0.35%. The coefficient of variation (CV) amounted to 5.51%. Correlation analysis revealed a weak positive relationship between plastic dose and pH value (r = 0.28).
Figure 2.
Changes in measured soil properties across different PS doses: (a) pH in aqueous suspension; (b) oxidation-based SOC estimate determined by the Walkley–Black method; (c) total carbon (TC) determined using a CHN-S analyzer (Dumas method); (d) total nitrogen (TN) by the Kjeldahl method; (e) clay content (<0.001 mm); (f) cation exchange capacity (CEC). Data represent mean ± SD; all measurements except CEC were performed in triplicate. Different letters denote significant differences at p < 0.05 (one-way ANOVA with Tukey’s HSD).
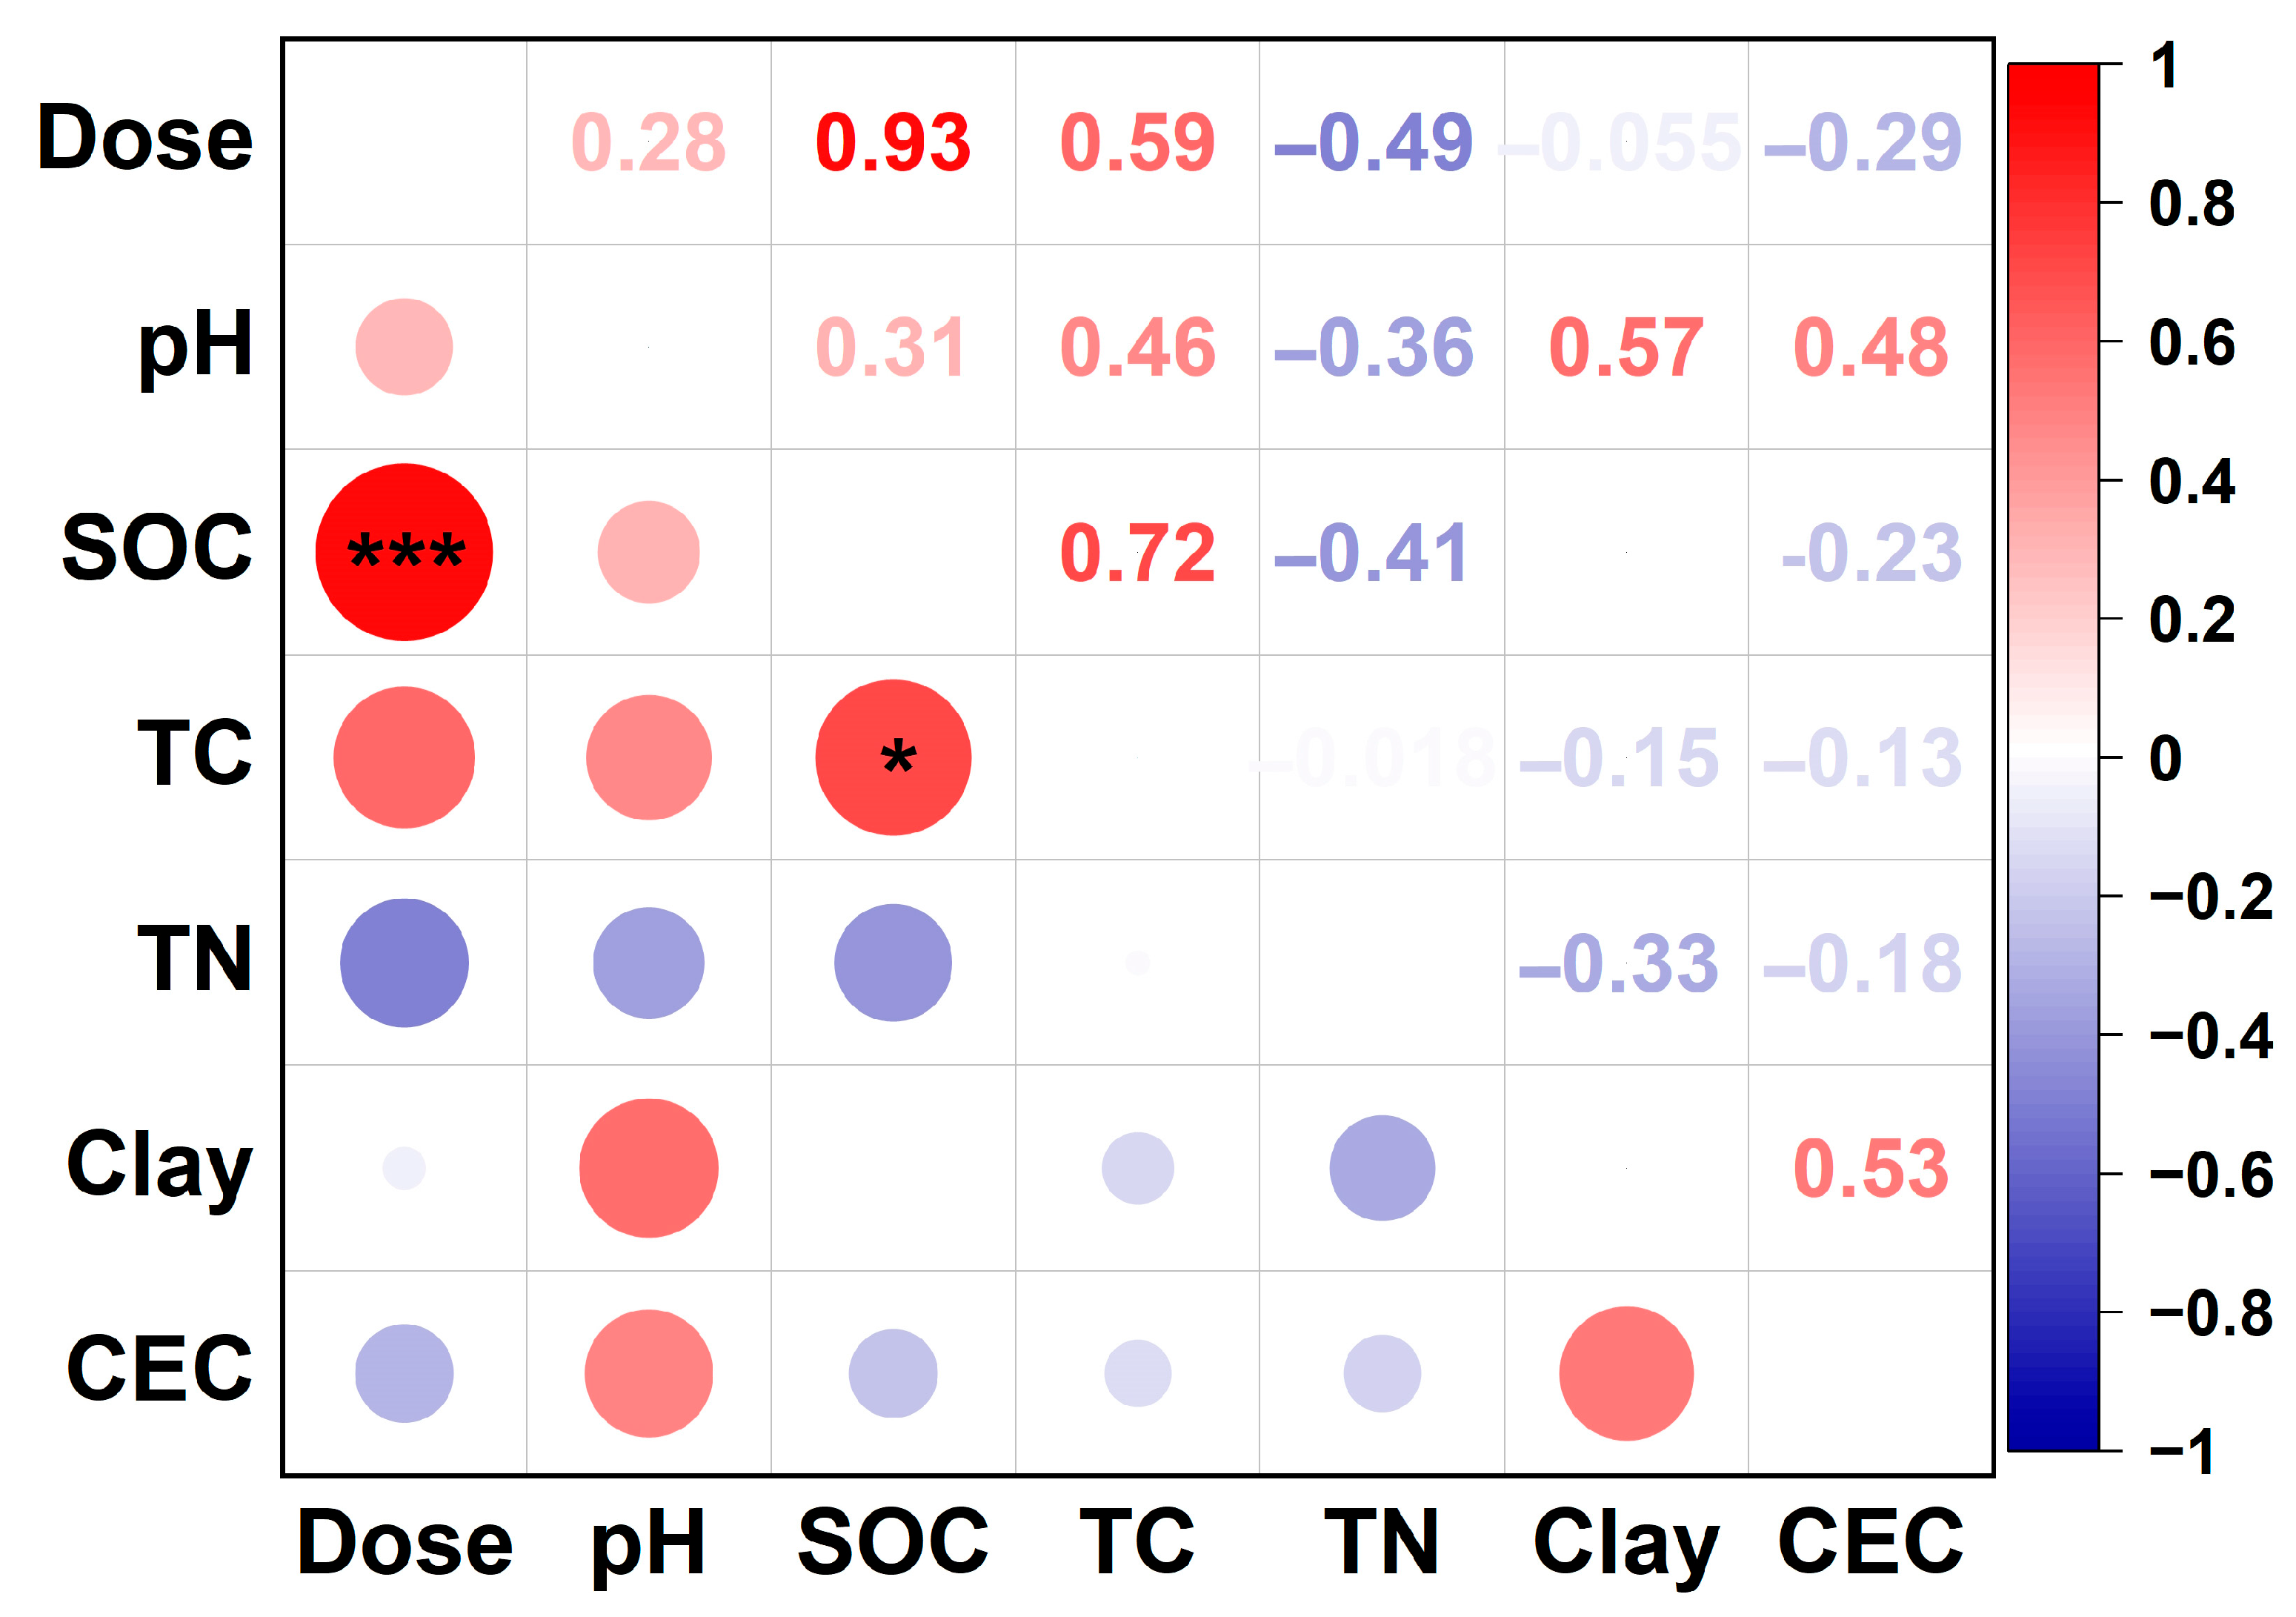
Soil carbon was evaluated using two independent methods. For the Walkley–Black method (SOC, Figure 2b), the control sample yielded a value of 4.49 ± 0.10%. With increasing plastic dose, measured SOC values showed an increasing tendency, reaching 4.81 ± 0.09% at the maximum dose (0.5%). The observed range was 4.44–4.84% (CV = 3.83%). A strong positive correlation (Figure 3) was identified between plastic dose and measured SOC values (r = 0.93). For the Dumas method (Figure 2c), total carbon (TC) content in the control was 3.56 ± 0.21%. In the plastic-amended treatments, values ranged from 3.40% to 3.91% (CV = 8.56%), with the maximum value observed at a dose of 0.4%. The correlation with plastic dose was moderately positive (r = 0.59). A consistent discrepancy was observed between the two carbon determination methods, with Walkley–Black values exceeding Dumas values by 0.7–0.9 percentage points across all experimental variants.
Figure 3.
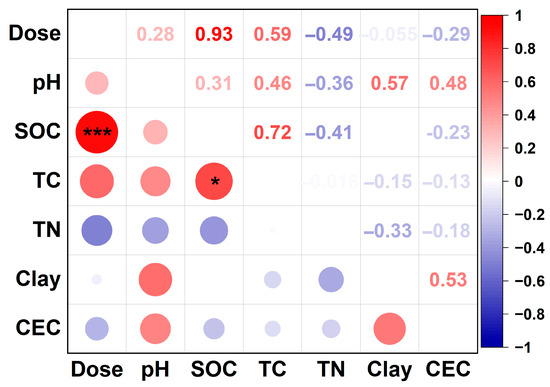
Correlation matrix (Spearman’s r) between measured soil parameters and PS nanoparticle dose. *** indicates p ≤ 0.001, * indicates p ≤ 0.05. Dose denotes the NPs of PS dose in the soil sample.
Total nitrogen (TN) content in the control sample was 0.23 ± 0.00%. In treatments with microplastic addition, the parameter fluctuated within the range of 0.23–0.28% (Figure 2d). The maximum value was recorded at a dose of 0.1%, and the minimum at 0.35%. The coefficient of variation reached 7.03%. A moderate negative correlation was identified between plastic dose and total nitrogen content (r = −0.49).
Clay content (<0.001 mm) in the control sample was 43.53 ± 4.31%. In experimental treatments, values ranged from 38.40 ± 3.31% to 43.33 ± 3.09%. The coefficient of variation was 4.30%. The correlation with plastic dose was statistically non-significant (r = −0.05), indicating no detectable systematic effect within the investigated dose range.
Cation exchange capacity (CEC) in the control sample was 34 cmolc kg−1. In experimental treatments, values fluctuated within the range of 32–36 cmolc kg−1. A weak negative trend was observed (r = −0.29); however, the amplitude of changes did not exceed 12% of the control value.
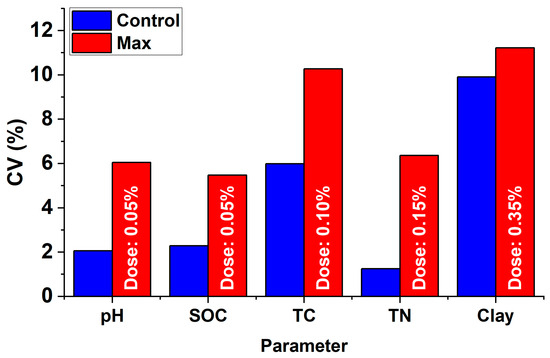
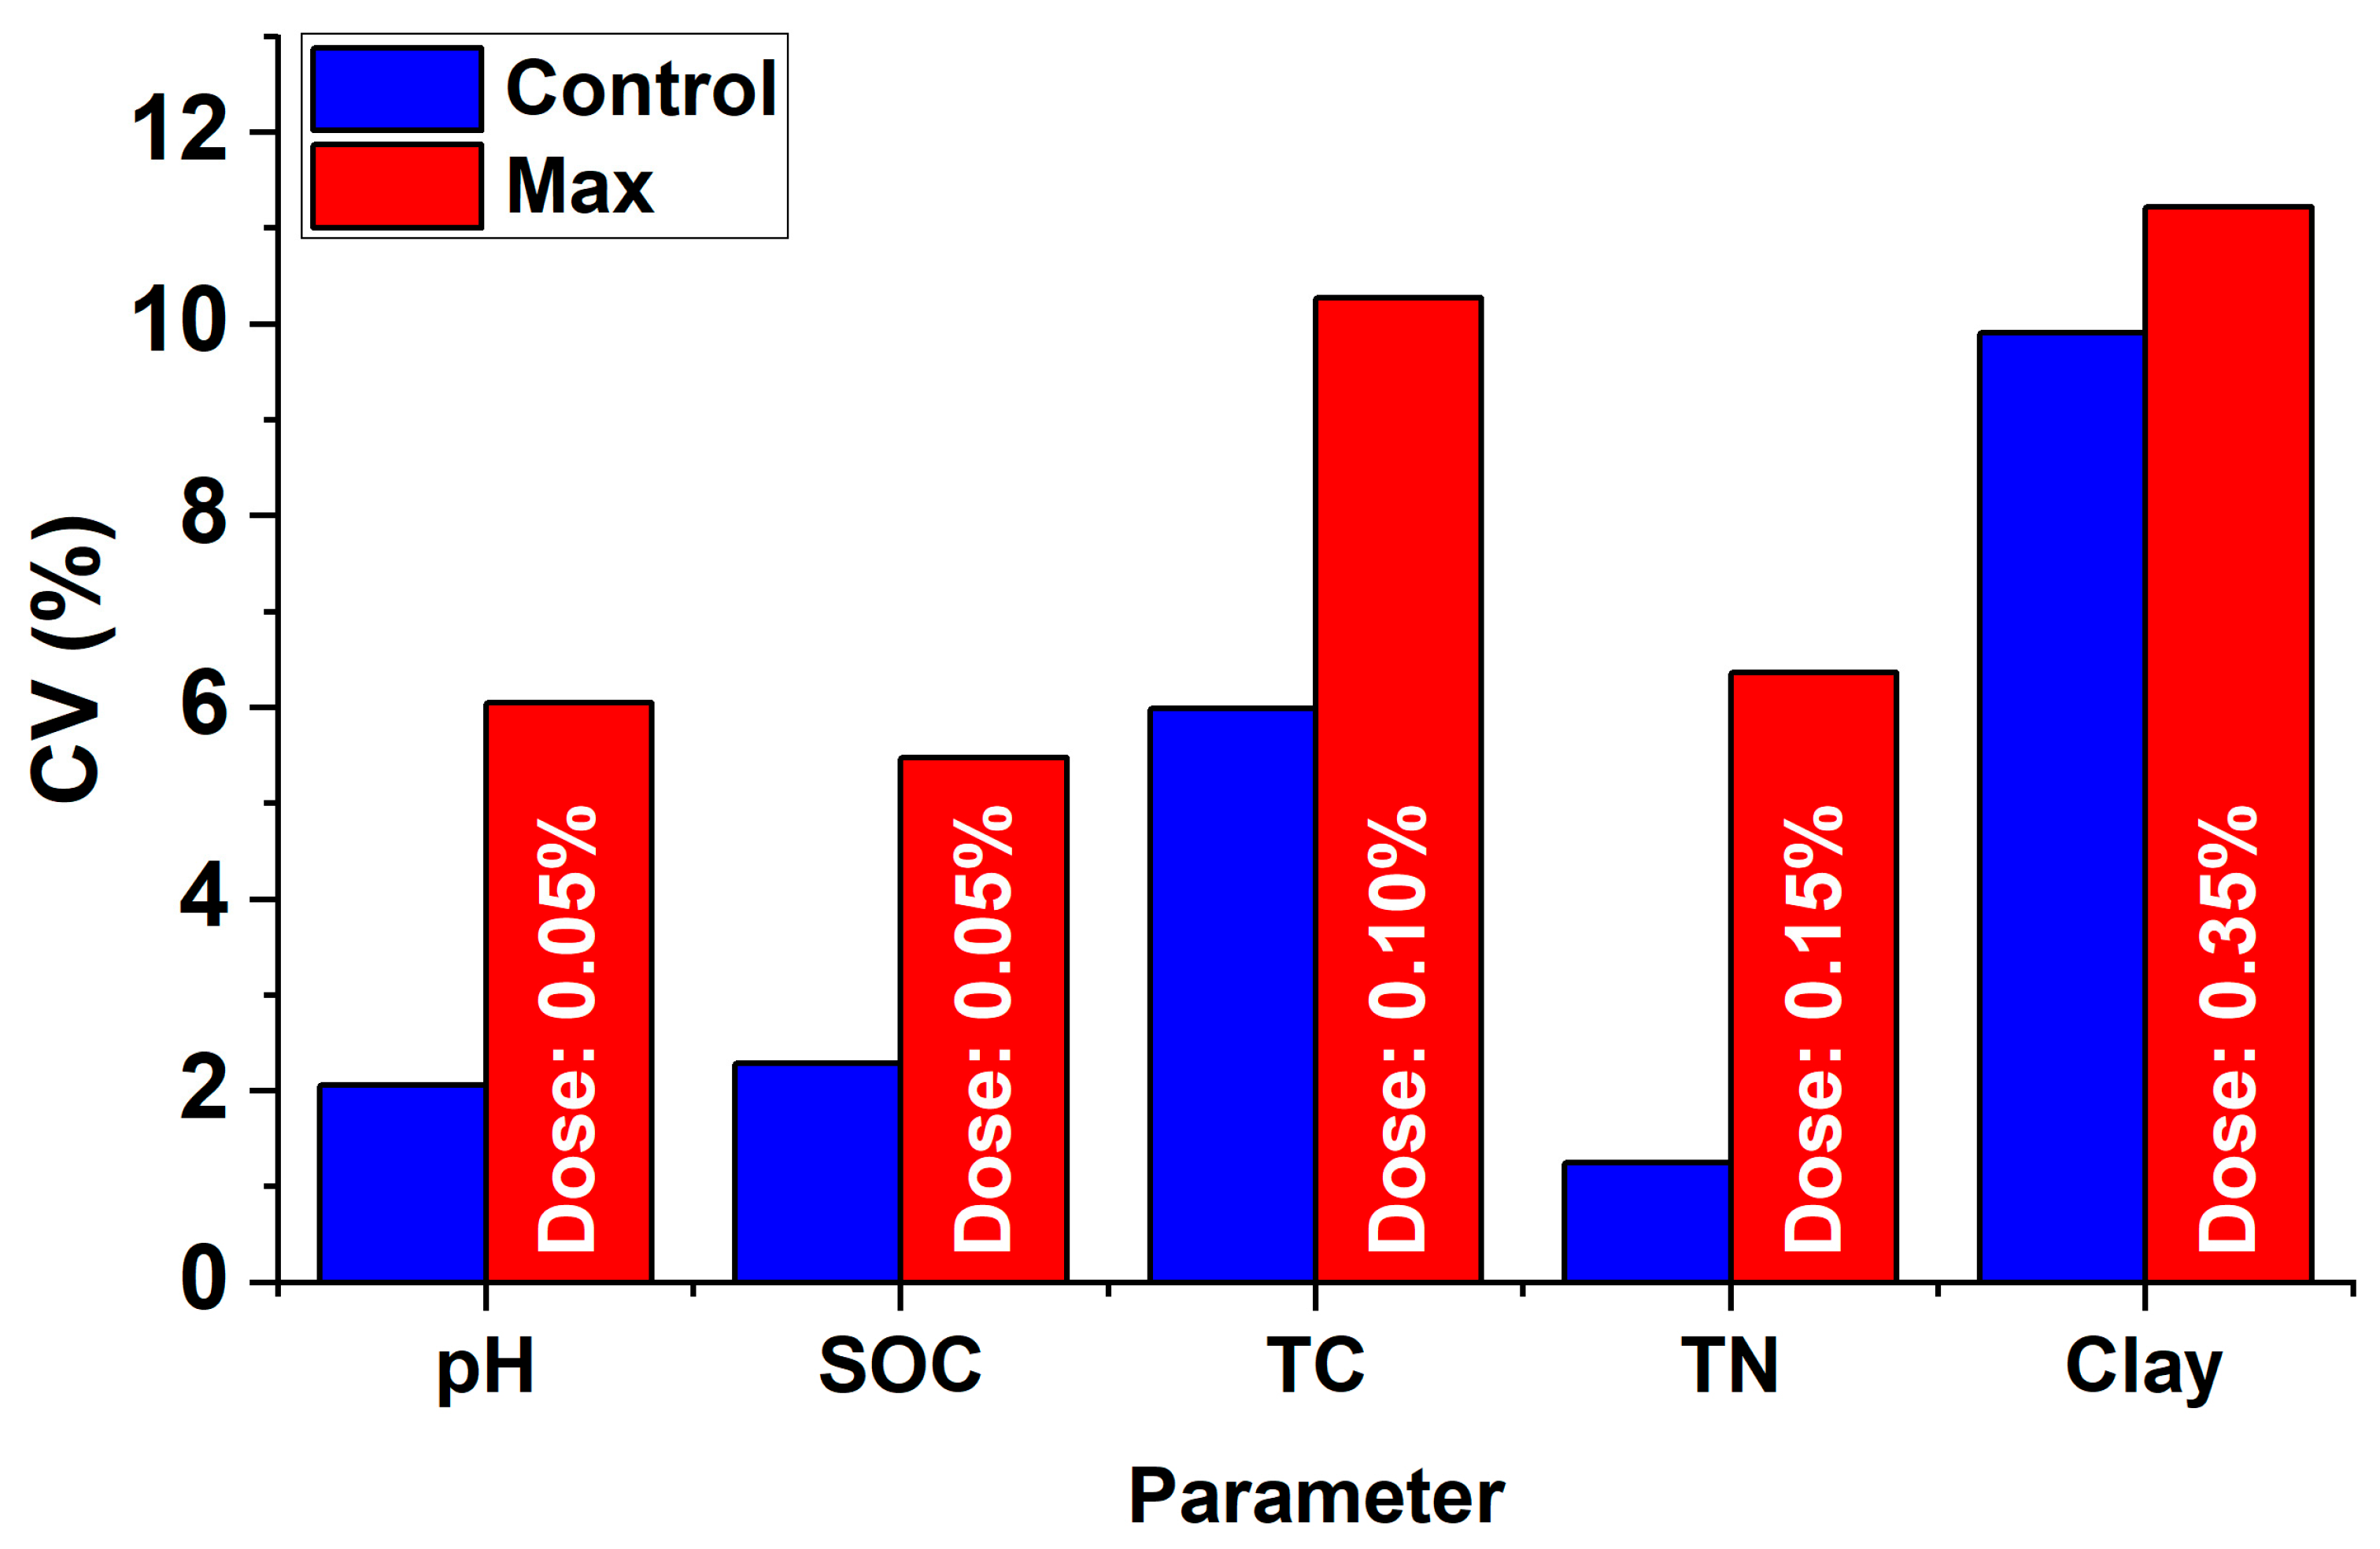
Analysis of coefficients of variation (CV) revealed (Figure 4) that, in certain cases, the presence of plastics increased the variability of replicate measurements. The most pronounced increase in CV was recorded for pH (maximum value of 6.05 at a dose of 0.05% versus 2.06 in the control) and SOC (maximum value of 5.47 at a dose of 0.05% versus 2.29 in the control).
Figure 4.
Changes in the coefficient of variation (CV, %) for measurements of various parameters in control and plastic-contaminated soil.
4. Discussion
4.1. Effect of PS Nanoparticles on Soil Carbon Determination Results by Different Methods
The data obtained during the model experiment demonstrate a significant dependence of soil carbon determination results on the selected analytical method in the presence of polystyrene latex contamination. The systematic discrepancy between the Walkley–Black method and the Dumas dry combustion method requires detailed consideration in light of the chemical principles underlying both methods and the specific characteristics of the contaminant used. The application of wet-oxidation methods (Tyurin or Walkley–Black methods) may lead to overestimation or underestimation of soil carbon content, not only due to the presence of external contaminants but also owing to varying degrees of intramolecular oxidation/reduction status of the original soil organic matter [25]. Recent work on polymer stress dynamics has demonstrated that environmental and chemical stressors can induce phase separation and structural reorganization in plastics, potentially increasing the release of polymer fragments and amorphous micropollutants [7]. Similar stress-induced alterations may enhance the accessibility of polystyrene matrices to aggressive oxidants during routine soil analysis, further contributing to measurement artifacts.
The Walkley–Black method is based on the oxidation of organic carbon by potassium dichromate (K2Cr2O7) in concentrated sulfuric acid at room temperature [20]. The classical protocol involves applying a correction factor of 1.3 to compensate for incomplete oxidation of soil organic matter, as this method typically recovers only approximately 77% of organic carbon on average [26,27]. However, the value of this factor exhibits high variability, as it depends on soil type and the nature of the organic matter [28,29]. In the presence of PS nanoparticles, a strong positive correlation was observed between contaminant dose and SOC content measured by the Walkley–Black method (r = 0.93) (Figure 2b), indicating a systematic influence of PS particles on measurement results. As the polystyrene dose increased from 0 to 0.5%, SOC content rose from 4.49% to 4.81% (+7.2%). The effect detected in our study is consistent with findings by Kim et al. [30], who demonstrated that polyethylene and polystyrene microparticles can affect the accuracy of SOC measurements when chemical oxidation methods are employed. The authors established that physicochemical treatment applied during SOC determination may cause the extraction of organic compounds and/or carbon complexes from microplastics, thereby influencing analytical outcomes [30]. When concentrated H2SO4 is mixed with water, the temperature of the reaction mixture reaches 120–150 °C, exceeding the Tg of polystyrene (~100 °C); consequently, particles soften, increasing the accessibility of the polymer matrix to the oxidizing agent. Furthermore, polystyrene latex produced by emulsion polymerization using potassium persulfate (K2S2O8) as an initiator may contain sulfate groups (-SO4) on the particle surface, which could additionally influence the oxidation process [31]. The extent to which this analytical bias is expressed may also depend on the nature of the soil matrix, including the composition of soil organic matter, the abundance of reactive mineral surfaces, and the extent of organo-mineral associations; however, the present experiment was not designed to isolate these factors. Given that polystyrene contains approximately 92.3% carbon, the theoretical carbon contribution from plastic particles at a 0.5% dose should amount to 0.46% C; however, the observed increase was only 0.32% (the difference between the control sample and the sample with 0.5% PS dose).
The observed rise in SOC values represents a methodological artifact rather than a genuine accumulation of native soil organic matter. The chemical oxidation system cannot distinguish between carbon originating from indigenous soil organic compounds and carbon derived from polystyrene degradation. While physical interactions between nanoplastics and soil minerals/organic matter (e.g., adsorption, aggregation) may occur [15], the dominant driver in this controlled setting is direct chemical oxidation of the polymer matrix. Consequently, the reported correlation reflects analytical bias introduced by the presence of exogenous carbon, not an actual enhancement of soil carbon pools. Thus, the introduction of polystyrene latex nanoparticles into soil may distort SOC concentration measurements; when comparing archival data with contemporary measurements, an artificial “increase” in SOC may represent an artifact of soil micro/nanoplastic contamination rather than actual accumulation of organic matter. The proposed mechanism (thermal softening of polystyrene above its glass transition temperature (Tg), facilitating dichromate oxidation) remains a theoretical inference based on reaction thermodynamics and polymer physics. Direct spectroscopic evidence (e.g., FTIR, XPS, or SEM comparisons pre- and post-oxidation) was beyond the scope of this model experiment. Dose-dependent SOC overestimation provides robust indirect evidence of polymer-derived carbon contribution; in situ verification of polystyrene degradation under these aggressive oxidative conditions would require dedicated method development beyond the scope of the present study. Future studies should employ surface analytical techniques to verify polymer backbone degradation and quantify oxidation kinetics under Walkley–Black conditions.
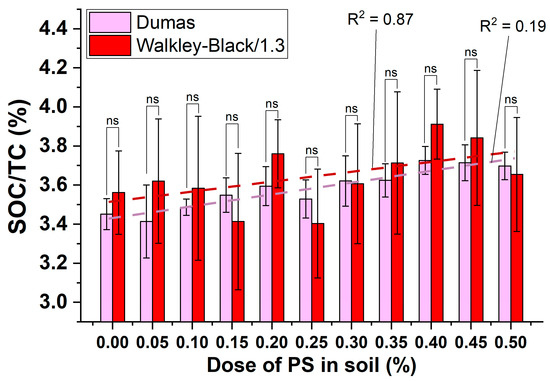
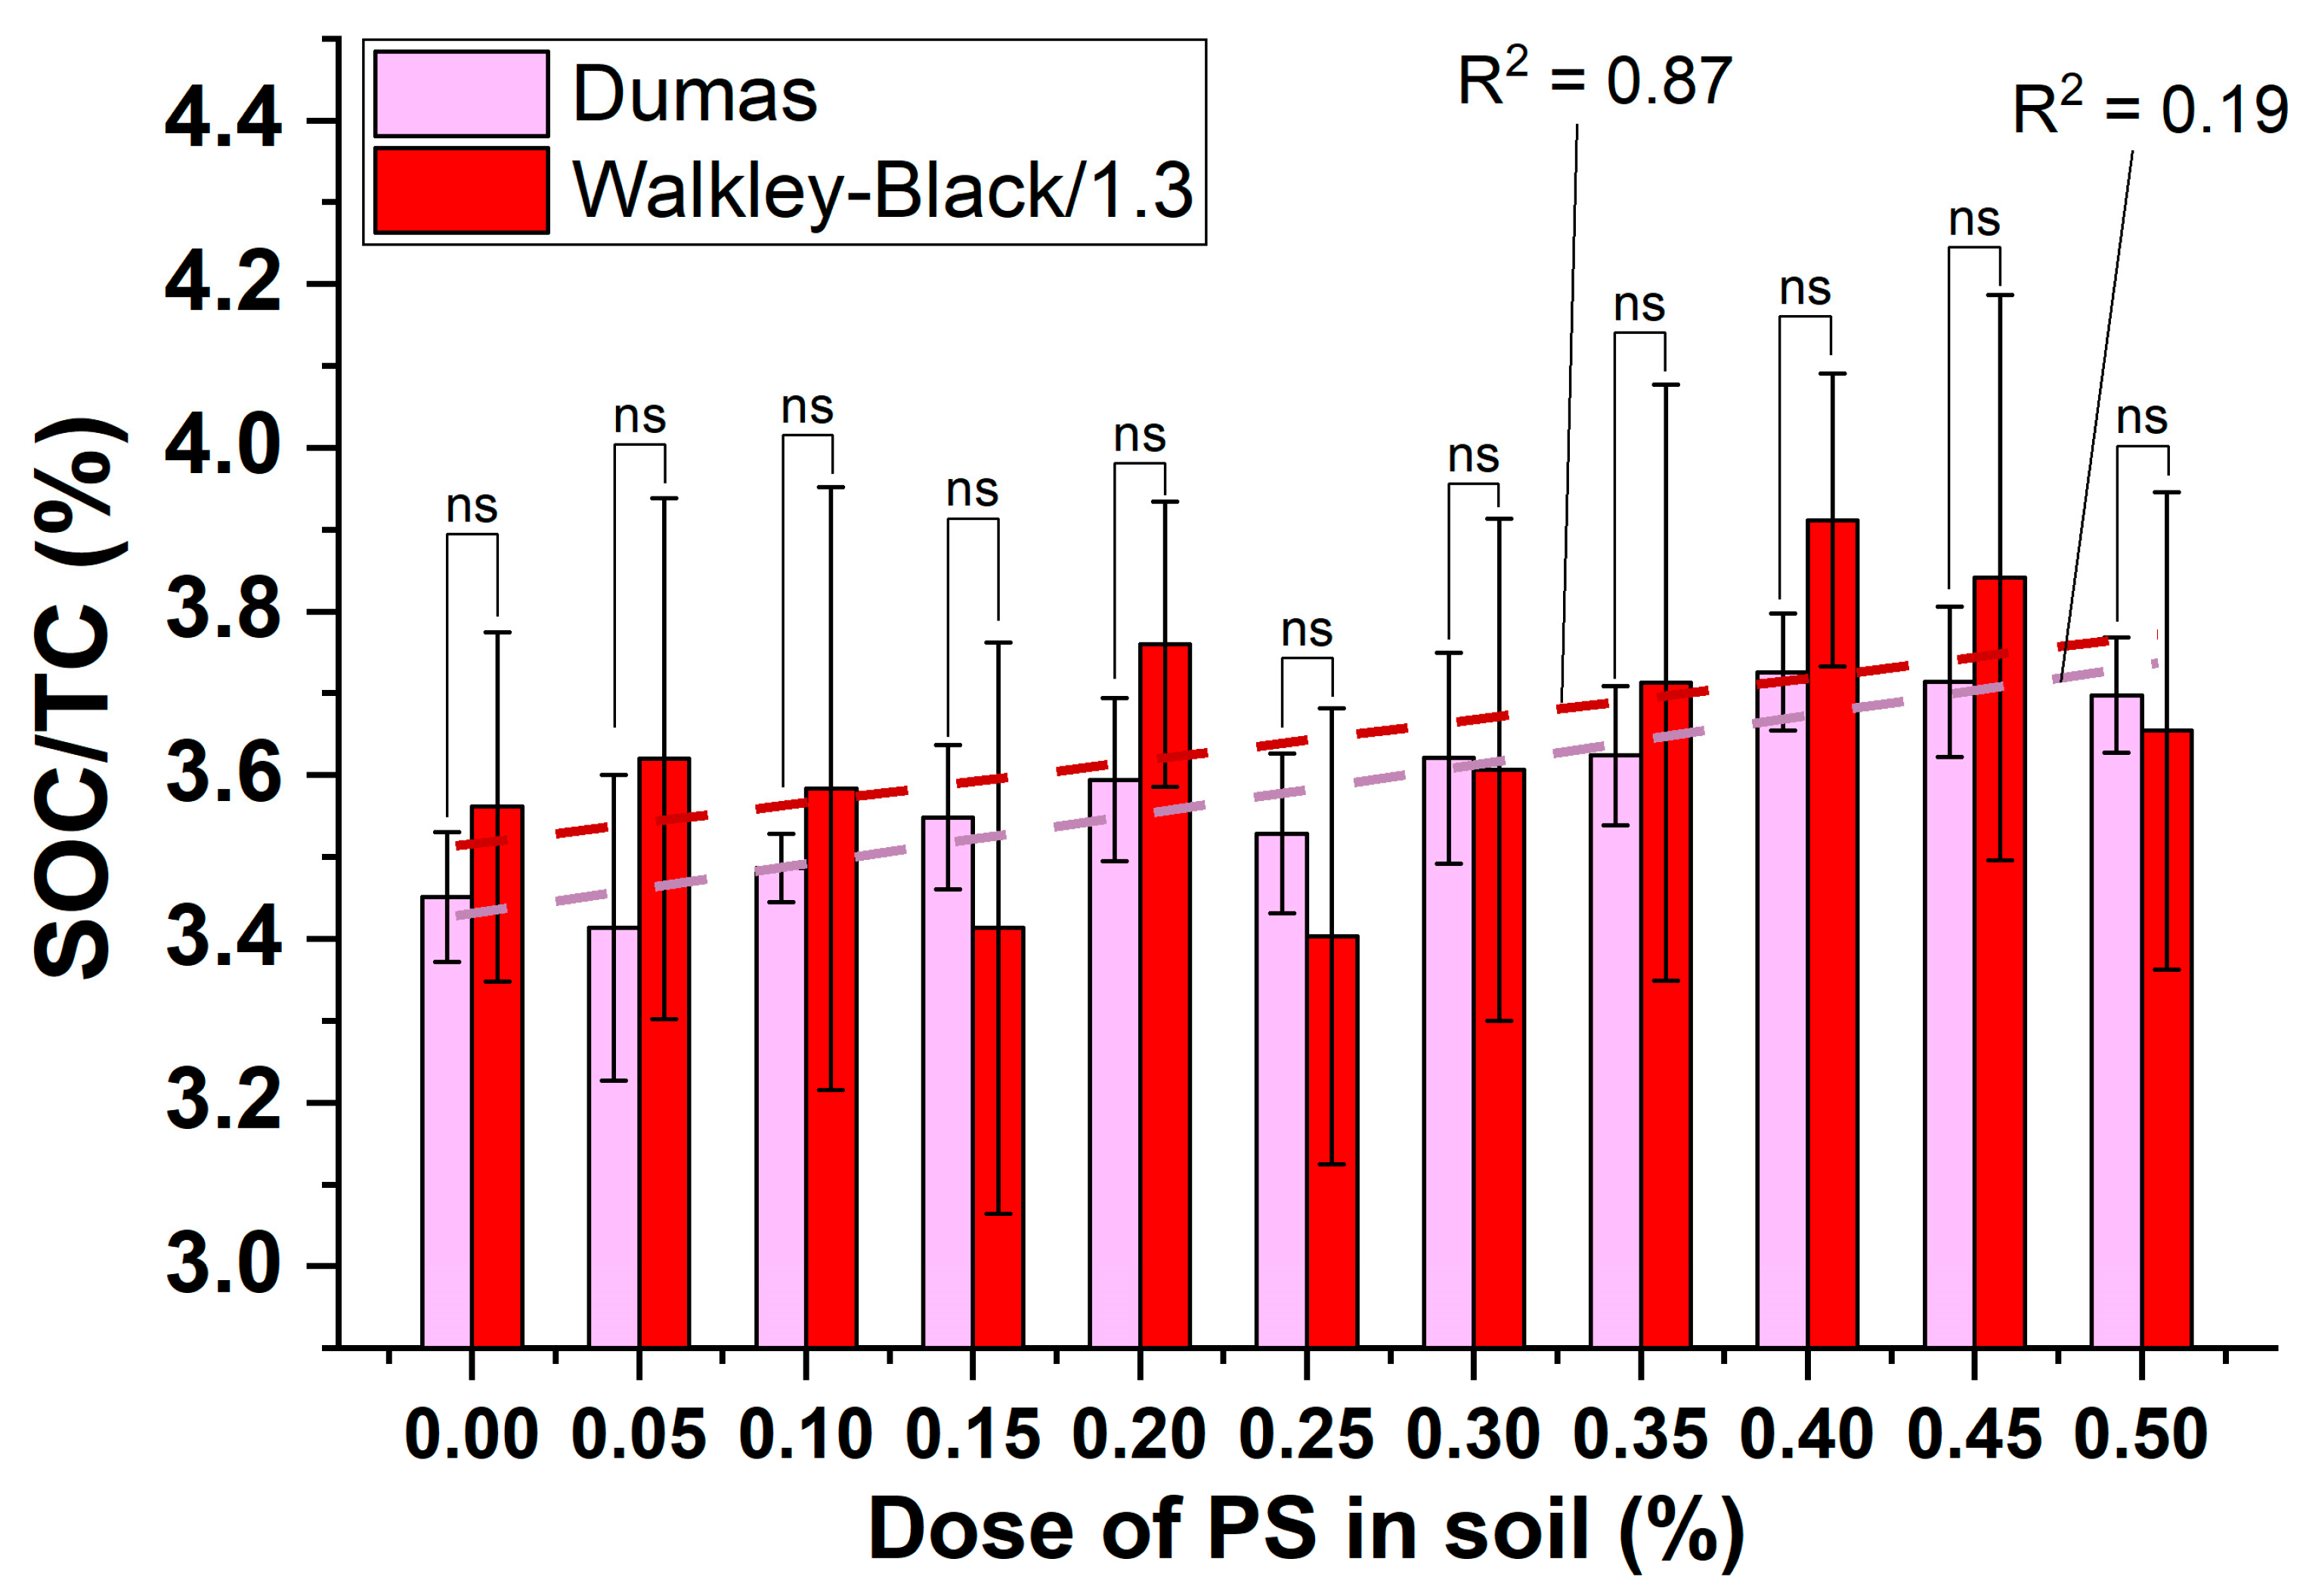
An important methodological aspect is the application of the correction factor of 1.3 for the Walkley–Black method [20,27]. Without applying this factor, the SOC measurement results obtained by the two methods become substantially closer (Figure 5). Thus, after correction, the discrepancy between methods decreases from 0.7 to 0.9 percentage points to 0.05–0.15 percentage points, which falls within the range of analytical uncertainty. However, in the presence of microplastics, applying the standard factor of 1.3 becomes problematic for several reasons: (1) Polystyrene is oxidized by dichromate with different efficiency compared to natural soil organic matter; (2) at a 0.5% polystyrene dose (with carbon content of approximately 92%), the theoretical contribution amounts to up to 0.46% C, of which ~70% is oxidized during analysis; (3) the factor of 1.3 is calibrated for soil organic matter, not for synthetic polymers, thereby challenging a core assumption of the method.
Figure 5.
Soil carbon measurement results by the Walkley–Black method (without applying the factor of 1.3) and by the Dumas dry combustion method using an elemental analyzer. ns—Non-significant differences in mean values according to post hoc Tukey HSD test (p < 0.05).
Kim et al. [30] established that when using a modified Walkley–Black method with additional external heating (200 °C), the increase in SOC in plastic-contaminated soils was more pronounced compared to the classical method. In our experiment, the classical protocol without additional heating was employed, which may explain the lesser degree of SOC increase compared to data reported by the Korean researchers, who observed SOC increases exceeding 40% in soils with low organic carbon content. The present results indicate that potential plastic-related analytical artifacts should be considered when interpreting oxidation-based SOC data from contaminated soils; however, any broader modification of GLOSOLAN/FAO procedures should be based on validation across multiple soil types, polymer classes, particle sizes, and aging states. Nevertheless, additional research and validation of measurements using other plastic types, as well as assessment of the influence of polymer particle “aging,” are necessary. For instance, Meng et al. [32], in a mesocosm experiment with low-density polyethylene (LDPE) and biodegradable microplastics, established that LDPE microparticles did not exert a significant effect on labile fractions of soil organic carbon, whereas biodegradable microplastics induced substantial changes. This underscores the importance of considering polymer type when assessing impacts on soil biochemical processes.
The Dumas method involves complete combustion of the sample at 900–1000 °C in an oxygen flow with detection of the resulting CO2 [21]. Theoretically, this method should account for all carbon in the sample, including carbon from polymeric contaminants. In the experiment, a moderate correlation was observed between polystyrene dose and measured TC (r = 0.59), and the increase in carbon content amounted to only +2.6% (from 3.56% to 3.65%). Although elemental analysis generally provides more accurate results compared to chemical oxidation methods, it typically requires very small soil sample aliquots (approximately 2–10 mg; in our case, the soil sample aliquot did not exceed 2 mg), which may increase variability in the presence of heterogeneously distributed microplastics [30]. In our experiment, the standard deviation of TC measured by the Dumas method in the control sample was 0.21%, which is twice as high as that for TC measured by the Walkley–Black method (0.10%), confirming the influence of heterogeneous distribution of polystyrene nanoparticles on result reproducibility.
4.2. Effect of PS Nanoparticles on TN Determination Results by the Kjeldahl Method
Pure polystyrene is a polymer with a repeating unit of C8H8 and does not contain nitrogen in its molecular structure. Consequently, direct nitrogen input from the polymer backbone can be excluded. However, according to Madaeni and Ghanbarian [31], polystyrene latex produced by emulsion polymerization using potassium persulfate (K2S2O8) as an initiator carries sulfate groups (-SO4) on its surface, which form as a result of initiator decomposition and chemical bonding with growing polymer chains. In the case of ammonium persulfate ((NH4)2S2O8) used as an initiator, trace amounts of nitrogen-containing compounds may be present on the particle surface [31]. However, at a polystyrene dose of 0.5% and with nitrogen content in impurities < 1%, the maximum theoretical contribution amounts to <0.005% N, which falls within the analytical uncertainty of the Kjeldahl method.
The Kjeldahl method involves mineralization of organic nitrogen to ammonium in concentrated sulfuric acid at elevated temperature, followed by distillation and titration [22]. In principle, the presence of polystyrene latex nanoparticles could influence this procedure through sample dilution or through physical interference with the digestion-distillation process, for example, by affecting reagent access to the soil matrix. However, based on the present data, no firm mechanistic conclusion can be drawn regarding the moderate negative correlation observed for TN. As with carbon determination, the response may depend on polymer type, particle properties, and the soil matrix. Moreover, other studies have demonstrated that biodegradable microplastics significantly reduced available nitrogen content in soil and altered the N-NO3−/N-NH4+ ratio [32]. Therefore, further research with other polymer types remains warranted.
4.3. Effect of PS Nanoparticles on pH and CEC Measurement Results
The pH values varied within the range of 4.68 ± 0.05 to 5.69 ± 0.04 units, compared to a control value of 5.50 ± 0.11 units (Figure 2a). The correlation between contaminant dose and acidity was weak (r = 0.18) (Figure 3); however, pronounced non-linearity was observed, with extrema at doses of 0.25% (minimum) and 0.35% (maximum). Furthermore, increased variability was recorded at low contamination doses. Published studies have reported contrasting pH responses to microplastic addition. According to Medynska-Juraszek and Jadhav [33], the presence of microplastics in soil contributes to increased pH. In their study, various forms of microplastics (fibers, fragments, spheres) increased soil pH by 2.85–14.25%, depending on polymer type. Similar results were obtained by Zhao et al. [17], who established that microplastics significantly increased soil pH, with effects dependent on both polymer type and incubation time. In addition, microplastics can alter the soil microbiome, which can indirectly alter pH values [34]. Seo et al. [35] determined that the surface of polyethylene microparticles has an isoelectric point near pH 3.2; at pH values above this threshold, particles acquire a negative charge capable of adsorbing cations. Additionally, microplastics likely influence soil acid-base balance through alterations in colloidal properties and the dissociation capacity of humic organic molecules. Part of this effect may be attributed to the blocking of proton-donor sites, while another portion may relate to reduced activity of soluble carbonates. This could explain the observed pH increase at intermediate experimental stages. Importantly, the recorded pH variability (up to one unit) has substantial practical implications for agrochemical monitoring. According to soil acidity classification systems, a pH change of 0.5–1.0 units may shift soil from one category to another (e.g., from slightly acidic to moderately acidic), thereby influencing liming recommendations and assessments of micronutrient availability.
Results of cation exchange capacity (CEC) determination in soil samples contaminated with polystyrene latex nanoparticles demonstrated relative stability of this parameter in response to contaminant exposure. CEC values fluctuated within the range of 32–36 cmolc kg−1, compared to a control value of 34 cmolc kg−1 (±12%). Correlation analysis revealed a weak negative relationship between polystyrene dose and CEC (r = −0.23), indicating a tendency toward decreasing values with increasing contamination levels. Pure polystyrene does not possess a high cation exchange capacity; however, latex particles bearing surface-charged groups may contribute marginally to the total CEC of the sample. According to Madaeni and Ghanbarian [31], the surface charge density of polystyrene latex varies within a relatively narrow range (1.14–4.96 × 10⁻⁷ C cm−2) across particles of different sizes, indicating limited cation exchange capability. It is important to note that, in our study, model particles were spherical; however, the emergence of surface roughness and cracks may alter the influence of contamination on CEC. Seo et al. [35] note that rough, uneven surfaces of plastic microparticles, featuring cracks and variable topography, likely retain cations and physically block access to cation exchange sites in soil.
4.4. Effect of PS Nanoparticles on the Determination of Clay Fraction (<0.001 mm) in Particle-Size Distribution
Clay content (<0.001 mm) varied within the range of 38.40 ± 3.31% to 43.53 ± 4.31% across experimental treatments, with a control value of 43.53 ± 4.31%. The polystyrene latex nanoparticles added to the soil, with a particle size of 0.05 µm (50 nm), formally fall within the clay fraction range. According to USDA and WRB classification systems, the clay fraction includes particles with a diameter smaller than 2 µm, whereas the Russian classification system defines it as particles smaller than 1 µm [36,37,38]. Thus, theoretically, polystyrene nanoparticles should be accounted for when determining clay content by the sedimentation method. However, a key factor governing sedimentation rate is not only particle size but also particle density [39]. The density of polystyrene ranges from 1.04 to 1.06 g cm−3 [40], whereas the density of clay minerals (kaolinite, montmorillonite, illite) varies between 2.60 and 2.80 g cm−3 [41]. This density difference implies that, for particles of identical size, polystyrene particles would settle approximately 2.5 times more slowly than mineral soil particles. In standard sedimentation analysis with a fixed sampling time, this means that a significant portion of polystyrene nanoparticles may remain suspended at the moment of sample collection for clay fraction determination or float to the suspension surface due to their density being close to that of water. A plausible scenario involves charged polymer nanoparticles adsorbing onto mineral particles, thereby altering their effective density and settling velocity [8]. However, this effect would be mitigated by the pre-dispersion of aggregates using a 4% sodium pyrophosphate (Na4P2O7) solution. Nevertheless, soil contamination with micro- and nanoparticles of higher-density plastics—such as PLA plastic (1.23–1.25 g cm−3), polyvinyl chloride (1.30–1.50 g cm−3), polyethylene terephthalate (1.38–1.40 g cm−3), and others may influence particle-size distribution measurements by sedimentation, though this requires further investigation. In our study, the influence of PS nanoparticles on measurement results was negligible, and the observed variability in measurements was attributable to the inherent specificity of the analytical method.
4.5. Soil Matrix Effects and Spatial Generalizability
While the Walkley–Black overestimation mechanism is fundamentally driven by the chemical oxidation of polystyrene carbon process governed by reaction thermodynamics and polymer accessibility rather than soil matrix properties, the absolute magnitude of analytical bias may be modulated by intrinsic soil characteristics [30]. Luvic Chernozems are characterized by high native soil organic carbon (SOC) content, substantial clay fractions, and strong buffering capacity. In such soils, the relative contribution of plastic-derived carbon to total measured SOC may be partially diluted compared to low-SOC or sandy soils (e.g., Podzols, Arenosols), where the same polymer dose could yield proportionally higher overestimation errors. Furthermore, variations in clay mineralogy (e.g., kaolinite or smectite-dominant assemblages) and surface charge density influence nanoplastic aggregation, dispersion, and electrostatic interactions with soil colloids [35]. These matrix-specific behaviors may alter polymer accessibility to dichromate during wet oxidation, potentially amplifying or attenuating the observed analytical bias [28,30]. The meta-analysis by Iqbal et al. [15] shows that microplastic-induced SOC apparent increases are modulated by baseline carbon content. Consequently, while the direction of interference is mechanistically plausible across soils where polystyrene can be partially oxidized under Walkley–Black conditions, the magnitude of bias will depend on native SOC content, clay mineralogy, and buffering capacity. Kim et al. [30] tested polyethylene and polystyrene in soils with low SOC content and found >40% SOC overestimation—contrasting with the 7.2% increase observed here, directly attributable to dilution by high native SOC. For example, in low-SOC Arenosols (theoretical natural SOC = 0.5%), the same PS dose would produce a relative overestimation of 65% versus 7% in the Chernozem (natural SOC = 4.5%). Future inter-laboratory studies should systematically evaluate interference thresholds across contrasting soil types to develop matrix-specific correction factors or standardized analytical warnings.
The model experiment was conducted using a single composite soil sample from the Tambov Region (Russia), which inherently limits the spatial extrapolation of the findings. Soil physicochemical properties and the environmental behavior of nanoplastics are strongly influenced by geographic location, climatic regimes, and long-term pedogenic processes [42,43]. Soils from arid, tropical or high-latitude regions exhibit distinct organic matter composition, mineral weathering states, and microbial communities, all of which may interact differently with plastic contaminants during routine laboratory analyses [44,45]. Additionally, regional variations in UV exposure, freeze–thaw cycles, precipitation patterns, and agricultural management influence the degree of plastic weathering and surface oxidation prior to analysis, potentially altering polymer reactivity in wet-oxidation systems [46,47,48,49]. While the fundamental chemical interference observed here is intrinsic to the Walkley–Black protocol and polystyrene chemistry, the practical significance of this bias, particularly in terms of misclassifying soil fertility status or tracking long-term carbon trends, may vary across climatic zones. Multi-regional validation campaigns, incorporating soils from diverse pedoclimatic backgrounds, are therefore essential to quantify how geographic and climatic gradients modulate analytical uncertainties. Such efforts will ensure that global soil monitoring networks maintain data comparability and that historical baseline records remain interpretable in the context of expanding microplastic contamination.
5. Conclusions
This model experiment demonstrates that polystyrene nanoparticle contamination can systematically bias routine soil analytical results obtained under standard operating procedures. The most pronounced effect was observed for the Walkley–Black method, where measured SOC values increased linearly with PS dose (r = 0.94). This trend reflects an analytical artifact driven by dichromate oxidation of polymer-derived carbon, likely facilitated by exothermic heating above the glass transition temperature of polystyrene. In the Luvic Chernozem studied here, and potentially in other high-SOC agricultural soils, such an artifact, when archival data are compared with contemporary measurements, such an artifact could be misinterpreted as an improvement in soil quality. Application of the standard 1.3 correction factor is inappropriate in plastic-contaminated matrices, as it was calibrated for natural organic matter and may amplify overestimation. The Dumas dry combustion method proved more resistant to systematic bias but exhibited higher replicate variability due to small sample aliquots (<2 mg) and heterogeneous nanoparticle distribution. pH measurements showed dose-independent non-linearity and elevated variability at low contamination levels, which may shift soils across agrochemical classification thresholds and alter liming or micronutrient recommendations. Total nitrogen displayed a moderate negative correlation with PS dose, likely attributable to sample dilution by inert polymer mass, while CEC and clay fraction remained statistically stable within the tested range. The absence of a detectable effect on particle-size distribution is explained by the low density of polystyrene (1.04–1.06 g cm−3), which prevents its sedimentation within the clay fraction under standard protocols; however, higher-density polymers (PVC, PET) may behave differently.
Because this study was conducted on a single composite Luvic Chernozem sample and one polymer type, the results should be interpreted as a controlled demonstration of analytical vulnerability rather than a universally quantified bias. Laboratories analyzing potentially plastic-contaminated soils should exercise caution when interpreting oxidation-based SOC data, consider increasing sample aliquot sizes for elemental analysis, and report plastic contamination status alongside routine metrics. Broader revision of standard operating procedures should be contingent upon multi-soil, multi-polymer validation campaigns that account for particle size, weathering state, and pedoclimatic context. Future work should prioritize the development of matrix-specific correction factors, spectroscopic verification of polymer degradation during wet oxidation, and inter-laboratory proficiency testing to safeguard the integrity of long-term soil monitoring datasets.
Author Contributions
Conceptualization, T.N. and E.A.; methodology, T.N.; software, I.K.; validation, I.K., A.V. and E.A.; formal analysis, T.N.; investigation, T.N. and I.K.; resources, E.A.; data curation, I.K.; writing—original draft preparation, T.N. and I.K.; writing—review and editing, E.A. and A.V.; visualization, T.N.; supervision, E.A.; project administration, E.A.; funding acquisition, E.A. All authors have read and agreed to the published version of the manuscript.
Funding
This work was supported by a MegaGrant “New approaches to solving the problem of microplastics as a potential threat to humans and the environment” under Agreement No. 075-15-2025-016 dated 28 February 2025.
Institutional Review Board Statement
Not applicable.
Informed Consent Statement
Not applicable.
Data Availability Statement
The data can be obtained upon special request to the corresponding author.
Acknowledgments
Authors thank the staff of the Saint Petersburg State University Research Park particularly “Chemical Analysis and Materials Research Centre” for elemental analysis of soil and Vyacheslav Polyakov for providing soil samples.
Conflicts of Interest
The authors declare no conflicts of interest.
References
- Thompson, R.C.; Olsen, Y.; Mitchell, R.P.; Davis, A.; Rowland, S.J.; John, A.W.G.; McGonigle, D.; Russell, A.E. Lost at sea: Where is all the plastic? Science 2004, 304, 838. [Google Scholar] [CrossRef]
- Allison, N.L. Understanding the Source and Distribution of Marine Macro-Plastics in Coastal Environments. Master’s Thesis, University of the Highlands and Islands, Inverness, UK, 2023. [Google Scholar]
- Agathokleous, E.; Calabrese, E.J.; Barceló, D. Environmental hormesis: New developments. Sci. Total Environ. 2024, 906, 167450. [Google Scholar] [CrossRef]
- Koelmans, A.A.; Redondo-Hasselerharm, P.E.; Nor, N.H.M.; de Ruijter, V.N.; Mintenig, S.M.; Kooi, M. Risk assessment of microplastic particles. Nat. Rev. Mater. 2022, 7, 138–152. [Google Scholar] [CrossRef]
- do Sul, J.A.I.; Costa, M.F. The present and future of microplastic pollution in the marine environment. Environ. Pollut. 2014, 185, 352–364. [Google Scholar] [CrossRef] [PubMed]
- Ren, S.-Y.; Kong, S.-F.; Ni, H.-G. Contribution of mulch film to microplastics in agricultural soil and surface water in China. Environ. Pollut. 2021, 291, 118227. [Google Scholar] [CrossRef] [PubMed]
- Li, D.; Li, P.; Shi, Y.; Sheerin, E.D.; Zhang, Z.; Yang, L.; Xiao, L.; Hill, C.; Gordon, C.; Ruether, M.; et al. Stress-induced phase separation in plastics drives the release of amorphous polymer micropollutants into water. Nat. Commun. 2025, 16, 3814. [Google Scholar] [CrossRef]
- de Souza Machado, A.A.; Lau, C.W.; Till, J.; Kloas, W.; Lehmann, A.; Becker, R.; Rillig, M.C. Impacts of microplastics on the soil biophysical environment. Environ. Sci. Technol. 2018, 52, 9656–9665. [Google Scholar] [CrossRef]
- Dike, S.; Apte, S.D. Impact of microplastics on strength parameters of clayey, sandy, silty soil: A comparative assessment. Sci. Total Environ. 2024, 946, 174161. [Google Scholar] [CrossRef]
- Guo, Z.; Li, P.; Yang, X.; Wang, Z.; Lu, B.; Chen, W.; Wu, Y.; Li, G.; Zhao, Z.; Liu, G.; et al. Soil texture is an important factor determining how microplastics affect soil hydraulic characteristics. Environ. Int. 2022, 165, 107293. [Google Scholar] [CrossRef]
- Khaledian, Y.; Brevik, E.C.; Pereira, P.; Cerdà, A.; Fattah, M.A.; Tazikeh, H. Modeling soil cation exchange capacity in multiple countries. CATENA 2017, 158, 194–200. [Google Scholar] [CrossRef]
- Wen, X.; Yin, L.; Zhou, Z.; Kang, Z.; Sun, Q.; Zhang, Y.; Long, Y.; Nie, X.; Wu, Z.; Jiang, C. Microplastics can affect soil properties and chemical speciation of metals in yellow-brown soil. Ecotoxicol. Environ. Saf. 2022, 243, 113958. [Google Scholar] [CrossRef]
- Ma, J.; Xu, M.; Wu, J.; Yang, G.; Zhang, X.; Song, C.; Long, L.; Chen, C.; Xu, C.; Wang, Y. Effects of variable-sized polyethylene microplastics on soil chemical properties and functions and microbial communities in purple soil. Sci. Total Environ. 2023, 868, 161642. [Google Scholar] [CrossRef]
- Wang, F.; Wang, X.; Song, N. Polyethylene microplastics increase cadmium uptake in lettuce (Lactuca sativa L.) by altering the soil microenvironment. Sci. Total Environ. 2021, 784, 147133. [Google Scholar] [CrossRef] [PubMed]
- Iqbal, S.; Xu, J.; Arif, M.S.; Worthy, F.R.; Jones, D.L.; Khan, S.; Alharbi, S.A.; Filimonenko, E.; Nadir, S.; Bu, D.; et al. Do added microplastics, native soil properties, and prevailing climatic conditions have consequences for carbon and nitrogen contents in soil? A global data synthesis of pot and greenhouse studies. Environ. Sci. Technol. 2024, 58, 8464–8479. [Google Scholar] [CrossRef]
- Zhao, S.; Rillig, M.C.; Bing, H.; Cui, Q.; Qiu, T.; Cui, Y.; Penuelas, J.; Liu, B.; Bian, S.; Monikh, F.A.; et al. Microplastic pollution promotes soil respiration: A global-scale meta-analysis. Glob. Change Biol. 2024, 30, e17415. [Google Scholar] [CrossRef] [PubMed]
- Zhao, T.; Lozano, Y.M.; Rillig, M.C. Microplastics increase soil pH and decrease microbial activities as a function of microplastic shape, polymer type, and exposure time. Front. Environ. Sci. 2021, 9, 675803. [Google Scholar] [CrossRef]
- Boots, B.; Russell, C.W.; Green, D.S. Effects of microplastics in soil ecosystems: Above and below ground. Environ. Sci. Technol. 2019, 53, 11496–11506. [Google Scholar] [CrossRef]
- FAO. Standard Operating Procedure for Soil pH Determination; FAO: Rome, Italy, 2021. [Google Scholar]
- FAO. Standard Operating Procedure for Soil Organic Carbon: Walkley-Black Method—Titration and Colorimetric Method; FAO: Rome, Italy, 2019. [Google Scholar]
- FAO. Standard Operating Procedure for Soil Total Carbon: Dumas Dry Combustion Method; FAO: Rome, Italy, 2019. [Google Scholar]
- FAO. Standard Operating Procedure for Soil Nitrogen—Kjeldahl Method; FAO: Rome, Italy, 2021. [Google Scholar]
- FAO. Standard Operating Procedure for Cation Exchange Capacity and Exchangeable Bases: 1 N Ammonium Acetate, pH 7.0 Method; FAO: Rome, Italy, 2022. [Google Scholar]
- ISO 11277:2020; Soil Quality—Determination of Particle Size Distribution in Mineral Soil Material—Method by Sieving and Sedimentation. International Organization for Standardization: Geneva, Switzerland, 2020.
- Abakumov, E.V.; Popov, A.I. Determination of the carbon and nitrogen contents and oxidizability of organic matter and the carbon of carbonates content in one soil sample. Eurasian Soil Sci. 2005, 38, 165–172. [Google Scholar]
- Nelson, D.W.; Sommers, L.E. Total carbon, organic carbon, and organic matter. In Methods of Soil Analysis: Part 3—Chemical Methods; Sparks, D.L., Page, A.L., Helmke, P.A., Loeppert, R.H., Soltanpour, P.N., Tabatabai, M.A., Johnston, C.T., Sumner, M.E., Eds.; SSSA: Madison, WI, USA, 1996; Volume 5, pp. 961–1010. [Google Scholar]
- Shamrikova, E.V.; Kondratenok, B.M.; Tumanova, E.A.; Vanchikova, E.V.; Lapteva, E.M.; Zonova, T.V.; Suvannang, N. Transferability between soil organic matter measurement methods for database harmonization. Geoderma 2022, 412, 115547. [Google Scholar] [CrossRef]
- De Vos, B.; Lettens, S.; Muys, B.; Deckers, J.A. Walkley-Black analysis of forest soil organic carbon: Recovery, limitations and uncertainty. Soil Use Manag. 2007, 23, 221–229. [Google Scholar] [CrossRef]
- Lettens, S.; De Vos, B.; Quataert, P.; Van Wesemael, B.; Muys, B.; Van Orshoven, J. Variable carbon recovery of Walkley-Black analysis and implications for national soil organic carbon accounting. Eur. J. Soil Sci. 2007, 58, 1244–1254. [Google Scholar] [CrossRef]
- Kim, S.W.; Jeong, S.-W.; An, Y.-J. Microplastics disrupt accurate soil organic carbon measurement based on chemical oxidation method. Chemosphere 2021, 276, 130178. [Google Scholar] [CrossRef]
- Madaeni, S.S.; Ghanbarian, M. Characterization of polystyrene latexes. Polym. Int. 2000, 49, 1356–1364. [Google Scholar] [CrossRef]
- Meng, F.; Yang, X.; Riksen, M.; Geissen, V. Effect of different polymers of microplastics on soil organic carbon and nitrogen—A mesocosm experiment. Environ. Res. 2022, 204, 111938. [Google Scholar] [CrossRef]
- Medyńska-Juraszek, A.; Jadhav, B. Influence of different microplastic forms on pH and mobility of Cu2+ and Pb2+ in soil. Molecules 2022, 27, 1744. [Google Scholar] [CrossRef]
- Sun, Y.; Duan, C.; Cao, N.; Li, X.; Li, X.; Chen, Y.; Huang, Y.; Wang, J. Effects of microplastics on soil microbiome: The impacts of polymer type, shape, and concentration. Sci. Total Environ. 2022, 806, 150516. [Google Scholar] [CrossRef] [PubMed]
- Seo, Y.; Lai, Y.; Chen, G.; Dearnaley, J.; Li, L.; Song, P. Size and concentration-dependent effects of polyethylene microplastics on soil chemistry in a microcosm study. J. Hazard. Mater. 2025, 497, 139668. [Google Scholar] [CrossRef] [PubMed]
- Soil Survey Staff. Soil Taxonomy: A Basic System of Soil Classification for Making and Interpreting Soil Surveys, 2nd ed.; U.S. Department of Agriculture, Natural Resources Conservation Service: Washington, DC, USA, 1999; Agriculture Handbook No. 436.
- IUSS Working Group WRB. World Reference Base for Soil Resources: International Soil Classification System for Naming Soils and Creating Legends for Soil Maps, 4th ed.; International Union of Soil Sciences (IUSS): Vienna, Austria, 2022. [Google Scholar]
- Shishov, L.L.; Tikhonova, E.I.; Tonkonogov, V.D.; Lebedeva, I.I. Classification and Diagnostic System of Russian Soils; Oikumena: Smolensk, Russia, 2004. [Google Scholar]
- Taubner, H.; Roth, B.; Tippkötter, R. Determination of soil texture: Comparison of the sedimentation method and the laser-diffraction analysis. J. Plant Nutr. Soil Sci. 2009, 172, 161–171. [Google Scholar] [CrossRef]
- Polystyrene. CAS Common Chemistry. Available online: https://commonchemistry.cas.org/detail?ref=9003-53-6 (accessed on 19 March 2026).
- Totten, M.; Hanan, M.; Knight, D.; Borges, J. Characteristics of mixed-layer smectite/illite density separates during burial diagenesis. Am. Mineral. 2002, 87, 1571–1579. [Google Scholar] [CrossRef]
- Liu, H.; Yang, J.; Jiang, Y.; Sun, R.; Zhou, P.; Li, J. Behavior of Microplastics and Nanoplastics in Farmland Soil Environment and Mechanisms of Interaction with Plants. Pol. J. Environ. Stud. 2024, 33, 2499–2513. [Google Scholar] [CrossRef]
- Lai, S.; Fan, C.; Yang, P.; Fang, Y.; Zhang, L.; Jian, M.; Dai, G.; Liu, J.; Yang, H.; Shen, L. Effects of different microplastics on the physicochemical properties and microbial diversity of rice rhizosphere soil. Front. Microbiol. 2025, 15, 1513890. [Google Scholar] [CrossRef]
- Vancampenhout, K.; Wouters, K.; De Vos, B.; Buurman, P.; Swennen, R.; Deckers, J. Differences in chemical composition of soil organic matter in natural ecosystems from different climatic regions—A pyrolysis-GC/MS study. Soil Biol. Biochem. 2009, 41, 568–579. [Google Scholar] [CrossRef]
- Abakumov, E.; Kimeklis, A.; Gladkov, G.; Nizamutdinov, T.; Kushnov, I.; Vainberg, A.; Andronov, E. The Effect of Applying Model Nanoplastic Particles to Soil on the Composition of Its Microbial Community. Appl. Sci. 2025, 15, 9937. [Google Scholar] [CrossRef]
- Yacoub, M.; Han, B. Terrestrial Microplastic Pollution: Occurrence, Fate, and Ecological Effects on Soil Systems. Microplastics 2026, 5, 67. [Google Scholar] [CrossRef]
- Andrady, A.; Barnes, P.; Bornman, J.; Gouin, T.; Madronich, S.; White, C.; Zepp, R.; Jansen, M. Oxidation and fragmentation of plastics in a changing environment; from UV-radiation to biological degradation. Sci. Total Environ. 2022, 851, 158022. [Google Scholar] [CrossRef]
- Seo, Y.; Zhou, Z.; Lai, Y.; Chen, G.; Pembleton, K.; Wang, S.; He, J.; Song, P. Micro- and Nanoplastics in Agricultural Soils: Assessing Impacts and Navigating Mitigation. Sci. Total Environ. 2024, 931, 172951. [Google Scholar] [CrossRef] [PubMed]
- Sun, S.; Sui, H.; Xu, L.; Zhang, J.; Wang, D.; Zhou, Z. Effect of freeze-thaw cycle aging and high-temperature oxidation aging on the sorption of atrazine by microplastics. Environ. Pollut. 2022, 307, 119434. [Google Scholar] [CrossRef]
Disclaimer/Publisher’s Note: The statements, opinions and data contained in all publications are solely those of the individual author(s) and contributor(s) and not of MDPI and/or the editor(s). MDPI and/or the editor(s) disclaim responsibility for any injury to people or property resulting from any ideas, methods, instructions or products referred to in the content. |
© 2026 by the authors. Licensee MDPI, Basel, Switzerland. This article is an open access article distributed under the terms and conditions of the Creative Commons Attribution (CC BY) license.