


Abstract
Microplastic contamination in wetland ecosystems is an escalating environmental threat, compromising ecosystem services, biogeochemical cycling and biodiversity conservation. This study assessed the occurrence, distribution and physicochemical characteristics of microplastics in the Ramsar-designated Pallikaranai wetland, southern India. Six representative subsamples were collected from spatially distinct locations and analyzed using density separation, followed by polymer identification via Raman spectroscopy and energy-dispersive X-ray spectroscopy (EDS). Microplastics were ubiquitously detected across both sediment and water matrices, with significantly higher abundances in sediments, indicating their role as a major sink. The dominant polymer types, polyethylene (PE), polypropylene (PP) and polystyrene (PS), along with prevalent morphotypes such as fragments, fibers, beads and foams, reflect diverse and persistent anthropogenic inputs. The compositional profile strongly implicates mismanaged domestic and urban waste as the primary source. The widespread presence and accumulation of microplastics in this ecologically sensitive wetland raise concerns over potential impacts on trophic interactions, habitat quality and long-term ecosystem resilience. These findings underscore the urgent need for targeted waste management strategies, pollution mitigation frameworks and continuous monitoring to safeguard the ecological integrity of the Pallikaranai wetland and similar Ramsar-listed ecosystems.
1. Introduction
Microplastic (MP) contamination is increasingly recognized as a global environmental threat across aquatic and terrestrial ecosystems, with widespread occurrence in marine, freshwater and estuarine systems [1,2] with notable accumulation in soils and sediments [3]. Micron-sized plastic particles, particularly within the 20 to 200 μm range, represent highly bioavailable fractions that pose significant ecological risks to a wide range of organisms [4]. Household plastic waste contributes substantially to MP pollution, accounting for up to 50% of total inputs into aquatic systems [5,6], with common polymers such as polyurethane, nylon, polystyrene and polyester frequently reported in Indian coastal sediments, including Gujarat and Mumbai [7,8,9,10]. Although freshwater systems have been extensively studied [11,12], wetlands remain comparatively understudied despite their ecological importance and increasing exposure to MP contamination.
Wetlands function as critical ecosystems providing water purification, flood regulation and carbon storage services [13,14], yet recent studies from China and Taiwan highlight MPs as emerging stressors in freshwater irrigation and wetland-associated systems [15,16]. Globally, investigations in systems such as the Kelvin River (UK), Poyang Lake (China), Bizerte Lagoon (Tunisia), Flemish rivers (Belgium) and Vembanad Lake (India) report alarming MP concentrations, indicating widespread contamination and ecological risk [17,18,19,20]. More recent studies have further confirmed significant MP accumulation in wetland environments [21,22], with household-derived polyester and acrylic fibers dominating, underscoring domestic wastewater as a major source [22]. Advanced analytical techniques such as Raman spectroscopy (RS), scanning electron microscopy (SEM), and energy dispersive X-ray spectroscopy (EDS) remain reliable for identifying MP morphology and polymer composition [23,24,25], offering advantages over time-intensive thermal degradation methods [26].
In India, plastic production reached approximately 9.4 million tons annually in 2019, compared to over 380 million tons globally [27], highlighting the scale of the issue. Tamil Nadu, a southeastern coastal state influenced by three surrounding seas and containing 14 Ramsar-listed wetlands [28], is particularly vulnerable. Chennai, its largest metropolitan city, generates an average of 95.42 kg/MT (MT-Metric-ton) (minimum 79.47 kg/MT and maximum 106.80 kg/MT per day) of plastic waste per day, which reveals around 84% of HDPE/LDPE waste comprising carry bags, milk pouches and packing films (Tamil Nadu Pollution Control Board, 2015) [29]. Major persistent polymers include polyethylene terephthalate (PET), high-density polyethylene (HDPE), low-density polyethylene (LDPE), polyvinyl chloride (PVC) and polystyrene (PS) [29]. Most plastic debris originates from land-based activities and is transported through rivers, canals and urban drainage networks into wetlands, which act as pollutant sinks [30,31].
Despite these concerns, no site-specific investigation has been conducted in Pallikaranai marsh, a Ramsar-designated wetland in Chennai that supports diverse invertebrate communities and microbial processes essential for nutrient cycling. Previous studies have only reported MP transport through Chennai’s waterways [10,31], leaving a critical knowledge gap regarding in situ contamination within this ecologically significant wetland. Therefore, this study provides the first direct evidence of MP occurrence in both sediment and water of Pallikaranai marsh, offering a region-specific perspective that is currently lacking in the literature.
The specific objectives of this study are to (i) quantify the abundance and spatial distribution of MPs in water and sediment of Pallikaranai wetland; (ii) characterize MPs based on size (including 20 to 200 μm fractions), shape and polymer composition (e.g., PET, HDPE, LDPE, PVC, PS) using SEM/EDS and Raman spectroscopy; and (iii) identify potential sources and pathways of MP contamination in relation to urban inputs from Chennai, Tamil Nadu, India. This study thus provides a critical baseline for understanding MP dynamics in Indian wetlands and supports future conservation and pollution management strategies. The present study addresses this knowledge gap by providing direct evidence of MP occurrence in sediment and water samples from Pallikaranai, a Ramsar-designated wetland in southern India. Findings from this research contribute to understanding the extent, sources and implications of MP pollution in a vulnerable wetland ecosystem of high conservation value.
2. Materials and Methods
2.1. Sample Preparation and Extraction of Micro-Plastics
Six sampling sites were selected to represent spatial variability in environmental conditions and potential microplastic (MP) sources across the study area (e.g., coastal influence, anthropogenic activity and hydrodynamic regimes). These include (S1: 12°57′31.0″ N, 80°12′54.6″ E; S2: 12°56′59.3″ N, 80°13′33.4″ E; S3: 12°56′46.6″ N 80°12′59.6″ E; S4: 12°57′51.3″ N 80°13′46.1″ E; S5: 12°55′45.6″ N 80°13′33.9″ E; S6: E12°55′14.6″ N 80°13′22.3″ E); the sampling were carryout in early of post-monsoon and collected samples were kept at room temperature (28 °C) until further analysis. At each site, triplicate samples of both water and sediment were collected (n = 3 per site), resulting in a total of 18 water and 18 sediment samples. Replicates were processed and analyzed independently to account for within-site variability, and the results are reported as mean ± standard deviation. Surface water samples were collected in pre-cleaned glass bottles (volume: 1 L per replicate), while sediment samples were obtained using a stainless steel shovel (30 cm width) to a depth of 5 cm following established protocols. Approximately 500 g of wet sediment per replicate was collected under contamination-controlled conditions and stored in pre-cleaned glass containers [32,33,34].
Sediment samples were oven-dried at 75 °C for 24 h to constant weight and a known subsample (4 g dry weight) was subjected to microplastic extraction. The dried material was sieved through a 350 µm mesh, establishing the lower size threshold for particle detection in this study. This mesh size was deliberately selected to target larger microplastics, which are less prone to analytical loss, easier to isolate and more reliably identified using conventional spectroscopic techniques. Moreover, the use of a coarser mesh minimizes contamination risks and improves procedural consistency across samples. However, this methodological choice inherently biases the dataset toward larger fractions and likely leads to an underestimation of total microplastic abundance, particularly in the <350 µm size range, where particles are often more numerous [34,35]. Consequently, the reported concentrations should be interpreted as conservative estimates, reflecting only the coarser fraction of the microplastic pool. This limitation may also influence comparisons with studies employing finer mesh sizes, as differences in size thresholds can significantly affect abundance, size distribution, and inferred sources of microplastics.
Organic matter in sediment samples was removed using wet peroxide oxidation (WPO), consisting of 30% hydrogen peroxide (H2O2), 0.05 M FeSO4·7H2O, and 3 mL concentrated H2SO4 prepared to a total volume of 500 mL. For each sample, 50 mL of the reagent was added to 4 g of sediment and the reaction was repeated twice to ensure complete digestion. Following digestion, density separation was performed using a saturated sodium chloride (NaCl) solution (density 1.2 g cm−3), prepared by dissolving NaCl to saturation (350 g L−1). The mixture was agitated and allowed to settle for 24 h, after which the supernatant containing floating MPs was carefully decanted and filtered. Water samples were treated similarly for organic matter removal using 30% H2O2 at 60 °C for 24 to 48 h, followed by density separation with saturated NaCl solution. The floating fraction was collected after 24 h of settling [34,35].
Recovered particles from both sediment and water samples were filtered using a 350 µm mesh and transferred to glass Petri dishes, then dried at 75 °C for 24 h. Presumptive MPs were visually identified under a stereomicroscope based on nature (fibers, fragments and pellets), shape and texture. Finally, images were captured using a stereomicroscope (Olympus SXZ16, Olympus Corporation, Tokyo, Japan) equipped with a camera at School of Life Sciences, National Taiwan Ocean University (NTOU).
2.2. Characterization of Micro-Plastic Polymers Using Raman Shift
Polymer recovered microplastic (MP) particles were subjected to morphological and chemical characterization using field emission scanning electron microscopy (FESEM) and Raman spectroscopy. Surface morphology and microstructural features of selected particles were examined using a Hitachi FESEM S-4800, (Hitachi High-Tech Corporation, Tokyo, Japan). Prior to analysis, samples were mounted on aluminum stubs using carbon adhesive tabs and sputter-coated with a thin layer of gold to enhance conductivity. Imaging was performed under high vacuum at an accelerating voltage of 5 to 15 kV to obtain detailed surface features, including cracks, pits and weathering patterns indicative of environmental degradation.
Polymer identification was conducted using a WITec alpha300 R Raman microscope, (WITec Wissenschaftliche Instrumente und Technologie GmbH, Ulm, Germany) equipped with a 532 nm diode-pumped solid-state (DPSS) laser (maximum power: 100 mW). Raman spectra were acquired using a 50× long working distance (LWD) objective over a spectral range of 100 to 3200 cm−1. To prevent thermal degradation and alteration of the polymer nature, the laser power at the sample surface was carefully reduced to 2 to 10 mW using neutral density filters. Spectral acquisition parameters included integration times of 1 to 10 s with 3 to 10 accumulations to improve signal-to-noise ratio. Background subtraction and cosmic ray removal were performed prior to analysis. The obtained Raman spectra were compared against reference spectral libraries and published databases to identify polymer types (e.g., polyethylene, polypropylene and polystyrene). A match quality ≥70% and the presence of multiple diagnostic bands were required for positive identification. Only spectra with high matching confidence were considered for final polymer classification.
2.3. Contamination Control, Quality Assurance and Quality Control (QA/QC)
Strict QA/QC and contamination control procedures were implemented to ensure data reliability. Only visually pre-identified MPs (based on shape and color) were analyzed spectroscopically to minimize false positives. All materials and glassware were rinsed with filtered deionized water, covered with aluminum foil, and all solutions were pre-filtered prior to use; cotton laboratory coats and nitrile gloves were worn to reduce fiber contamination. Procedural blanks and airborne controls (open filters) were included, and any matching particles and spectra detected in blanks were excluded, with blank values subtracted where applicable. The Raman system was calibrated daily using a silicon standard (520 cm−1) with replicate measurements (10%) to ensure reproducibility. Particles with fluorescence interference and weak signals were reanalyzed at lower laser power and excluded if reliable identification was not possible.
2.4. Statistical Analysis
Data analysis was performed using SPSS v.21. Normality was confirmed by Shapiro–Wilk and Kolmogorov–Smirnov tests (p > 0.05), and homogeneity of variances by Levene’s test (p ≥ 0.05). Meeting both assumptions, a one-way ANOVA was conducted to assess significant differences in microplastic accumulation in sediment and water across different sampling sites.
3. Results and Discussion
3.1. Study Area
Pallikaranai marsh faces significant microplastic (MP) threats driven by rapid urbanization, surrounding residential and IT developments and inputs from the Perungudi waste facility. Monsoonal inflows from 31 connected water bodies transport MPs into the wetland, where low elevation and dense vegetation promote their retention and accumulation in sediments and biota. Hydrological outflow through the Buckingham Canal further spreads MPs to the Muttukadu estuary and Bay of Bengal [31]. Ongoing habitat loss and fragmentation intensify these risks, making this biodiversity-rich marsh a critical hotspot for microplastic contamination despite ongoing conservation efforts. Our study highlights the escalating threats posed by microplastic (MP) contamination driven by rapid peri-urban expansion in a large inland freshwater marsh. The hydrological setting of Pallikaranai marsh creates a direct pathway for urban-derived pollutants, where multiple townships discharge untreated and partially treated effluents into a single wetland corridor [34,35]. Such configurations amplify the risk of sustained MP influx, leading to chronic accumulation rather than episodic contamination, an emerging concern for inland wetlands increasingly embedded within expanding urban landscapes. Intensifying land use pressures further compounds these threats. Dense urbanization along the wetland boundary, including residential encroachment, municipal dump yards and industrial activity, acts as a continuous source of plastic debris and secondary microplastics [31,32,33]. These inputs elevate the risk of trophic transfer, habitat degradation and long-term sediment contamination. Similar threat patterns are now reported across inland wetlands in rapidly developing regions, where weak regulatory enforcement and inadequate waste management accelerate MP loading [31].
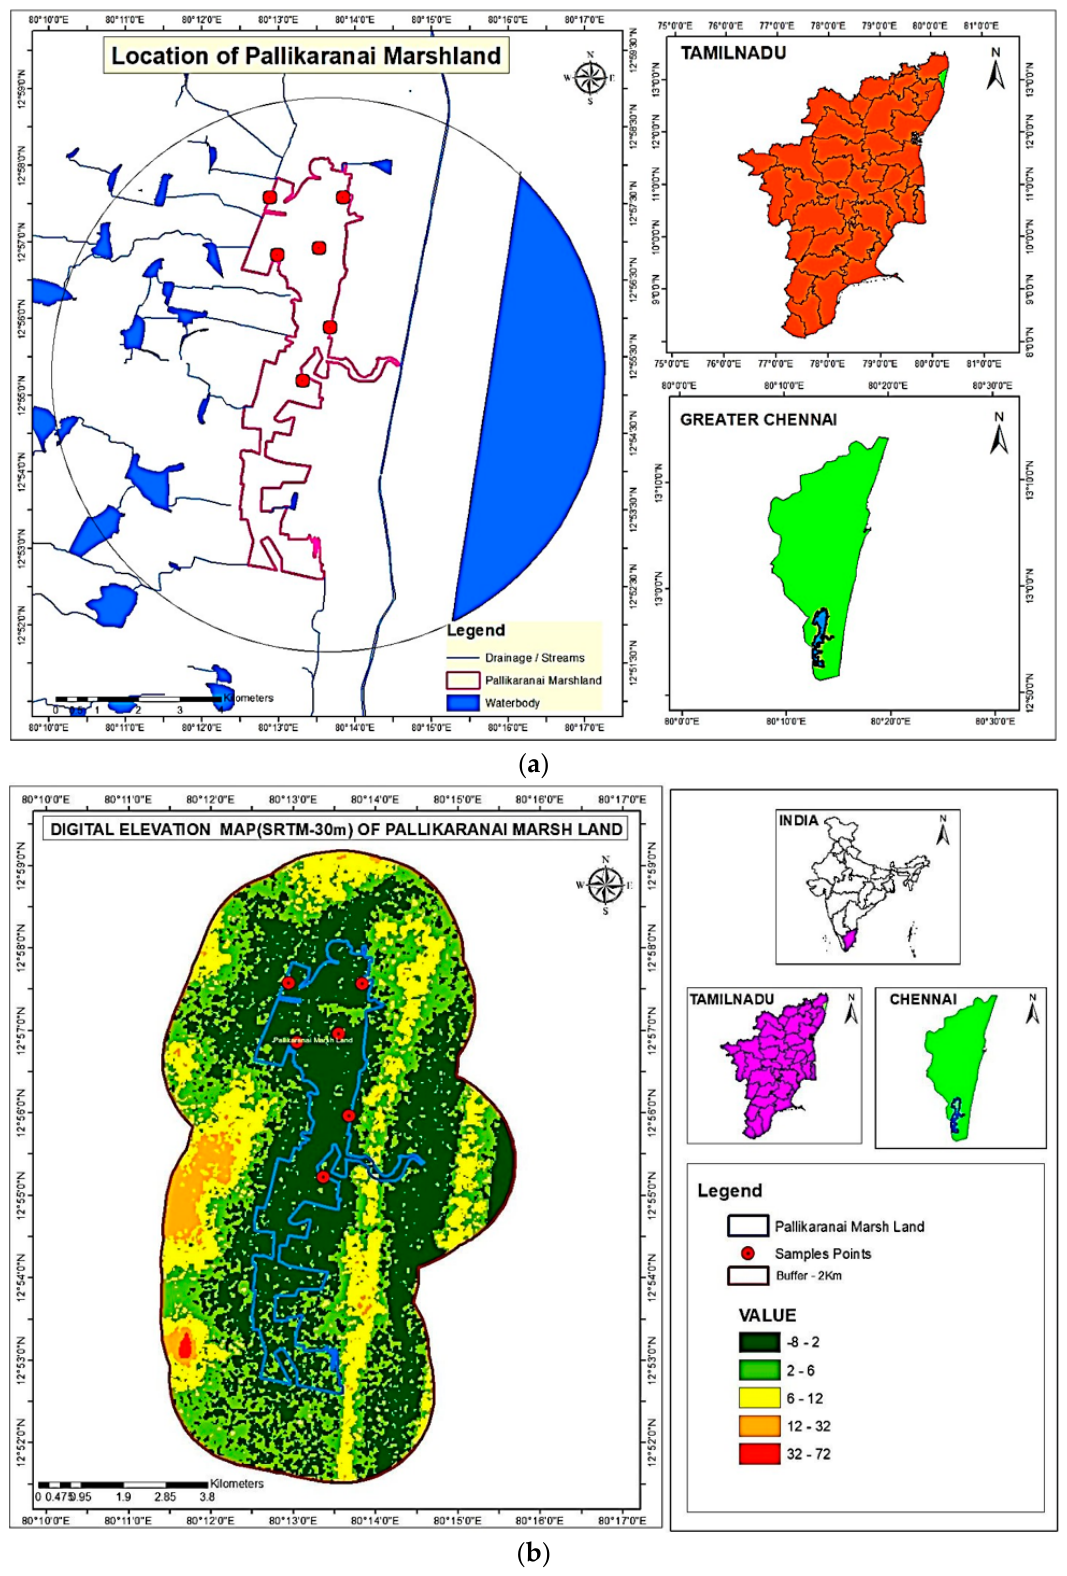
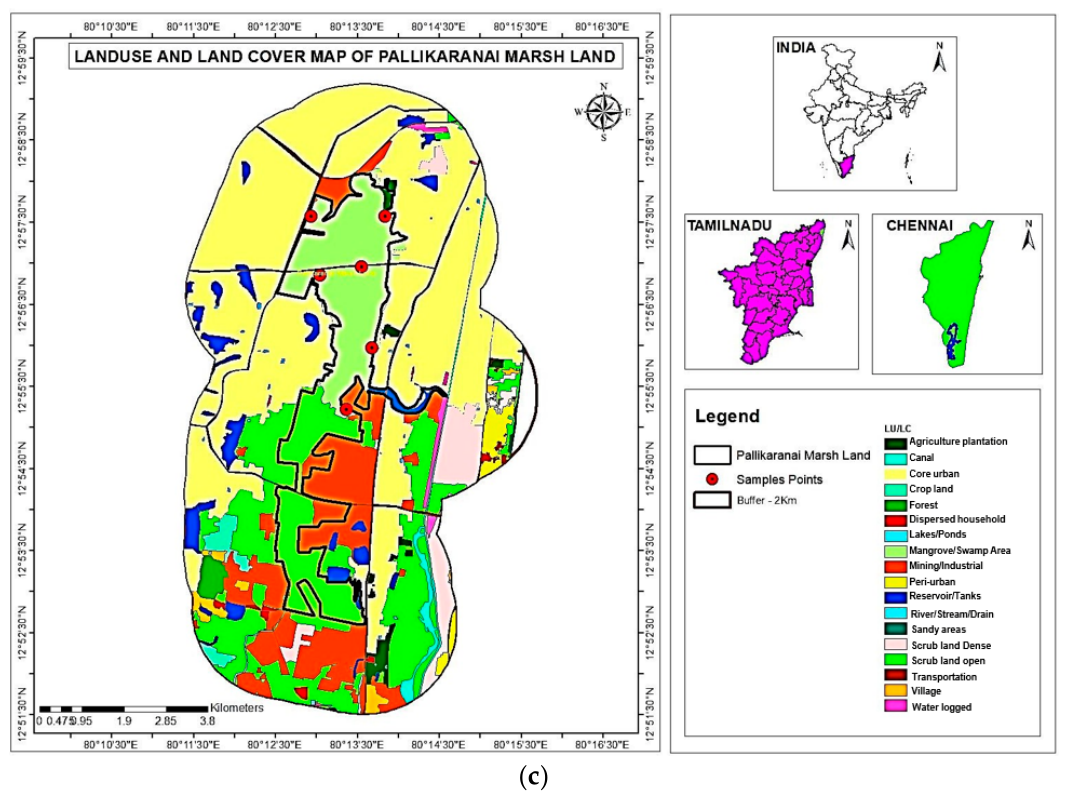
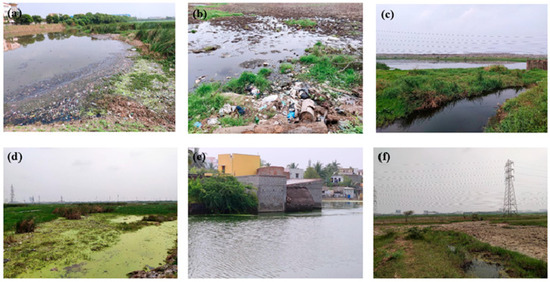
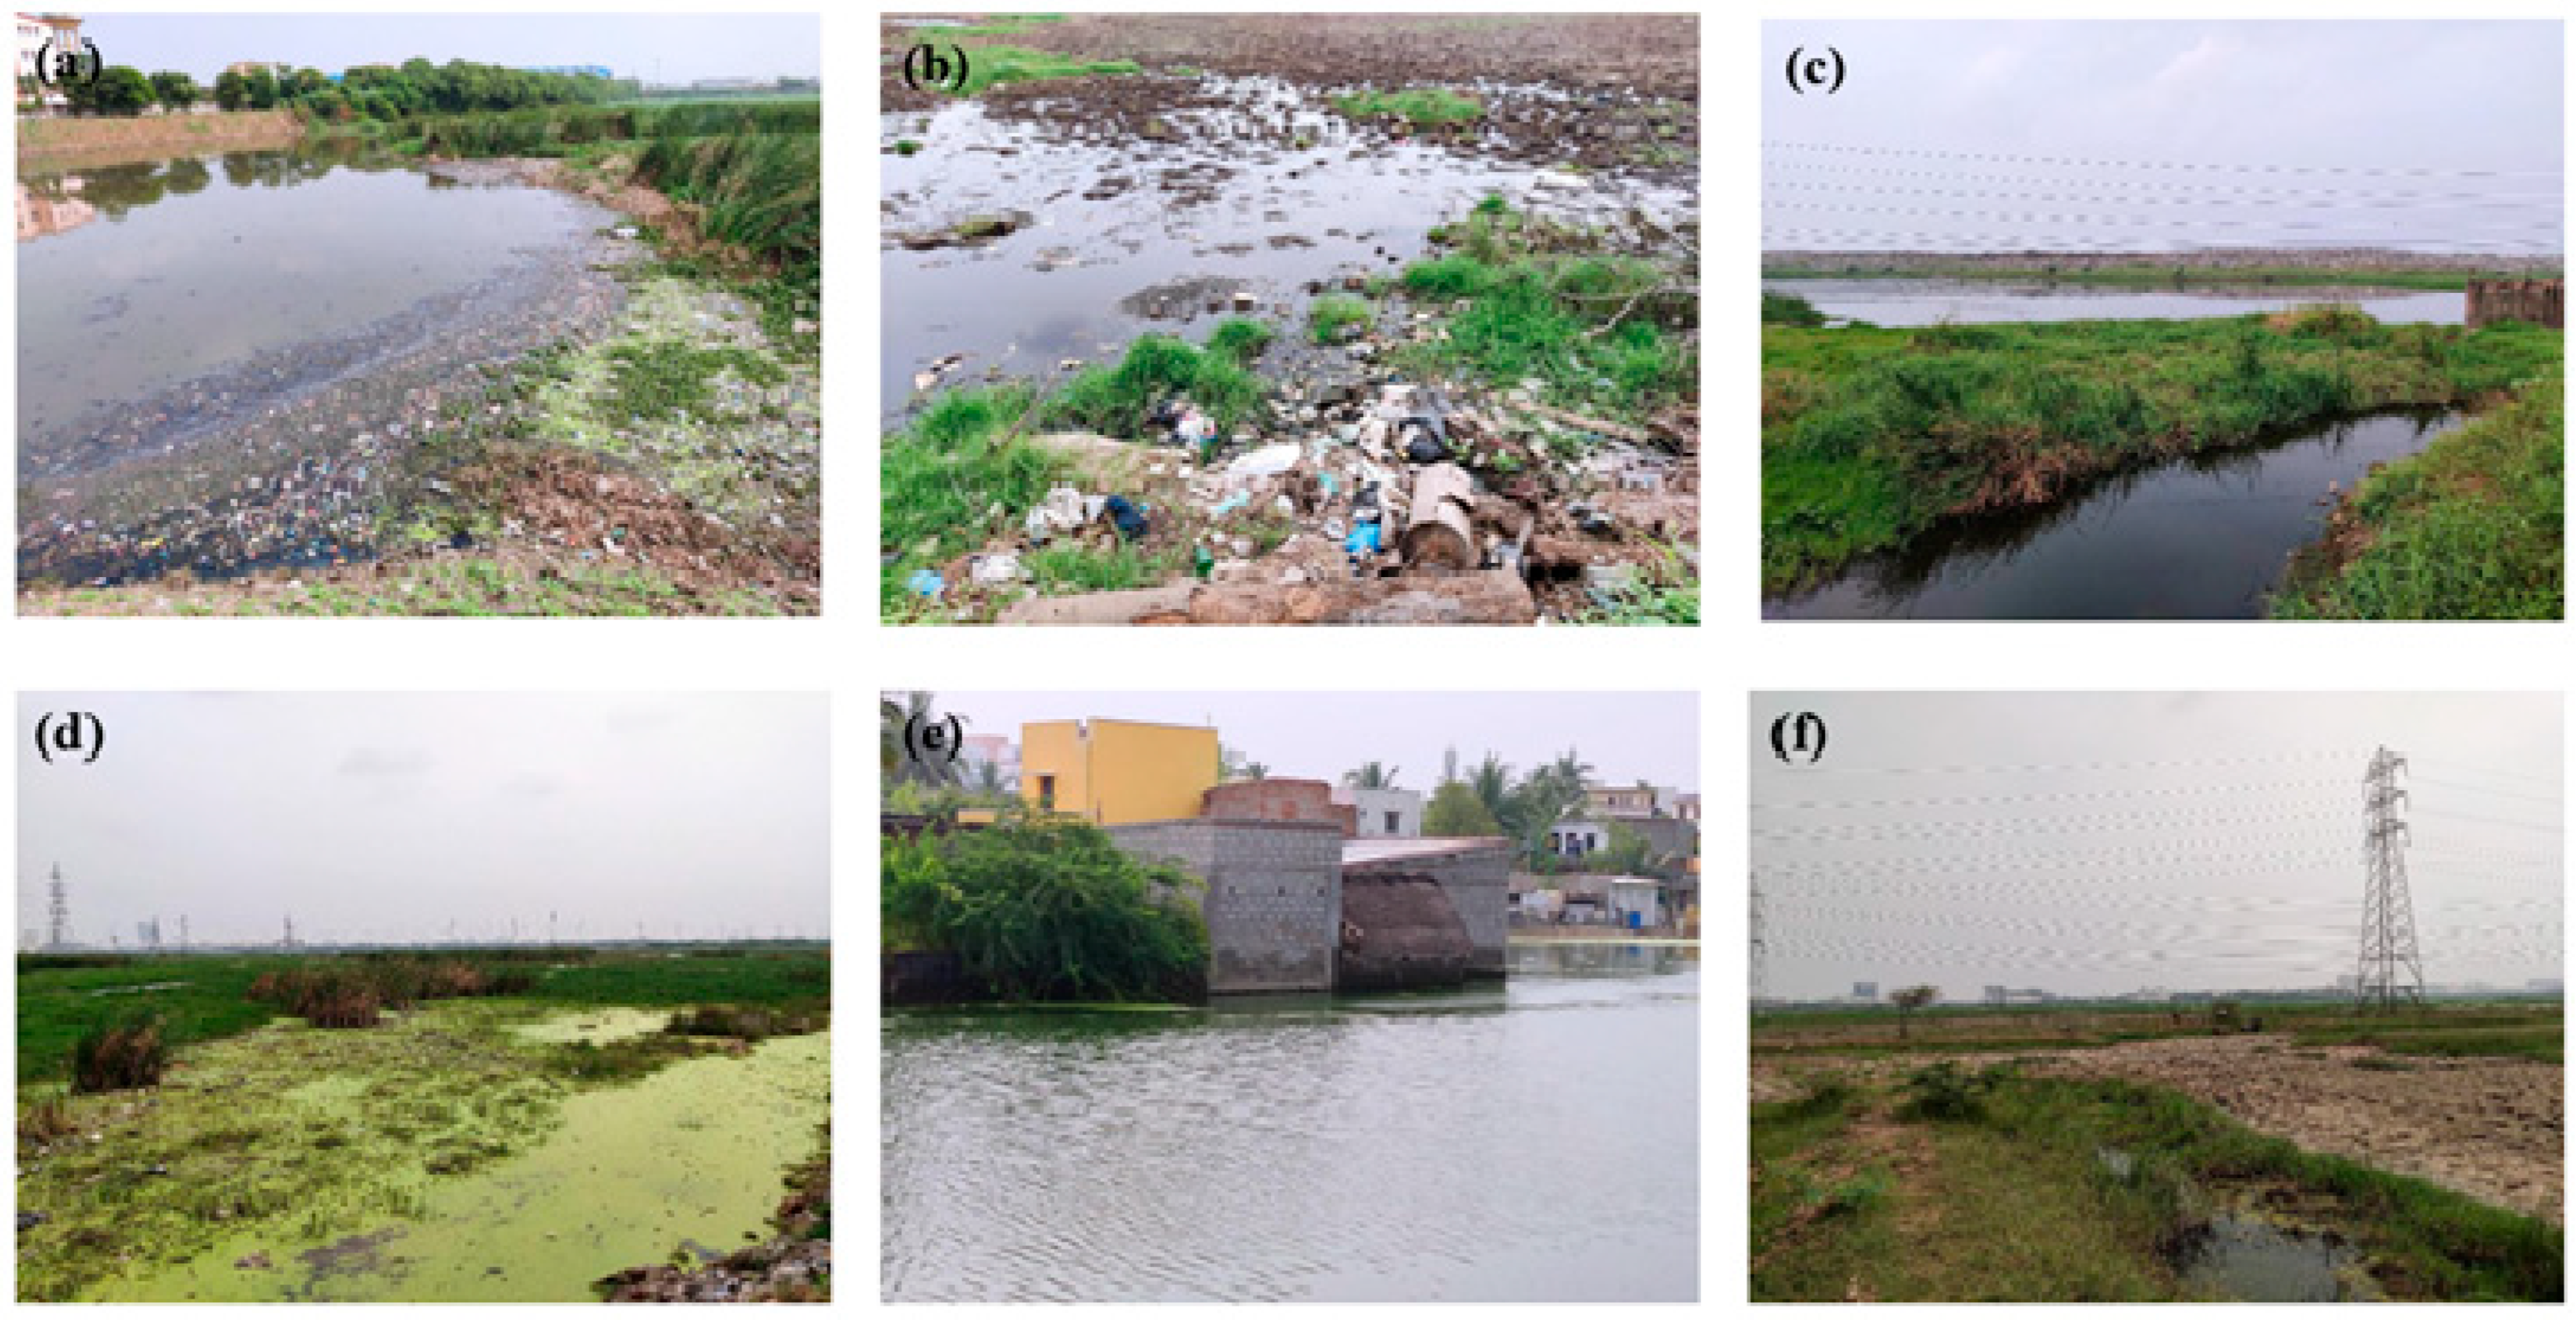
The marsh’s low-lying topography significantly heightens its vulnerability. Minimal elevation gradients promote water stagnation and sediment trapping, allowing MPs to persist and accumulate within benthic substrates and aquatic vegetation [31,36]. Hydrologically connected ponds and forest patches function not only as sinks but also as secondary sources, redistributing MPs during seasonal flooding and monsoonal surges [31]. This dynamic increases the spatial footprint of contamination and prolongs ecological exposure. Visible accumulation of MPs along inflow zones, pond margins and urban interfaces underscores the immediacy of the threat (Figure 1a–c). These hotspots represent critical zones where biological interactions with MPs are most likely to occur, raising concerns over ingestion, bioaccumulation and potential toxicological effects on wetland biota [31]. Figure 2a–f confirm visible MP presence at inflow corridors, pond margins, and urban edges.
Figure 1.
Sampling sites, drainage influencing, water reservoir and elevation range of Pallikaranai wetland. (a) Drainage and water resources from neighboring townships; (b) elevation map and buffer zones (c) land and land cover map.
Figure 2.
Sampling sites: (a) Site 1; (b) Site 2; (c) Site 3; (d) Site 4; (e) Site 5; (f) Site 6.
From a global perspective, Pallikaranai exemplifies a broader but under-recognized risk: inland freshwater wetlands are becoming major reservoirs of microplastic pollution under accelerating urbanization. The findings emphasize three key threat dimensions of international relevance: (i) continuous MP inputs from unregulated urban expansion, (ii) enhanced retention and redistribution driven by hydrological and topographic conditions and (iii) increased ecological risk through prolonged environmental exposure and trophic transfer. Together, these processes position inland wetlands not merely as passive recipients but as active nodes in the global microplastic cycle, warranting urgent attention in environmental monitoring and management strategies.
3.2. Characterization of Microplastics
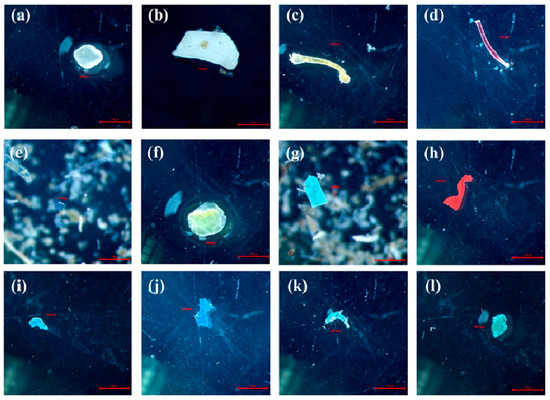
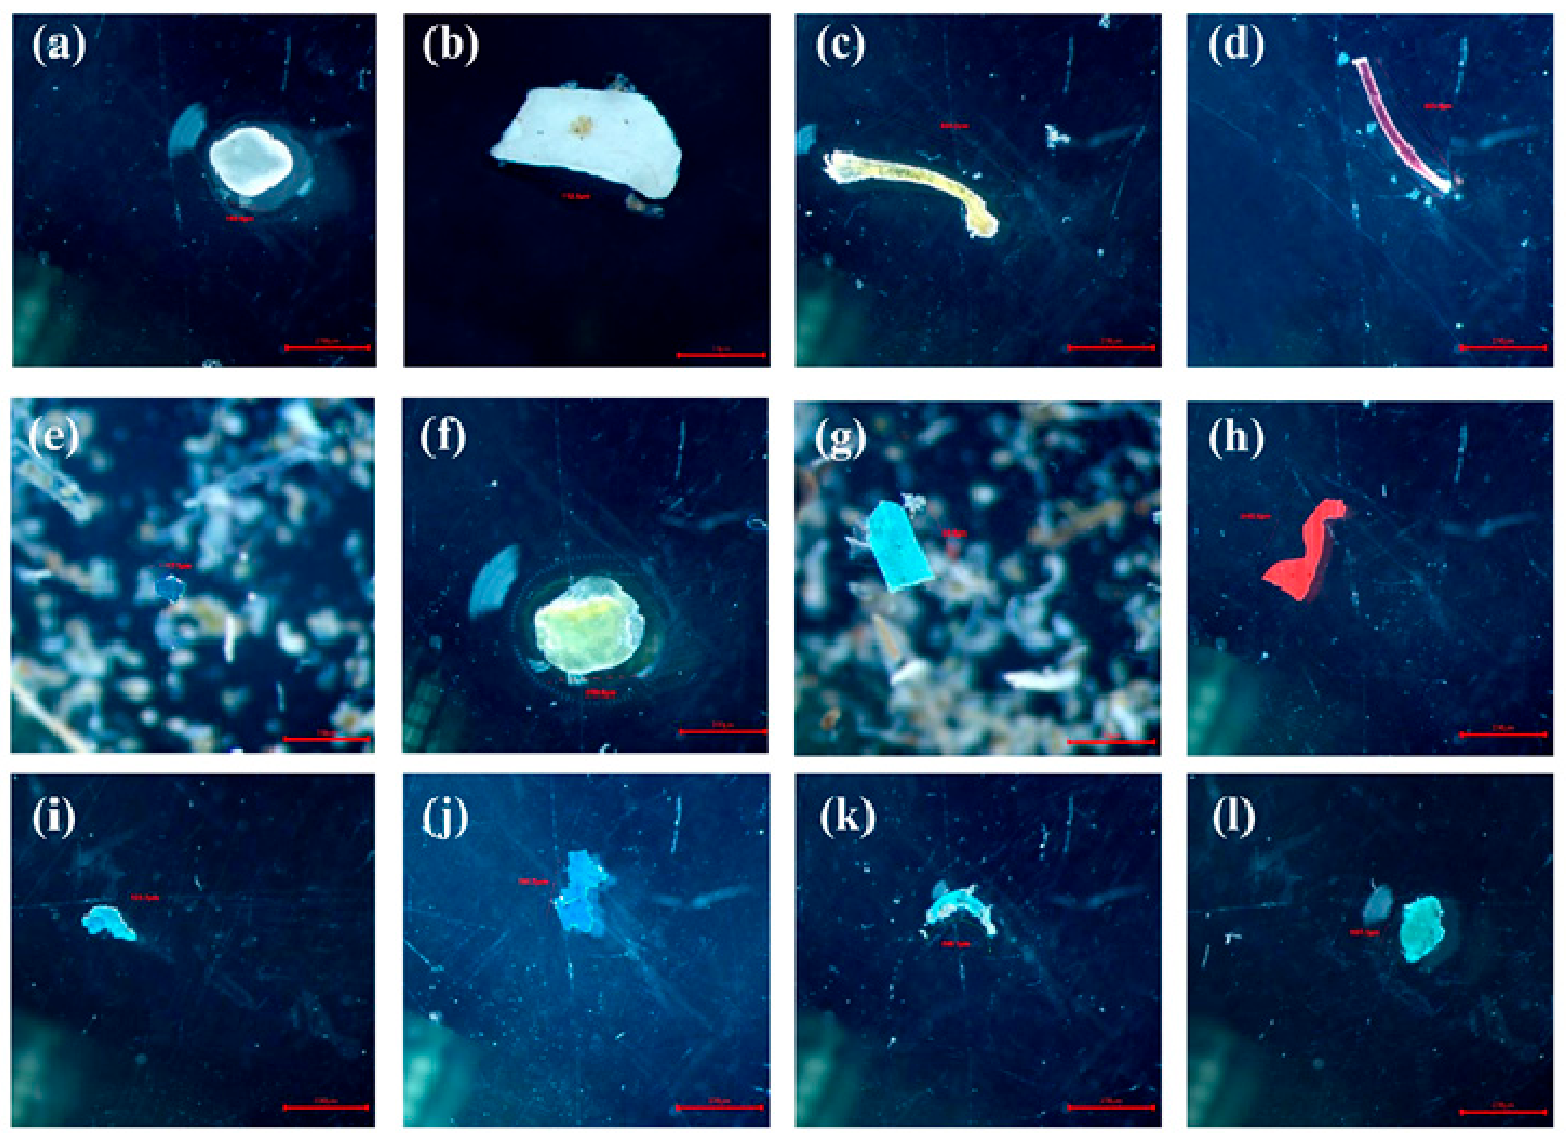
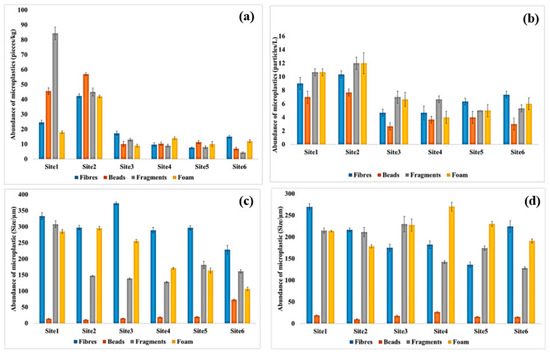
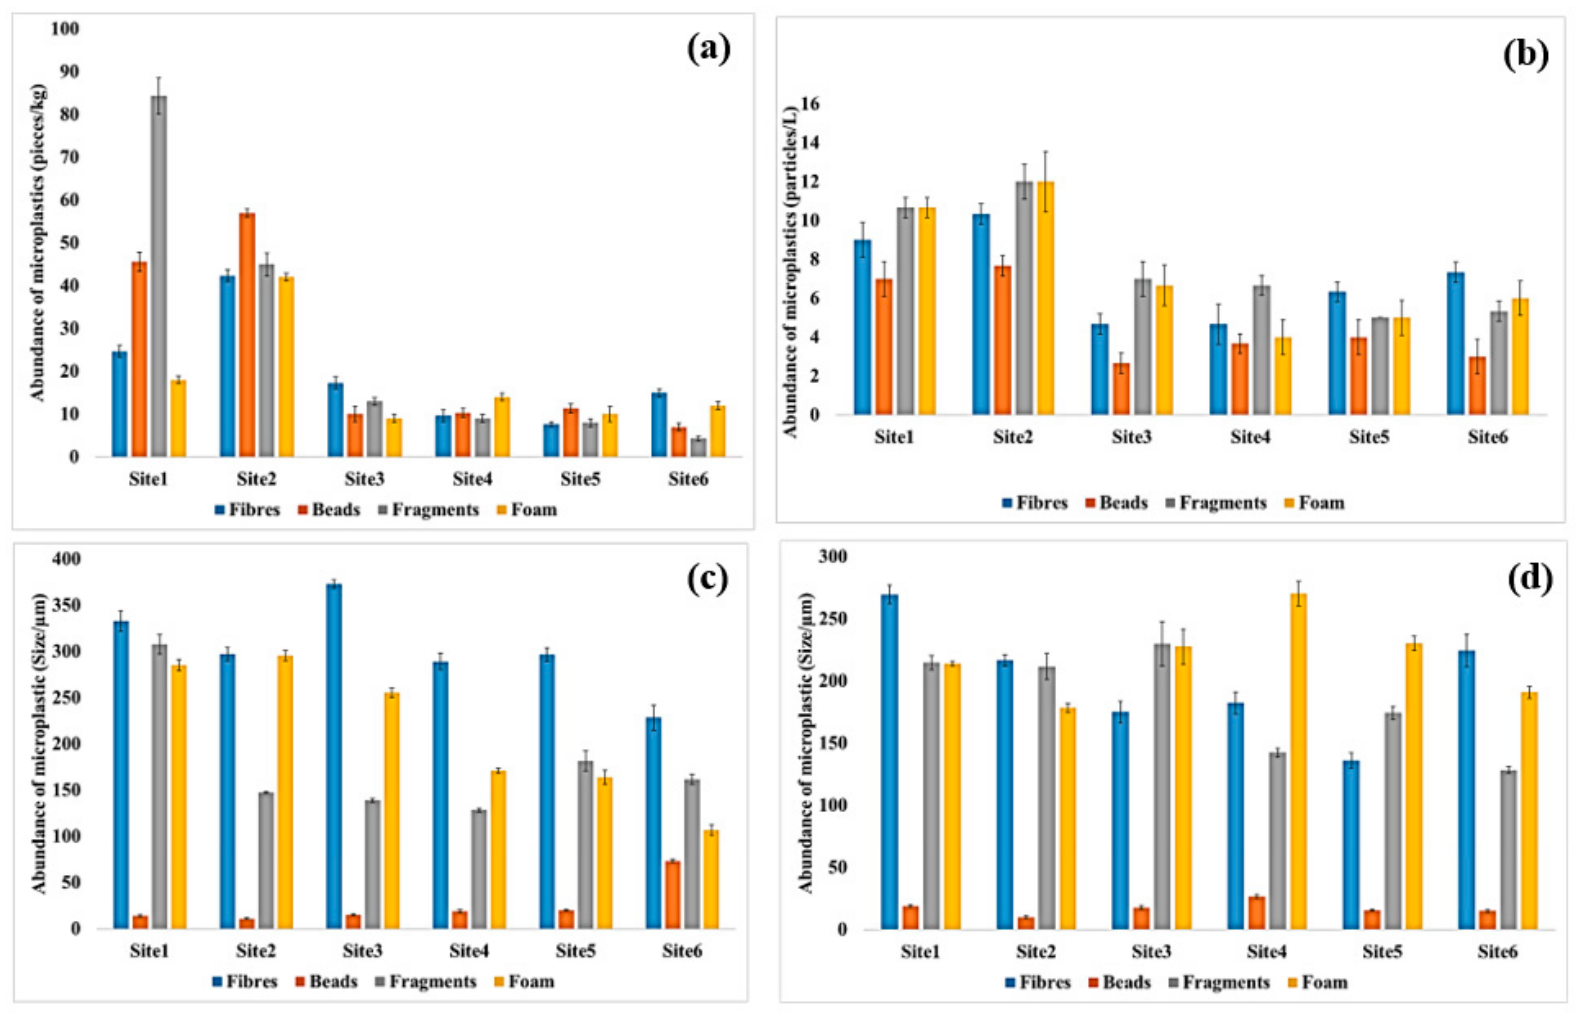
Microplastics (MPs) were quantified in both sediment and water samples following wet peroxide oxidation and microscopic examination. Sediments consistently exhibited substantially higher MP abundance than water, confirming their role as a major sink. The total abundance reached 1580 particles in sediments compared to 484 particles in water, indicating strong accumulation and retention processes in benthic environments. Across all sites, four different types were recorded: fibers, fragments, beads and foams (Figure 3a–i). In sediments, MPs were dominated by fragments (highest), followed by beads, fibers and foams, whereas in water the order shifted slightly to fragments > fibers > foams > beads. Mean site-wise abundance further showed that Site 2 (46.58 ± 6.44) and Site 1 (43.17 ± 26.53) recorded the highest MP concentrations in sediments, while water samples showed comparatively lower and more uniform distributions (maximum mean at Site 2: 10.5 ± 2.02). This pattern indicates localized accumulation hotspots likely driven by hydrodynamics and proximity to anthropogenic inputs. The spatial variability was pronounced. Sediments exhibited peak concentrations of fragments at Site 1 and elevated beads, fibers and foams at Site 2. In contrast, water samples showed relatively low counts across all sites, with minor peaks at Sites 1 to 3. The reduced abundance in the water column likely reflects continuous transport, dilution and settling processes, whereas sediments integrate long-term deposition (Figure 4a,b). Current trends in the MPs in this wetland strongly correlated with Townsend et al. (2019) [37], who reported different shapes and structures of microplastic samples retrieved from 20 different urban wetlands in the greater Melbourne region and Victoria, Australia, consistent with the counted microplastic shapes and structures. They concluded that all wetlands had microplastics, with an average abundance of around 46 pieces per kilogram of dry sediment. 68.5% of the microplastics discovered were plastic pieces, making them the most prevalent kind. Higher residential densities of urbanization were associated with plastic beads and pieces. This conclusion is strongly apt with the current sampling sites of Pallikaranai wetland, which are also surrounded by many industries and urbanization. Recent studies further strengthen and contextualize these patterns across different aquatic systems. For instance, Jeylaputheen et al. [38] demonstrated that coastal sediments along the Chennai coast exhibit significantly elevated microplastic loads in highly urbanized zones, with fragments and beads dominating due to the breakdown of consumer plastics and direct discharge of urban waste. Their results showed a clear gradient of increasing MP abundance with urban intensity, reinforcing the role of anthropogenic pressure as a primary driver of sedimentary accumulation, consistent with the hotspot patterns observed at Sites 1 and 2 in the present study.
Figure 3.
Major microplastic types in the Pallikaranai wetland: (a,b) foams; (c,d) fiber; (e,f) beads; (g–l) fragments.
Figure 4.
Microplastic (a,b) counts (c,d) size distribution of fragments, beads, foams, and fibers in the sediment and water of Pallikkaranai wetland.
Similarly, Ephsy and Raja [39] reported pronounced seasonal and spatial variability in both sediment and water compartments, with higher concentrations during low-flow and dry periods when reduced dilution and increased retention favor accumulation. They also observed that sediment samples consistently harbored higher MP loads than surface waters, emphasizing the integrative role of sediments as long-term sinks. This seasonal hydrodynamic control directly supports the present findings, where lower variability in water and higher accumulation in sediments reflect differences in transport and residence time. In riverine environments, Rajeevan et al. [40] identified heterogeneous spatial distribution of MPs across basin-scale gradients, with higher concentrations near densely populated and agriculturally influenced catchments. Their baseline assessment further indicated that fibers and fragments dominate due to wastewater discharge, agricultural runoff and plastic usage patterns, highlighting the importance of catchment level processes in shaping MP distribution. This reinforces the present study’s interpretation that localized hotspots are strongly linked to surrounding land use and anthropogenic inputs.
Further, descriptive statistics and one-way analysis of variance (ANOVA) were applied to evaluate spatial variation and differences among microplastic (MP) types in both sediment and water samples. Mean abundance, standard deviation and total counts were calculated for each site (Sites 1 to 6), followed by ANOVA to test for significant differences among MP categories (fibers, beads, fragments and foams) within and across sites. The statistical results revealed strong spatial heterogeneity in MP abundance. Sediment samples showed substantially higher variability (SD: 1.87–26.53) compared to water samples (SD: 1.05–2.02), indicating greater accumulation and uneven distribution in the benthic environment. Mean MP abundance in sediments ranged from 9.25 to 46.58, while water samples ranged from 4.75 to 10.50, confirming significantly lower and more homogeneous concentrations in the water column. One-way ANOVA demonstrated highly significant differences among MP types within each site in sediments (e.g., Site 1: F = 334.569, p < 0.001; Site 2: F = 45.025, p < 0.001). Similarly, water samples also showed statistically significant variation among MP types across all sites (F = 4.714–16.111, p < 0.05). These results indicate that the distribution of MP types is non-uniform and strongly dependent on local environmental conditions. The higher variance and significant F-values at Sites 1 and 2 suggest localized hotspots of MP accumulation, likely influenced by intensified anthropogenic inputs and reduced hydrodynamic dispersion.
3.3. Microplastic Size Distributions
Microplastic size distribution revealed clear differences between sediment and water compartments, reflecting selective transport and deposition processes. Sediment samples exhibited larger and more variable particle sizes, with mean values ranging from 142.58 to 235 µm, whereas water samples showed smaller and more uniform sizes (mean: 139.08 to 179.33 µm). This pattern indicates that larger and denser particles preferentially settle into sediments, while smaller particles remain suspended and are transported over longer distances (Figure 4c,d). ANOVA results confirmed highly significant differences in MP size distribution among types at all sites for both sediments and water (p < 0.001 in most cases). Sediment samples showed extremely high F-values (e.g., Site 3: F = 4515.220; Site 2: F = 2238.755), indicating pronounced differences in size among fibers, beads, fragments and foams. Water samples similarly exhibited significant differences (e.g., Site 1: F = 1245.158; Site 5: F = 793.93), though with slightly lower magnitude compared to sediments. The highest accumulation of microplastics was observed at the Perungudi solid waste management and the Velachery windmill. The present study reflects earlier observations by Liu et al. (2019) [16], who reported that the microplastic size ranges around 0.5 to 23 µm in water samples from storm water ponds in Denmark with urban and highways ponds, water samples MP concentration: 0.7–3.5 items/L to 1.2–4.0 items/L; sediment Samples: 3000–5500 items/kg dry weight to 5600–12,000 items/kg dry weight. Further, MPs were widely distributed in the surface sediments, with an average abundance of 1755.56 items/kg dry weight at Freidounkenar Paddy Wetland (northern Iran) [41]. They also recorded that fibers were the most dominant MP, followed by fragments and films, with Polyethylene (PE) and polypropylene (PP) being the most common polymer types. With their findings, they concluded that MP distribution was influenced by anthropogenic activities, especially agricultural practices (e.g., use of plastic mulches and fertilizers), wastewater inputs and proximity to residential areas [41]. Overall, the findings suggested that accumulated microplastics directly mixed with the substrate of the water of a wetland are prone to have adverse effects on aquatic organisms. Below <5 mm of plastic debris, directly introduced by sewage discharges from the nearest urban areas into the wetlands, subsequently affects different trophic levels by bioaccumulation. The above observations were strongly accepted by Zhang et al. [42] and Anandhan et al. [43], who reported microplastic accumulation from different trophic levels. Overall, comparative analyses showed a maximum of fragments, fibers and foams in that wetland, highlighting household usage as a major threat.
The narrow distribution of bead sizes suggests their origin from primary microplastics (e.g., cosmetic microbeads or industrial abrasives), whereas the wide range of fragment and foam sizes points to secondary degradation of larger plastic debris through photochemical weathering and mechanical breakdown. Fibers exhibited the greatest variability, with outliers >300 µm, reflecting contributions from textiles, fishing lines and synthetic ropes entering the wetland via wastewater and runoff. These size-dependent patterns are ecologically significant because smaller MPs (<100 µm), particularly beads and degraded fragments, are more readily ingested by plankton and benthic invertebrates, thereby enhancing the risk of trophic transfer. Larger fibers and foams, on the other hand, can entangle aquatic organisms or reduce gut clearance efficiency in fish. Similar size hierarchies, with fibers typically dominating the upper range, have been reported in Asian and European wetlands [18,42,43], suggesting consistent mechanisms of MP generation and retention across freshwater ecosystems.
The ecological implications of size variation are substantial. Smaller MPs (<150 µm) are more readily ingested by planktonic organisms, increasing the risk of trophic transfer, while larger particles in sediments may impact benthic feeders through physical blockage or reduced feeding efficiency. Additionally, smaller particles possess a higher surface area-to-volume ratio, enhancing their capacity to adsorb toxic contaminants such as metals and persistent organic pollutants, thereby acting as vectors of chemical exposure.
3.4. Polymer Composition of Microplastics
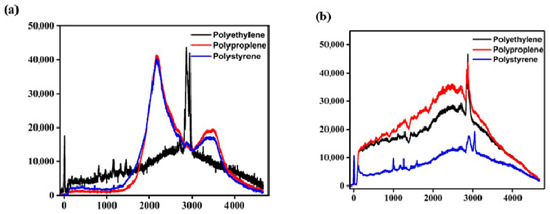
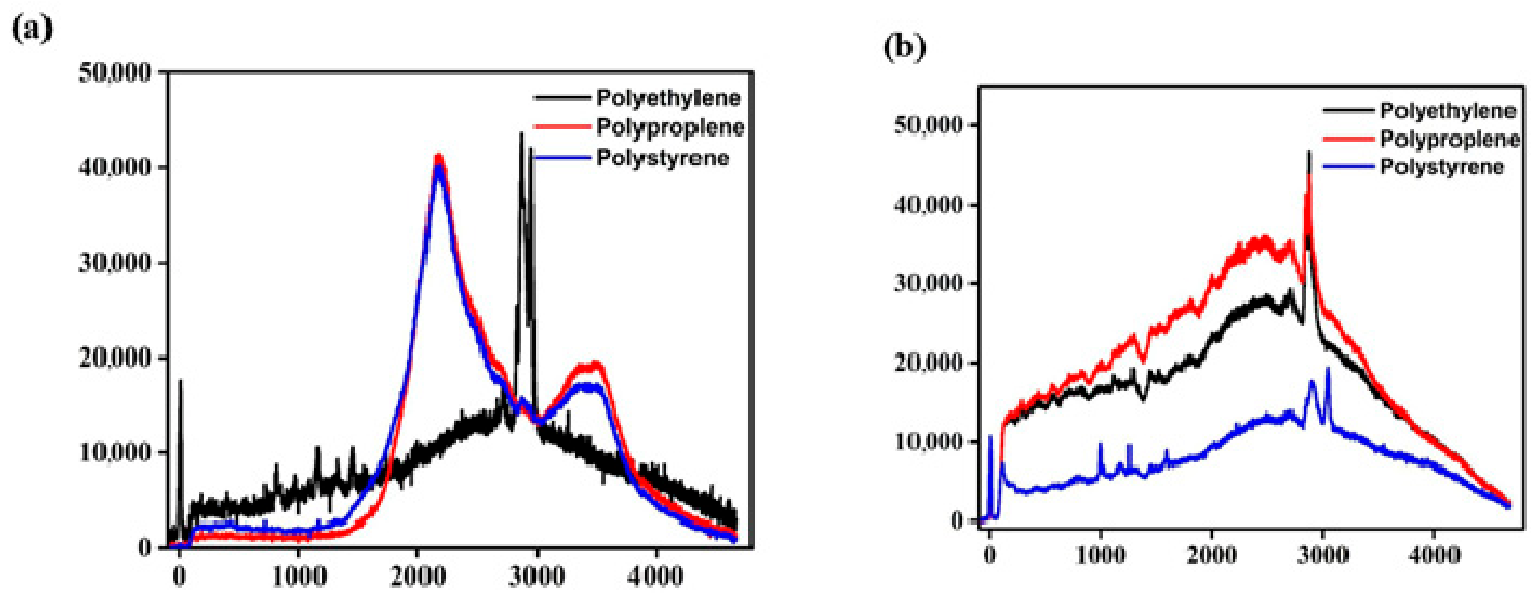
Polyethylene (PE) and Polypropylene (PP) are saturated polyolefins dominated by –CH2– and –CH3– functional groups and their Raman spectra are characterized by strong aliphatic C–H stretching vibrations in the high-wavenumber region. The band at ~2850–2868 cm−1 is assigned to symmetric CH2 stretching, indicative of long, linear hydrocarbon chains and confirming the saturated nature of these polymers. The region ~2870–2890 cm−1 corresponds to symmetric CH3 stretching, which is more pronounced in PP due to its pendant methyl groups, while a peak near ~2880 cm−1 further reflects CH2 stretching typical of polyethylene and long-chain alkanes. Collectively, these features confirm the dominance of saturated hydrocarbon backbones in PE and PP microplastics.
In contrast, Polystyrene (PS), an aromatic polymer, exhibits distinct Raman signatures arising from phenyl ring vibrations and unsaturated carbon bonding. A characteristic band at ~3043 cm−1, attributed to aromatic = C–H stretching, provides a clear diagnostic marker distinguishing PS from aliphatic polymers and confirms the presence of benzene ring structures. Weak bands observed in the ~2160–2166 cm−1 region are atypical for conventional polyolefins and Raman bands in the 2100–2300 cm−1 region may indicate triple-bond-related vibrations (e.g., –C≡C– and –C≡N) and conjugated carbon systems [43,44,45]; however, these are not consistent with the intrinsic structure of polystyrene, polyethylene or polypropylene. As such functionalities are not inherent to these polymers, the observed signals are unlikely to originate from the native polymer backbone and are more plausibly associated with secondary processes, including thermo-oxidative degradation, environmental weathering, contamination, or residual chemical modifications. Accordingly, their assignment remains tentative [43,44,45,46,47].
Although PP and PS share a common –CH2–CH– backbone, leading to overlapping Raman bands such as C–C stretching (∼1000–1200 cm−1), CH2/CH3 bending (∼1400–1500 cm−1) and C–H stretching (∼2800–3000 cm−1), systematic differences arise from the aromatic phenyl substituent in PS. π-electron conjugation within the benzene ring modifies local electron density and bond stiffness, resulting in subtle frequency shifts relative to PP. The higher mass and rigidity of the phenyl group, along with associated steric effects, further influence vibrational dynamics, intermolecular interactions, and chain packing [21,43,44,45,46,47].
Morphological distinctions also contribute to spectral variation: PP, being semi-crystalline, typically exhibits sharper and more defined bands, whereas PS, predominantly amorphous, shows broader peaks with slight positional variability. Despite overall similarities in backbone-related vibrations, PS can be unequivocally identified by its aromatic ring-breathing mode (~1000 cm−1) and C=C stretching (~1600 cm−1), which are absent in PP. Overall, the spectral regions at 2850–2900 cm−1 (aliphatic C–H stretching), ~3043 cm−1 (aromatic C–H stretching), and ~2160–2166 cm−1 (tentative triple-bond vibrations) provide robust diagnostic criteria for differentiating major microplastic types. These findings demonstrate the effectiveness of Raman spectroscopy as a rapid and reliable approach for microplastic identification and classification in environmental samples, supporting accurate monitoring and pollution assessment. Consistent with Qian et al. (2021) [21] microplastics study, the predominance of PE, PP, PS, PVC, and PA reflects their widespread origin from household and industrial sources (Figure 5a,b).
Figure 5.
Raman shift spectrum of microplastic contamination in (a) water and (b) sediment from the Pallikkaranai wetland.
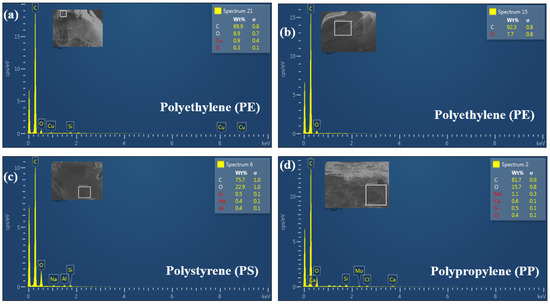
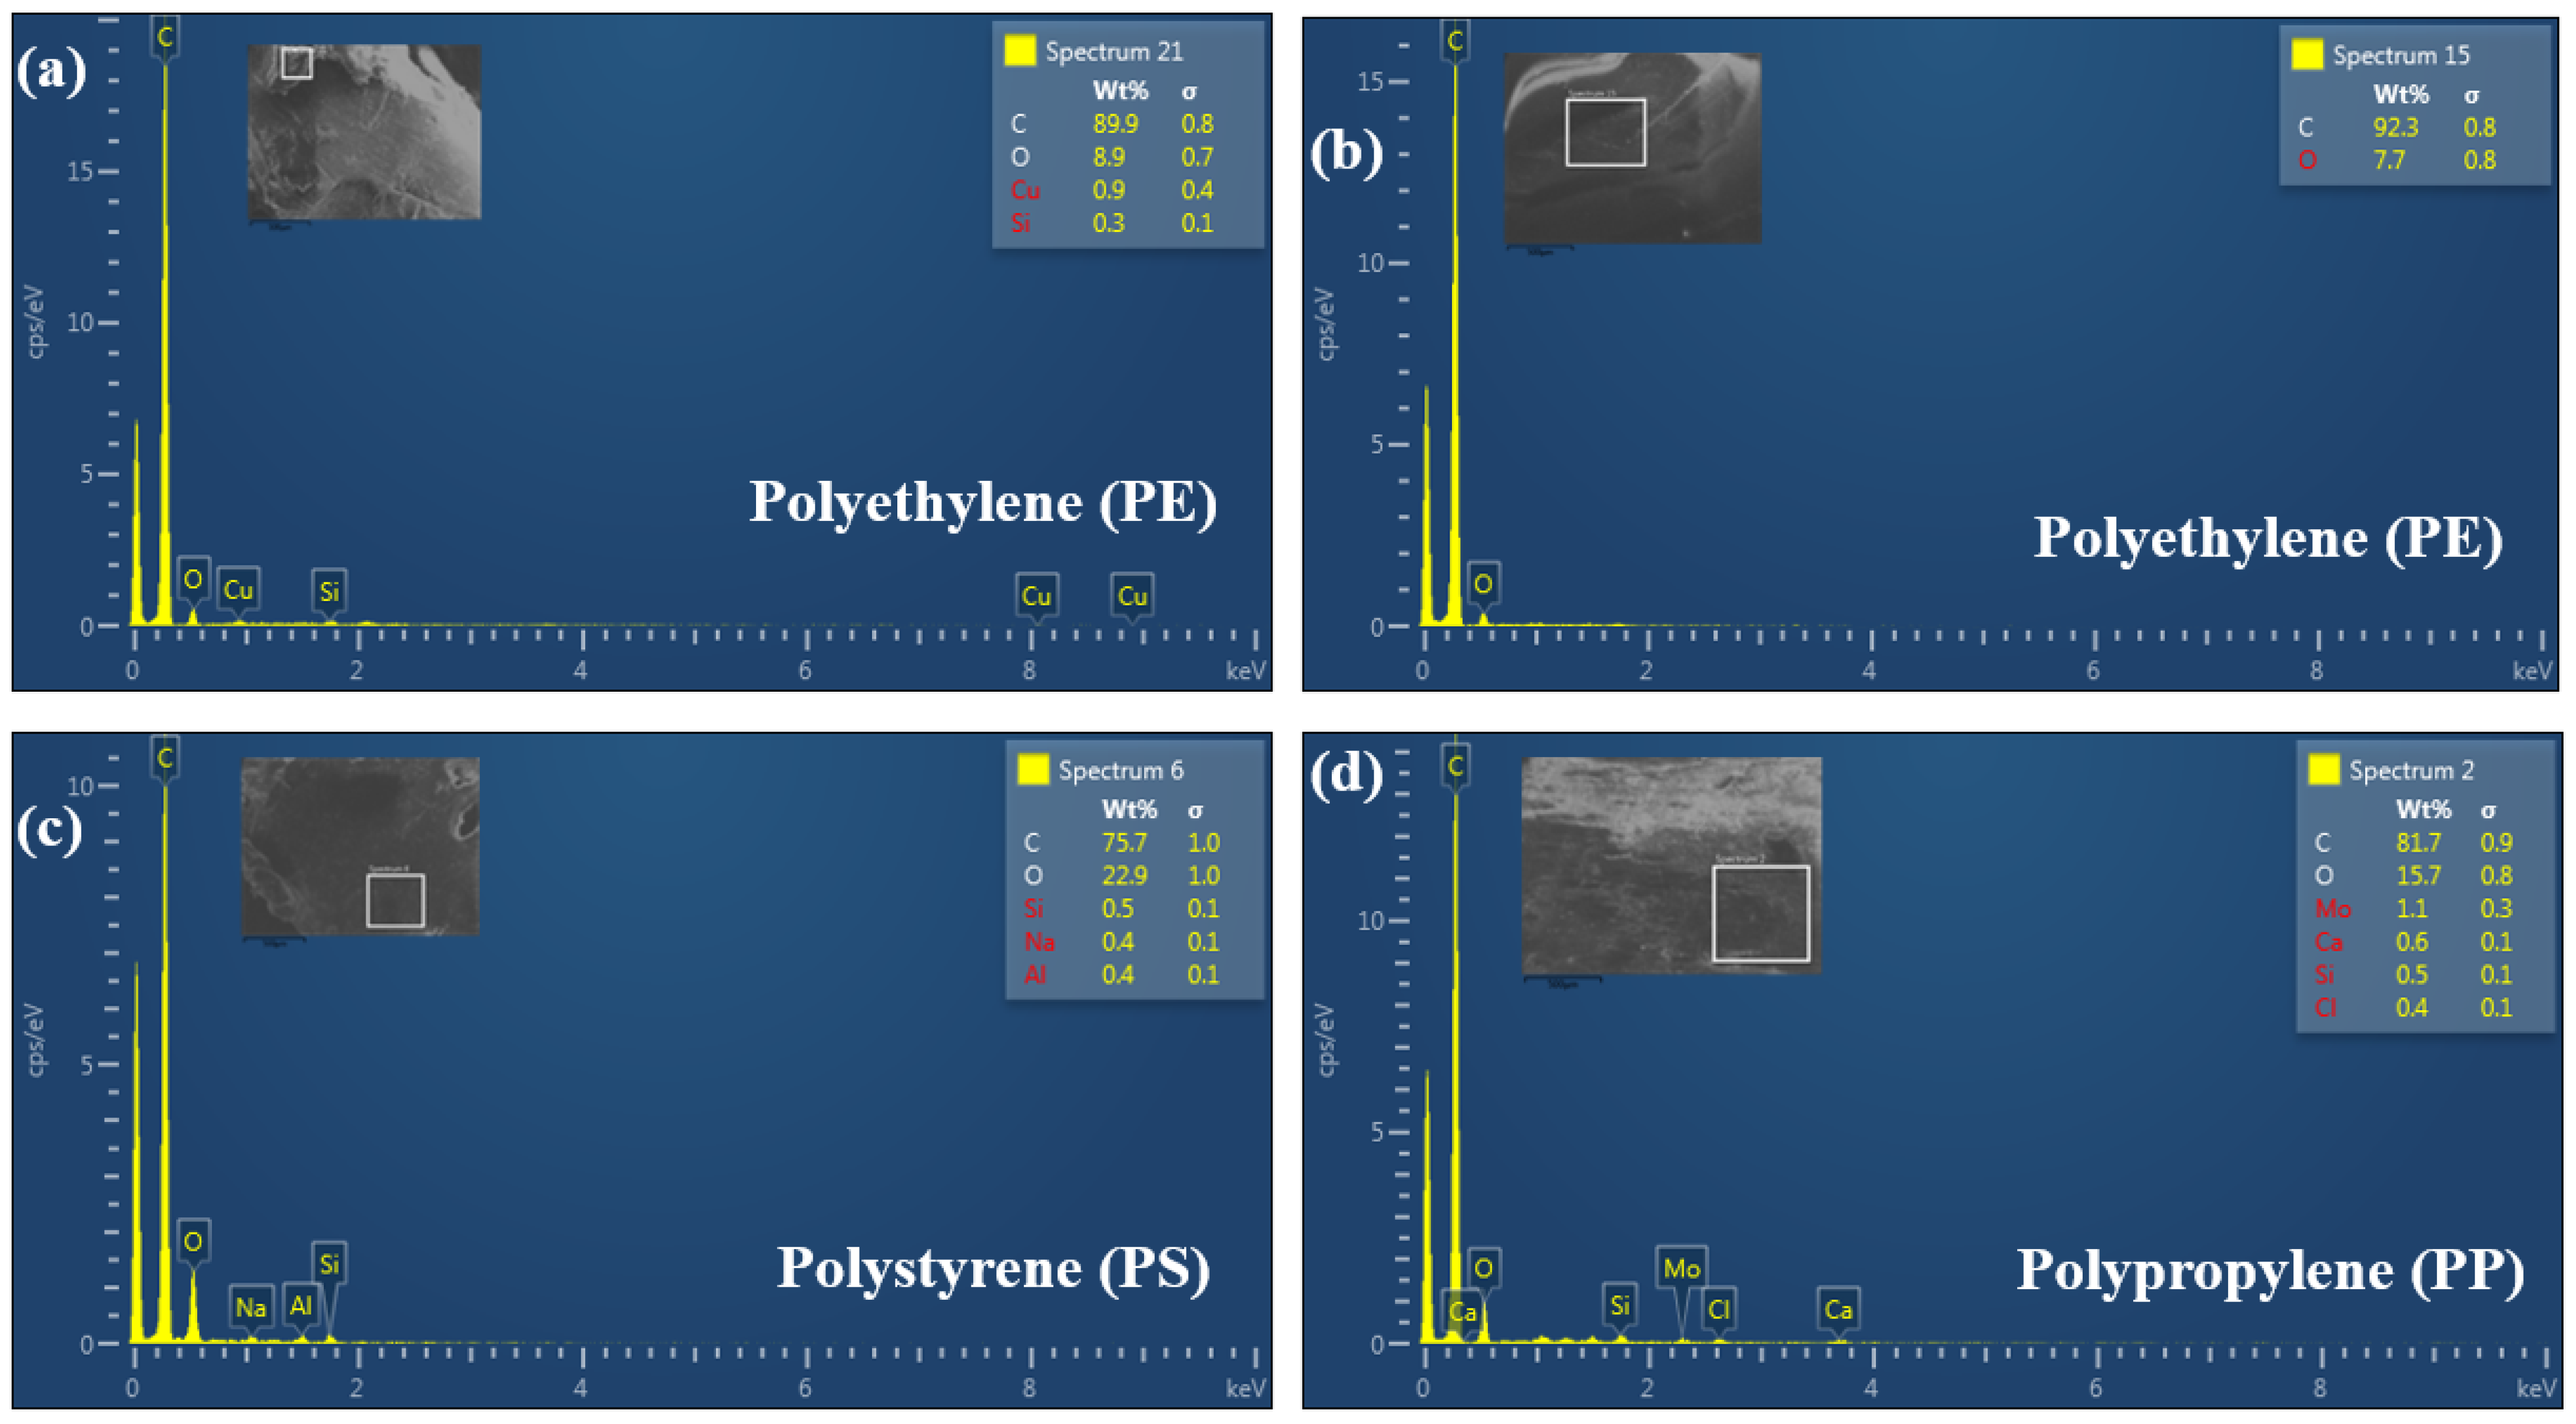
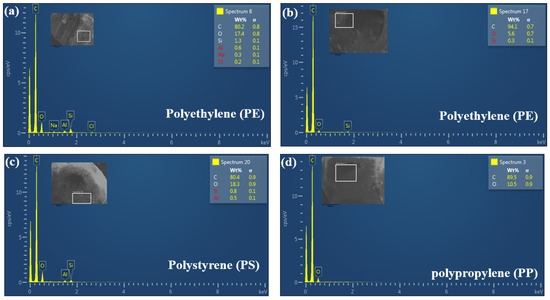
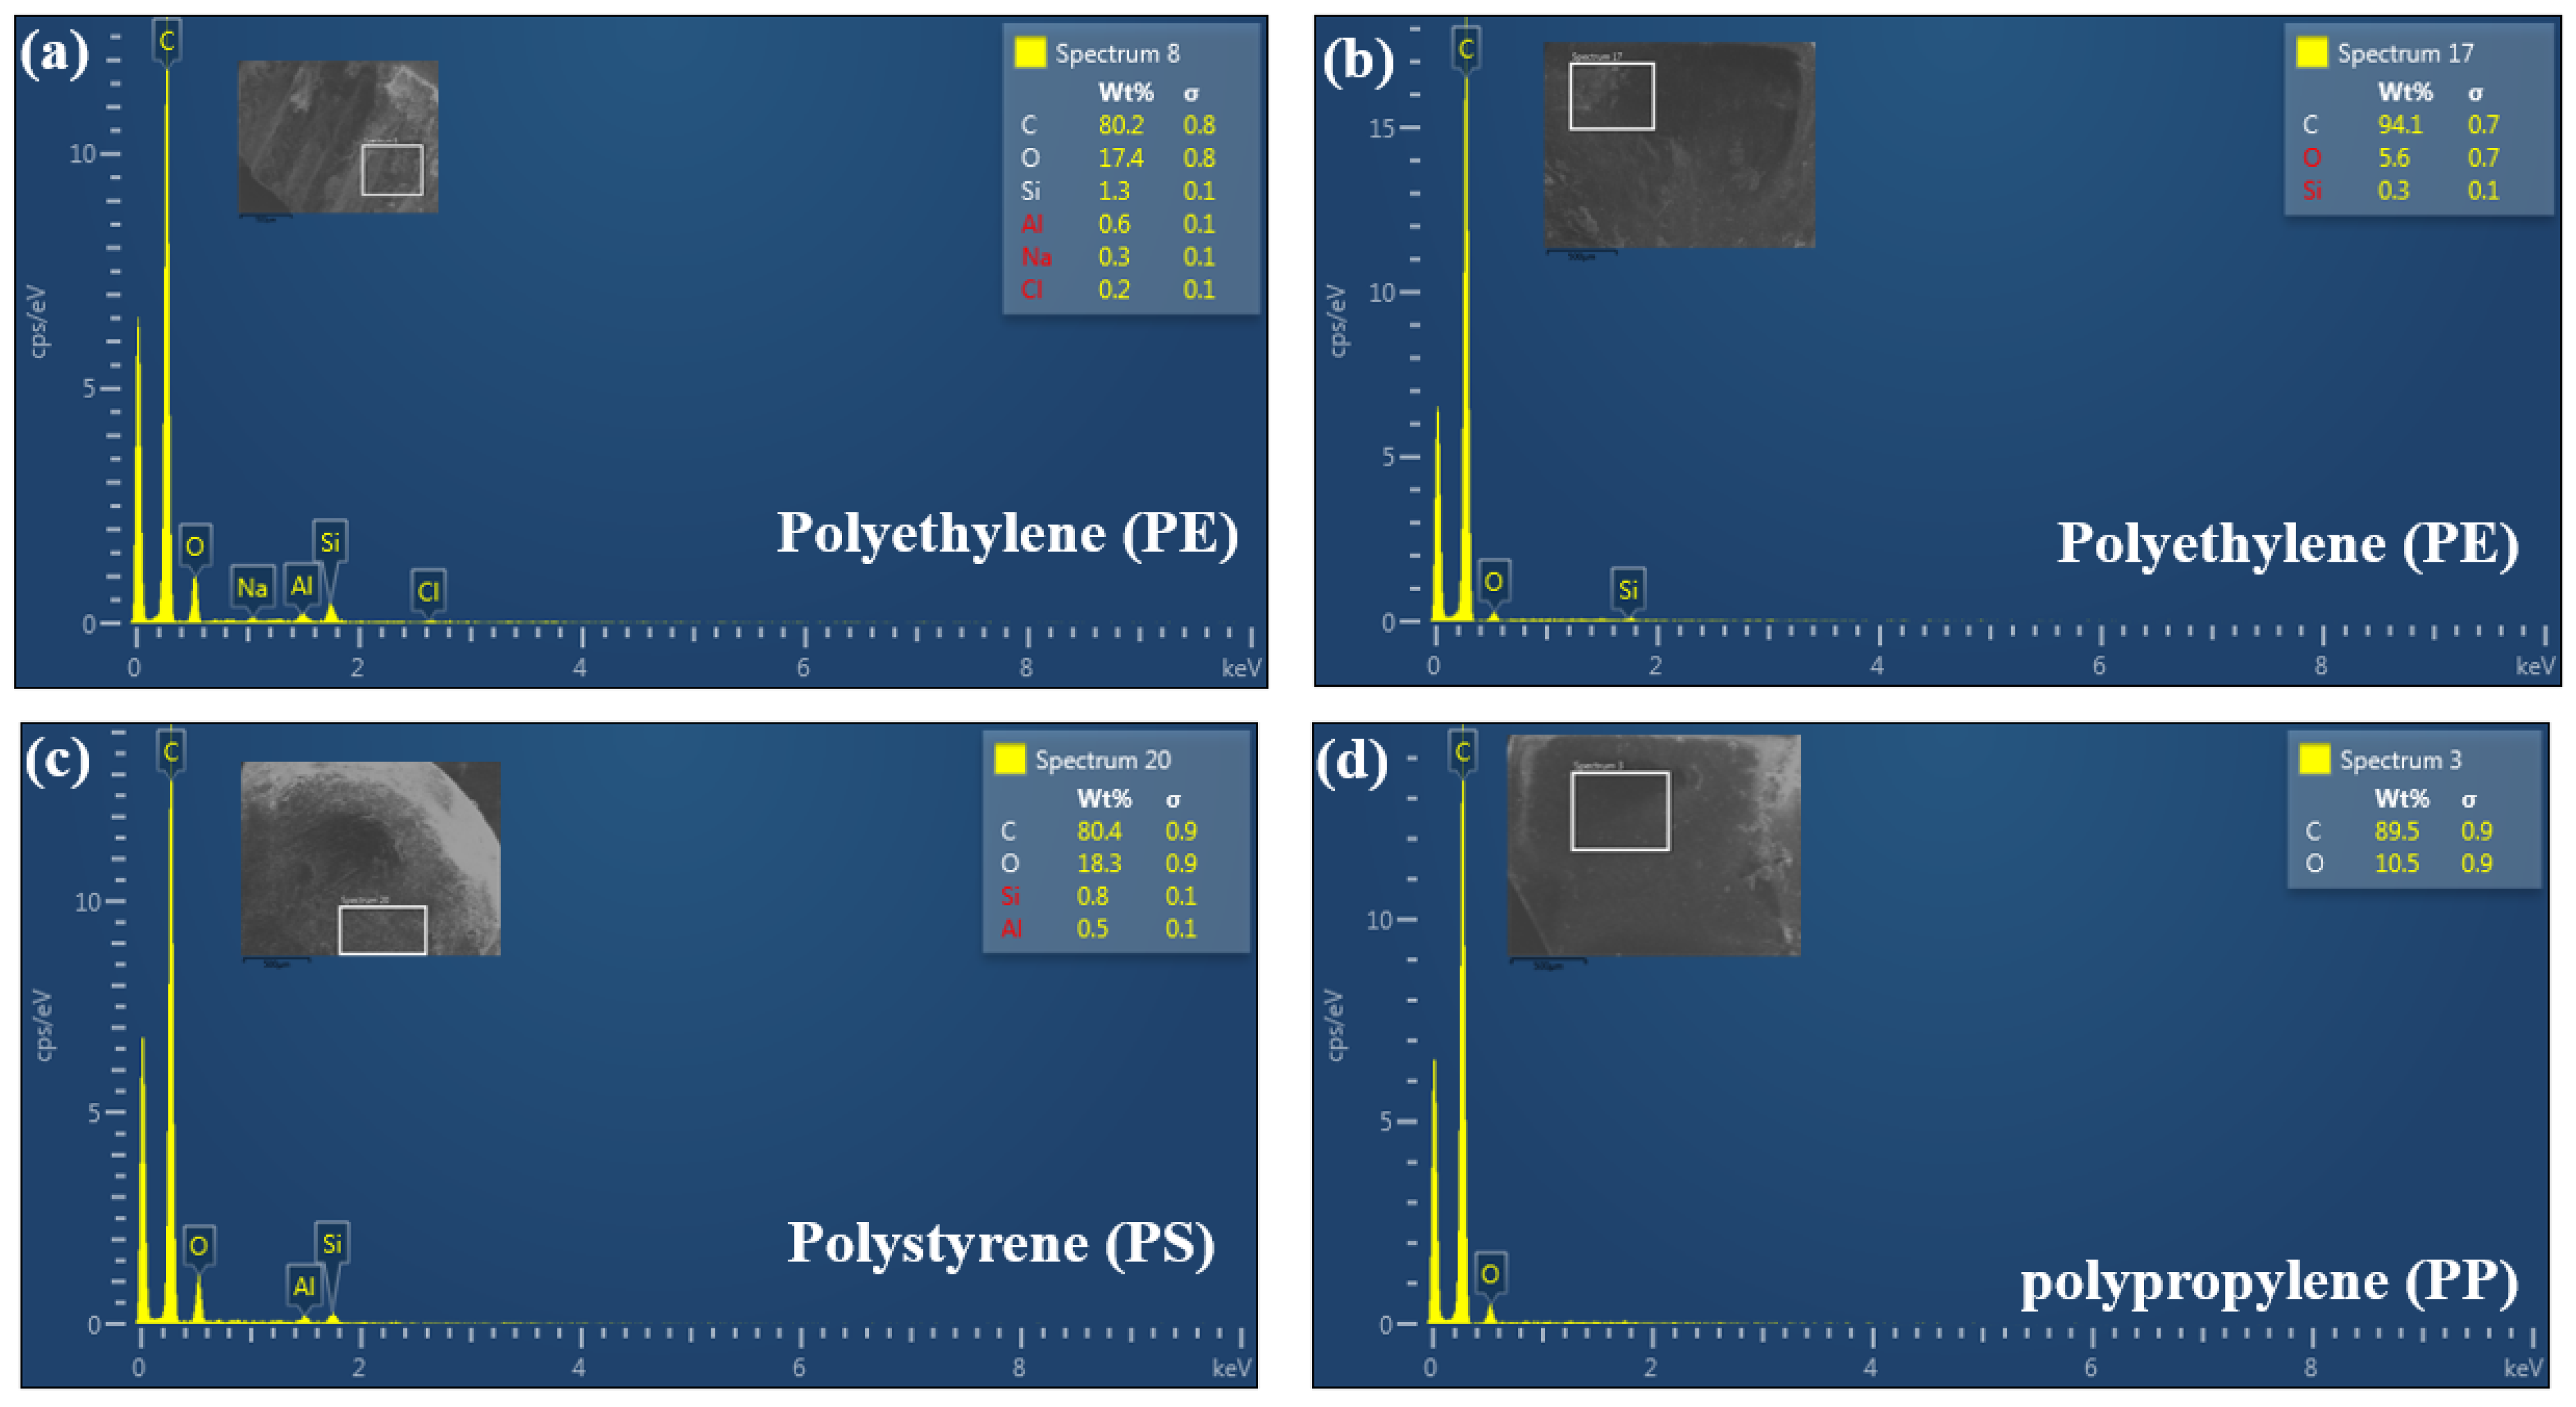
SEM-EDX analysis confirmed that the examined microplastic particles are predominantly carbon-based polymers, with carbon contributing 84.99 ± 5.20 wt% (88.66 ± 4.07 at%) and oxygen 13.79 ± 4.72 wt% (10.87 ± 3.84 at%). Minor trace elements, including silicon (0.67 ± 0.38 wt%), chlorine (0.35 ± 0.06 wt%) and calcium (0.66 ± 0.00 wt%), were also detected. SEM imaging further revealed smooth, non-porous surfaces characteristic of thermoplastic materials. The dominance of carbon, coupled with moderate oxygen content, confirms the hydrocarbon-based nature of the polymers, while the relatively elevated oxygen fraction suggests surface oxidation resulting from environmental weathering [24,48]. Trace elements are likely associated with adhered mineral particles, polymer additives and ambient contamination.
Collectively, the figures provide complementary insights into polymer composition and variability. SEM-EDX spectra and micrographs highlight the characteristic elemental signatures of common polymers such as polyethylene (PE), polypropylene (PP) and polystyrene (PS), serving as qualitative confirmation of polymer identity. In contrast, additional spectra from different particles of the same polymer types reveal variability in elemental composition. Although carbon remains dominant, variations in oxygen and the presence of elements such as Na, Al, Si and Cu indicate surface heterogeneity driven by environmental exposure, adsorption processes and potential biofouling.
Notably, the observed elemental proportions deviate slightly from ideal polymer compositions. The comparatively lower carbon and higher oxygen contents relative to pure polymers can be attributed to oxidation, aging and the accumulation of surface-bound impurities during environmental exposure [24,48]. Furthermore, differences between weight percentage (wt%) and atomic percentage (at%) reflect their distinct calculation bases: wt% represents mass contribution, whereas at% corresponds to the relative number of atoms. Due to its lower atomic mass, carbon appears proportionally higher in atomic % than in weight %. Overall, the combined elemental profiles and surface morphology are consistent with typical hydrocarbon polymers, while also demonstrating the influence of environmental processes that modify microplastic surfaces and contribute to compositional heterogeneity (Figure 6a–d and Figure 7a–d).
Figure 6.
SEM-EDS images of microplastics (a,b) Polyethylene [PE], (c) Polystyrene [PS], and (d) Polypropylene [PP]) showing polymer contamination in water from the Pallikkaranai wetland.
Figure 7.
SEM-EDS images of microplastics (a,b) Polyethylene [PE], (c) Polystyrene [PS], and (d) Polypropylene [PP]) showing polymer contamination in sediment from the Pallikkaranai wetland.
Current observations on the MPs encountered in the wetland directly reflected the observations of Dąbrowska et al. (2022) [23], who found the EDX on MPs to have a more regular shape and smooth surface topography. They suggested that the SEM-EDX and numerical modeling enable a more detailed description of particles. Also, they used similar patterns of Raman spectroscopy and SEM-EDX to confirm the occurrence of MPs, and PE was most dominant in their study. Furthermore, the current use of SEM-EDX strongly agrees with the observation of Furfaro et al. (2022) [48], who suggested that the SEM-EDX allowed many potential microplastic particles to be screened in a relatively short time. SEM-EDX screening utilized surface morphology and elemental composition to determine whether each particle was potentially a plastic.
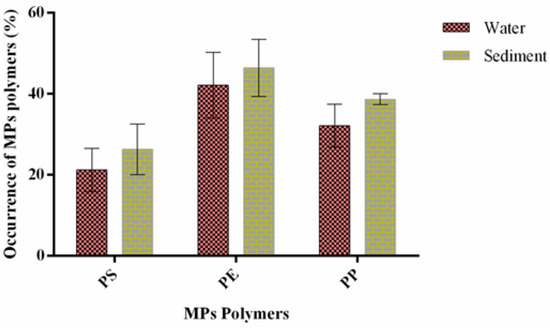
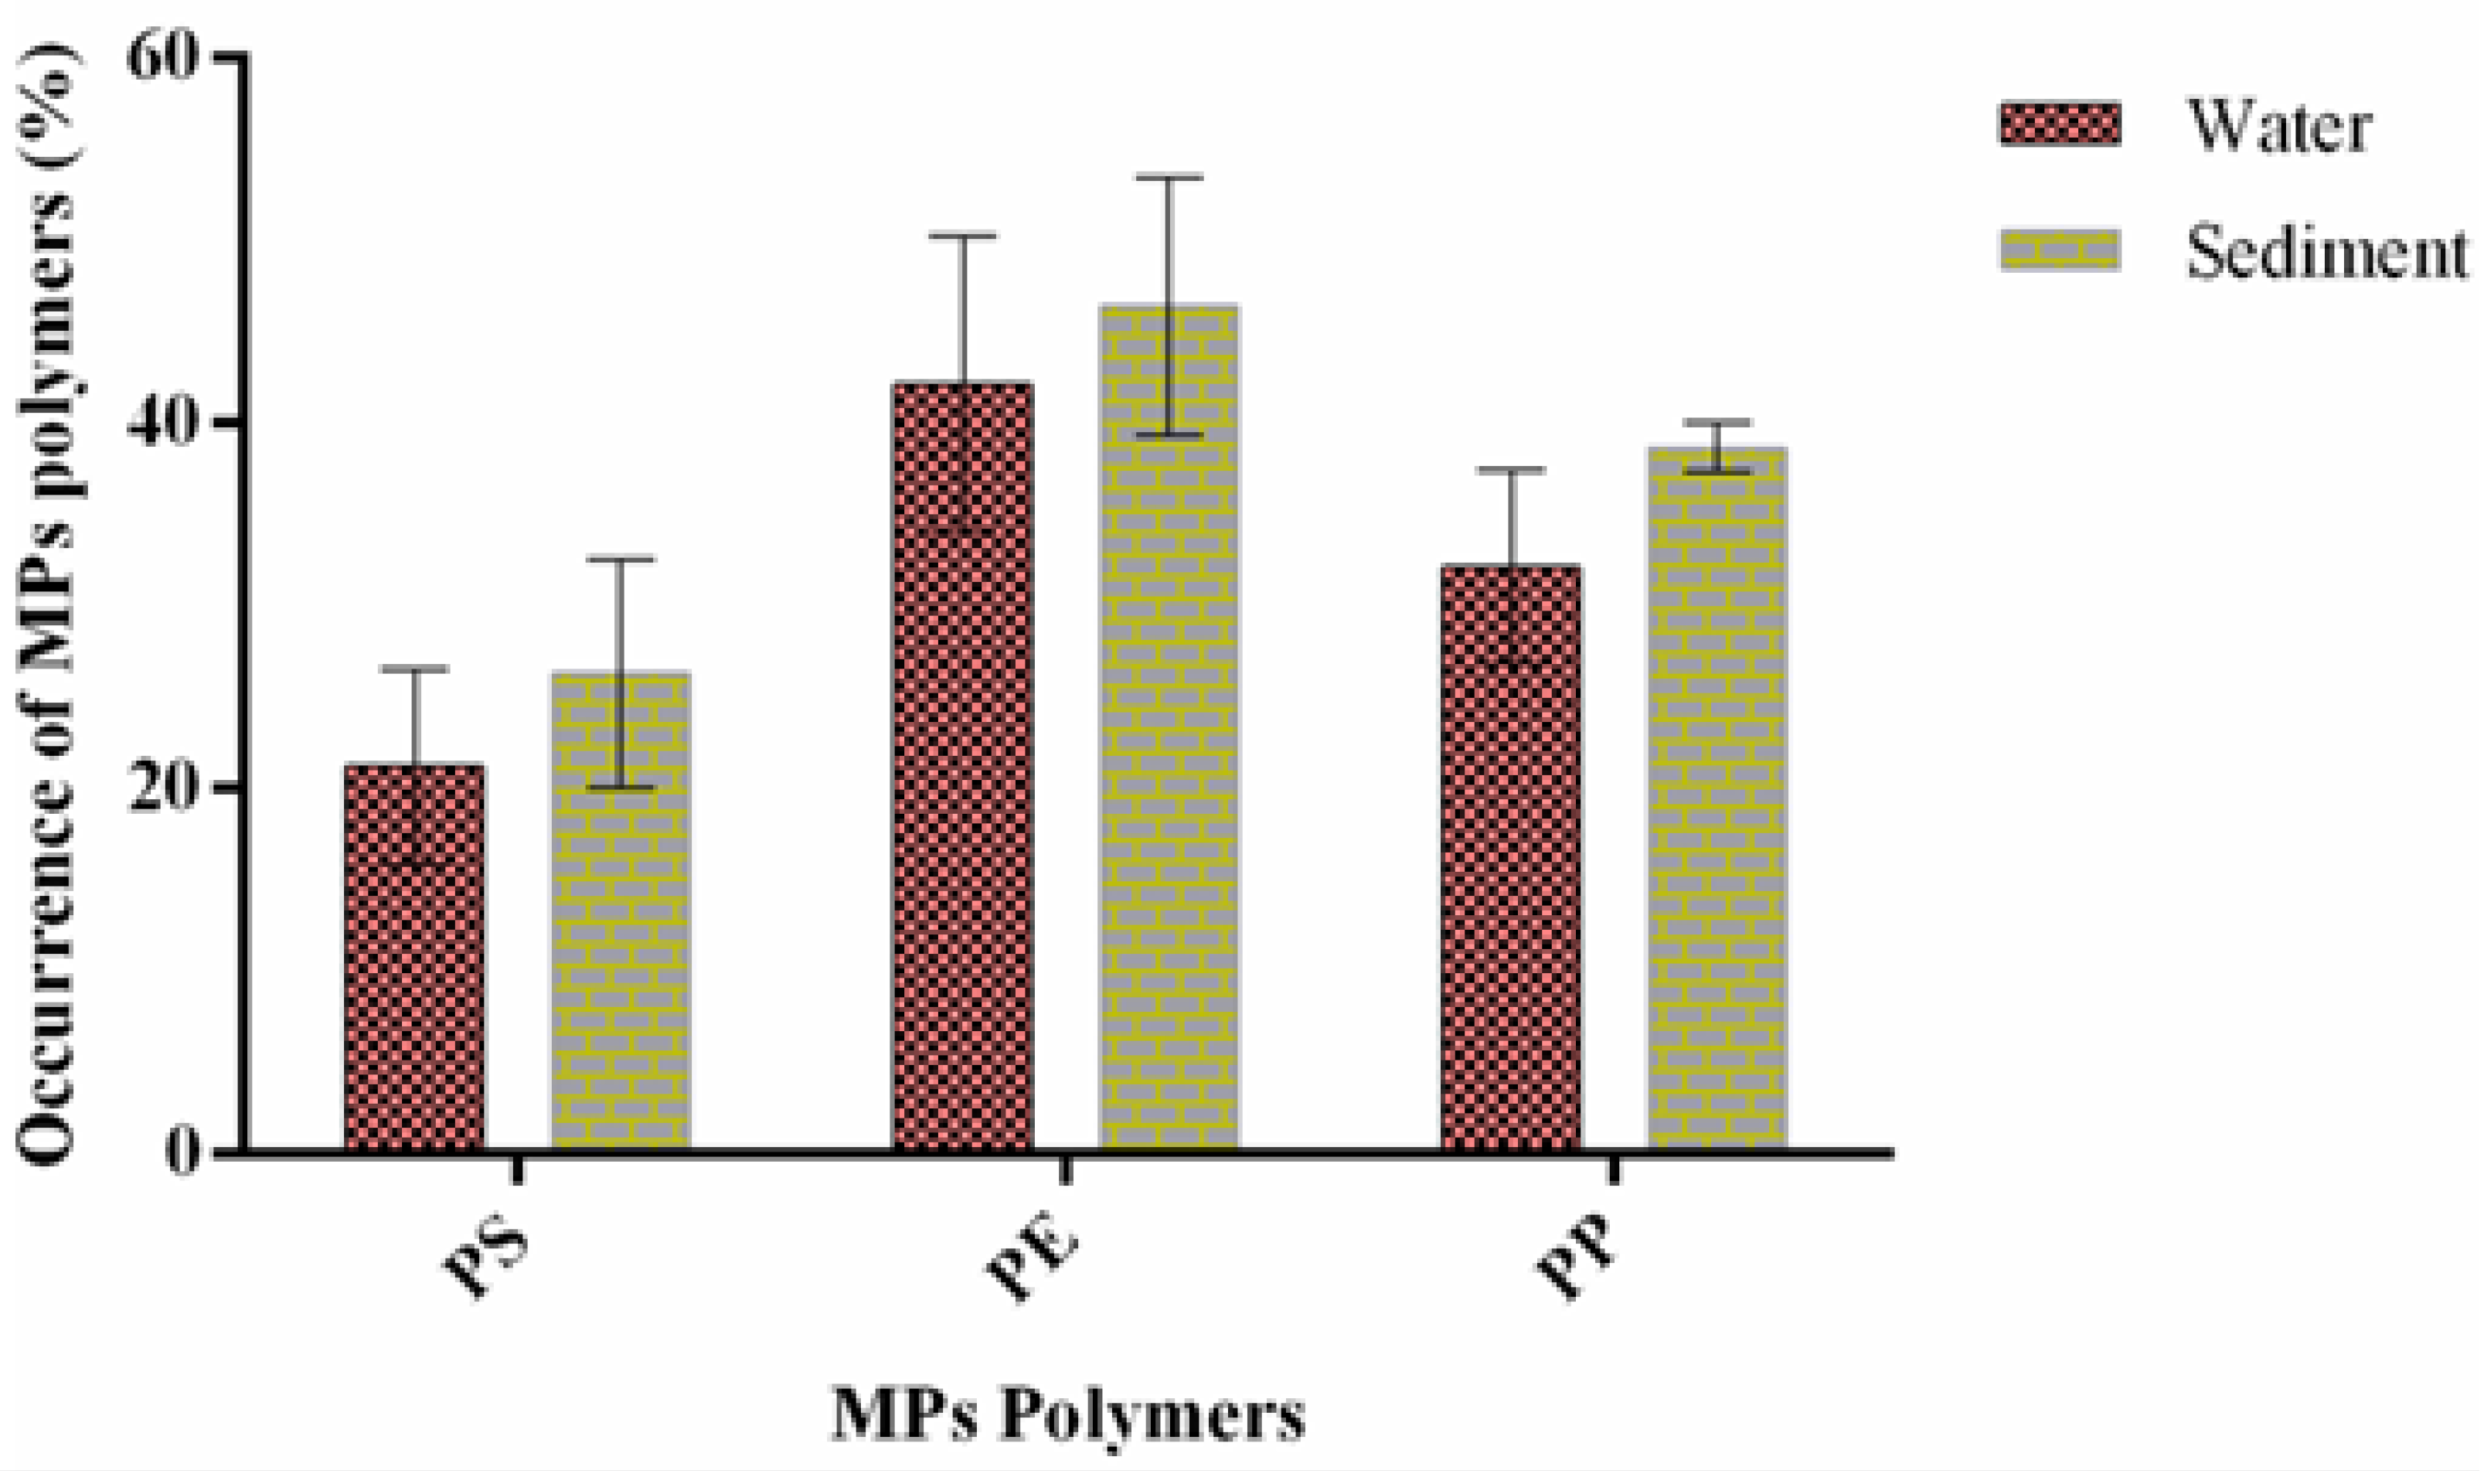
Raman spectroscopy and SEM-EDX analyses revealed that the dominant polymers in Pallikaranai wetland sediments and waters were polyethylene (PE: 45%), polypropylene (PP: 30%), and polystyrene (PS: 20%), with a small fraction of other polymers (5%) (Figure 8). The predominance of PE and PP is consistent with their widespread use in packaging, consumer goods and single-use plastics, which often enter wetlands through municipal solid waste dumping, stormwater inflow and direct littering. PS fragments and foams, though less abundant, are typically linked to food containers and construction materials. The dominance of lightweight thermoplastics (PE and PP), which have low densities (<1 g/cm3), suggests preferential transport and retention in surface waters and marsh sediments. Weathering signatures detected in SEM-EDX, including surface cracking and oxygen incorporation, further indicate environmental degradation of plastics within the wetland matrix. Comparable dominance of PE and PP has been reported in other inland and coastal wetlands worldwide [16,23,48], underscoring the global ubiquity of these polymers in aquatic ecosystems. Their persistence and hydrophobic nature increase the likelihood of biofilm colonization, chemical adsorption, and trophic transfer, thereby amplifying ecological risks for invertebrates, fish and migratory birds inhabiting Pallikaranai.
Figure 8.
Percentage composition of polymer types (polyethylene [PE], polypropylene [PP], and polystyrene [PS]) indicating polymer contamination in sediments from the Pallikkaranai Wetland.
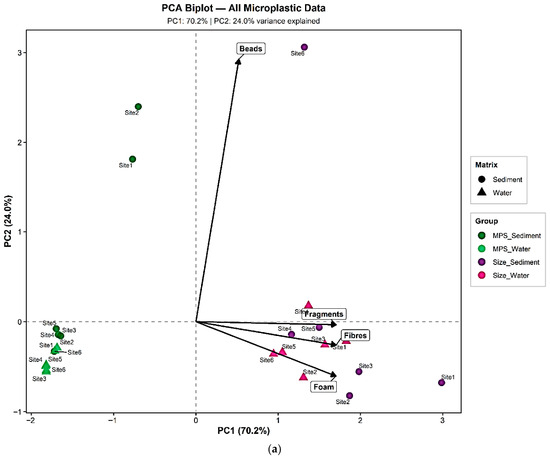
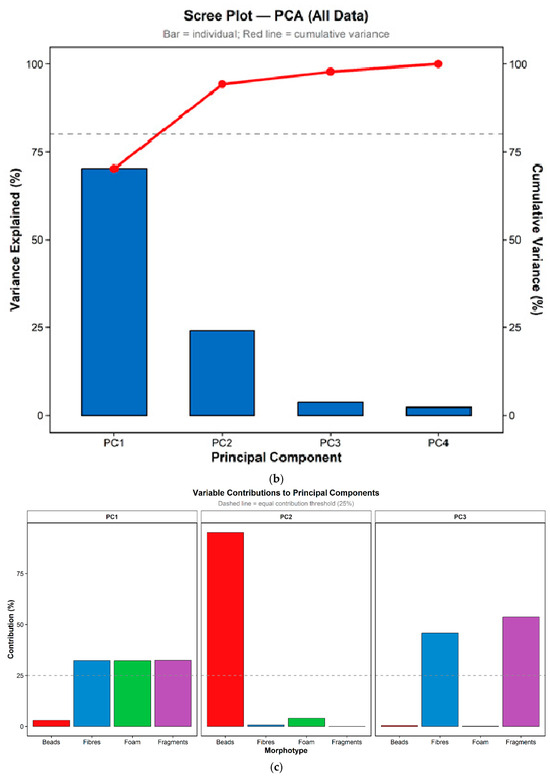
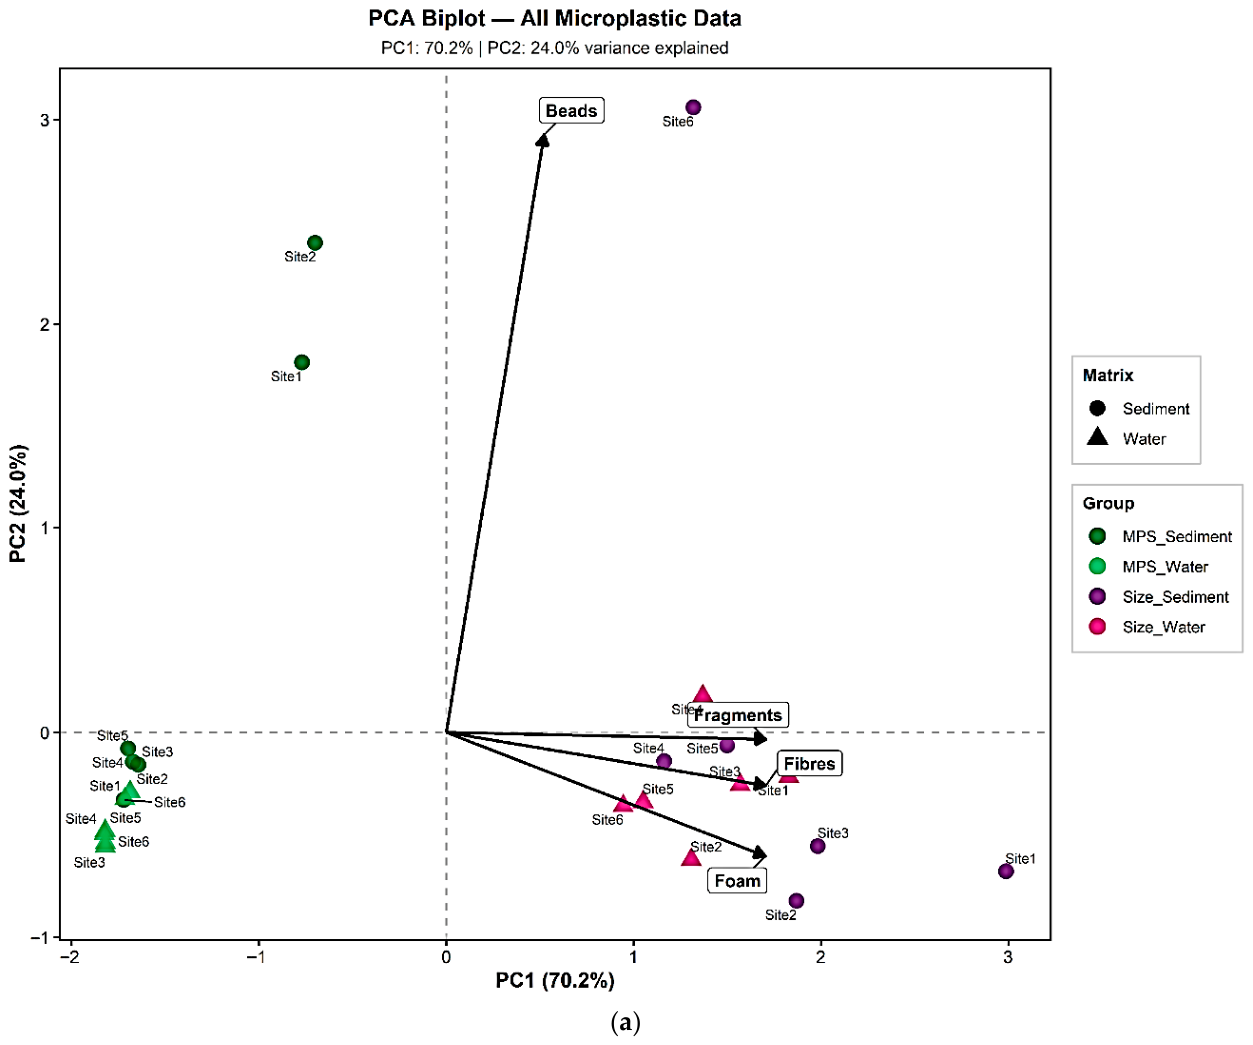
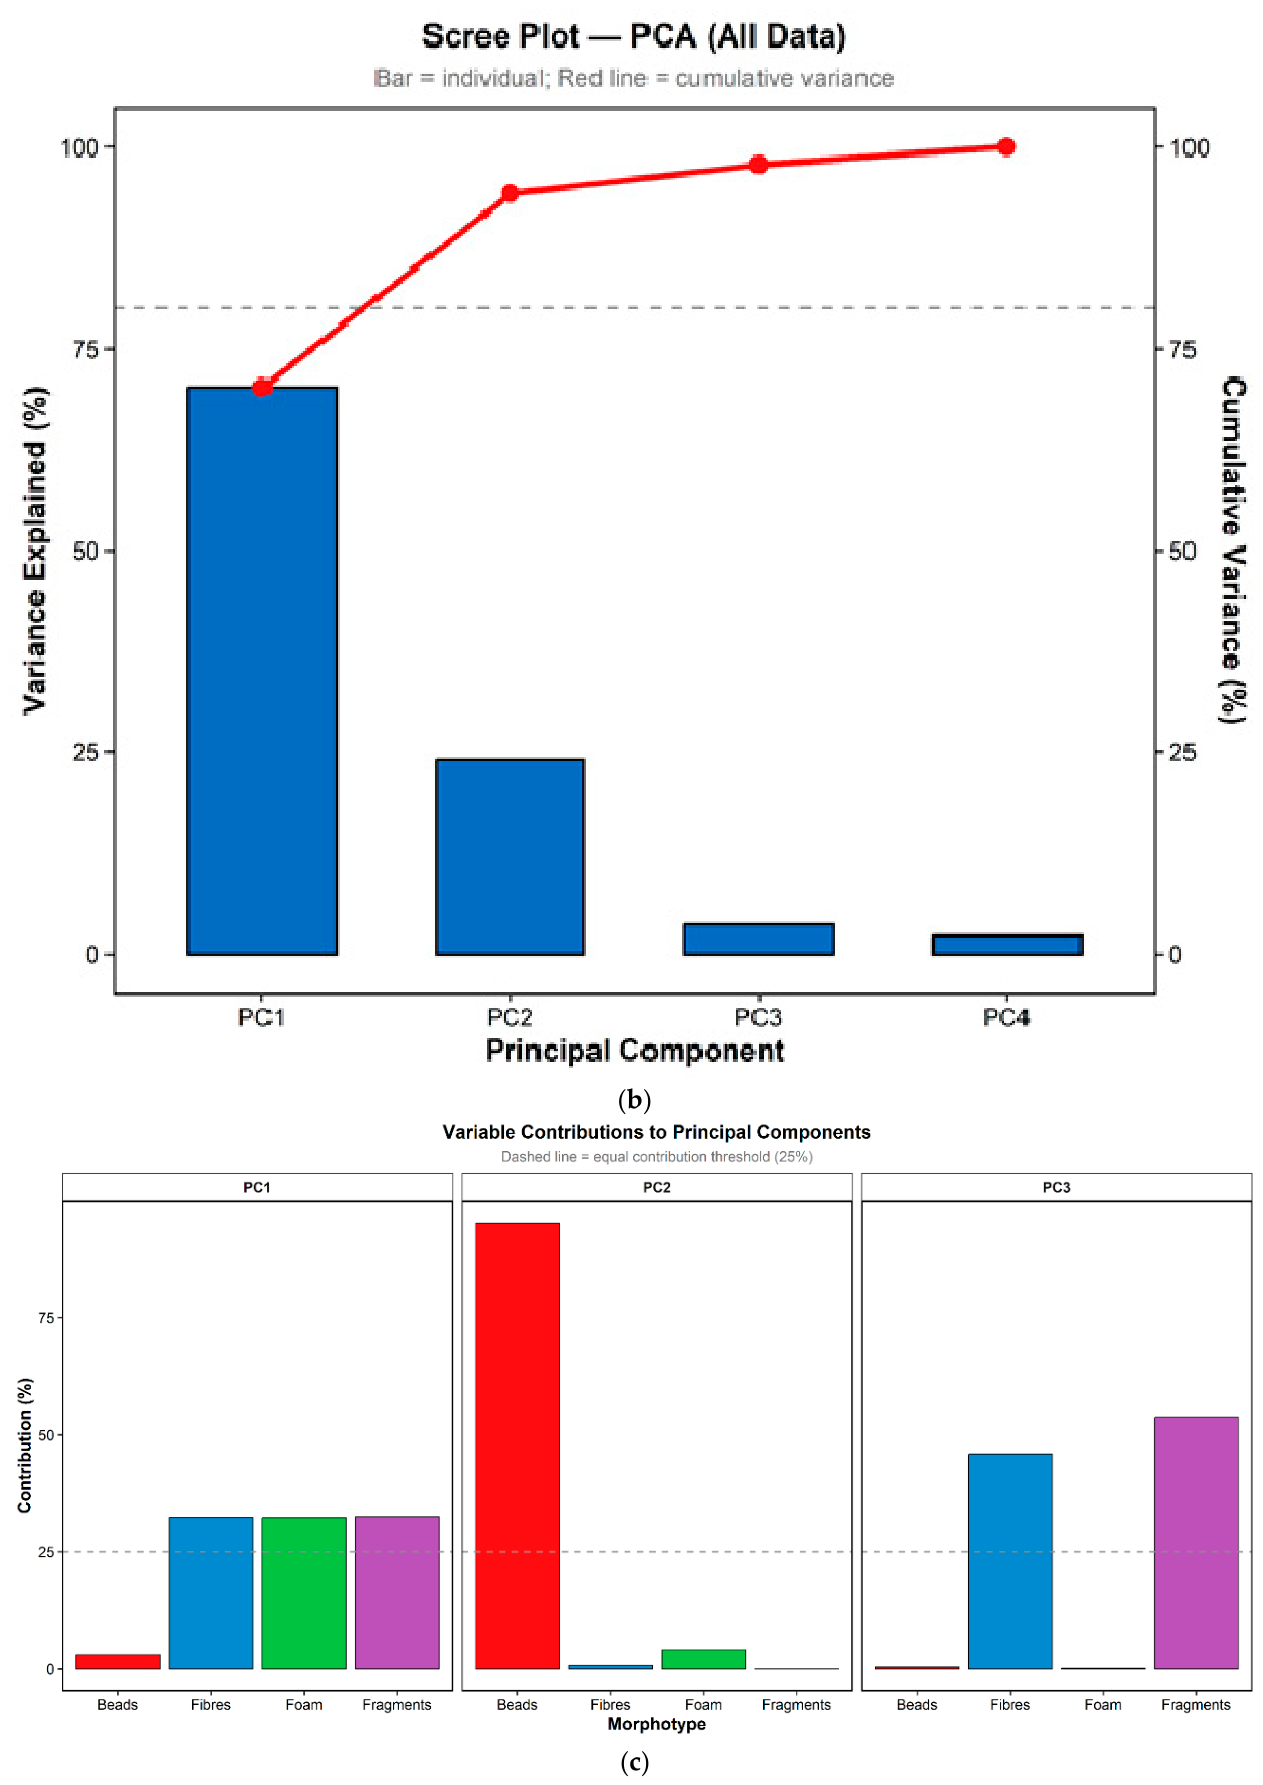
Microplastic contamination in the Pallikaranai wetland was consistently high across all six sampling sites, with fibers dominating the assemblage, followed by foam and fragments, while beads were comparatively less abundant. Sites 1 and 2 exhibited the highest overall microplastic loads, particularly driven by fibers and foam, whereas Site 6 showed lower fiber abundance but relatively greater variability in beads and fragments. To better understand patterns in morphotype distribution, a principal component analysis (PCA) was conducted using standardized abundance data for fibers, fragments, foam and beads. The first two principal components explained the majority of the total variance, with PC1 accounting for 70.2% and PC2 for 24.0% (cumulative 94.2%).
Interpretation of the components was based on variable loadings. PC1 was characterized by strong and comparable positive loadings from fibers, fragments and foam (each contributing approximately 30–33%), indicating that these morphotypes co-vary across sites. This component therefore represents a shared distribution pattern, likely reflecting common sources, transport pathways and deposition processes. In contrast, PC2 was dominated by beads (>90% loading), with minimal contribution from other morphotypes, indicating that bead-type microplastics vary independently of the dominant forms. This suggests that beads are associated with distinct sources and environmental behavior, potentially linked to localized inputs such as personal care products or industrial materials. Overall, the PCA reveals two key patterns: (i) a dominant gradient driven by the co-occurrence of fibers, fragments and foam; and (ii) a secondary, independent gradient defined by bead-type microplastics [3,6,10].
The spatial distribution of samples in PCA space further highlighted matrix-specific patterns. Sediment samples were generally associated with positive PC1 scores, reflecting higher abundances of fibers, fragments and foam, consistent with their greater propensity for deposition and accumulation in benthic environments [14,17]. Conversely, water samples were more dispersed and occasionally aligned with bead-associated gradients along PC2, indicating greater variability in suspended microplastic composition and the influence of hydrodynamic sorting. Size-based variables also contributed to this separation, with larger particles tending to align with positive PC1 values, suggesting selective retention of larger microplastics in sediments, whereas smaller particles remained more widely distributed in the water column [3,20].
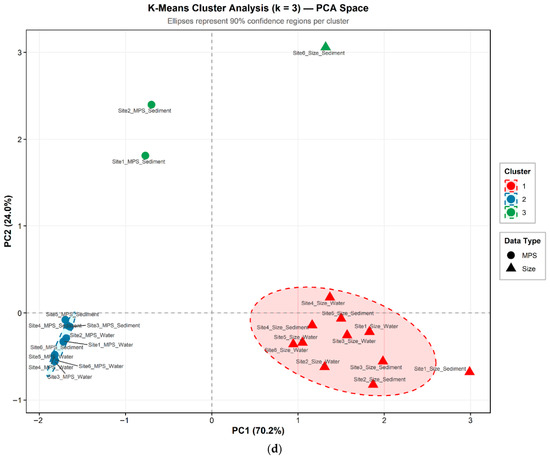
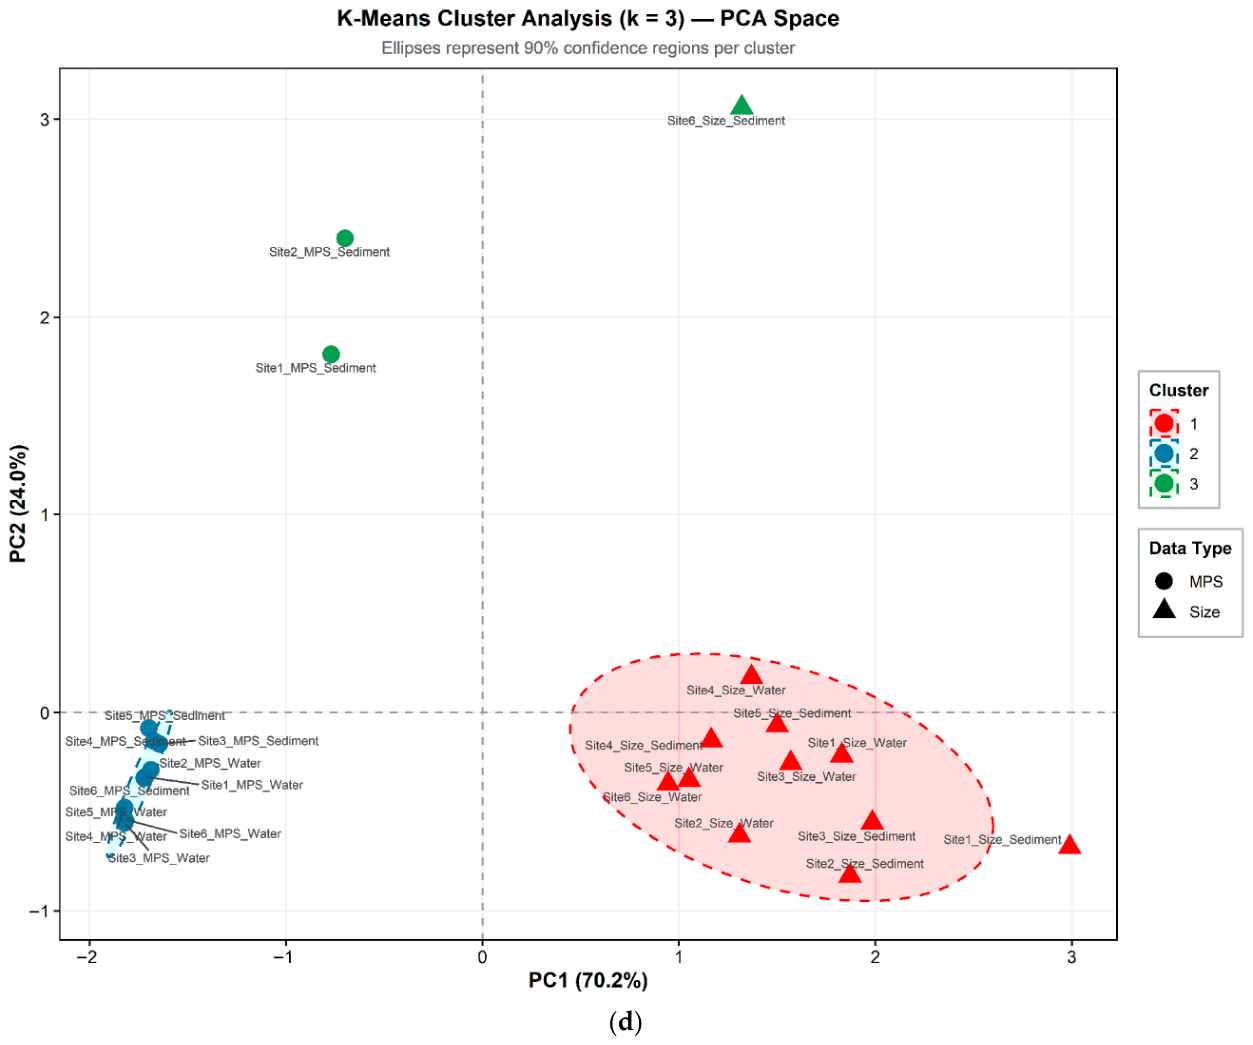
K-means clustering (k = 3) applied to the PCA scores further resolved these patterns by grouping samples into three distinct clusters. Cluster 1, located along the positive PC1 axis, was dominated by size-related variables from both sediment and water samples and exhibited a relatively broad dispersion. This indicates substantial heterogeneity in particle size distribution across sites, likely reflecting differences in fragmentation processes, hydrodynamic conditions, and local inputs. Cluster 2 formed a tightly grouped cluster on the negative side of PC1, primarily comprising morphotype (MPS) data from both matrices. The compact nature of this cluster suggests a relatively uniform distribution of dominant morphotypes (fibers, fragments, foam) across sites, pointing to widespread and consistent sources such as urban runoff, textile fibers and degraded plastic debris [6]. Cluster 3 was distinctly separated along PC2 and consisted mainly of sediment samples enriched in bead-type microplastics. The clear vertical separation reflects the strong influence of beads on PC2 and suggests localized inputs and depositional environments favoring their accumulation. This pattern may indicate proximity to specific anthropogenic sources and reduced hydrodynamic energy conditions that facilitate the settling of such particles.
Overall, the combined PCA and clustering results demonstrate that microplastic variability in the study area is primarily governed by morphotype composition and particle size, with additional differentiation driven by bead-specific inputs. The clear segregation between clusters underscores the role of environmental partitioning, where sediments act as sinks for larger and denser particles, while the water column reflects more dynamic and heterogeneous distributions. These findings highlight the importance of considering both physical characteristics and source-specific signatures when assessing microplastic pollution, as they provide critical insight into transport pathways, accumulation processes and potential ecological impacts (Figure 9a–d).
Figure 9.
(a) PCA biplot showing the distribution of samples based on morphotype and size variables, with PC1 (70.2%) and PC2 (24.0%) explaining the majority of variance. Arrows represent variable loadings (fibers, fragments, foam, and beads), indicating their contribution and direction of influence. Samples are differentiated by matrix (sediment and water) and data type (MPS and size). (b) Scree plot illustrating the percentage of variance explained by each principal component and the cumulative variance, highlighting the dominance of the first two components. (c) Variable contribution plots showing the relative contribution (%) of each morphotype to PC1–PC3, with the dashed line indicating the equal contribution threshold (25%). (d) K-means clustering (k = 3) projected onto PCA space, showing three distinct clusters with 90% confidence ellipses, representing grouping based on similarities in morphotype composition and particle size across sediment and water samples.
Therefore, microplastic contamination is a major threat to aquatic and wetland ecosystems, and this may affect the biological cycles of aquatic fauna in the wetlands worldwide. For example, microplastics occurrence and accumulation in the digestive tract of gudgeons was reported in the teleost fish Gobio gobio from rivers in France, and Gambusia holbrooki from Melbourne, Australia [49], which showed MP polyethylene, polyethylene terephthalate, polypropylene and cellophane with size ranges of 0.02–1 mm in their bodies. Studies indicate that MPs might provide a disturbance of the food webs in wetland ecosystems [50]. The ecological impact of microplastic polymers in freshwater ecosystems has been very rarely investigated. Therefore, the emerging microplastic contamination in freshwater ecosystems needs to be addressed in more detail [41]. Microplastic contamination may pose the greatest threat to wetland ecosystems, which are dominated by worms and crabs on their bottoms as well as zooplankton [50], and plankton, all of which are critical for ecosystem functioning within wetlands [36].
The Pallikaranai wetland supports diverse and largely endemic populations of amphibians, fish, vipers and mammals. When compared to Ramsar sites in southern India, the Pallikaranai attracts the greatest number of migratory birds [51,52]. Hence, the Pallikaranai wetland is also one of the most attractive habitats for indigenous and migratory birds. From June to December, many migratory and native birds use this wetland as their feeding and breeding ground [51,52]. As a result, the Indian government took numerous conservation measures to protect the area, and it was designated as a protected area by the Ministry of Environment and Forests (MoEF). Wetlands act as a major water resource in the dry season by recharging during dry periods, and the Pallikaranai wetland is responsible for the regulation of groundwater levels around Chennai, Chengalpattu and Kanchipuram (periphery of the Pallikaranai wetland) [51,52,53].
Therefore, conservation strategies are needed in this wetland to prevent future water crises and biodiversity concerns. With this evidence, there is no report yet on microplastic contamination at the site of Pallikaranai wetland. This study documented microplastic contaminations from both sediment and water samples, and biota of impact assessment under process and in future research on entire food webs are critical issues that need to be addressed.
3.5. Conservation Issues
The Pallikaranai wetland is a highly conserved area in Tamil Nadu. As a wetland, it is located near the Bay of Bengal, and it covers an area of about 80 square kilometers. The Pallikaranai wetland is Tamil Nadu’s only remaining natural wetland ecosystem [31,53,54]. It attracts a high number of migratory birds and provides aquatic habitats for the breeding and distribution of other aquatic biota, making it equal to the Ramsar site at Point Calimere [31,53,54] and slightly higher than the Kazhuveli and Vedanthangal Bird Sanctuary. Additionally, it comprises several rare or threatened and endangered species listed in the International Union for Conservation of Nature (IUCN) database. As a result, the Ramsar Convention was pushed by the biodiversity authority. Hence, it was added to the list of Ramsar sites on 2 February 2022, through the celebration of World Wetland Day 2022 [31]. It is now protected under the National Wetland Conservation and Management Program (NWCMP) and also by the project “Inland Wetlands of India” with the Ministry of Environment and Forests (MoEF) [31,53,54].
This wetland is also a major groundwater resource for three main districts: Chennai, Chengalpattu, and Kanchipuram [31,53,55]. This wetland is considered a reserve forest under the Tamil Nadu Forest Department (Gazette notification G.O.Ms. No. 52, dated 9 April 2007). According to the Central Pollution Control Board (CPCB), the average amount of garbage per day by one person is 0.4–0.8 kg [55]. Such all-solid waste is dumped in the Pallikaranai wetland near the open site of water flow into the Buckingham Canal towards the Bay of Bengal coastline. This dump yard (in operation since 1987) poses a serious threat to groundwater contamination. Devarajan et al. (2021) [51] reported that biomagnification, bioaccumulation, and bioconcentration are very dangerous to migratory birds, which feed on dead and live wetland fish in the Pallikaranai wetland. They suggest that this contamination comes from sewage, so that sewage treatment is essential for the conservation of the living wetland, and more comparative studies need to be conducted on different impacts on living species in the Pallikaranai wetland. Similarly, Koteswar Rao and Needhidasan (2018) [54] reported that the Pallikaranai wetland is continuously contaminated by plastic waste, including 8.86% of consumable plastic, 1.80% of industrial waste, and 33.98% of rubber and leather.
4. Conclusions and Future Directions
The Pallikaranai wetland, an internationally recognized ecological hotspot, demands urgent and quantitatively informed ecological risk assessments and targeted conservation strategies. This study revealed pervasive microplastic (MP) contamination across all sampled locations, with 100% detection frequency in both sediment and water matrices. Sediments exhibited markedly higher MP loads, accounting for the dominant environmental reservoir, with abundances exceeding those in the water column by several folds, underscoring their role as long-term sinks. Polymer characterization showed that polyethylene (PE) and polystyrene (PS) collectively constituted the majority (>70%) of identified MPs, while polypropylene (PP) contributed a smaller but consistent fraction. Morphological analysis indicated that fragments and fibers were the predominant forms, together comprising over 60% of total particles, followed by beads and foams, reflecting diverse degradation pathways and sources.
These quantitative patterns strongly implicate urban and household waste inputs as the primary drivers of contamination, further intensified by continuous sewage inflows. The high prevalence and accumulation of MPs raise significant concerns regarding bioaccumulation and trophic transfer from (Cyclopoid copepods: Mesocyclops thermocyclopoides and Thermocyclops hyalinus to native fishes of Anabas testudineus and Systomus sarana) [51,55], posing risks to both biodiversity and human health, particularly in light of previous evidence of MP infiltration into groundwater systems [56]. To ensure the long-term ecological resilience of the Pallikaranai wetland, future efforts must prioritize quantitative long-term monitoring frameworks, source apportionment studies and ecotoxicological evaluations on key biota. Integrated hydrogeological investigations are essential to assess MP transport pathways into groundwater and associated exposure risks. Concurrently, robust waste management interventions, policy enforcement and community-based restoration initiatives, such as native vegetation rehabilitation, are critical to reducing pollution loads. Sustained national commitment, reinforced by international collaboration and dedicated funding, will be indispensable for preserving the ecological integrity and ecosystem services of this Ramsar-listed wetland.
Author Contributions
Conceptualization, S.T.; Methodology, S.T., M.J., M.R., S.J. and J.-S.H.; Software, S.T., S.J., J.P.A., M.V. and P.M.; Validation, S.T., M.J., S.J., P.R., M.V., P.M. and J.-S.H.; Formal analysis, S.T., M.J., M.R., S.J., P.R., J.P.A. and J.-S.H.; Investigation, S.T., P.R. and J.-S.H.; Resources, M.J. and J.-S.H.; Data curation, S.T., M.R., P.R. and J.P.A.; Writing—original draft, S.T.; Writing—review and editing, S.T., M.R., S.J., P.R. and J.-S.H.; Visualization, S.T., M.J., M.V. and P.M.; Supervision, S.T., M.J. and J.-S.H.; Project administration, S.T.; Funding acquisition, J.-S.H. All authors have read and agreed to the published version of the manuscript.
Funding
Funding was provided by the National Science and Technology Council of Taiwan (Grant Nos. NSTC 112-2621-M-019-002, NSTC 113-2621-M-019-002 and NSTC 114-2621-M-019-003) to J.-S. Hwang and NSTC 112-2811-M-019-001, NSTC 113-2811-M-019-003, NSTC 114-2811-M-019-002 to S. Thirunavukkarasu.
Data Availability Statement
All data generated and analyzed during this study are available from the corresponding author upon reasonable request.
Acknowledgments
M. Muthukumar (Department of Geology, University of Madras, Chennai, Tamil Nadu, India) is acknowledged for framing GIS maps for the geographical illustration and representation of sampling points. Special thanks to Hans-Uwe Dahms, Department of Biomedical Science and Environmental Biology, Kaohsiung Medical University, Kaohsiung, Taiwan, for his valuable comments and suggestions to improve the version of the manuscript.
Conflicts of Interest
The authors declare no conflicts of interest.
References
- Chodankar, R.; Kalangutkar, N.G. Assessment of microplastic contamination and associated risks in agricultural soils: A case study along the National Highway-66, Goa, India. Environ. Monit. Assess. 2026, 198, 335. [Google Scholar] [CrossRef] [PubMed]
- Mhapsekar, S.; Kalangutkar, N.G. Assessing Microplastic Contamination and Associated Risks in the Surface Waters of the Mandovi River: Upstream-to-Sink Study from Freshwater to Estuarine Mouth in Goa, India. Water Air Soil Pollut. 2025, 237, 63. [Google Scholar] [CrossRef]
- Xu, L.; Han, L.; Li, J.; Zhang, H.; Jones, K.; Xu, E.G. Missing relationship between meso- and microplastics in adjacent soils and sediments. J. Hazard. Mater. 2021, 424, 127234. [Google Scholar] [CrossRef]
- Zhang, K.; Cheng, M.C.Y.; Liu, M.; Xu, S.; Ma, Y.; Chau, H.S.; Cao, Y.; Yan, M.; Thoe, W.; Sun, S.W.C.; et al. Seasonal variations in the abundance and distribution of small-sized microplastics in Hong Kong’s marine waters. Mar. Pollut. Bull. 2026, 225, 119200. [Google Scholar] [CrossRef]
- Santodomingo, N.; Perry, C.; Waheed, Z.; Hussein, M.A.B.S.; Rosedy, A.; Johnson, K.G. Marine litter pollution on coral reefs of Darvel Bay (East Sabah, Malaysia). Mar. Pollut. Bull. 2021, 173, 112998. [Google Scholar] [CrossRef]
- Sheikhi, M.; Lupato, S.; Bianco, C.; Sethi, R.; Tiraferri, A. Plastic microfibers from household textile laundering: A critical review of their release and impact reduction. Crit. Rev. Environ. Sci. Technol. 2024, 54, 1501–1525. [Google Scholar] [CrossRef]
- Kershaw, P.J. Marine Plastic Debris and Microplastics—Global Lessons and Research to Inspire Action and Guide Policy Change; University of Surrey: Guildford, UK, 2016. [Google Scholar]
- Vanapalli, K.R.; Dubey, B.K.; Sarmah, A.K.; Bhattacharya, J. Assessment of microplastic pollution in the aquatic ecosystems—An indian perspective. Case Stud. Chem. Environ. Eng. 2020, 3, 100071. [Google Scholar] [CrossRef]
- Gurjar, U.R.; Xavier, K.A.M.; Shukla, S.P.; Jaiswar, A.K.; Deshmukhe, G.; Nayak, B.B. Microplastic pollution in coastal ecosystem off Mumbai coast, India. Chemosphere 2021, 288, 132484. [Google Scholar] [CrossRef]
- Jessieleena, A.; Rathinavelu, S.; Velmaiel, K.E.; John, A.A.; Nambi, I.M. Residential houses—A major point source of microplastic pollution: Insights on the various sources, their transport, transformation, and toxicity behaviour. Environ. Sci. Pollut. Res. 2023, 30, 67919–67940. [Google Scholar] [CrossRef] [PubMed]
- Fahrenfeld, N.L.; Arbuckle-Keil, G.; Beni, N.N.; Bartelt-Hunt, S.L. Source tracking microplastics in the freshwater environment. TrAC Trends Anal. Chem. 2018, 112, 248–254. [Google Scholar] [CrossRef]
- Mateos-Cárdenas, A.; O’Halloran, J.; Van Pelt, F.N.A.M.; Jansen, M.A.K. Rapid fragmentation of microplastics by the freshwater amphipod Gammarus duebeni (Lillj.). Sci. Rep. 2020, 10, 12799. [Google Scholar] [CrossRef]
- Eerkes-Medrano, D.; Thompson, R.C.; Aldridge, D.C. Microplastics in freshwater systems: A review of the emerging threats, identification of knowledge gaps and prioritisation of research needs. Water Res. 2015, 75, 63–82. [Google Scholar] [CrossRef]
- Nayak, A.; Bhushan, B. Wetland ecosystems and their relevance to the environment. In Practice, Progress, and Proficiency in Sustainability; IGI Global Scientific Publishing: Hershey, PA, USA, 2021; pp. 1–16. [Google Scholar] [CrossRef]
- Jiang, J.-J.; Hanun, J.N.; Chen, K.-Y.; Hassan, F.; Liu, K.-T.; Hung, Y.-H.; Chang, T.-W. Current levels and composition profiles of microplastics in irrigation water. Environ. Pollut. 2022, 318, 120858. [Google Scholar] [CrossRef]
- Liu, Y.; Liu, Y.; Li, Y.; Bian, P.; Hu, Y.; Zhang, J.; Shen, W. Effects of irrigation on the fate of microplastics in typical agricultural soil and freshwater environments in the upper irrigation area of the Yellow River. J. Hazard. Mater. 2023, 447, 130766. [Google Scholar] [CrossRef] [PubMed]
- Sruthy, S.; Ramasamy, E.V. Microplastic pollution in Vembanad Lake, Kerala, India: The first report of microplastics in lake and estuarine sediments in India. Environ. Pollut. 2016, 222, 315–322. [Google Scholar] [CrossRef]
- Bordós, G.; Urbányi, B.; Micsinai, A.; Kriszt, B.; Palotai, Z.; Szabó, I.; Hantosi, Z.; Szoboszlay, S. Identification of microplastics in fish ponds and natural freshwater environments of the Carpathian basin, Europe. Chemosphere 2018, 216, 110–116. [Google Scholar] [CrossRef]
- Slootmaekers, B.; Carteny, C.C.; Belpaire, C.; Saverwyns, S.; Fremout, W.; Blust, R.; Bervoets, L. Microplastic contamination in gudgeons (Gobio gobio) from Flemish rivers (Belgium). Environ. Pollut. 2018, 244, 675–684. [Google Scholar] [CrossRef] [PubMed]
- Yuan, W.; Liu, X.; Wang, W.; Di, M.; Wang, J. Microplastic abundance, distribution and composition in water, sediments, and wild fish from Poyang Lake, China. Ecotoxicol. Environ. Saf. 2018, 170, 180–187. [Google Scholar] [CrossRef]
- Qian, J.; Tang, S.; Wang, P.; Lu, B.; Li, K.; Jin, W.; He, X. From source to sink: Review and prospects of microplastics in wetland ecosystems. Sci. Total Environ. 2020, 758, 143633. [Google Scholar] [CrossRef] [PubMed]
- Dalvand, M.; Hamidian, A.H. Occurrence and distribution of microplastics in wetlands. Sci. Total Environ. 2022, 862, 160740. [Google Scholar] [CrossRef]
- Dąbrowska, A.; Mielańczuk, M.; Syczewski, M. The Raman spectroscopy and SEM/EDS investigation of the primary sources of microplastics from cosmetics available in Poland. Chemosphere 2022, 308, 136407. [Google Scholar] [CrossRef]
- Girão, A.V. SEM/EDS and Optical Microscopy Analysis of Microplastics. In Handbook of Microplastics in the Environment; Springer: Cham, Switzerland, 2022; pp. 57–78. [Google Scholar] [CrossRef]
- Özgenç, E. Advanced analytical techniques for assessing and detecting microplastic pollution in water and wastewater systems. Environ. Qual. Manag. 2024, 34, e22217. [Google Scholar] [CrossRef]
- Dümichen, E.; Eisentraut, P.; Bannick, C.G.; Barthel, A.-K.; Senz, R.; Braun, U. Fast identification of microplastics in complex environmental samples by a thermal degradation method. Chemosphere 2017, 174, 572–584. [Google Scholar] [CrossRef] [PubMed]
- Rafey, A.; Siddiqui, F.Z. A review of plastic waste management in India—Challenges and opportunities. Int. J. Environ. Anal. Chem. 2021, 103, 3971–3987. [Google Scholar] [CrossRef]
- Ramsar. List of Ramsar Sites [WWW Document]. 2022. Available online: https://rsis.ramsar.org (accessed on 14 May 2026).
- CPCB. Assessment and Quantification of Plastic Waste Generation in Major Cities. Technical Report, CENTRAL POLLUTION CONTROL BOARD (CPCB). 2015. Available online: https://optoce.no/wp-content/uploads/2019/03/CPCBCIPET-Assessment-and-Quantification-of-Plastics-Waste_2015.pdf (accessed on 3 May 2023).
- Sheavly, S.B. National Marine Debris Monitoring Program: Final program report, data analysis and summary. In Prepared for US Environmental Protection Agency by Ocean Conservancy; Grant 76; U.S. Environmental Protection Agency by Ocean Conservancy: Washington, DC, USA, 2007. [Google Scholar]
- Jessieleena, A.A.; Nambi, I.M. Distribution of microplastics in the catchment region of Pallikaranai marshland, a Ramsar site in Chennai, India. Environ. Pollut. 2022, 318, 120890. [Google Scholar] [CrossRef] [PubMed]
- Jiang, C.; Yin, L.; Wen, X.; Du, C.; Wu, L.; Long, Y.; Liu, Y.; Ma, Y.; Yin, Q.; Zhou, Z.; et al. Microplastics in sediment and surface water of West Dongting Lake and South Dongting Lake: Abundance, source and composition. Int. J. Environ. Res. Public Health 2018, 15, 2164. [Google Scholar] [CrossRef] [PubMed]
- Bouwmeester, H.; Hollman, P.C.H.; Peters, R.J.B. Potential Health Impact of Environmentally Released Micro- and Nanoplastics in the Human Food Production Chain: Experiences from Nanotoxicology. Environ. Sci. Technol. 2015, 49, 8932–8947. [Google Scholar] [CrossRef]
- Masura, J.; Baker, J.; Foster, G.; Arthur, C. Laboratory Methods for the Analysis of Microplastics in the Marine Environment: Recommendations for Quantifying Synthetic Particles in Waters and Sediments; IOC of UNESCO (Intergovernmental Oceanographic Commission): Paris, France, 2015; pp. 1–29. [Google Scholar] [CrossRef]
- Ugolini, A.; Ungherese, G.; Ciofini, M.; Lapucci, A.; Camaiti, M. Microplastic debris in sandhoppers. Estuar. Coast. Shelf Sci. 2013, 129, 19–22. [Google Scholar] [CrossRef]
- Wang, L.; Sead, F.F.; Khoshmanesh, M.; Sanati, A.M.; Su, K.; Ramavandi, B. Co-exposure of mercury and microplastics in aquatic food webs: A review of sources, bioaccumulation, and ecotoxicological risks. Mar. Pollut. Bull. 2025, 222, 118882. [Google Scholar] [CrossRef]
- Townsend, K.R.; Lu, H.-C.; Sharley, D.J.; Pettigrove, V. Associations between microplastic pollution and land use in urban wetland sediments. Environ. Sci. Pollut. Res. 2019, 26, 22551–22561. [Google Scholar] [CrossRef]
- Jeylaputheen, M.A.; Sekar, S.; Perumal, M.; Parthiban, A.; Roy, P.D.; Elzain, H.E.; Kamaraj, J. Urbanization increases microplastic pollution in beach sediments along the Chennai Coast, South India. Mar. Pollut. Bull. 2025, 224, 119137. [Google Scholar] [CrossRef]
- Ephsy, D.K.; Raja, S. Seasonal variation and distribution of microplastics in surface water and sediments of Coimbatore Lakes, India. Gondwana Res. 2026, 154, 310–322. [Google Scholar] [CrossRef]
- Rajeevan, S.; Vengasseril, S.F.; Shaji, A.; Joseph, J.; Thomas, L.C.; Purushothaman, A.; Jacob, J.C. Occurrence, Abundance, and Distribution of Microplastics in the basins of Kabani River, Wayanad, Western Ghats, India: A Baseline Assessment. Substantia 2026, 10, 99–108. [Google Scholar] [CrossRef]
- Ashjar, N.; Keshavarzi, B.; Moore, F.; Zarei, M.; Busquets, R.; Zebarjad, S.M.; Mohammadi, Z. Microplastics (MPs) distribution in Surface Sediments of the Freidounkenar Paddy Wetland. Environ. Pollut. 2022, 317, 120799. [Google Scholar] [CrossRef] [PubMed]
- Zhang, G.; Sun, J.; Zhan, Y.; Xiao, B.; Liu, H.; Wang, L. Bioaccumulation, trophic transfer, and health risk assessment of microplastics in the food web of Wuliangsuhai Lake, China: Higher risk for children. Environ. Pollut. 2026, 395, 127787. [Google Scholar] [CrossRef]
- Anandhan, K.; Muralisankar, T.; Yogeshwaran, A.; Thangal, S.H.; Janani, K.S. Microplastics Contamination in Water and Sediments: Seasonal and Spatial Distributions from the Urban Wetlands of Coimbatore, Tamilnadu, India. Water Air Soil Pollut. 2025, 236, 475. [Google Scholar] [CrossRef]
- Chen, C.; Kehr, G.; Fröhlich, R.; Erker, G. Carbon−Carbon bond activation by 1,1-Carboboration of internal alkynes. J. Am. Chem. Soc. 2010, 132, 13594–13595. [Google Scholar] [CrossRef]
- Okamoto, N.; Ishikura, M.; Yanada, R. Cleavage of Carbon–Carbon triple bond: Direct transformation of alkynes to nitriles. Org. Lett. 2013, 15, 2571–2573. [Google Scholar] [CrossRef]
- Wang, T.; Jiao, N. Direct Approaches to Nitriles via Highly Efficient Nitrogenation Strategy through C–H or C–C Bond Cleavage. Acc. Chem. Res. 2014, 47, 1137–1145. [Google Scholar] [CrossRef]
- Su, L.; Nan, B.; Hassell, K.L.; Craig, N.J.; Pettigrove, V. Microplastics biomonitoring in Australian urban wetlands using a common noxious fish (Gambusia holbrooki). Chemosphere 2019, 228, 65–74. [Google Scholar] [CrossRef]
- Furfaro, G.; D’Elia, M.; Mariano, S.; Trainito, E.; Solca, M.; Piraino, S.; Belmonte, G. SEM/EDX analysis of stomach contents of a sea slug snacking on a polluted seafloor reveal microplastics as a component of its diet. Sci. Rep. 2022, 12, 10244. [Google Scholar] [CrossRef]
- Sanchez, W.; Bender, C.; Porcher, J.-M. Wild gudgeons (Gobio gobio) from French rivers are contaminated by microplastics: Preliminary study and first evidence. Environ. Res. 2013, 128, 98–100. [Google Scholar] [CrossRef]
- Thirunavukkarasu, S.; Santhoshkumar, S.; Rajendran, P.; Madhu, M.; Tseng, W.-L.; Hwang, J.-S. Microplastic pollution in zooplankton communities from an active shallow water hydrothermal vent, West Pacific, Taiwan. J. Environ. Chem. Eng. 2025, 13, 119021. [Google Scholar] [CrossRef]
- Devarajan, M.; Muralidharan, S.; Prakasham, K.; Nambirajan, K. Variation in polycyclic aromatic hydrocarbon contamination between native and introduced species of fishes of Pallikaranai Wetland, Chennai, Tamil Nadu, India. Bull. Environ. Contam. Toxicol. 2021, 107, 459–465. [Google Scholar] [CrossRef] [PubMed]
- Nagarajan, V.M.; Yuvan, M.; Srinivasan, R.; Satagopan, N.R.; Asokan, A.; Anooja, A. Status of important coastal habitats of North Tamil Nadu: Diversity, current threats and approaches for conservation. Reg. Stud. Mar. Sci. 2021, 49, 102106. [Google Scholar] [CrossRef]
- Packialakshmi, S.; Nagamani, K.; Anuradha, B. Hydrochemical Investigation and Water Quality Mapping in and Around Pallikaranai Marshland Area in Chennai, India. In Impacts of Urbanization on Hydrological Systems in India; Springer: Cham, Switzerland, 2023; pp. 25–42. [Google Scholar] [CrossRef]
- Koteswar Rao, M.; Needhidasan, S. Environmental impact assessment study in and around the Perungudi Pallikaranai dumping area, Chennai. Int. J. Pure Appl. Math. 2018, 119, 3103–3109. [Google Scholar]
- Altaff, K. Zooplankton diversity of freshwater lakes of Chennai, Tamil Nadu with reference to ecosystem attributes. Int. J. Life. Sci. 2019, 7, 236–248. [Google Scholar]
- Li, D.; Li, P.; Shi, Y.; Sheerin, E.D.; Zhang, Z.; Yang, L.; Xiao, L.; Hill, C.; Gordon, C.; Ruether, M.; et al. Stress-induced phase separation in plastics drives the release of amorphous polymer micropollutants into water. Nat. Commun. 2025, 16, 3814. [Google Scholar] [CrossRef] [PubMed]
Disclaimer/Publisher’s Note: The statements, opinions and data contained in all publications are solely those of the individual author(s) and contributor(s) and not of MDPI and/or the editor(s). MDPI and/or the editor(s) disclaim responsibility for any injury to people or property resulting from any ideas, methods, instructions or products referred to in the content. |
© 2026 by the authors. Licensee MDPI, Basel, Switzerland. This article is an open access article distributed under the terms and conditions of the Creative Commons Attribution (CC BY) license.