


Abstract
Microplastics have emerged as a major environmental health concern due to their environmental persistence, fragmentation, and widespread distribution. Conventional adsorption strategies often have limited efficiency, reuse, and scalability, and may generate secondary pollutants. This work explores the use of ferrotitaniferous sand milled for 4, 8, 12, 16, 32, and 52 h and subsequently functionalized with polyethylene glycol (PEG) for the removal of Polyethylene Terephthalate(PET) microplastics. The samples were characterized using Fourier-Transform infrared spectroscopy (FTIR), X-ray diffraction (XRD), Raman spectroscopy, and scanning electron microscopy (SEM). The average particle size of the samples decreases with the milling time from μm to μm. The magnetic properties enable rapid separation of sand–microplastic aggregates from water using magnets. Ferrotitaniferous sand exhibits soft ferrimagnetic behavior, with a maximum saturation of 50.09 emu/g. The remanence and coercivity increase as the average particle size decreases. Ultraviolet–visible (UV-Vis) spectroscopy was used to quantify the hydrothermally fragmented PET microparticles in water. The maximum microplastic adsorption removal was 95% within 30 s for the 12 h milled sample coated with PEG. The results show that PEG increases the samples’ adsorption capacity from 20.48 to 32.36 mg/g. The novelty of this work lies in the use of magnetic Ferrotitaniferous sands as a promising, sustainable resource for magnetic separation technologies.
1. Introduction
In recent years, plastic waste has become a deeply entrenched global issue due to massive production for a wide range of products. Global plastics production reached 430.9 million tonnes in 2024. However, only a fraction of post-consumer plastic waste is effectively recovered, while a substantial share is mismanaged, landfilled, incinerated, or released into the environment [1,2]. These plastics become nanoplastic and microplastic particles smaller than 5 mm after industrial production of primary plastics and through environmental degradation, spreading in water, soil, and other environmental media [3]. Since microplastics are present in this medium, human exposure to microplastics, especially in drinking water, is a greater concern, demanding efforts to remove them from water sources and other products [3,4].
The use of biomaterials and waste-derived adsorbents has emerged as a sustainable and cost-effective strategy for removing microplastics, aligning with circular economy principles [5]. There are several alternatives to produce sustainable magnetic nanoparticles that interact with microplastics and can be efficiently removed, using renewable resources and being environmentally friendly [6]. Recent studies focused on engineered magnetic nanoparticles or modified filtration media rather than natural ferrotitaniferous sands. Martin, Leisha et al. (2022) [2] report the use of an iron oxide nanoparticle-based method for magnetic separation of nanoplastics and microplastics from water, removing 100% of microparticles in a range of sizes from 2–5 mm and 90% of nanoplastics with a size range from 100 nm to 1000 nm using a permanent NdFeB magnet. Aragon et al. (2025) [7] investigated the magnetophoretic capture of microplastics by their assembly with magnetic nanoparticles, with a maximum removal of 75% at pH 5, 82% at pH 4.5, and 72% at pH 8, attributed to the contribution of carboxyl and hydroxyl groups to the formation of hydrogen bonds.
Ferrotitaniferous sands contain important minerals, including ilmenite, magnetite, and silicates [8]. Ilmenite (FeTiO3) is an iron–titanium oxide that forms coarse tabular crystals and is a significant source of titanium used in a variety of industries [9,10]. On the other hand, magnetite (Fe3O4) is a mineral with ferrimagnetic properties of ferrous and ferric iron. Lagos et al. (2020) [11] investigated the chemical composition of the black sands at El Ostional Beach, identifying crystalline phases such as titanium oxide and orthoclase feldspar. In a previous work Vinueza. L, et al. 2025 [12] reported the magnetic properties and mineral composition of magnetic black sand samples from two distinct coastal locations in Ecuador. Systematic data on microplastic capture by natural ferrotitaniferous sands are largely absent; most studies use either iron nanoparticles [13], or iron-oxide ferrofluids [14].
In this work, we propose using magnetic ferrotitaniferous sands milled over time and functionalized with PEG to efficiently remove PET microplastics from water. Ferrotitaniferous sands are attractive as magnetic adsorbent precursors due to their naturally abundant source, which requires only physical size reduction and surface functionalization, and their rapid recovery by an external magnetic field within 30 s. Therefore, the main contribution of this work lies in demonstrating a practical and sustainable alternative for microplastic removal using abundant natural resources.
2. Materials and Methods
2.1. Preparation of the Samples
Sand beach sediments were sampled along the Anconcito coast in Ecuador. The samples were washed with water, and the magnetic portion was separated using a neodymium magnet. The samples were dried overnight at 60 °C in an oven. Subsequently, the samples were milled through mechanical ball milling using RETSCH MM500 NANO Ball Mill Equipment (Retsch GmbH, Haan, Germany), applying milling intervals of 4, 8, 12, 16, 32, and 52 h. The samples were coated with polyethylene glycol (PEG, 3350 Mw) from Perrigo, using 1 g of PEG in 10 mL of distilled water and 1 g of the sample, and were stirred for 1 h at 60 °C. The sample was magnetically separated and dried at 60 °C for 24 h.
2.2. Polyethylene Terephthalate (PET) Hydrothermal Treatment
To quantify the Polyethylene Terephthalate (PET), a hydrothermal alkaline treatment was used to induce controlled microplastic formation. PET flake waste (5.5 g) was introduced into a hydrothermal reactor containing 50 mL of a 1.7 M sodium hydroxide (NaOH) solution, and the mixture was heated at 200 °C for 20 h. The resulting slurry was then filtered and washed three times by decantation with distilled water to remove residual alkaline species. Finally, the hydrothermally fragmented PET microparticles were dried at 60 °C for 12 h.
2.3. Characterization
Infrared analysis was performed using an Agilent Technologies Cary 360 spectrometer (Agilent Technologies, Santa Clara, CA, USA) equipped with a diamond attenuated total reflectance (ATR) accessory, with a resolution of 4 cm−1. The crystal structure was identified using a Mini-flex-600 X-ray diffractometer (Rigaku Corporation, Tokyo, Japan) from Rigaku, equipped with a D/tex Ultra 2 detector, at an X-ray generator setting of 40 kV and 15 mA, using a sealed-tube CuK () radiation source. The morphology and elemental composition of the samples were analyzed using a Phenom XL-G2 desktop microscope (Thermo Fisher Scientific, Waltham, MA, USA) from Thermo Fisher Scientific. Raman measurements and optical images were acquired using a spectrometer, HORIBA LabRAM HR Evolution (HORIBA Scientific, Kyoto, Japan), with an excitation wavelength of 633 nm. Magnetic properties were measured using a Quantum Design VersaLab Vibrational Sample Magnetometer (Quantum Design Inc., San Diego, CA, USA). PET adsorption was analyzed using a UV–Vis Genova Nano Jenway spectrophotometer (Jenway, Cole-Parmer Ltd., Stone, Staffordshire, UK).
3. Results and Discussion
3.1. Scanning Electron Microscopy (SEM) and Energy Dispersive X-Ray Spectroscopy (EDS)
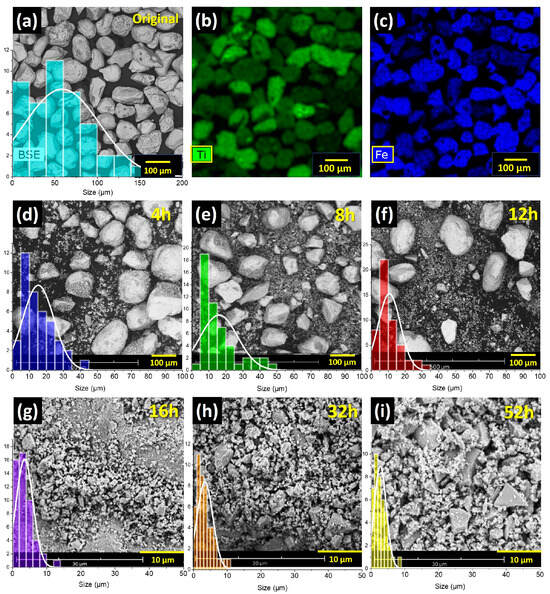
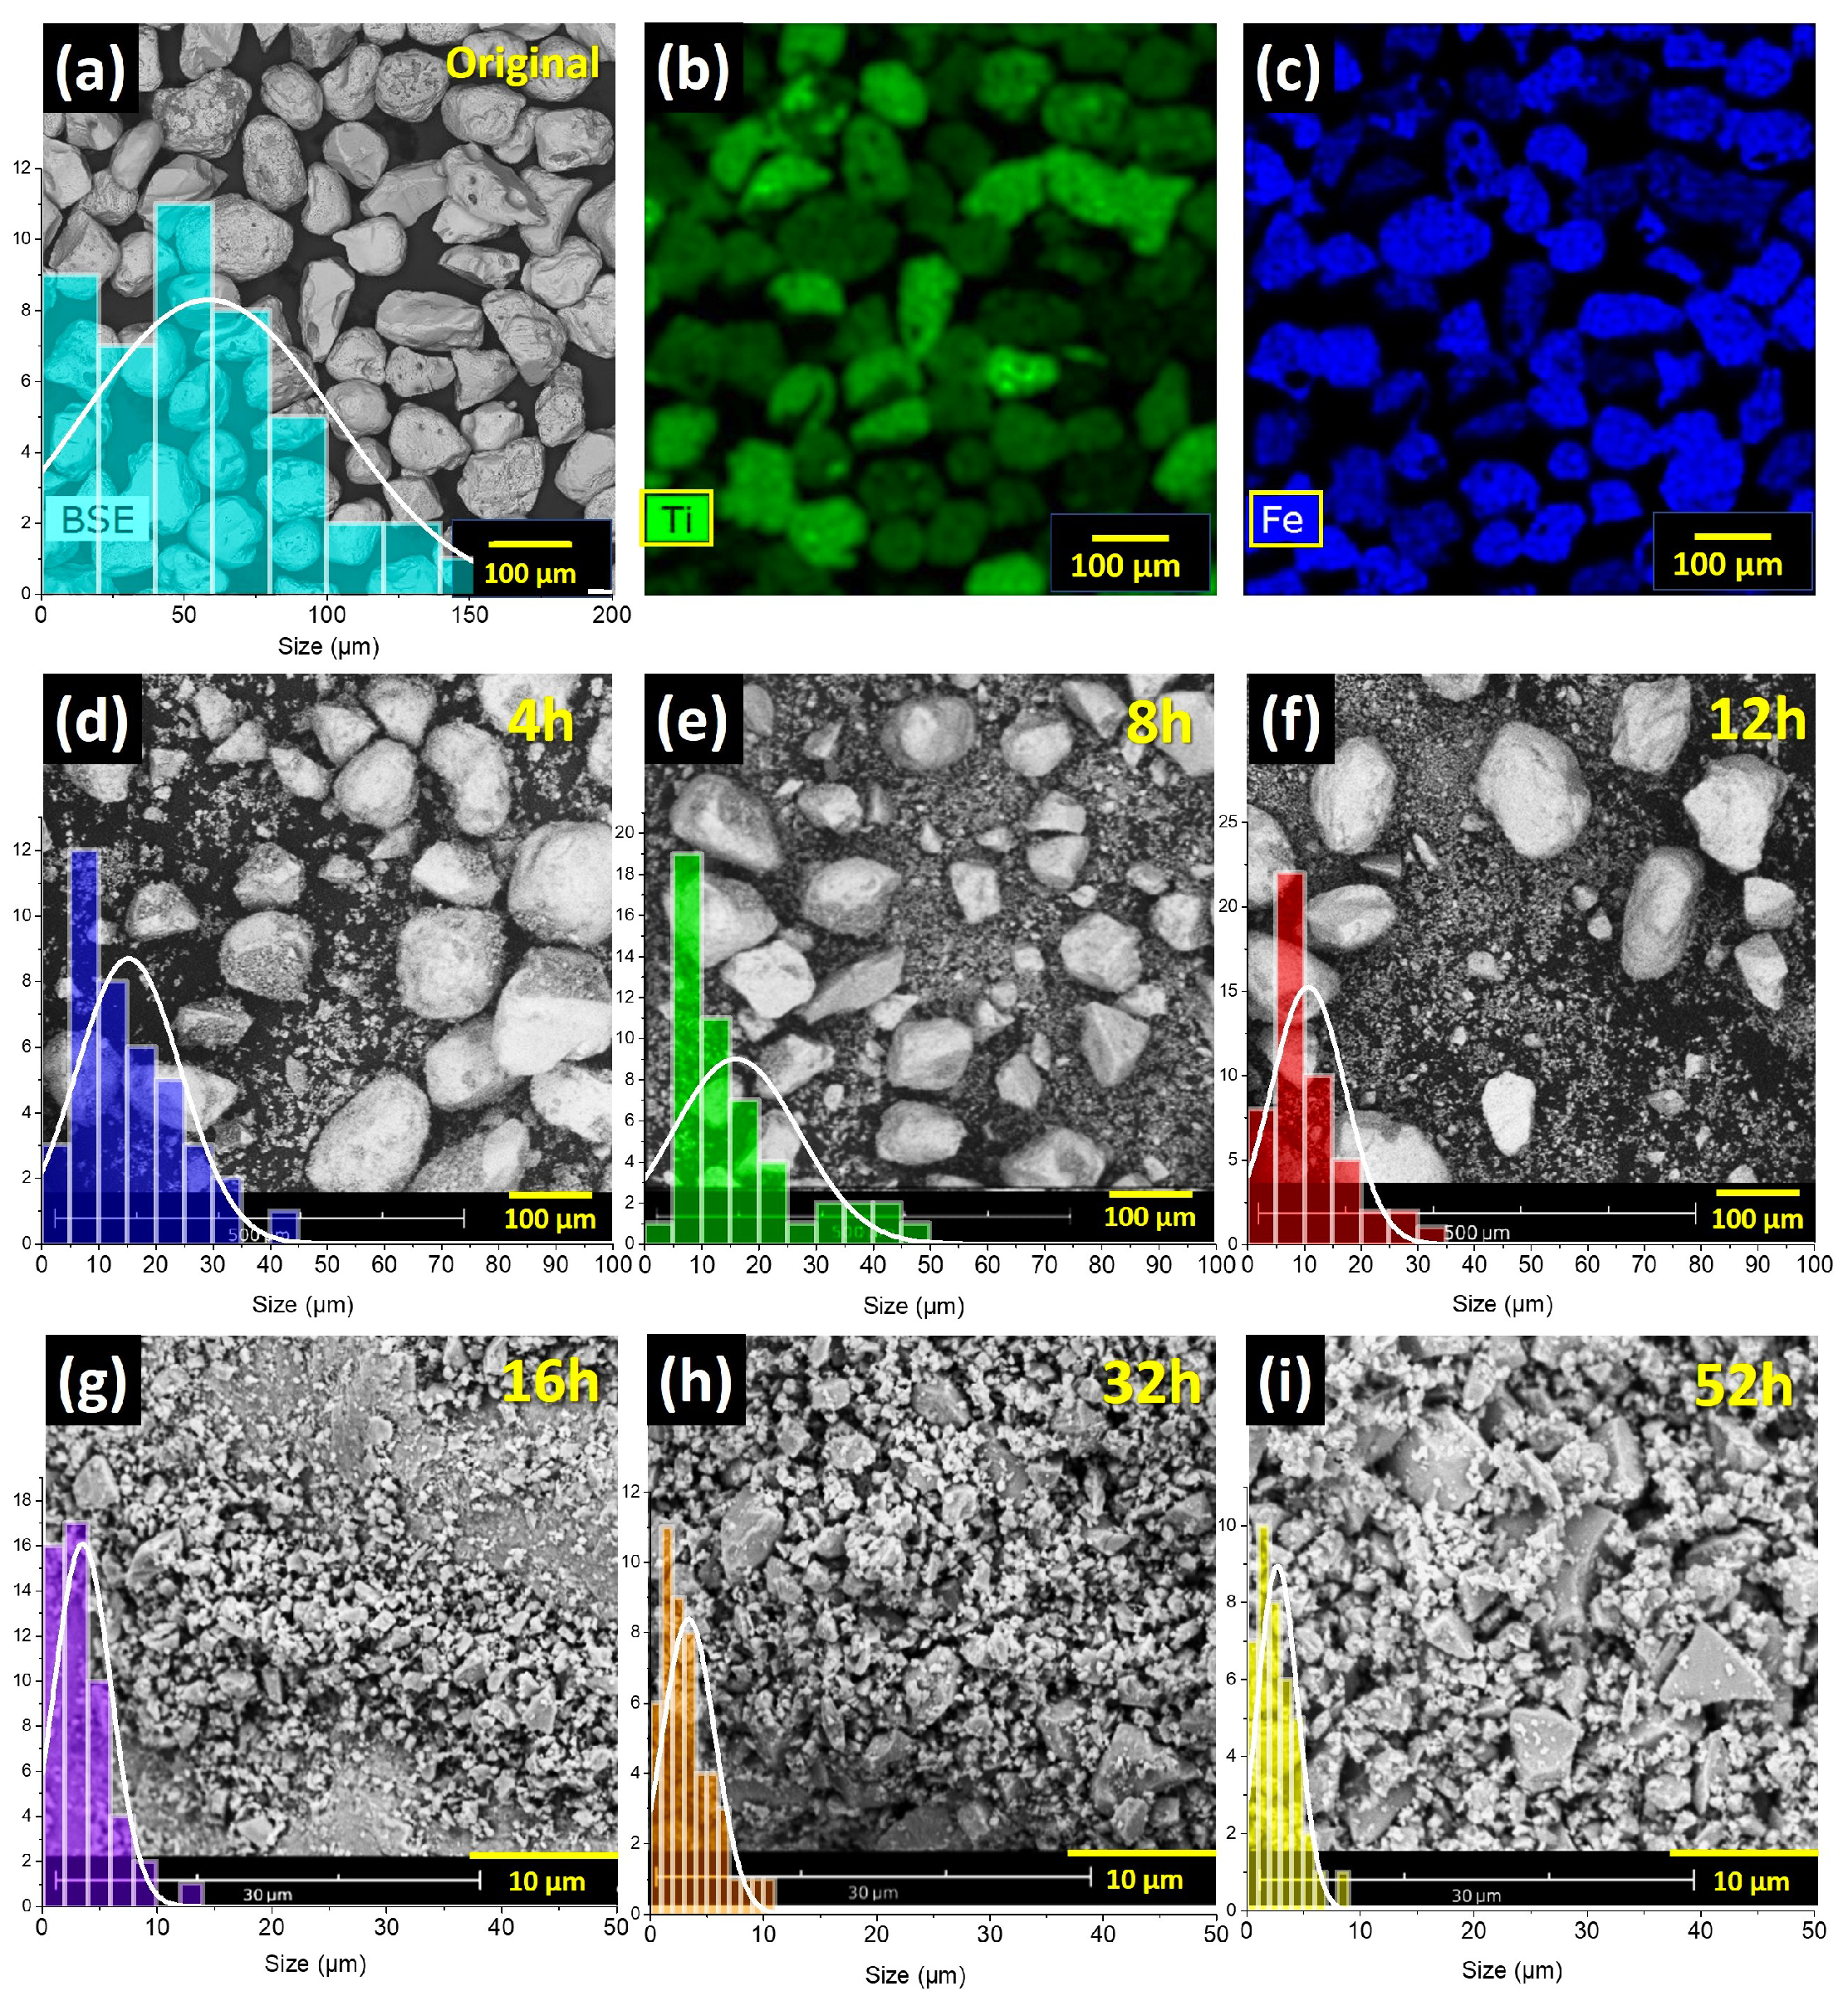
Figure 1 shows scanning electron microscopy (SEM) micrographs and Energy-Dispersive X-ray Spectroscopy (EDS) maps of the morphological evolution and average particle size reduction of the ferrotitaniferous sands against the milling process. In Figure 1a, the original sample extracted without milling shows a wide range of particle sizes, from 60 μm to 100 μm, including particles up to 200 μm. The elemental composition of the ferrotitaniferous sample, shown in Figure 1b,c, exhibits the distribution of titanium with 21.3% and 42.7% of iron.
Figure 1.
Scanning electron micrographs and elemental mapping of the ferrotitaniferous sand: (a) original (without milling), (b) Ti-green, (c) Fe-blue. Samples milled at (d) 4, (e) 8, (f) 12, (g) 16, (h) 32, and (i) 52 h.
In Figure 1a–c and Table 1, the original sample (without milling) reveals a coarse distribution of irregularly shaped particles with an average particle size of μm. As milling progresses from 4 to 12 h, shown in Figure 1d–f, significant fragmentation occurs, shifting the particle size distribution toward a peak of μm. By 16 h of milling (Figure 1g), the sample transitions to a finer regime, necessitating a change in scale from 100 μm to 10 μm. In the final stages of 32 to 52 h, as in Figure 1h–i, the material results in a powder with a narrow average size distribution of μm with the presence of larger fragments. This progressive reduction in average particle size underscores the high efficiency of the high-energy ball milling process in synthesizing refined composite structures.
Table 1.
Average particle size, saturation magnetization (), remanent magnetization (), and coercivity () of the ferrotitaniferous sands milled at different times.
3.2. X-Ray Diffraction (XRD)
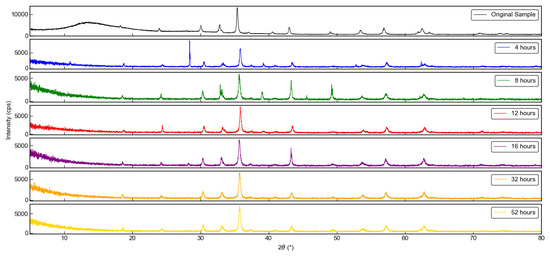
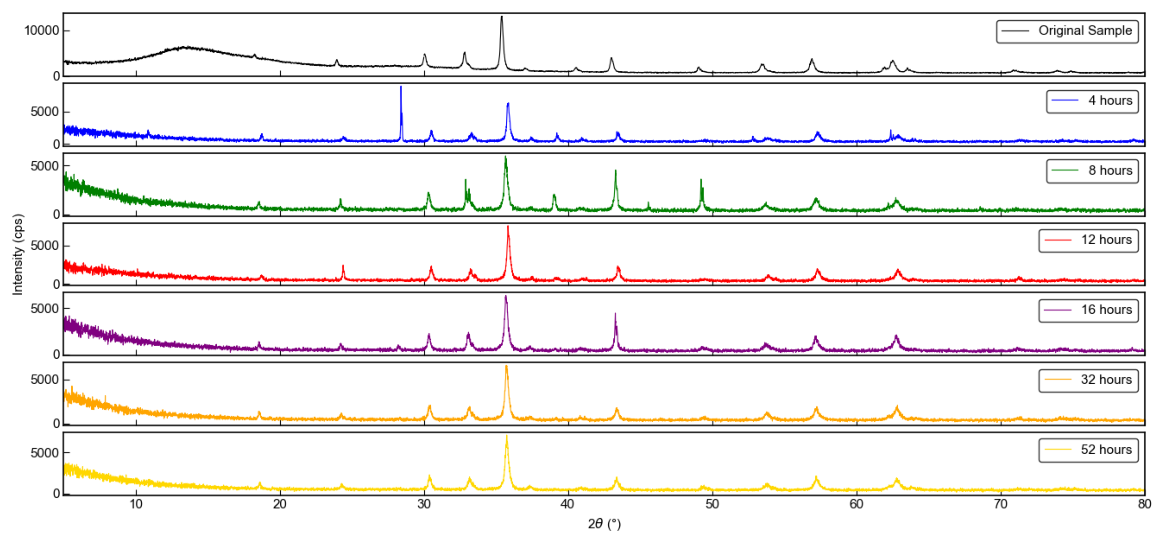
In Figure 2, the diffraction pattern of the ferrotitaniferous samples shows the characteristic diffraction peaks of magnetite (-Fe3O4) and ilmenite (-FeTiO3) [11]. The ilmenite () peaks are predominant at the 2 positions of approximately 30°, 35°, 40°, 50°, 60° and 70°, while the magnetite () peaks are observed at 2 of approximately 30°, 35°, 40° and 50°. These diffraction peaks indicate a significant presence of both mineral phases in the ferrotitaniferous sample [15].
Figure 2.
XRD Diffraction patterns of the Ferrotitaniferous sand Original (without milling), and milled at 4, 8, 12, 16, 32, and 52 h.
The appearance of a distinct diffraction peak near 28° (2 ) in the 4 h milled sample, which is less pronounced at other milling times, can be attributed to the complex multiphase nature of ferrotitaniferous sands and to the evolution of phase exposure during mechanical milling. Natural ferrotitaniferous sands are not single-phase systems but rather mixtures of magnetite (), ilmenite (), and silicate minerals such as quartz and feldspars. In XRD analysis, peaks near 26–28° (2 ) are commonly associated with silicate phases, particularly quartz (, 26.6°) and feldspathic minerals, which are frequently reported in coastal black sands and Fe–Ti oxide deposits [15]. Studies of natural black sands have shown that minor silicate phases can become more prominent depending on particle size distribution, preferred orientation, and relative phase exposure during milling. For example, Lagos et al. [11] reported that Ecuadorian black sands contain orthoclase feldspar and titanium oxides, and that the relative diffraction intensities of these phases can vary with sample preparation and processing.
The X-ray diffraction (XRD) patterns of the ferrotitaniferous sand samples milled over time show that, as milling time increases from 4 to 52 h, the diffraction peaks broaden across the 2 range. This phenomenon indicates the reduction in the average particle size, consistent with the SEM result, due to the high-energy mechanical impacts during high-energy ball milling. In Figure 2, the relative intensity of the primary diffraction peaks decreases progressively, particularly between 4 h (blue) and 52 h (yellow). This suggests a gradual loss of long-range crystalline order and a possible increase in the sample’s amorphous fraction. Meanwhile, the fundamental mineralogical phases of the ferrotitaniferous sand persist throughout milling.
3.3. Fourier Transform Infrared Spectroscopy (FTIR)
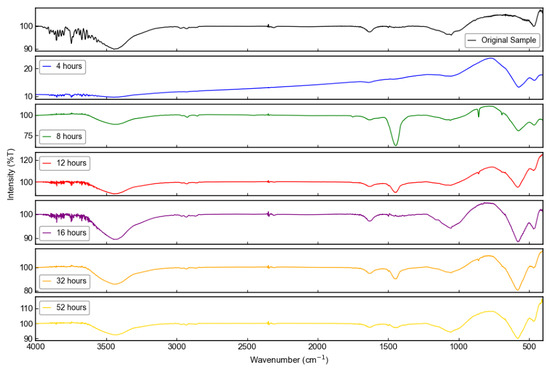
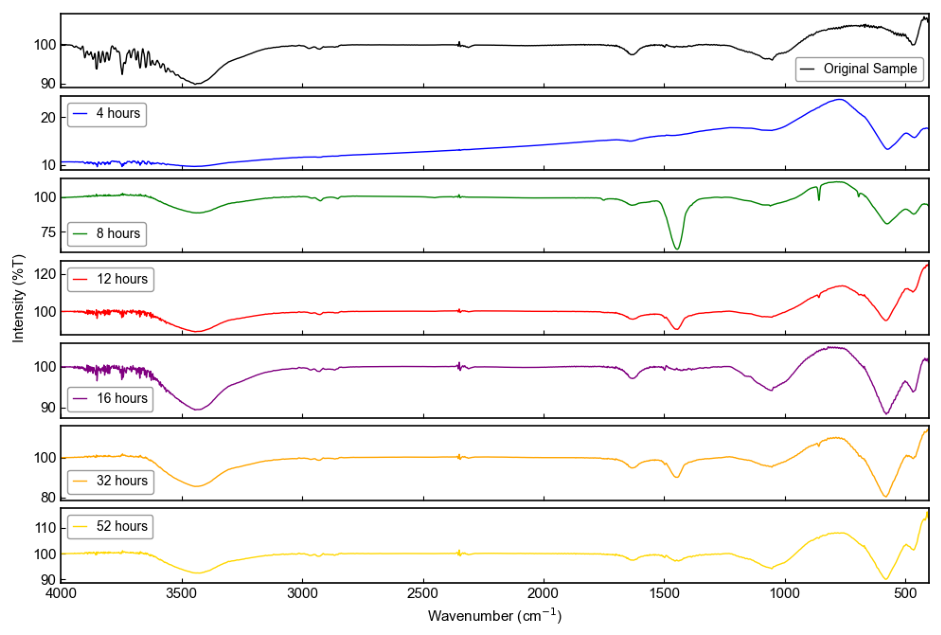
Figure 3 shows the FTIR spectra of the ferrotitaniferous samples as a function of milling time. In these spectra, the bands centered at 400–600 cm−1 correspond to the vibrational modes of iron and oxygen (Fe-O), and the bands at 500–800 cm−1 are attributed to the vibrational modes of iron and titanium (Fe-Ti) [16]. The presence of these bands indicates the significant content of iron and titanium compounds in the samples, consistent with the elemental composition shown in Figure 1. The vibrational modes associated with the iron–oxygen group are observed at 500 cm−1 and 600 cm−1. These peaks are characteristic of the iron–oxygen stretching vibrations [17]. The peaks at 1100 cm−1 and 800 cm−1 are attributed to the silica (SiO2) content in the samples.
Figure 3.
FTIR spectra of the Ferrotitaniferous sand: original (without milling), and milled at 4, 8, 12, 16, 32, and 52 h.
3.4. Raman Spectroscopy
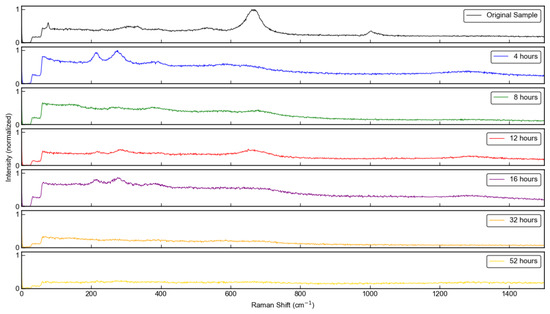
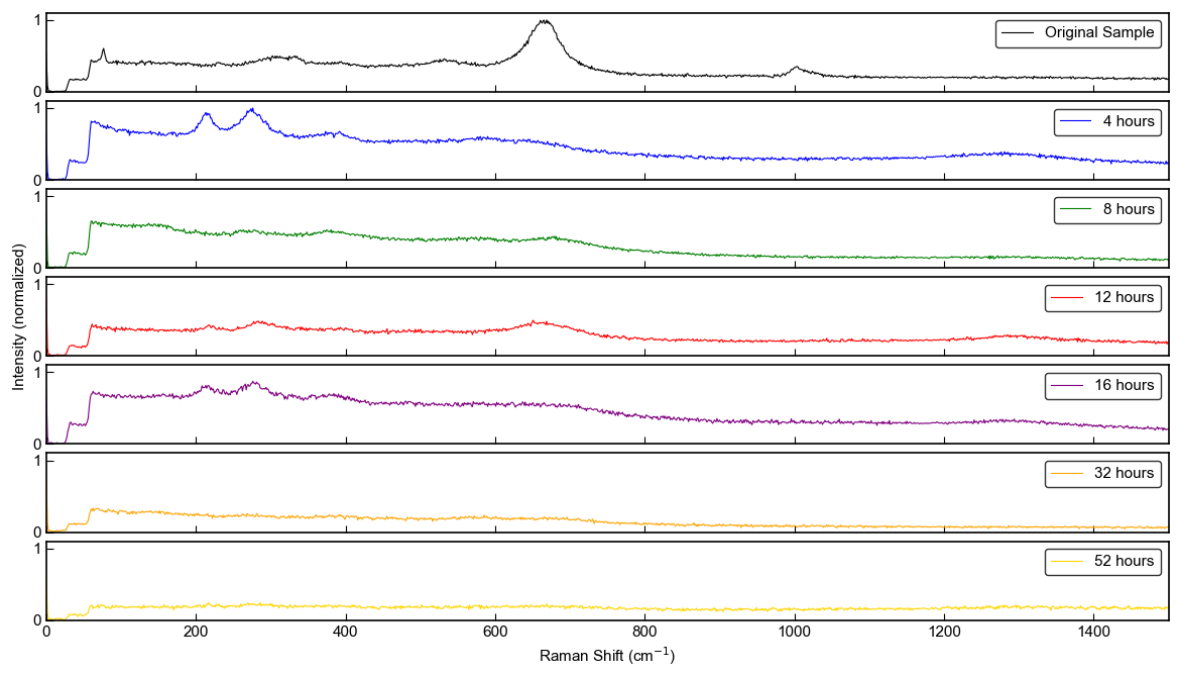
The Raman spectra in Figure 4 show the structural evolution of the magnetic ferrotitaniferous sand as a function of milling time (0–52 h). The Raman spectrum of the original sample (without milling) exhibits well-defined peaks characteristic of iron–titanium oxide phases. The most intense band appears at 670 cm−1, associated with the stretching mode of Fe–O in magnetite (). Additional bands observed at 220–230 cm−1, 290–300 cm−1, and 400–420 cm−1 correspond to lattice vibrations of hematite () and ilmenite (). Weak contributions in the 600–700 cm−1 region are also associated with Ti–O stretching modes of rutile () or mixed Fe–Ti oxide phases [18]. The peak at 1400 cm−1 is related to carbonaceous material like organic residues or graphitic impurities due to the natural origin of the samples. After milling the samples, the main effects observed are a progressive reduction in peak intensities and peak broadening, and a more pronounced background. The progressive attenuation and eventual disappearance of Raman peaks in milled samples are attributed to increased structural disorder, reduced particle size, and an enhanced fluorescence background induced by high-energy milling [19]. These effects reduce Raman scattering efficiency without necessarily indicating a change in phase composition, as confirmed by XRD.
Figure 4.
Raman spectra at 633 nm of the Ferrotitaniferous sand: original (without milling), and milled at 4, 8, 12, 16, 32, and 52 h.
3.5. Magnetic Properties
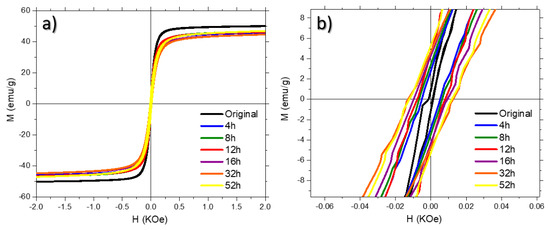
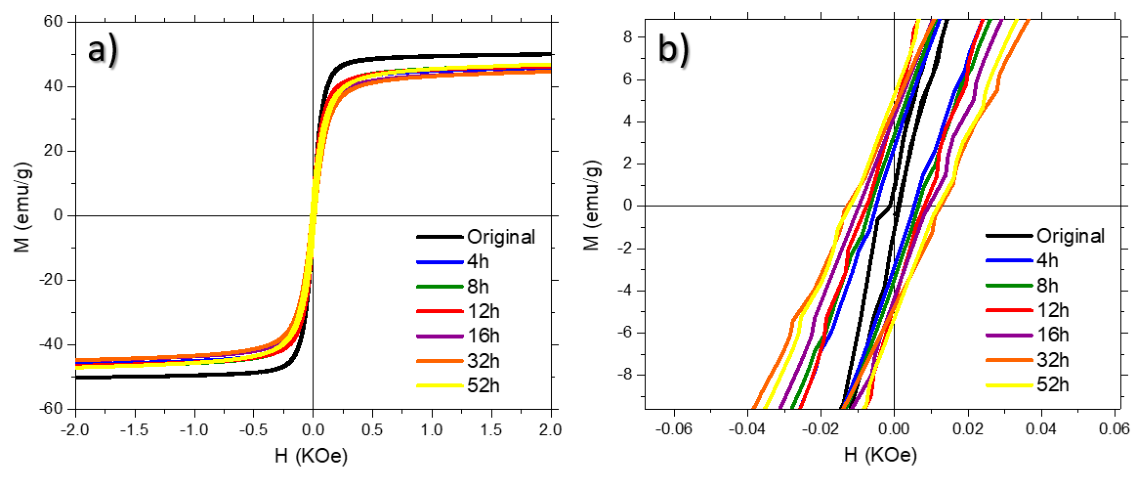
The magnetic characterization of the ferrotitaniferous sand as a function of milling time is shown in Figure 5a. This graph shows the room-temperature hysteresis loops (M vs. H) and the evolution of magnetic saturation () with applied field, indicating soft-magnetic behavior, with a maximum magnetization of 50.09 emu/g for the original sample without milling. In Figure 5b, a magnified view of the low-field region highlights the shift in the central axes. From Figure 5a,b, the remanence () as a function of milling time was plotted in Table 1, showing a general increasing trend from approximately 2.8 emu/g at 4 h to 5.3 emu/g at 52 h. Meanwhile, the coercivity () increases from 52 Oe to a peak of 127 Oe at 32 h, then stabilizes at 52 h. The enhancement in is attributed to the reduction in grain size during the high-energy ball milling process [20].
Figure 5.
Magnetic properties of ferrotitaniferous sands. (a) Room-temperature hysteresis loops () against the applied field. (b) Magnified view of the low-field region highlighting the shift in the central axes.
The soft ferrimagnetic behavior of the samples is attributed to magnetite and ilmenite, as indicated by the XRD results, in which magnetite is the primary contributor. These results are in agreement with Parra Sua et al. (2013) [21], who report the magnetic properties of black sands collected from the surface soils of La Guajira, Colombia, obtaining a maximum magnetization of 32.7 emu/g, 2.5 Oe coercive field, and 0.074 emu/g remanent magnetization with 42% of magnetite and 37% of ilmenite. To our knowledge, this is the first report on the magnetic characterization of ferrotitaniferous sands of the Ecuadorian coast.
3.6. Microplastic Removal Experiments
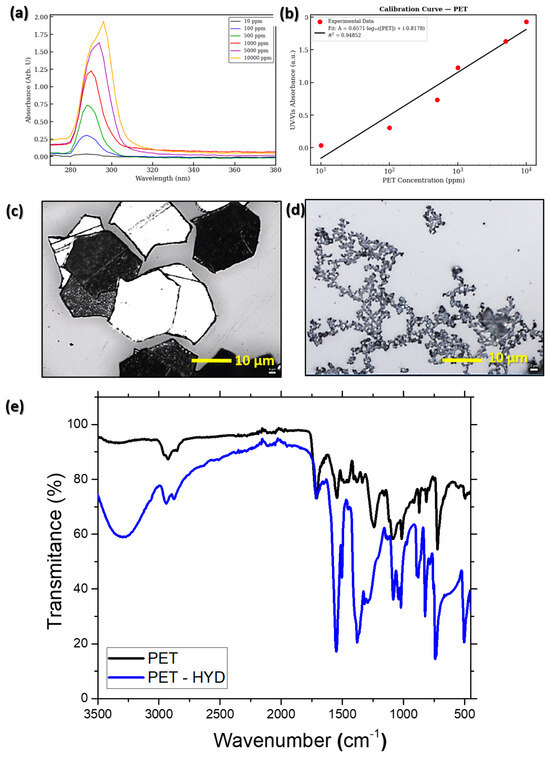
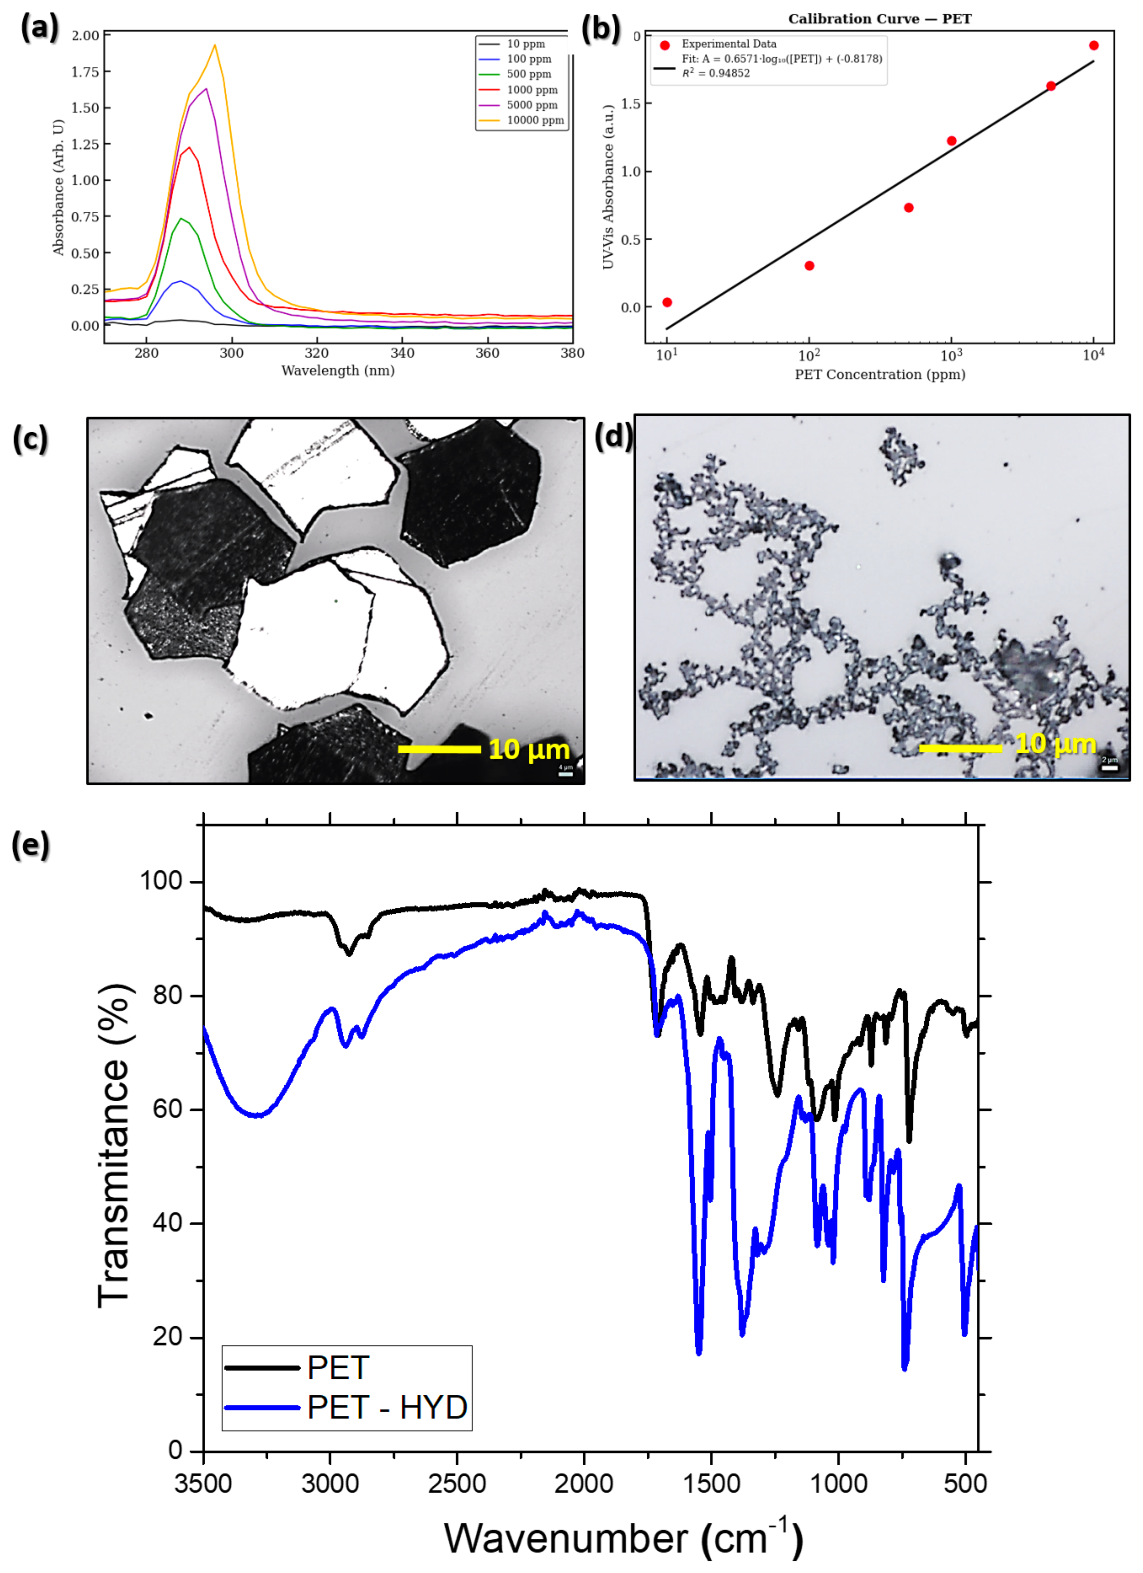
Simulated Polyethylene Terephthalate (PET) after hydrothermal treatment (microplastics) was prepared at nominal concentrations of 10, 100, 500, 1000, 5000, and 10,000 ppm by serial dilution in distilled water. Figure 6a,b show the UV–Vis spectra and calibration curves for suspensions of PET microplastics. For the measurements, 0.1 g of the ferrotitaniferous sands was placed in 1.5 mL of the microplastics solution, and data were collected over a range of concentrations, at room temperature and pH of 6. In this figure, all spectra exhibit a pronounced absorption band in the ultraviolet region (280–300 nm), attributed to electronic transitions of the aromatic groups, mainly – transitions of the benzene ring and n– transitions associated with the ester functionality. The increase in absorbance with increasing microplastic concentration reflects the greater abundance of chromophoric groups in the suspension and follows the Beer–Lambert law. In Figure 6b, the calibration curve for PET was obtained from absorbance measurements at the selected UV wavelength. The absorbance–PET concentration relationship is linear, indicating a strong correlation between UV–Vis absorbance and microplastic concentration. This calibration curve enables the quantitative determination of PET concentration in aqueous suspensions by spectrophotometry, consistent with the Beer–Lambert law. The UV-Vis spectra and calibration curves demonstrate that UV–Vis spectroscopy provides a rapid and reliable method for detecting and quantifying microplastics such as PET, owing to their characteristic UV absorption associated with aromatic ring structures.
Figure 6.
(a) Ultraviolet–visible spectra of Polyethylene Terephthalate (PET) after the hydrothermal treatment at different concentrations, and (b) PET calibration curve, (c) optical images of Polyethylene Terephthalate (PET), and (d) PET after the hydrothermal treatment (microplastics), (e) FTIR spectra of Polyethylene Terephthalate (PET), and PET after the hydrothermal treatment.
Figure 6c shows the optical images of Polyethylene Terephthalate (PET) as obtained with an average particle size of μm, and in Figure 6d, the PET after the hydrothermal treatment (microplastics) with an average particle size of μm, evidencing the reduction in size with the hydrothermal treatment. The FTIR results indicate partial hydrolysis and oxidation of PET during hydrothermal treatment [22], as evidenced by increased intensities of the C–O and carbonyl bands, as shown in Figure 6e.
Studies on the hydrothermal degradation of PET waste into monomers [23] show that as degradation progresses, the peak at 1715 cm−1 corresponding to the stretching vibration of the ester group shifts toward 1685 cm−1. Another important change is the emergence of an intense band centered at 3500 cm−1 attributed to stretching vibrations, indicating the presence of adsorbed water or the formation of terminal carboxylic acid and hydroxyl groups. The increase in PET peak intensity after the hydrothermal treatment suggests the formation of secondary microplastics. Figure 6 demonstrates that hydrothermal treatment can produce simulated PET microplastics that emulate fragments found in marine or freshwater environments.
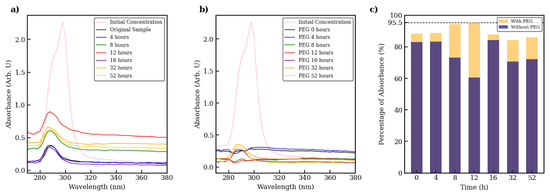
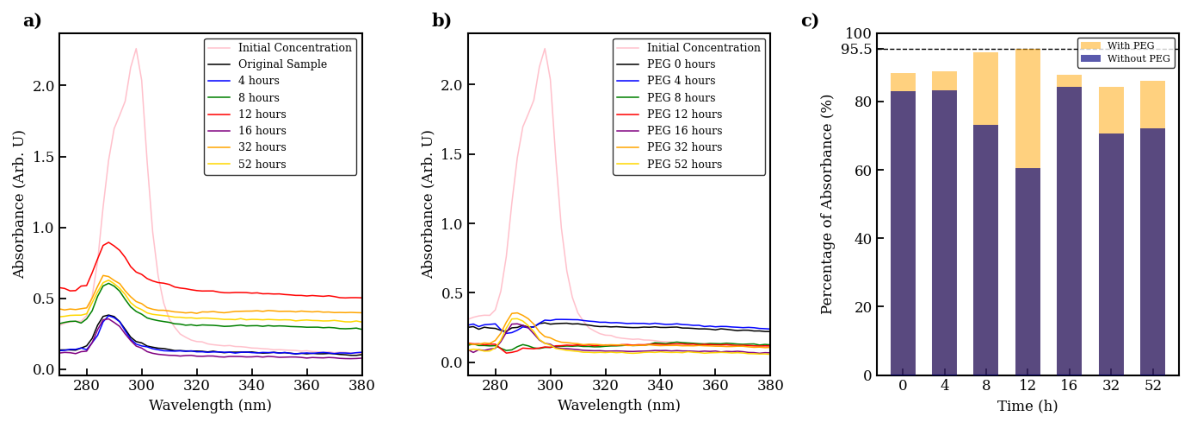
Figure 7 and Table 2 illustrate the adsorption performance and removal efficiency of ferrotitaniferous sand (both pristine and PEG-coated) for Polyethylene Terephthalate (PET), to evaluate the impact of milling time and surface modification on microplastic removal efficiency. Figure 7a displays the spectra for PET treated with pristine ferrotitaniferous sand, showing a significant drop in absorbance at 10 mg/mL (Initial concentration) across all milling times, with the most substantial reduction occurring at 52 h (yellow line). Figure 7b shows the effect of PEG-coated sand on PET removal; in this figure, the absorbance peak at 290 nm is significantly lower than that of pristine sand, indicating that the PEG coating enhances the ferrotitaniferous sand affinity for PET. From Table 2, we conclude that reducing the average particle size increases the microplastic adsorption.
Figure 7.
(a) Ultraviolet–visible spectra of Polyethylene Terephthalate (PET) with the ferrotitaniferous sand milled at different times. (b) Ultraviolet–visible spectra of Polyethylene Terephthalate (PET) with the ferrotitaniferous sand coated with PEG milled at different times. (c) Maximum removal efficiencies against the milling time for the ferrotitaniferous sand milled at different times with and without PEG.
Table 2.
Average adsorption capacity (mg/g) and maximum microplastic removal efficiency (%) using the ferrotitaniferous sands milled at different times for Polyethylene Terephthalate (PET), and polyethylene glycol with PET (PEG-PET).
Microplastic removal efficiency was calculated according to Equation (1) using the initial and final microplastic concentrations, determined from UV-Vis absorbance measurements, as a function of milling time.
In this equation, corresponds to the initial absorbance of the characteristic polymer peak obtained from the baseline spectrum, while represents the minimum absorbance observed during the experiment.
The adsorption capacity (Qt) was calculated as follows
where C0, Cf, V, and W are the initial microplastic concentration (10 mg/mL), the final concentration, the volume of the prepared solution (1.5 mL), and the adsorbent mass (0.1 g), respectively.
The results in Figure 7 and Table 2 indicate that adsorption performance depends on the milling time and surface functionalization. As the milling time increased from 4 to 12 h, removal efficiency improved, which can be attributed to the reduced particle size observed in Table 1. The maximum removal efficiency (95%) and adsorption capacity (32.36 mg/g) were achieved for the sample milled for 12 h and functionalized with PEG. For longer milling times (≥16 h), a slight decrease in adsorption performance and magnetic saturation was observed, possibly due to particle agglomeration. These results suggest that an optimal balance between particle size reduction, magnetic properties, and surface modification is achieved at intermediate milling times.
The regeneration study demonstrates that ferrotitaniferous sands can be magnetically recovered and reused for at least 10 consecutive cycles without loss of PET removal performance. The PEG-functionalized samples showed consistently superior reusability, maintaining removal efficiencies of approximately 90–96%, whereas the uncoated material operated at about 71–87%. These results indicate that PEG not only enhances initial adsorption performance but also improves the sand operational stability during repeated magnetic separation cycles.
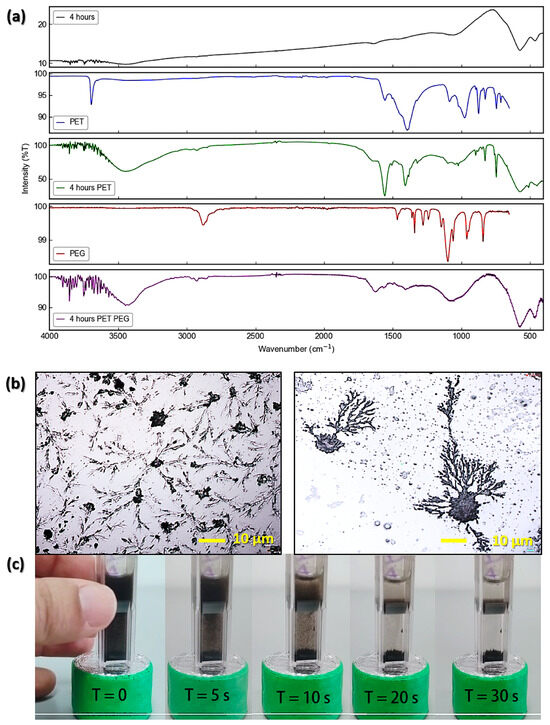
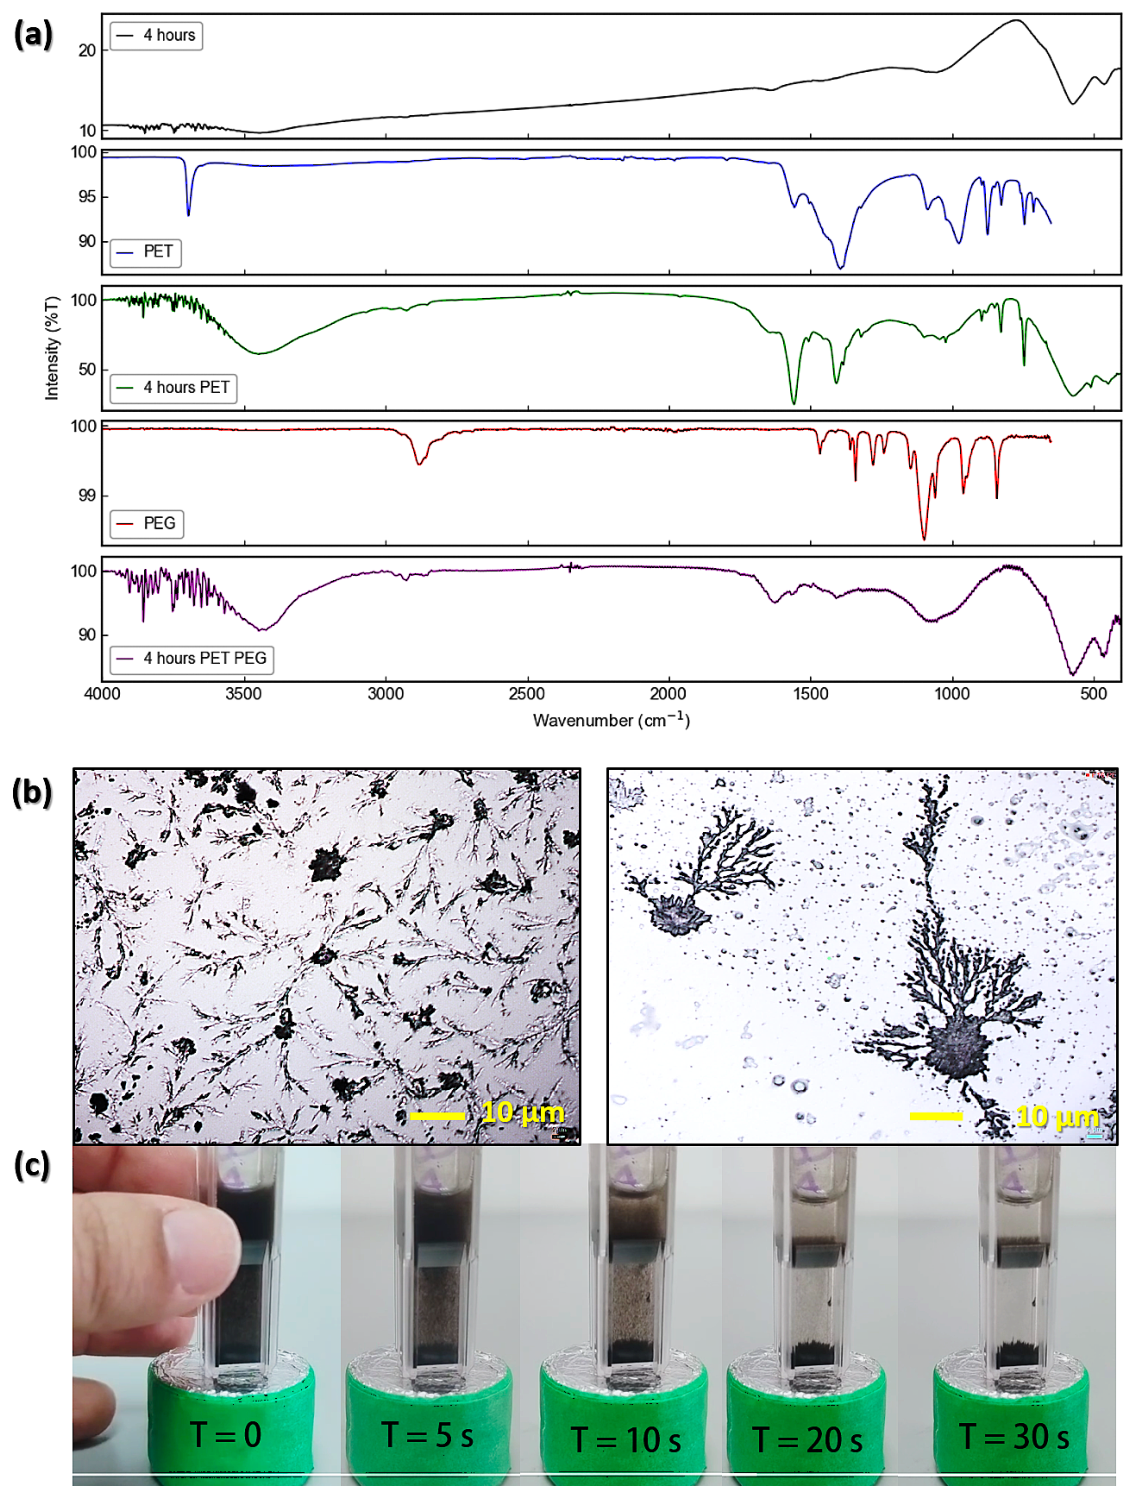
Evidence of the surface modification of the ferrotitaniferous sand with polyethylene glycol (PEG) and the interaction with PET is shown in Figure 8a using FTIR spectroscopy. This Figure shows the interaction between PET and the ferrotitaniferous sand milled for 4 h. In Figure (4 h PET-PEG), the PET carbonyl peak at 1715 cm−1 shows a slight decrease in intensity and potential broadening in the sample. This suggests that the PEG may act as a functionalizer, facilitating the dispersion of PET onto the ferrotitaniferous sand by reducing interfacial tension and enhancing physicochemical interactions. Based on these results, we propose that microplastics adsorb onto pristine ferrotitaniferous sands primarily via physical adsorption (Figure 4 h PET). Meanwhile, when the samples are coated with PEG, adsorption occurs via physicochemical interactions. The PEG molecules could intercalate between the PET microplastics and the mineral surface of the ferrotitaniferous sand. This is evidenced by the attenuation of the 1100 cm−1 C-O-C stretch compared to (Figure PEG), implying a restricted vibrational environment caused by the anchoring of the PEG to the sand’s metallic sites.
Figure 8.
(a) FTIR spectra of the ferrotitaniferous sand milled for 4 h, Polyethylene Terephthalate (PET) after the hydrothermal treatment, ferrotitaniferous sand milled for 4 h with PET, polyethylene glycol (PEG), ferrotitaniferous sand milled for 4 h, coated with PEG and PET. (b) Optical images of Polyethylene Terephthalate (PET), after the hydrothermal treatment interacting with the ferrotitaniferous sand. (c) Images of the magnetic removal of the microplastics against time.
The use of an external magnetic field with ferrotitaniferous sand induces the alignment and aggregation of microplastics with PEG into larger clusters that can be easily extracted from the aqueous phase. Figure 8b illustrates the interaction between the dark, highly branched microplastic aggregates and the ferrotitaniferous sand. Microplastics form intricate, dendritic growths that radiate outward from denser magnetic points. This distinct morphology suggests that the ferrotitaniferous sand acts as a nucleation site and an effective capture agent, binding dispersed microplastic aggregates into clusters that can be removed by a magnetic field. Finally, Figure 8c shows a 30 s time-lapse series demonstrating the practical application of the microplastics capture system. This rapid and complete separation confirms that the magnetic properties imparted by the ferrotitaniferous sand are effectively utilized to remove the microplastics. This method offers several advantages over traditional adsorption methods, including rapid separation, reduced energy consumption, and ease of recovering the magnetic sample for subsequent reuse.
Our results are in agreement with those reported by Aquino et al. 2025 [24], who use magnetic nanoparticles with citric acid (Fe3O4@AC) to remove high-density polyethylene (HDPE), low-density polyethylene (LDPE), and polypropylene (PP) microplastics, achieving 80% microplastic removal through hydrogen bonding, pore filling, and van der Waals forces adsorption mechanisms. In another study, magnetic nanoparticles functionalized with Tannic acid () were used to remove Polystyrene (PS) and Polyethylene Terephthalate (PET) microplastics. The maximum adsorption efficiencies were and , respectively. They report that the stable binding of and the microplastics was due to electrostatic interactions, hydrophobic interactions, interactions, or hydrogen bonding [25]. In the study by Zhang et al. (2025), magnetic nanoparticles () functionalized with polyethylene glycol (PEG) were synthesized via coprecipitation for the removal of polyethylene. The PEG-MNPs achieved a maximum adsorption of 2203 mg/g. The article proposes that the adsorption process was mainly due to intermolecular hydrogen bonding [26]. Luo et al. (2025) [13] report the retention of microplastics in sand filtration systems using iron-loaded sand. They found that conventional sand filtration is inefficient at removing microplastics. To address this issue, quartz sand was coated with iron oxide, enabling strong electrostatic attraction to negatively charged microplastics, resulting in a maximum removal of 53%.
In comparison, the present work focuses on naturally occurring ferrotitaniferous sands, which, while expected to exhibit lower adsorption capacities due to their larger particle size, offer significant advantages in terms of being naturally abundant, requiring only physical size reduction and simple surface functionalization, and can be recovered rapidly by an external magnetic field. Therefore, the main contribution of this work lies not in maximizing adsorption capacity but in demonstrating a practical and sustainable alternative for microplastic removal using abundant natural resources.
While the present study demonstrates the feasibility of using naturally derived ferrotitaniferous sands, both pristine and PEG-functionalized, for the magnetic removal of PET microplastics, several aspects require further investigation to fully elucidate the underlying mechanisms and assess practical applicability. In particular, the adsorption process was evaluated at a single concentration and under simplified aqueous conditions; therefore, future work should include comprehensive adsorption isotherms and kinetic analyses to quantify the interaction mechanisms and the theoretical adsorption capacity of the samples. Additionally, the influence of environmental parameters such as pH, ionic strength, and dissolved organic matter must be systematically examined [27], as these factors are known to significantly affect microplastic aggregation and adsorption behavior in real water matrices to validate the scalability and environmental relevance of ferrotitaniferous sands as a sustainable alternative to engineered magnetic nanomaterials for microplastic remediation [13].
4. Conclusions
Ferrotitaniferous sands are a promising naturally available precursor for magnetically assisted microplastic removal, owing to their high ilmenite and magnetite contents. The results show soft ferrimagnetic behavior, with a maximum magnetization of 50.09 emu/g. The maximum microplastic removal was 95% with an adsorption capacity of 32.36 mg/g in 30 s for the 12 h milled sample with PEG. The efficiency of ferrotitaniferous sands in removing microplastics primarily derives from their ability to selectively adsorb microplastics via PEG and to be subsequently recovered with external magnetic fields. This work sheds light on the structural and magnetic properties of an abundant natural resource that could add value to materials for industrial applications.
Author Contributions
Conceptualization, S.B. and G.G.; methodology, A.R., W.B.-E., I.J.V.-L. and A.V.; formal analysis, S.B. and G.G.; investigation, S.B., I.J.V.-L. and A.V.; writing—original draft preparation, S.B.; writing—review and editing, S.B. All authors have read and agreed to the published version of the manuscript.
Funding
This research received no external funding.
Institutional Review Board Statement
Not applicable.
Data Availability Statement
The data that support the findings of this study are available upon reasonable request from the authors.
Acknowledgments
We thank the support provided by the project “Diseño de materiales nanoestructurados multifuncionales” PHY23-06 at Yachay Tech University.
Conflicts of Interest
The authors declare that they have no conflicts of interest.
References
- Plastics Europe. Plastics—The Fast Facts 2025: Global and European Plastics Production and Economic Indicators; Plastics Europe Report; Plastics Europe: Brussels, Belgium, 2025. [Google Scholar]
- Martin, L.M.A.; Sheng, J.; Zimba, P.V.; Zhu, L.; Fadare, O.O.; Haley, C.; Wang, M.; Phillips, T.D.; Conkle, J.; Xu, W. Testing an Iron Oxide Nanoparticle-Based Method for Magnetic Separation of Nanoplastics and Microplastics from Water. Nanomaterials 2022, 12, 2348. [Google Scholar] [CrossRef]
- Du, H.; Xie, Y.; Wang, J. Microplastic degradation methods and corresponding degradation mechanism: Research status and future perspectives. J. Hazard. Mater. 2021, 418, 126377. [Google Scholar] [CrossRef]
- La Cecilia, D.; Philipp, M.; Kaegi, R.; Schirmer, M.; Moeck, C. Microplastics attenuation from surface water to drinking water: Impact of treatment and managed aquifer recharge – and identification uncertainties. Sci. Total Environ. 2024, 908, 168378. [Google Scholar] [CrossRef]
- Zhao, H.; Cui, W.; Yang, S.; Zheng, K.; Song, F.; Liu, Z.; Ji, P. Potential of a novel magnetic gangue material for remediating wastewater and field co-polluted by microplastics and heavy metals. Sep. Purif. Technol. 2025, 368, 133030. [Google Scholar] [CrossRef]
- Briceño, S.; Arevalo-Fester, J.E.; Fierro-Sanchez, I.A. Sustainable Magnetic Nanorobots for Microplastics Remediation. Microplastics 2025, 4, 97. [Google Scholar] [CrossRef]
- Aragón, D.; García-Merino, B.; Barquín, C.; Bringas, E.; Rivero, M.J.; Ortiz, I. Advanced green capture of microplastics from different water matrices by surface-modified magnetic nanoparticles. Sep. Purif. Technol. 2025, 354, 128813. [Google Scholar] [CrossRef]
- Trujillo, W.; Cobo, J.; Vera-Cedeño, D.; Palma-Cando, A.; Toro-Álava, J.; Viloria, A.; Ricaurte, M. Magnetic Separation and Enrichment of Fe–Ti Oxides from Iron Titaniferous Beach Sands. Resources 2022, 11, 121. [Google Scholar] [CrossRef]
- Wang, H.; Zhang, X.; Qu, R.; Zhang, L.; Li, W. Recent technology developments in beneficiation and enrichment of ilmenite: A review. Miner. Eng. 2024, 219, 109084. [Google Scholar] [CrossRef]
- Soledispa, B.; Villacres, J. Estudio composicional de las arenas ferrotitaníferas del sector comprendido entre el Estero Data de Posorja y el Monasterio de Santa Teresa, Provincia del Guayas, Ecuador. Acta Ocean. Pac. 1990, 6, 79–95. [Google Scholar]
- Lagos, K.J.; Marinkovic, B.A.; Dosen, A.; Guamán, M.V.; Guerrero, V.H.; Pardo, E.; Pontón, P.I. Data on phase and chemical compositions of black sands from El Ostional beach, Ecuador. Data Brief 2020, 32, 106214. [Google Scholar] [CrossRef]
- Vinueza Moreta, J.L.; Briceño Araujo, S.E.; González Vázquez, G.; Bramer Escamilla, W. Magnetic Characterization of the Coated and Uncoated Sands of the Ecuadorian Coast. Bachelor’s Thesis, Universidad de Investigación de Tecnología Experimental Yachay, Urcuqui, Ecuador, 2025. [Google Scholar]
- Luo, C.; Yu, Y.; Tang, Y.; Dong, Z.; Qiu, Y. Enhanced retention of small-sized microplastics by iron-containing sand filtration system: Effectiveness and mechanisms. J. Hazard. Mater. 2025, 489, 137678. [Google Scholar] [CrossRef]
- Hamzah, S.; Ying, L.Y.; Azmi, A.A.A.R.; Razali, N.A.; Hairom, N.H.H.; Mohamad, N.A.; Che Harun, M.H. Synthesis, characterisation and evaluation on the performance of ferrofluid for microplastic removal from synthetic and actual wastewater. J. Environ. Chem. Eng. 2021, 9, 105894. [Google Scholar] [CrossRef]
- Lagos, K.J.; Marinkovic, B.A.; Debut, A.; Vizuete, K.; Guerrero, V.H.; Pardo, E.; Pontón, P.I. Towards Iron–Titanium Oxide Nanostructures from Ecuadorian Black Mineral Sands. Minerals 2021, 11, 122. [Google Scholar] [CrossRef]
- Kumar, M.R.A.; Abebe, B.; Nagaswarupa, H.P.; Murthy, H.A.; Ravikumar, C.R.; Sabir, F.K. Enhanced photocatalytic and electrochemical performance of TiO2–Fe2O3 nanocomposite. Sci. Rep. 2020, 10, 1249. [Google Scholar] [CrossRef]
- Briceño, S.; Hernández, A.C.; Sojo, J.; Lascano, L.; Gonzalez, G. Degradation of magnetite nanoparticles in biomimetic media. J. Nanopart. Res. 2017, 19, 140. [Google Scholar] [CrossRef]
- Vennari, C.E.; Williams, Q. A high-pressure Raman study of FeTiO3 ilmenite. Phys. Chem. Miner. 2021, 48, 34. [Google Scholar] [CrossRef]
- Hanesch, M. Raman spectroscopy of iron oxides and (oxy)hydroxides at low laser power and possible applications in environmental magnetic studies. Geophys. J. Int. 2009, 177, 941–948. [Google Scholar] [CrossRef]
- Lin, C.R.; Chu, Y.M.; Wang, S.C. Magnetic properties of magnetite nanoparticles prepared by mechanochemical reaction. Mater. Lett. 2006, 60, 447–450. [Google Scholar] [CrossRef]
- Parra Sua, J.P.; Sjögreen Blanco, C.A.; Alfonso Orjuela, J.E.; Landínez Téllez, D.A.; Roa-Rojas, J. Caracterización morfológica, estructural y magnética de arenasnegras de La Guajira. Rev. Acad. Colomb. Cienc. Exactas Fis. Nat. 2013, 37, 60–64. [Google Scholar]
- Čolnik, M.; Pečar, D.; Knez, Ž.; Goršek, A.; Škerget, M. Kinetics Study of Hydrothermal Degradation of PET Waste into Useful Products. Processes 2022, 10, 24. [Google Scholar] [CrossRef]
- Bućko, M.S.; Jaworek, K.; Janoszka, K.; Kernert, J.; Klyta, J.; Tsering, T.; Koistinen, A.; Sobota, M.; Musioł, M. Aging properties of polymer pellets, release of secondary microplastics and additives in the water environment under laboratory-controlled conditions. J. Hazard. Mater. 2025, 491, 137882. [Google Scholar] [CrossRef] [PubMed]
- Aquino, I.d.S.d.; Freire, E.d.A.; Rodrigues, A.M.; Vercillo, O.E.; Silva, M.F.P.d.; Rocha, M.F.S.d.; Amaral, M.C.S.; Amorim, A.K.B. Sustainable Strategy for Microplastic Mitigation: Fe3O4 Acid-Functionalized Magnetic Nanoparticles for Microplastics Removal. Sustainability 2025, 17, 5203. [Google Scholar] [CrossRef]
- Sacko, A.; Nure, J.F.; Nyoni, H.; Mamba, B.; Nkambule, T.; Msagati, T.A. The Application of Tannic Acid-Coated Magnetite Nanoparticles for Recovery of Microplastics from the Water System. Water Conserv. Sci. Eng. 2024, 9, 41. [Google Scholar] [CrossRef]
- Zhang, Y.; Duan, J.; Liu, R.; Petropoulos, E.; Feng, Y.; Xue, L.; Yang, L.; He, S. Efficient magnetic capture of PE microplastic from water by PEG modified Fe3O4 nanoparticles: Performance, kinetics, isotherms and influence factors. J. Environ. Sci. 2025, 147, 677–687. [Google Scholar] [CrossRef]
- Sharma, V.K.; Ma, X.; Guo, B.; Zhang, K. Environmental factors-mediated behavior of microplastics and nanoplastics in water: A review. Chemosphere 2021, 271, 129597. [Google Scholar] [CrossRef]

Disclaimer/Publisher’s Note: The statements, opinions and data contained in all publications are solely those of the individual author(s) and contributor(s) and not of MDPI and/or the editor(s). MDPI and/or the editor(s) disclaim responsibility for any injury to people or property resulting from any ideas, methods, instructions or products referred to in the content. |
© 2026 by the authors. Licensee MDPI, Basel, Switzerland. This article is an open access article distributed under the terms and conditions of the Creative Commons Attribution (CC BY) license.