


Abstract
Microplastic pollution is an emerging environmental concern in coastal ecosystems, particularly in developing regions. However, research remains compartmentalized, limiting an integrated understanding of microplastic distribution, transport dynamics, and ecological risks across interconnected environmental matrices. In this study, a multi-matrix assessment was conducted to evaluate microplastic abundance, characteristics, and associated ecological risks. A total of 93 microplastic particles were identified, with the mangrove site exhibiting the highest concentration (200 items/kg), while the seagrass bed and estuary showed the lowest concentration (3.33 items/kg). The dominant microplastic type was primarily fiber (55.91%), with most particles ranging from 0.1 to 1 mm, and polypropylene (66.67%) was the predominant polymer type, reflecting the widespread contribution from plastic packaging and fishing gear. Significant correlations were observed between microplastic abundance and contamination factor (CF), pollution load index (PLI), and potential ecological risk index (PERI), whereas the polymer hazard index (PHI) showed no significant relationship due to its dependence on polymer composition. Non-metric multidimensional scaling (NMDS) revealed distinct distribution patterns of microplastic shape and polymer type across matrices. Overall, microplastic distribution across environmental matrices is driven by heterogeneous sources and transport pathways, with mangrove sediments enhancing retention, underscoring the need to elucidate seaward and landward source contribution and coastal fluxes.
1. Introduction
Plastic pollution has become a widespread environmental problem, posing serious threats to ecosystems, biodiversity, and human health [1,2]. Global plastic production has increased exponentially over the past decades [3] and is projected to increase from 464 Mt in 2020 to 884 Mt by 2050 [4]. This rapid growth is largely driven by short-lived consumer products such as packaging and single-use materials, as well as its economic advantages, including durability, light weight, water resistance, resistance to corrosion, and low production costs [3,5,6].
Once released into the environment, plastics accumulate and persist for long periods in terrestrial, marine, and coastal systems [6]. Over time, exposure to sunlight, temperature changes, physical abrasion, and biological activity causes larger plastic to weather and fragment into smaller particles known as microplastics (<5 mm) [7,8,9], which represent the most abundant form of plastic pollution in marine environments. These particles are classified into two categories: primary microplastics, which are intentionally manufactured at small sizes (microbeads and pellets), and secondary microplastics (fragments and film), which result from the breakdown of larger plastic items over time [10]. Unlike larger debris, microplastics are easily transported, ingested by organisms, and redistributed across environmental compartments, which makes them a complex pollutant. The transport and fate of microplastics in coastal environments are controlled by a combination of particle characteristics and environmental conditions [11]. Factors such as polymer type, size, and shape interact with water dynamics, sediment properties, and biological activity to determine where microplastics accumulate and how long they persist [12].
Rivers play a major role in transporting plastics from land to the ocean. A global assessment by Schmidt et al. [13] showed that both microplastic and macroplastic loads in rivers are strongly linked to mismanaged plastic waste in river catchments, with a small number of large rivers contributing the majority of global riverine plastic inputs to the ocean. Importantly, their analysis also indicated that microplastics are transported more efficiently than larger debris and that not all plastics entering river systems are exported directly to the ocean. Instead, significant amounts are retained within river channels, banks, and sediments, suggesting that rivers act not only as transport pathways but also as temporary sinks.
Estuaries further mediate the land–sea connection by linking river systems, coastal environments, and the open ocean. Costa and Barletta [14] demonstrated that microplastics occur across multiple environmental matrices, including surface waters, sediments, beaches, and biota. They emphasized estuaries as key gateways facilitating their distribution between these compartments. Their synthesis showed that secondary microplastics were derived from fragmented debris, particularly fisheries-related materials. They also reported strong small-scale spatial variability in microplastic abundance, which highlights the limitations of simplified or single-matrix sampling approaches.
Previous studies demonstrated that microplastic contamination extends into ecologically sensitive and protected areas, including mangrove ecosystems [15,16]. Within estuaries and coastal areas, mangroves play a particularly important role in regulating microplastic distribution. Microplastics are now increasingly recognized as biologically active particles rather than inert debris. As they undergo weathering processes, their surface properties change, enhancing their ability to adsorb metals, persistent organic pollutants, and microorganisms [17,18]. By acting as carriers of these contaminants, microplastics may enhance the mobility, bioavailability, and potential toxicity of pollutants within biological systems [19,20]. Previous work by Long et al. [21] demonstrated that microplastics readily attach to phytoplankton aggregates, substantially increasing their sinking rates from centimeters to tens or even hundreds of meters per day. These findings explain how microplastics move between different parts of the environment and show that measuring only surface waters likely underestimates the total amount of microplastic pollution.
The ecological implications of microplastic contamination are especially relevant in the Philippines, a country of more than 7000 islands and a global center of marine biodiversity [22]. Recent studies have reported microplastics in Philippine coastal sediments [10], surface waters [5], seagrass beds [23,24], and mangroves [1,6], indicating widespread contamination across interconnected coastal habitats. Due to their small size, microplastics are readily ingested by organisms across multiple trophic levels, and chronic exposure has been linked to impaired feeding, growth, and reproduction [18]. Moreover, microplastics have been detected in fish and shellfish that are important for local fisheries and food security [25,26]. These findings raise concerns about both ecosystem health and human exposure through seafood consumption.
Additionally, recent multi-matrix studies have improved our understanding of microplastic occurrence in estuarine environments. However, our knowledge on the exchange and transport of microplastics among interconnected environmental matrices remains limited. A previous study by Tan and Zanuri [27] investigated microplastics in surface water, bottom sediment, and estuarine sediment within tropical mangrove estuaries in Penang, Malaysia, revealing matrix-specific abundance patterns but providing limited assessment of transport relationships among matrices. Similarly, the multi-matrix study conducted in the Karnafully River estuary, Bangladesh, examined microplastics in water, sediment, fish, and prawns, demonstrating differential accumulation among matrices but focusing primarily on contamination levels and trophic exposure rather than matrix connectivity [28]. In contrast, many temperate estuarine studies have concentrated on sediment retention and storage processes, such as saltmarsh trapping mechanisms in the United Kingdom and system-scale sedimentary storage in Narragansett Bay, USA, providing valuable insights into microplastic sinks but not simultaneously evaluating multiple environmental matrices and their ecological risks [29,30].
Despite numerous reports documenting the widespread distribution of microplastics across coastal environments, most studies remain compartmentalized, focusing on individual matrices without considering the dynamic processes linking rivers, estuaries, mangroves, beaches, and nearshore waters and the potential ecological risks associated with each matrix [31,32]. With this, the understanding of how different coastal environmental matrices are interconnected, how microplastics are distributed across matrices, and how this distribution influences ecological risk remains limited.
To address this gap, the present study aims to investigate the distribution patterns of microplastics (size, shape, and polymer type) across different coastal environmental matrices. Specifically, it seeks to (1) determine the abundance of microplastics in mangrove sediment, beach sand, seagrass beds, estuary beds, and surface water; (2) characterize the polymer type of microplastic from different environmental matrices; (3) determine the distribution factors of the microplastic through shape and size for better understanding of the microplastic entering the marine environment; and (4) determine the polymer hazard and risk indices for possible implications and management.
2. Materials and Methods
2.1. Study Site
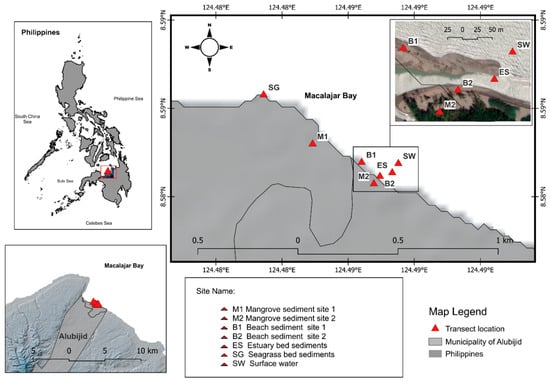
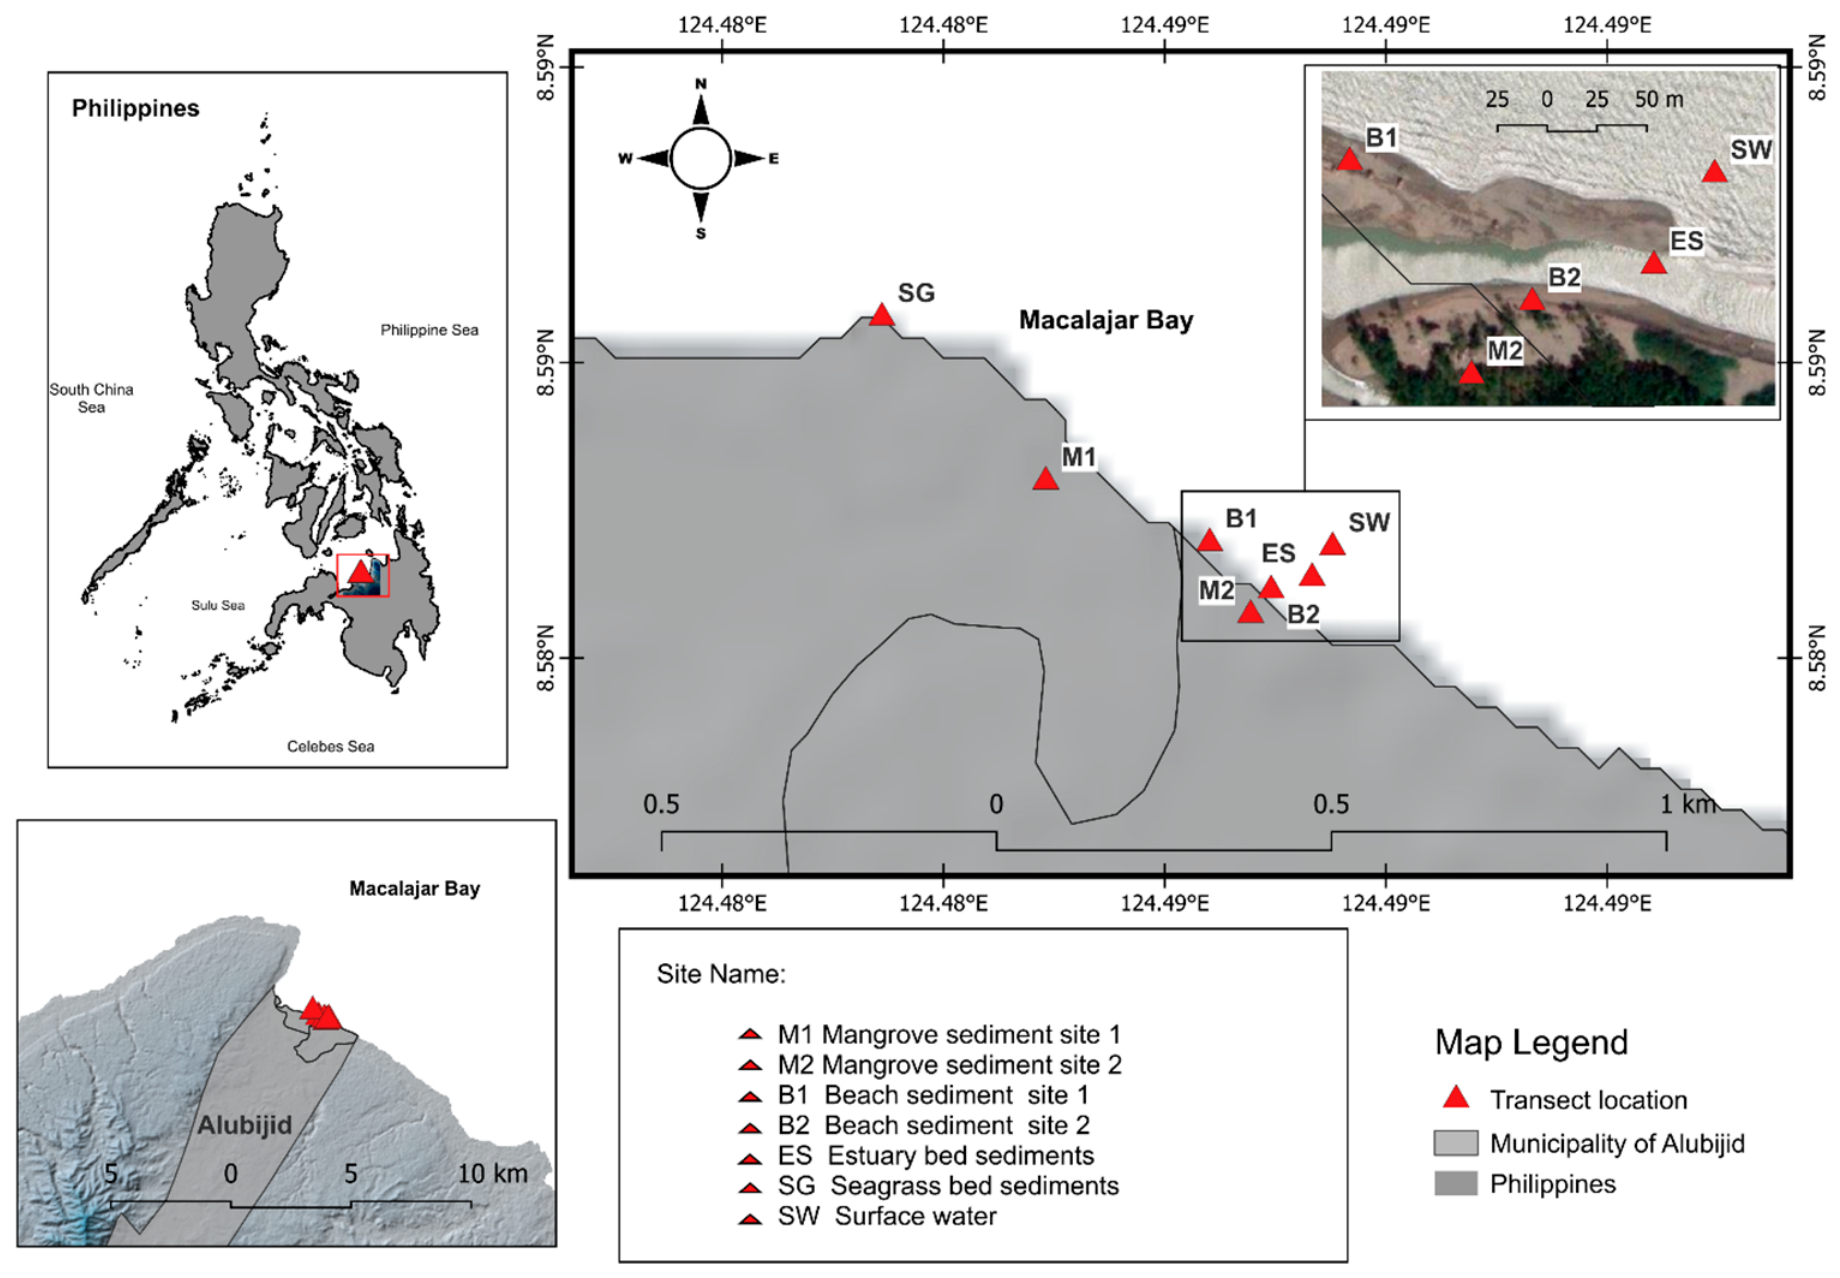
Sampling was conducted at the municipality of Alubijid, Misamis Oriental, Philippines, in July 2025. The identified location is an estuary with distinct environmental conditions. Sampling is composed of two beach sediment sites (B1 & B2), two mangrove sediment sites (M1 & M2), which is near the residential area, one seagrass bed sediment site (SG) with an approximate distance of 200 m away from the river mouth, a sea surface water body (SW), and at the estuary bed (ES) (Figure 1). The matrices have different sediment characteristics: mangrove sediment is mostly muddy, while beach sediments are sandy pea gravel. In contrast, other matrices share common sediment characteristics, mostly sandy. This sampling site was selected to represent the major environmental matrices within the interconnected estuarine system. Only one seagrass site was included because it was the only visible seagrass bed within the study area. Similar habitat-targeted sampling approaches have been applied in estuarine microplastic studies due to habitat heterogeneity and uneven spatial distribution of vegetated coastal ecosystems [33,34]. Furthermore, all samples were collected at the identified location and transported to the laboratory for analysis of microplastic contamination (Table 1).
Figure 1.
Map of the Philippines (inset) and the municipality of Alubijid in Misamis Oriental, Mindanao Island, showing the sampling sites. M1 + M2: mangroves; B1 + B2: beach; ES: estuary bed; SG: seagrass; SW: surface water.
Table 1.
Description of the sampling site across different environmental matrices in Alubijid, Misamis Oriental, Philippines; Mean density ± standard deviation.
2.2. Water and Sediment Sample Collection
An improvised manta net with a rectangular aluminum frame measuring 25 × 25 cm and a nylon net with a 300 um mesh was used to collect surface water samples. It is adapted from the study of Montoto-Martínez et al. [35], with minor modifications. Briefly, manta nets were towed through the surface water using a fisherman’s boat within a horizontal distance of 20 m and a minimum depth of 10 cm at a speed of ~3 to 4 knots. Other samples were collected using a 1 L bottle grab sampling method at the start and end points of trawling. The distance was recorded using a global positioning system (GPS) tracker (Table 1). Collected samples were thoroughly rinsed using distilled water and stored in 1 L sample bottles.
For beach sediment, samples were collected at the strand line of the identified area, where the debris stranded after the high tide. Sediments from the mangroves were collected 50 m away from the beach sampling site in triplicate (Table 1). This is to avoid site-specific contamination and reduce localized bias. All sediments were extracted using a metal trowel with gradation after placing a 50 cm × 50 cm quadrat in a 50 m transect line with 17 m intervals [36]. However, seagrass sediment samples were collected ~200 m from the estuary, the only identified area with visible seagrass. Additionally, 1 kg of estuary bed sediment was collected using a metal trowel in triplicate. Three replicates of wet sediment samples were collected, each weighing 1 kg, to ensure comparable samples across sites. While three replicates are standard for estimating variability, it is acknowledged that this sampling intensity may capture only a portion of the inherent spatial heterogeneity in microplastic distribution in sediments. Samples on each quadrat were homogenized and placed in a clean stainless container to avoid unwanted contamination and stored at a cool temperature for preservation until analysis [37,38].
2.3. Sample Analysis and Microplastic Extraction
The collected water samples were soaked in a 10% potassium hydroxide (KOH) solution to digest organic material and then incubated at 60 °C for 48 h. After the incubation period, the mixture was placed in a cool area, filtered through a GF/C Whatman filter paper, and examined under a stereo microscope for microplastic contamination.
Sediment samples were transported to the laboratory and oven-dried at 60 °C for 48 h until constant dryness [39]. The dried sediment sample was set aside to cool and then sieved through a 5 mm metal sieve. After homogenizing and drying the samples, because dried sediments have different weights, a standardized 100 g aliquot was taken, diluted in 300 mL of 10% KOH to digest organic particles, and then placed in the oven at 60 °C for 24 h [1,40]. After digestion, the samples were cooled and filtered using GF/C-grade filter paper with a 47 mm diameter and a pore size of 1.2 μm. The remaining sediment was subjected to decantation using a 150 mL ZnCl2 solution at an approximate density of 1.5 g/mL [41].
2.4. Identification and Morphological Characterization of Microplastics
A stereomicroscope was used to visually inspect suspected microplastic particles and to characterize their morphological features, including shape and color. Microplastics were classified as pellets, fragments, fibers, and films, wherein pellets were circular and non-reflective; fragments had an angular and sub-rounded shape; fibers were elongated, approximately the same in width, and often with tattering; and films were mostly transparent [42]. Microplastics identified were manually counted based on these characteristics, and abundances across different environmental matrices were converted to density and expressed as items per kilogram (items/kg). All suspected microplastic samples were subjected to Fourier transform infrared spectroscopy coupled with attenuated total reflectance (FTIR-ATR, Spotlight 200i Sp2, PerkinElmer, Waltham, MA, USA) [43]. Briefly, the measurements were performed in reflection mode over the range 650–4000 cm−1, with 5 scans at a resolution of 4 cm−1. Sample spectra were compared with the standard spectra of polymers in the polymer library (Spectrum™) to identify the polymer type (spectral match > 70%). This threshold is widely used in microplastic studies because environmental weathering can alter polymer spectra and reduce match quality, while matches above 70% are considered strong evidence of polymer identity [43,44].
2.5. Quality Control
Field sampling and laboratory measures were followed to maintain quality control, including sample transportation, sealing, freezing, organic digestion, filtration, and containment of suspected microplastics to prevent contamination [1]. During field sampling, a wet GF/C filter paper blank control was placed at each transect site to detect possible airborne contaminants. The filter was transported to the lab and examined through a stereomicroscope. Additionally, a GF/C filter paper laboratory blank was prepared during the extraction of microplastics from field samples. Cotton clothing was also worn to prevent the introduction of unwanted contaminants, such as fibers. Proper clothing and contamination control were used throughout the experiment, necessitating safety precautions, such as surgical gloves and laboratory gowns [45].
2.6. Pollution Indices
Potential risks were analyzed with respect to the chemical composition and concentrations of microplastic particles across different environmental matrices. The pollution hazard index (PHI) was analyzed using the formula [46]:
where Pn is the rate of a particular polymer from the different compartments, Sn is the given hazard score, and PHI is the calculated polymer hazard index of confirmed microplastics from the environmental compartments.
PHI = ∑ Pn × Sn
To further evaluate the potential risks of microplastics, various indices were used: concentration factor (CF), pollution load index (PLI), and potential ecological risk index (PERI) [8,47,48,49].
For assessing the level of pollution in estuaries and compare the levels across various sites, the pollution load index (PLI) was determined [47]. The PLI is linked to the contamination factor (CF) of each microplastic from environmental matrices. To use this index, a standardized model was used as follows:
where CFi is the calculated contamination factor from microplastic at each site (Ci), dividing the background concentration (Coi). The background value in this study is the lowest microplastic concentration studied in the different environmental matrices, which are SG and ES [49,50].
CFi = Ci/Coi
The potential ecological risk index was analyzed based on various microplastic contamination levels in different matrices [49,51,52]. The equation for assessing the ecological risk is as follows:
where and are the representations of the concentration of pollutant ‘i’ (i.e., microplastic) and the unpolluted samples (lowest microplastic concentration in different matrices), respectively. represents the toxicity coefficient for toxicity level and biological sensitivity, while represents the sum of a certain polymer percentage from the total sample, and Sn is the hazard score of the polymer from the study of Lithner et al. [46]. The classification of each index and its respective category levels are shown in Table S1.
2.7. Data Analysis
The Spearman correlation was used to determine the relationship between microplastic abundance and risk indices. Confirmed microplastic particles were presented following the Fourier-infrared spectroscopy analysis. The Shapiro–Wilk test was used to assess normality, and Levene’s test was used to assess homogeneity of variances. Differences in microplastic concentration across different coastal environmental matrices were statistically analyzed using a Kruskal–Wallis nonparametric ANOVA.
Differences of microplastic shape, size, and polymer type per site were analyzed using the categorical statistics (Fisher’s exact test) to determine the distribution of microplastic based on its characteristics, since the data violated the assumptions of the Chi-square test. This analysis was paired with Cramér’s V test to evaluate the strength of association between variables, followed by the standard residual for identifying the specific variable driving a significant overall result [53,54].
To examine patterns in microplastic composition and to visualize the clustering of samples based on their characteristics, non-metric multidimensional scaling (NMDS) analysis was performed using a Bray–Curti’s dissimilarity matrix. NMDS analyses were conducted using OriginPro 2025b software (OriginLab Corporation, Northampton, MA, USA).
3. Results
3.1. Abundance of Microplastics in Different Matrices
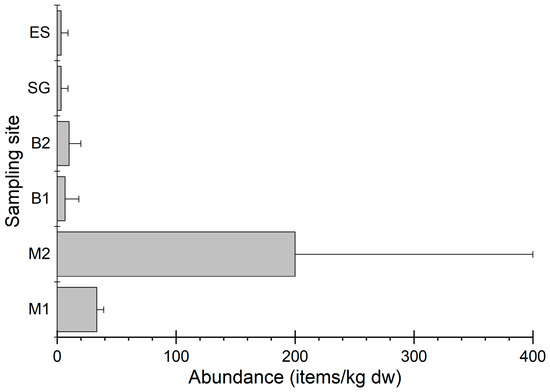
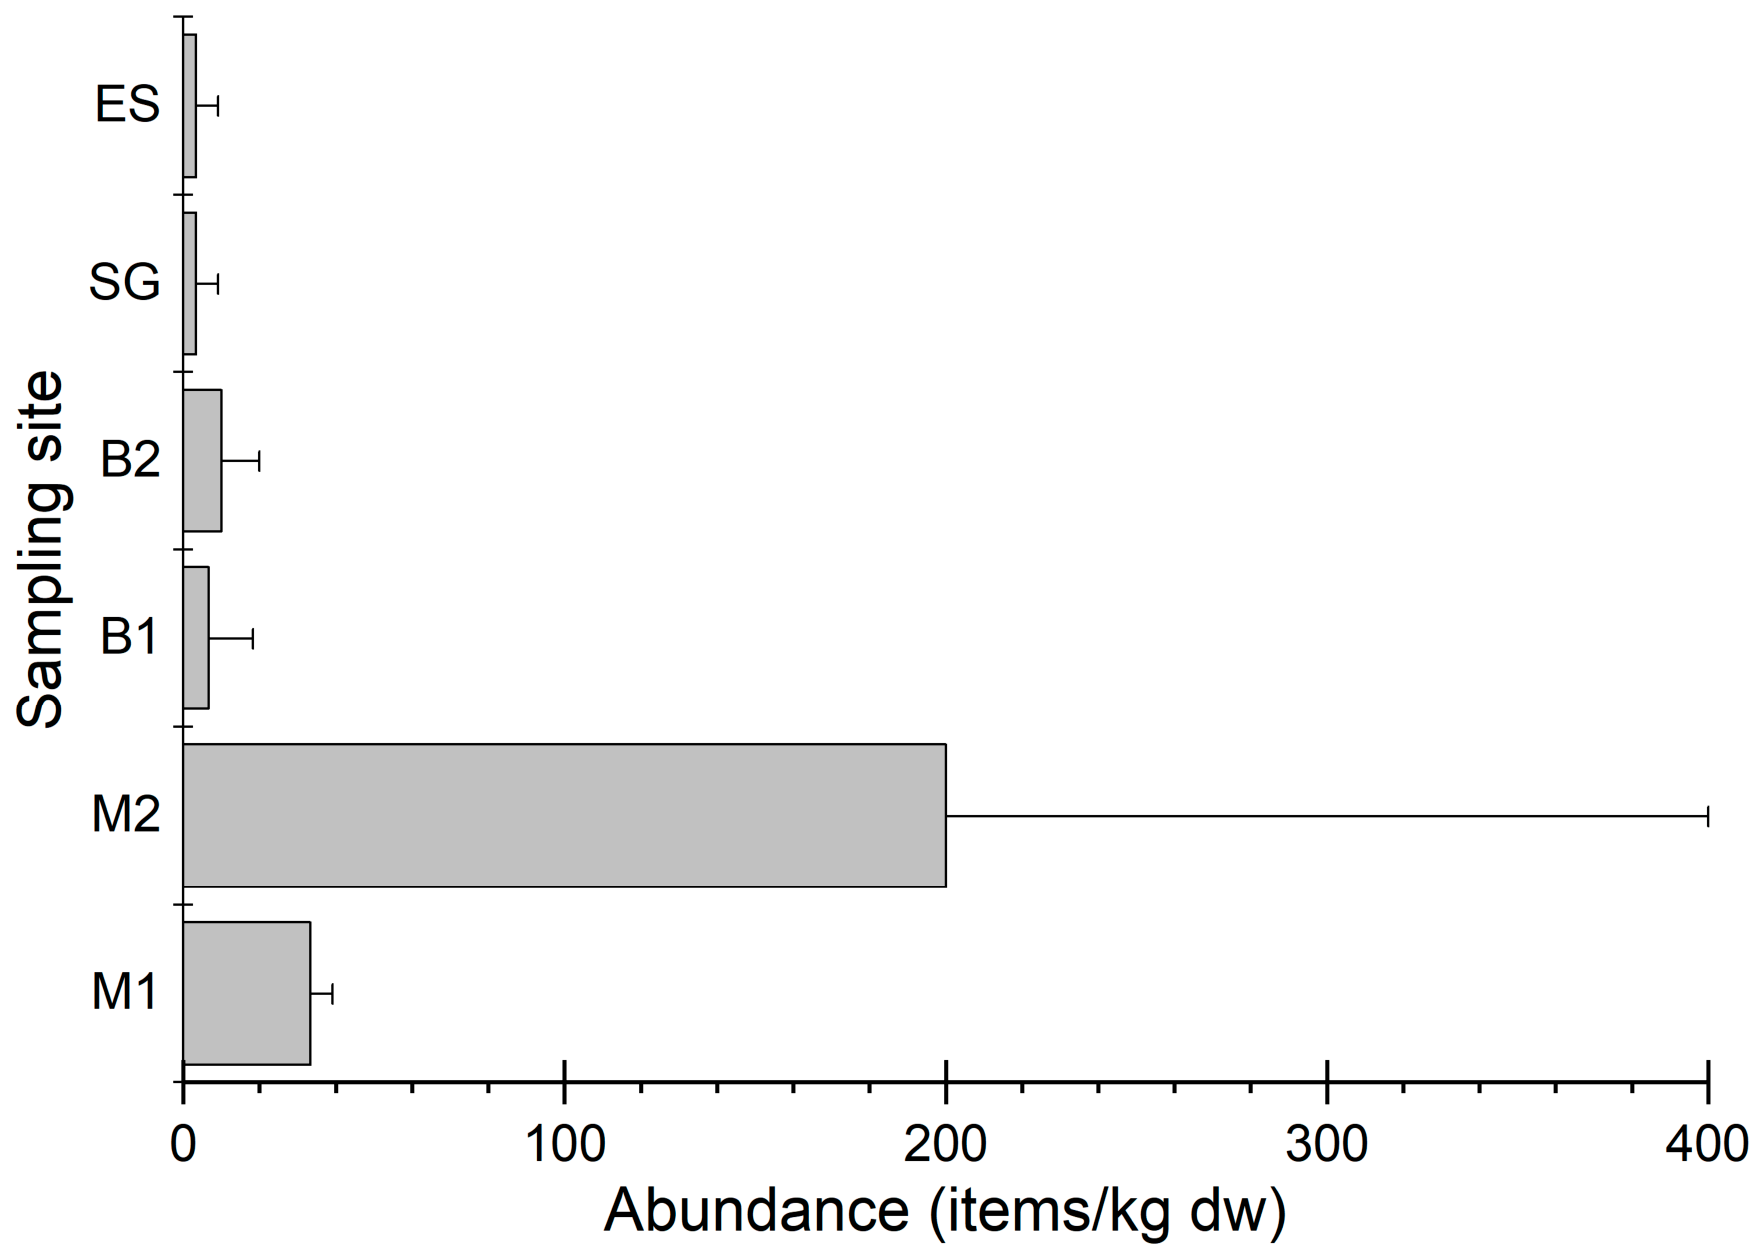
Microplastic particles were confirmed in all sampling sites (sediments and surface water). A total of 180 suspected microplastic particles were analyzed using FTIR. Only 52% (93 particles) were confirmed polymers (Table 1). The mean abundance of microplastics (items/kg) varied across sampling sites, with mangrove site M2 exhibiting the highest mean density (200 items/kg dw), followed by mangrove site M1 (approximately 30–40 items/kg). In contrast, the two beach sites (B1 and B2), seagrass (SG), and estuary bed (ES) recorded comparatively lower abundances, generally below 20 items/kg dw (Figure 2). Subsequently, surface water along the estuary shows a notable microplastic abundance, with 4.27 items/m3 (Table 1). Additionally, the blank controls were examined and showed no detectable microplastic contamination. However, despite clear variation in mean microplastic abundance across matrices, statistical analysis indicated that these differences were not significant (p > 0.05) (Table S2). The large standard deviation observed in M2 suggests considerable variability within the replicate sample. Similarly, the overlap of the error bars among the different matrices further supports the absence of statistically significant differences in microplastic abundance between locations.
Figure 2.
Abundance of microplastics in different environmental matrices, items/kg mean density ± standard deviation. M1 + M2: mangroves; B1 + B2: beach; ES: estuary bed; SG: seagrass; SW: surface water.
3.2. Morphological Characteristics of Microplastics
3.2.1. Microplastic Color
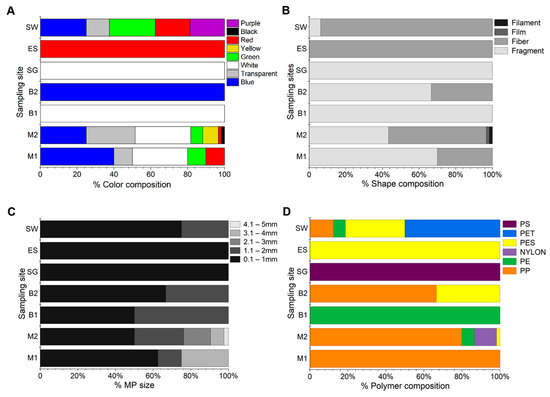
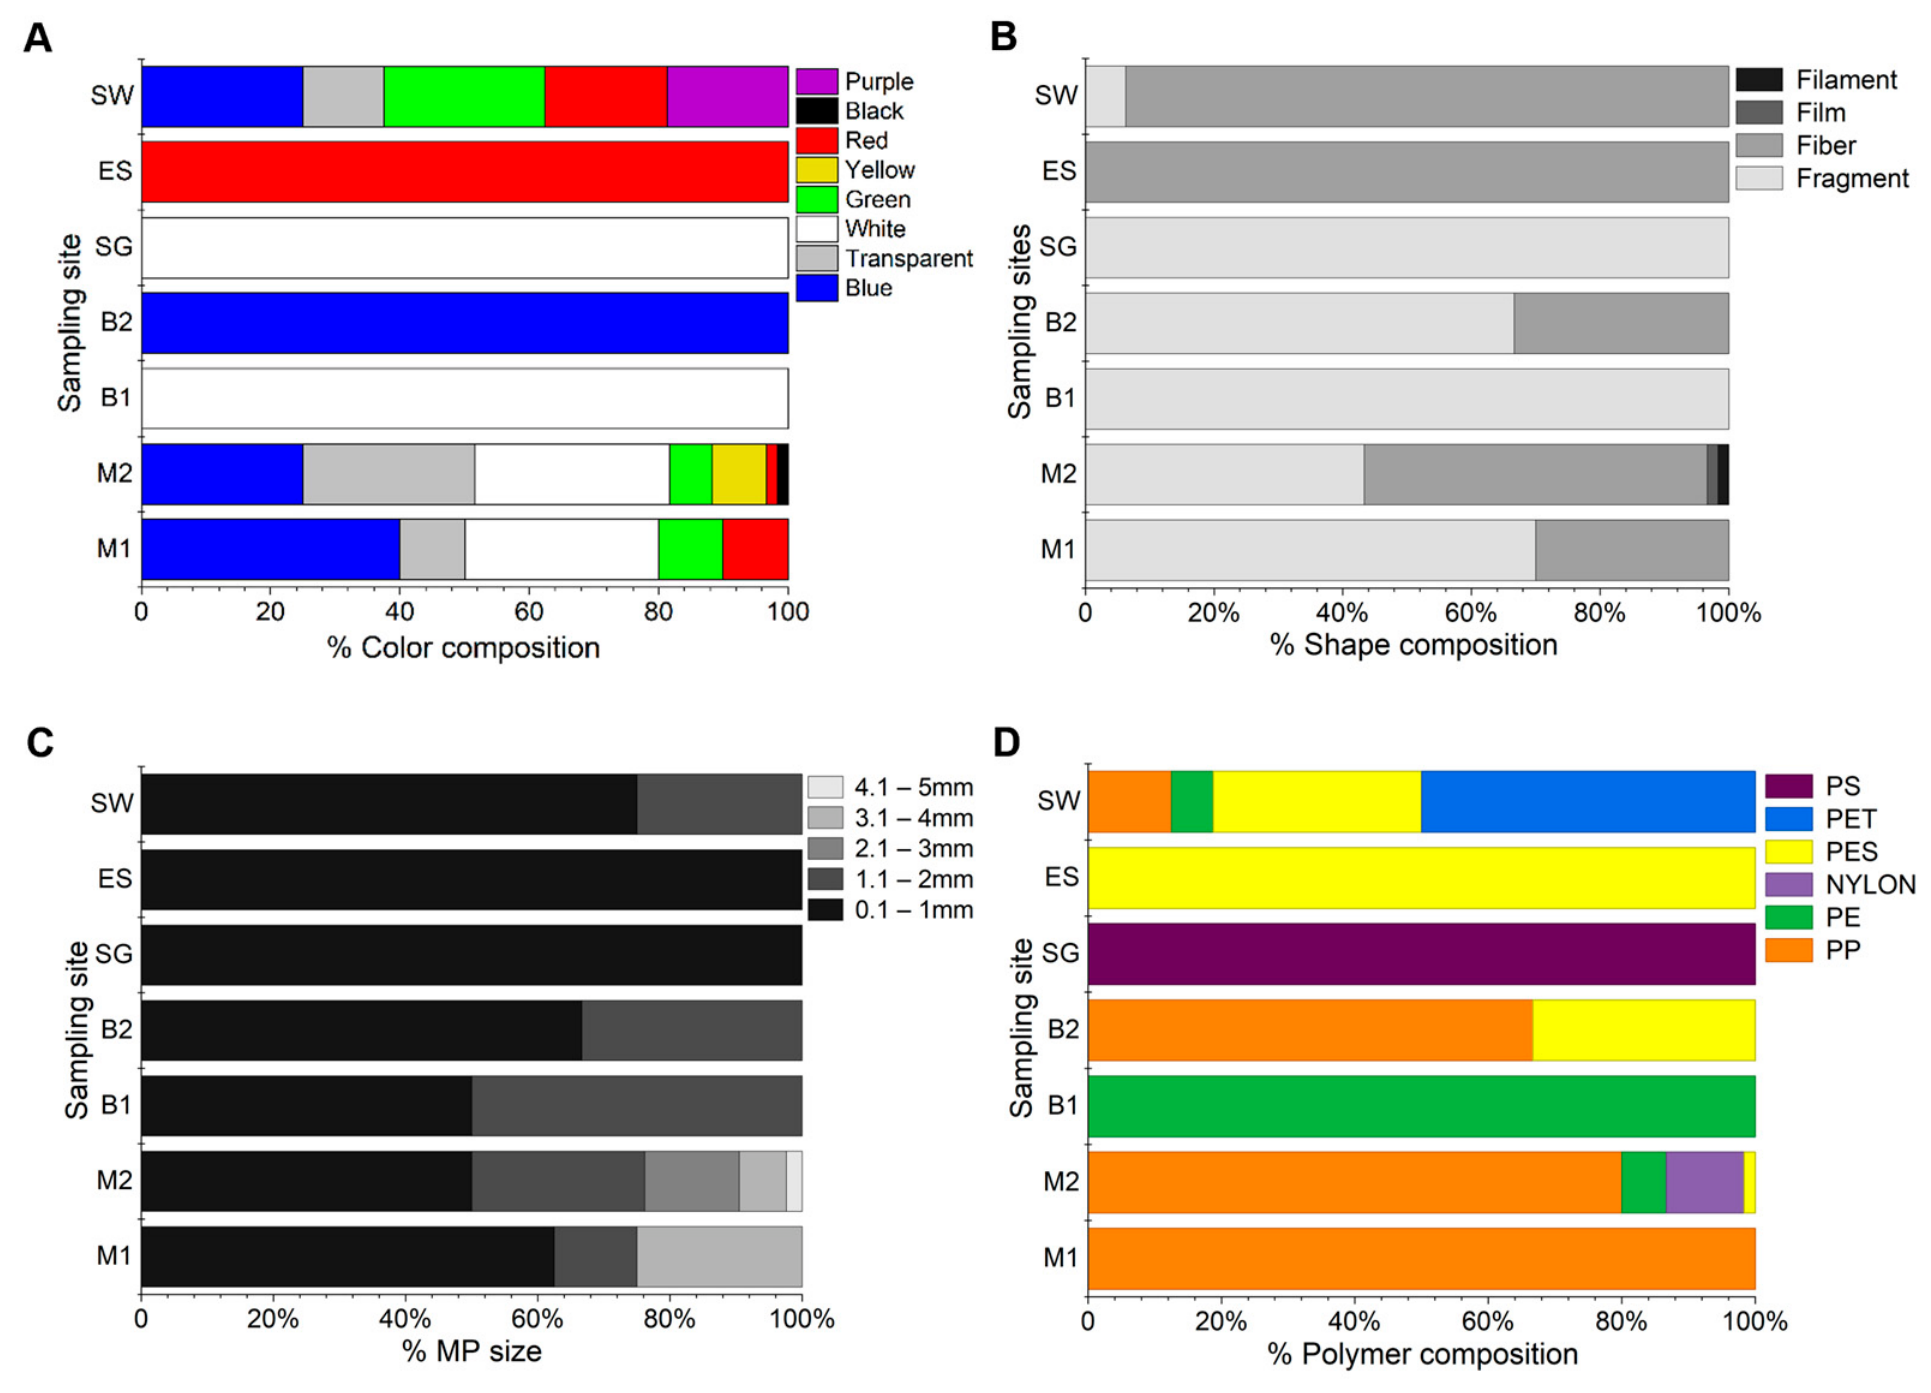
The percentage composition of different colors across several sampling sites revealed clear differences in color dominance (Figure 3A). Most sampling sites (M1, M2, B2, and SW) are strongly dominated by blue microplastics. M2 is characterized primarily by blue and white microplastics with only small traces of yellow, whereas B2 and M1 also contain a large blue segment. Consequently, all microplastics in B1 show a single white color dominance, while ES and SG each contain single microplastics, which explains their color dominance.
Figure 3.
Composition of microplastics in different environmental matrices: (A) color; (B) shape; (C) size; and (D) polymer types. Polystyrene (PS), polyethylene terephthalate (PET), polyester (PES), nylon, polyethylene (PE), and polypropylene (PP).
3.2.2. Microplastic Shape
Four microplastic shapes (fragments, fibers, films, and filaments) were recovered across seven sampling sites (M1, M2, B1, B2, SG, ES, and SW) (Figure 3B). Fibers and fragments dominate across sites, typically accounting for the vast majority of particles and often exceeding 70–90% of the total shape composition. Sites (SG and B1) showing minimal shape diversity contain exclusively fragments. Additionally, SW and ES show high fragment concentrations with only small amounts of fibers. In contrast, fibers are among the most common microplastic types and are particularly prominent in B2, M1, M2, and SW, which together account for a substantial portion of total microplastics. Moreover, films and filaments are scarce across all sites, emerging only in trace amounts, with M2 showing the highest diversity by containing all four shape categories. Fisher’s exact test revealed a significant association between microplastic shape and sampling site (p < 0.05), indicating that different matrices were characterized by distinct microplastic shape compositions, likely reflecting differences in source inputs, transport mechanisms, and retention processes. However, the association is weak (Cramér’s V = 0.26), suggesting that spatial variation of microplastic shape is present but not strong at the full dataset. Post hoc standard residual analysis showed that this relationship was primarily driven by site SW, where fibers were observed in significantly higher abundance (Std. Residual = +3.35), while fragments were significantly under-represented (Std. Residual = −3.13). In contrast, all other sites exhibited only minor deviation from expected frequencies, and rare shapes (film and filament) did not contribute meaningfully to spatial variation due to low occurrence (Table S3).
3.2.3. Particle Size
The percentage distribution of microplastic (MP) particle sizes across different sampling sites (SW, ES, SG, B2, B1, M2, and M1) is shown in Figure 3C. The smallest size fractions (0.1–1 mm and 1.1–2 mm) dominated the microplastic composition. The matrices (SW, ES, and SG) consist almost entirely of particles smaller than 2 mm, indicating a highly fragmented microplastic composition. Subsequently, B2 and B1 have the predominance of the smallest size class and a noticeable increase in the 1.1–2 mm and 2.1–3 mm fractions. The M2 and M1 display the greatest diversity in particle size, with substantial proportions of larger microplastics (3.1–4 mm and 4.1–5 mm), particularly in M2, which shows the highest proportion in the largest size class, a possible factor in trapping more microplastic sizes. In addition, sites that are more exposed to the coastal zone (SW, ES, and SG) contains finer microplastics, whereas M1 and M2 contain comparatively more large plastic fragments. However, microplastic size was not run through Fisher’s test due to the lower total count and did not align with the total microplastics. This is due to extreme fragmentation of the particles, making it impossible to measure using a stage micrometer.
3.2.4. Polymer Type
Analysis of polymer composition (Figure 3D) revealed the presence of confirmed microplastics at seven sampling sites (M1, M2, B1, B2, ES, SG, and SW) (Figure S1). Each site has a distinct polymer profile showing PP (68.9%) as the most prevalent polymer type. For SW, the observed composition is relatively mixed, with notable contributions from PET and PES and smaller amounts of PE and PP. Other sites (ES and SG) were dominated entirely by PES and PS, respectively. Based on the data, ES and SG each contain only one confirmed microplastic (Table 1). In contrast, the beach site (B2) is characterized primarily by PP, followed by PES, implying a strong presence of packaging and consumer product plastics. On the other hand, B1 contained only PE, which may possibly have come from a single source. M2 has a different pattern and the most diverse polymer types, with PP forming the majority of the composition and smaller fractions of nylon, PE, and PES. Moreover, M1 was almost entirely composed of PP, representing the strongest single-polymer dominance on mangrove sites (Table 1).
The association between sampling site and polymer type was highly significant (x2 = 197.13, p < 0.001), indicating that polymer type was not independent of site. Because several cells contained low expected frequencies, a Fisher’s exact test with Monte Carlo simulation was additionally performed and likewise proved a significant association (p < 0.001) (Table S4). The effect size was large (Cramér’s V = 0.6511), suggesting a strong relationship between sampling location and polymer type. Standard residual analysis showed that this relationship was driven by distinct site-specific enrichment patterns. PP was significantly over-represented at M1 and M2, while PE was strongly associated with B1. PES was significantly enriched at ES and SW, whereas PET showed a strong concentration in SW (Std. Residual = 6.49), and PP was under-represented in the same site (Table S4). Overall, the polymer types vary considerably by location, with some sites showing mixed microplastic sources and others reflecting clear dominance of specific polymer categories such as PES, PE, or PP (Figure 3D).
3.3. Evaluation of Microplastic Pollution in Different Matrices
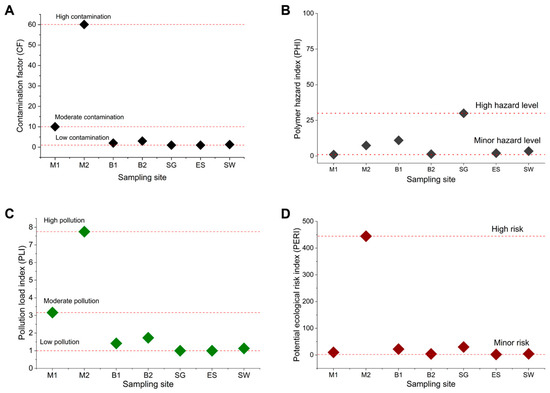
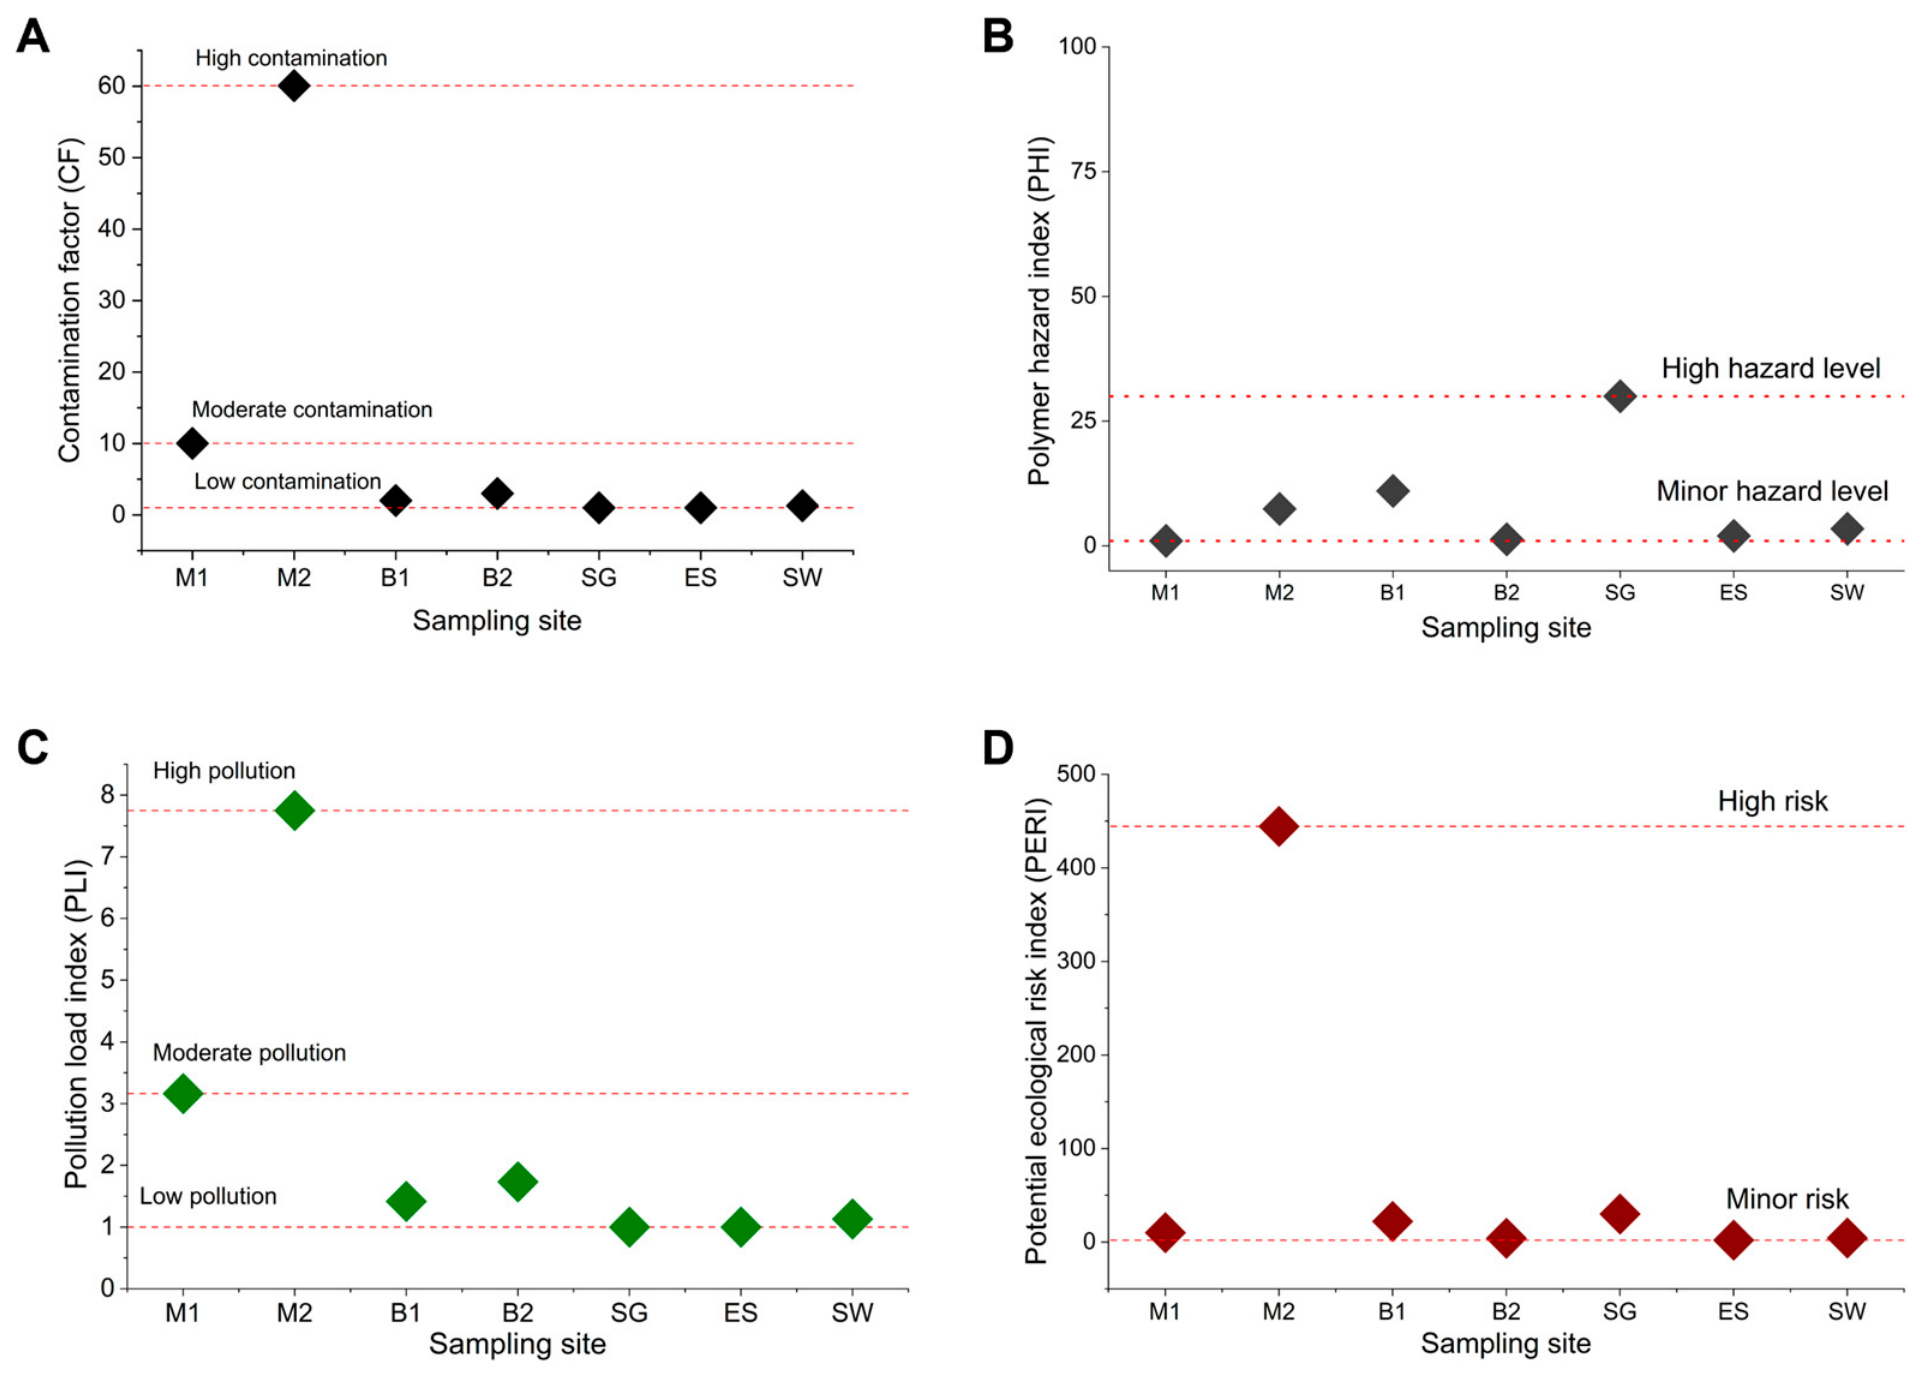
Contamination factor (CF) was measured at different environmental matrices (M1 + M2: mangrove; B1 + B2: beach; ES: estuary bed; SG: seagrass; SW: surface water). The CF value indicates the degree of contamination at each site relative to the background concentration. At all sites, M2 has relatively high microplastic contamination, with a CF = 60, far higher than at the other site, indicating major microplastic contamination. Moderate contamination observed in M1, where the CF value is about 10–12, much lower than in M2. This moderate contamination may possibly be influenced by the same sources but to a lesser degree. In contrast, the sites (B1, B2, SG, ES, and SW) have low microplastic contamination, with a value CF < 4. These sites show minimal contamination, likely near the background concentration. Moreover, beach sites (B1 + B2) are slightly higher than the sites SG, ES, and SW but still lower than the mangrove sites (M1 + M2).
Figure 4B displays the polymer hazard index (PHI) for microplastic samples recovered at each environmental compartment. This quantifies the hazard level of microplastic pollution in the different environmental compartments. The hazard threshold was measured at each site to determine the hazard level. The seagrass bed (SG) site showed a high polymer hazard (PHI ≈ 25) compared to other sites. Although SG has low microplastic abundance, its polymer type (polystyrene) makes it a highly hazardous type (Figure 3D). Other sites, such as B1 and M2, show a slightly minor polymer hazard threshold (PHI ≈ 5). Even though these sites pose a low or slightly higher polymer hazard level, this can still produce a notable hazard potential above background levels. In addition, the remaining sites (M1, B2, ES, and SW) show a very low PHI that approaches zero (0), indicating a low polymer-associated hazard (Table S5). The polymers present in these sites (PE, PES, PET, and PP) are more likely to be of lower concern regarding toxicity based on the polymer hazard scores in the study by Lithner et al. [46]. In general, PHI levels are not uniform across the environmental compartments, and SG is the concerning site, a possible localized source of polystyrene that has a higher hazardous level.
Figure 4.
Risk assessment of microplastics in different environmental matrices. (A) Contamination factor (CF); (B) polymer hazard index (PHI); (C) pollution load index (PLI); (D) potential ecological risk index (PERI).
The pollution load index (PLI) was used to assess the overall level of microplastic contamination at each sampling site. Figure 4C compares the overall pollution load index per site, showing M2 as the dominant site among the other matrices. Mangrove sites (M1 + M2) have high microplastic loads, with PLI values of 3.16 and 7.75, respectively (Table S6). Beach sites also show a moderate pollution load index (PLI~2). In contrast, sites SG and ES show a very low pollution index with PLI = 1; this is due to the baseline reference, since these sites were used as background concentration for computing the PLI. Possible factors at mangrove sites have been observed; however, no significant differences have been confirmed between the matrices.
The potential ecological risk index (PERI) was used to evaluate the risk posed by microplastics across different environmental matrices. Mangrove site M2 has the highest ecological risk identified (PERI = 444.44) (Table S7). This site is among the greatest concerns, as it has a very high risk index (Figure 4D) and warrants further investigation and management attention for the long-term ecological implications in this localized hotspot. The seagrass site (SG) and beach site (B1) have moderate ecological risk of microplastic contamination (PERI = 30 and 22.03, respectively); they can still pose potential impacts on the environment and organisms. However, other sites, such as M1, B2, ES, and SW, show a low ecological risk of microplastics (PERI < 10) and are among the least concerned sites but still require effective management to reduce the potential risk.
3.4. Correlational Analysis of Microplastic Mean Density and Pollution Indices
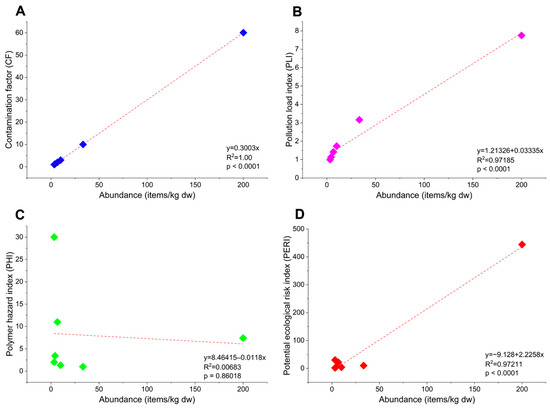
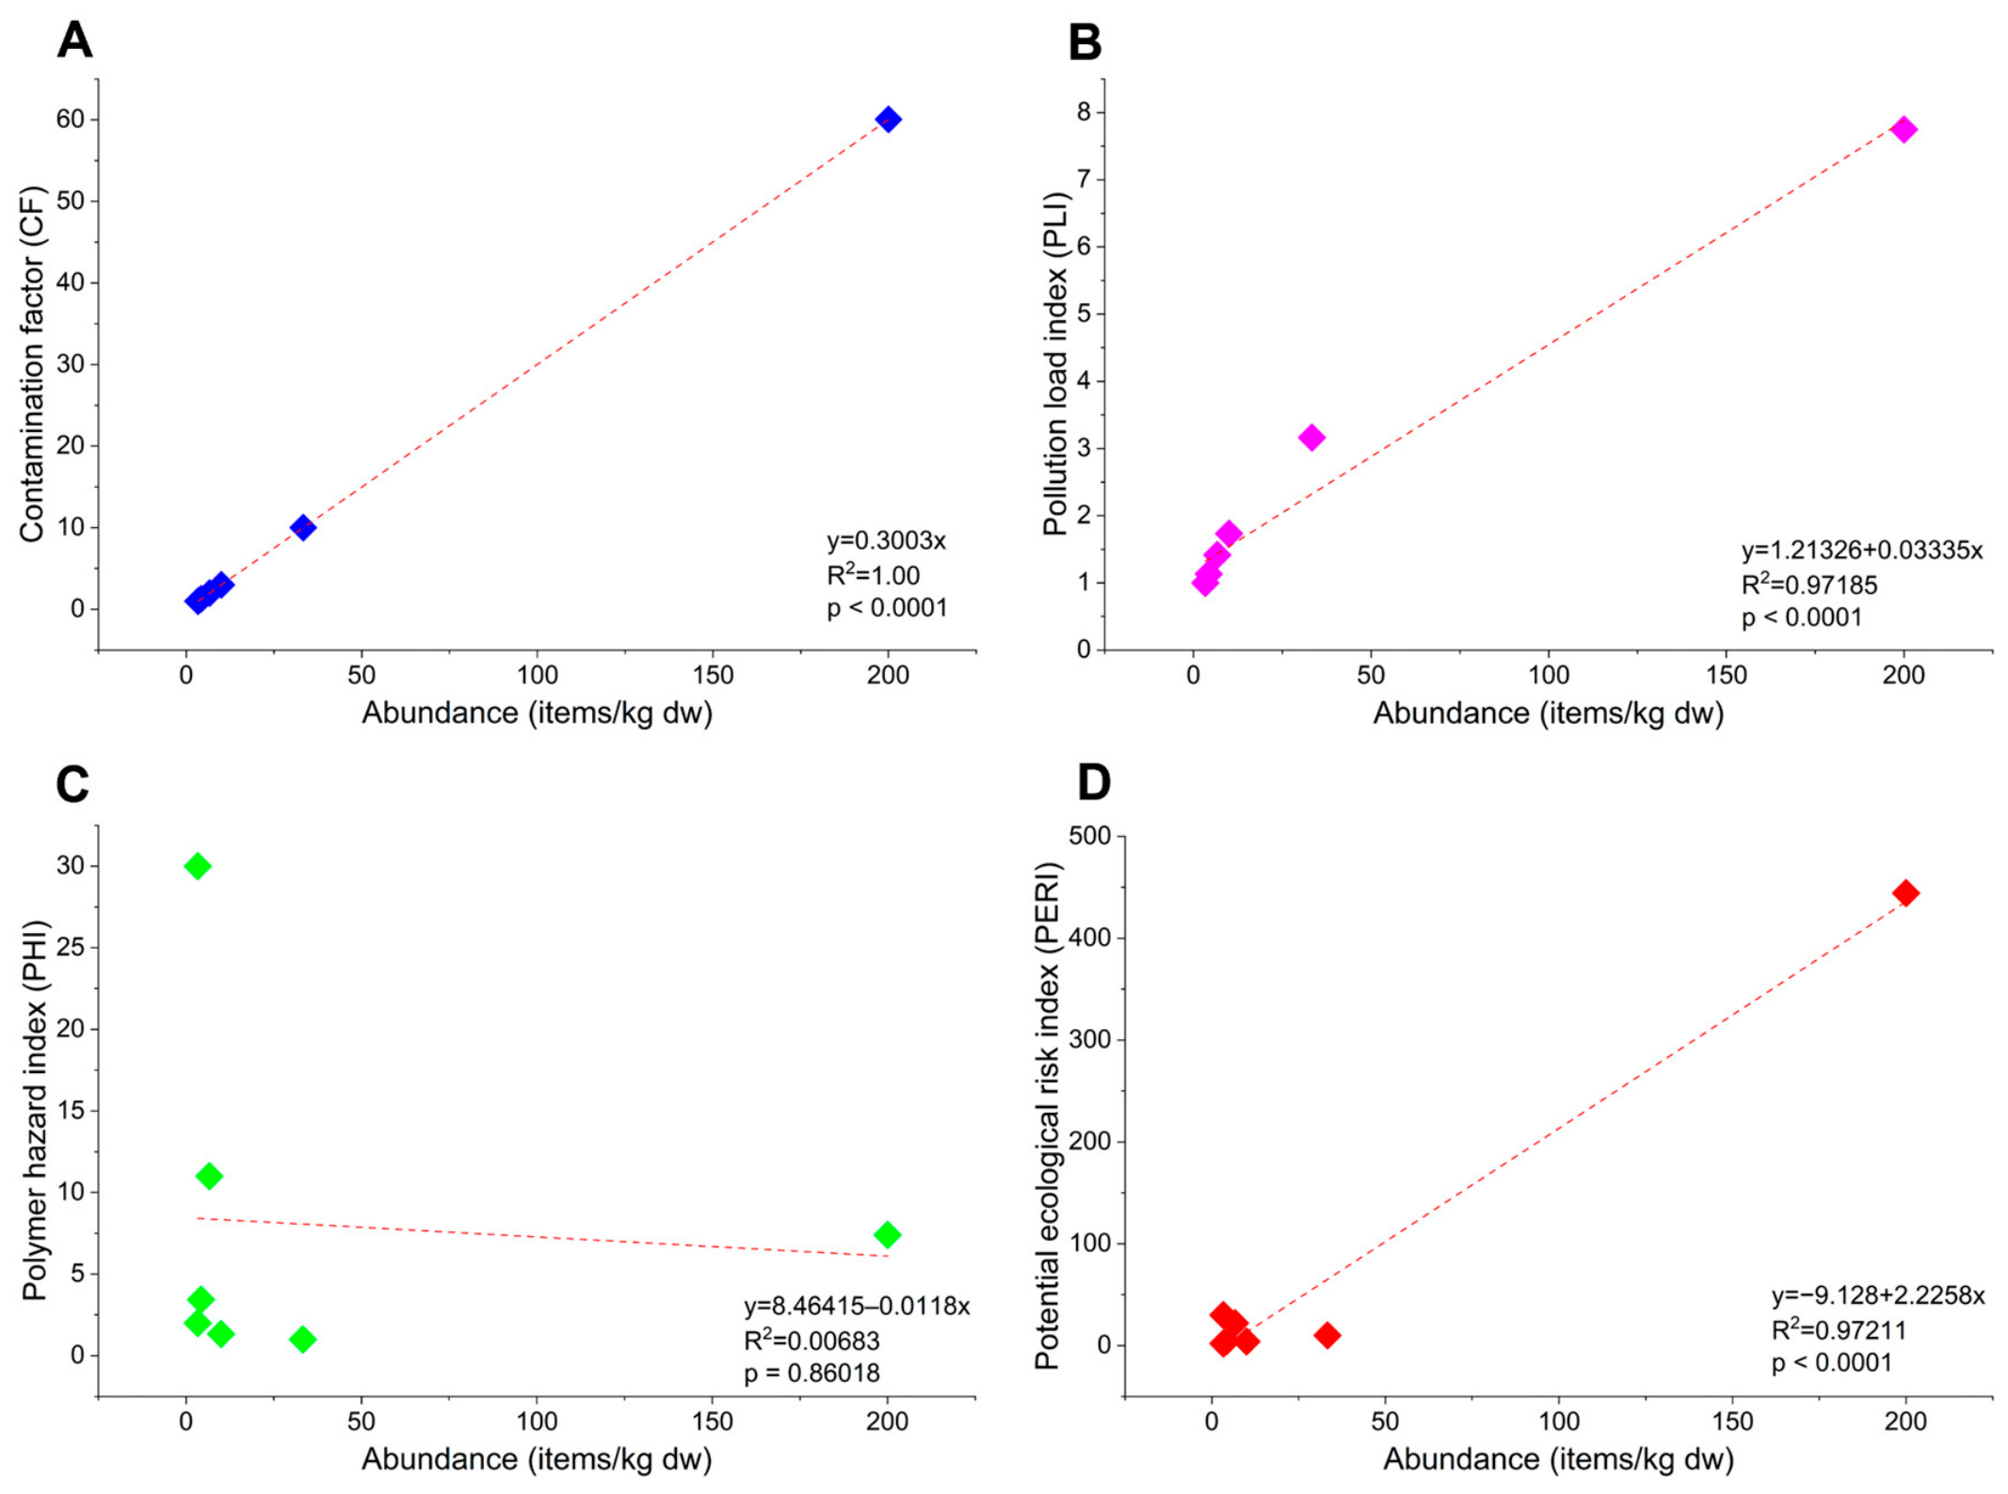
Spearman correlation analysis was used to determine the relationship between microplastic concentration and the pollution indices (CF, PLI, PHI, and PERI) in different coastal environmental matrices (Figure 5). A highly significant correlation was found between microplastic contamination and CF (R2 = 1, p < 0.0001), indicating that higher microplastic contamination is associated with higher CF (Figure 5A). In the same way, the PLI shows a strong and highly significant correlation with microplastic contamination in different matrices (R2 = 0.971, p < 0.0001), which also corresponds to a direct proportional relationship between the PLI and MP concentration (Figure 5B). Similarly, the potential ecological risk index (PERI) shows a strong, highly significant correlation with microplastic concentration (R2 = 0.972, p < 0.0001), indicating that the PERI is linked to microplastic concentration across different environmental matrices (Figure 5D). While these correlations confirm that risk levels increase with higher particle loads, it is important to note that such strong relationships are mathematically expected, as these indices are partially derived from microplastic abundance. In contrast, the PHI shows no significant correlation (R2 = 0.007, p = 0.860) (Figure 5C).
Figure 5.
Correlation of microplastic abundance (items/kg dw) in different coastal environmental matrices with pollution indices. (A) Microplastic abundance vs. contamination factor (CF). (B) Microplastic abundance vs. pollution load index (PLI). (C) Microplastic abundance vs. pollution hazard index (PHI). (D) Microplastic abundance vs. potential ecological risk index (PERI).
3.5. Non-Metric Multidimensional Scaling (NMDS)
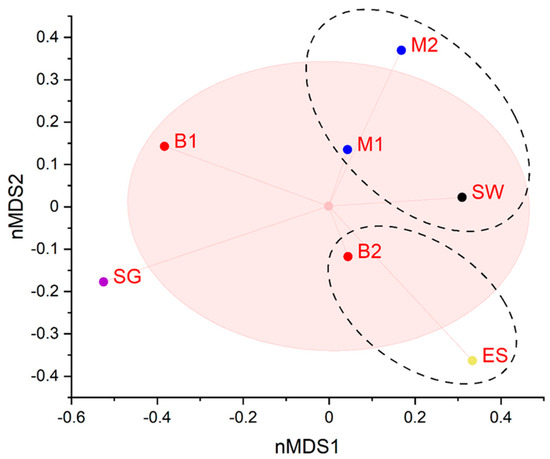
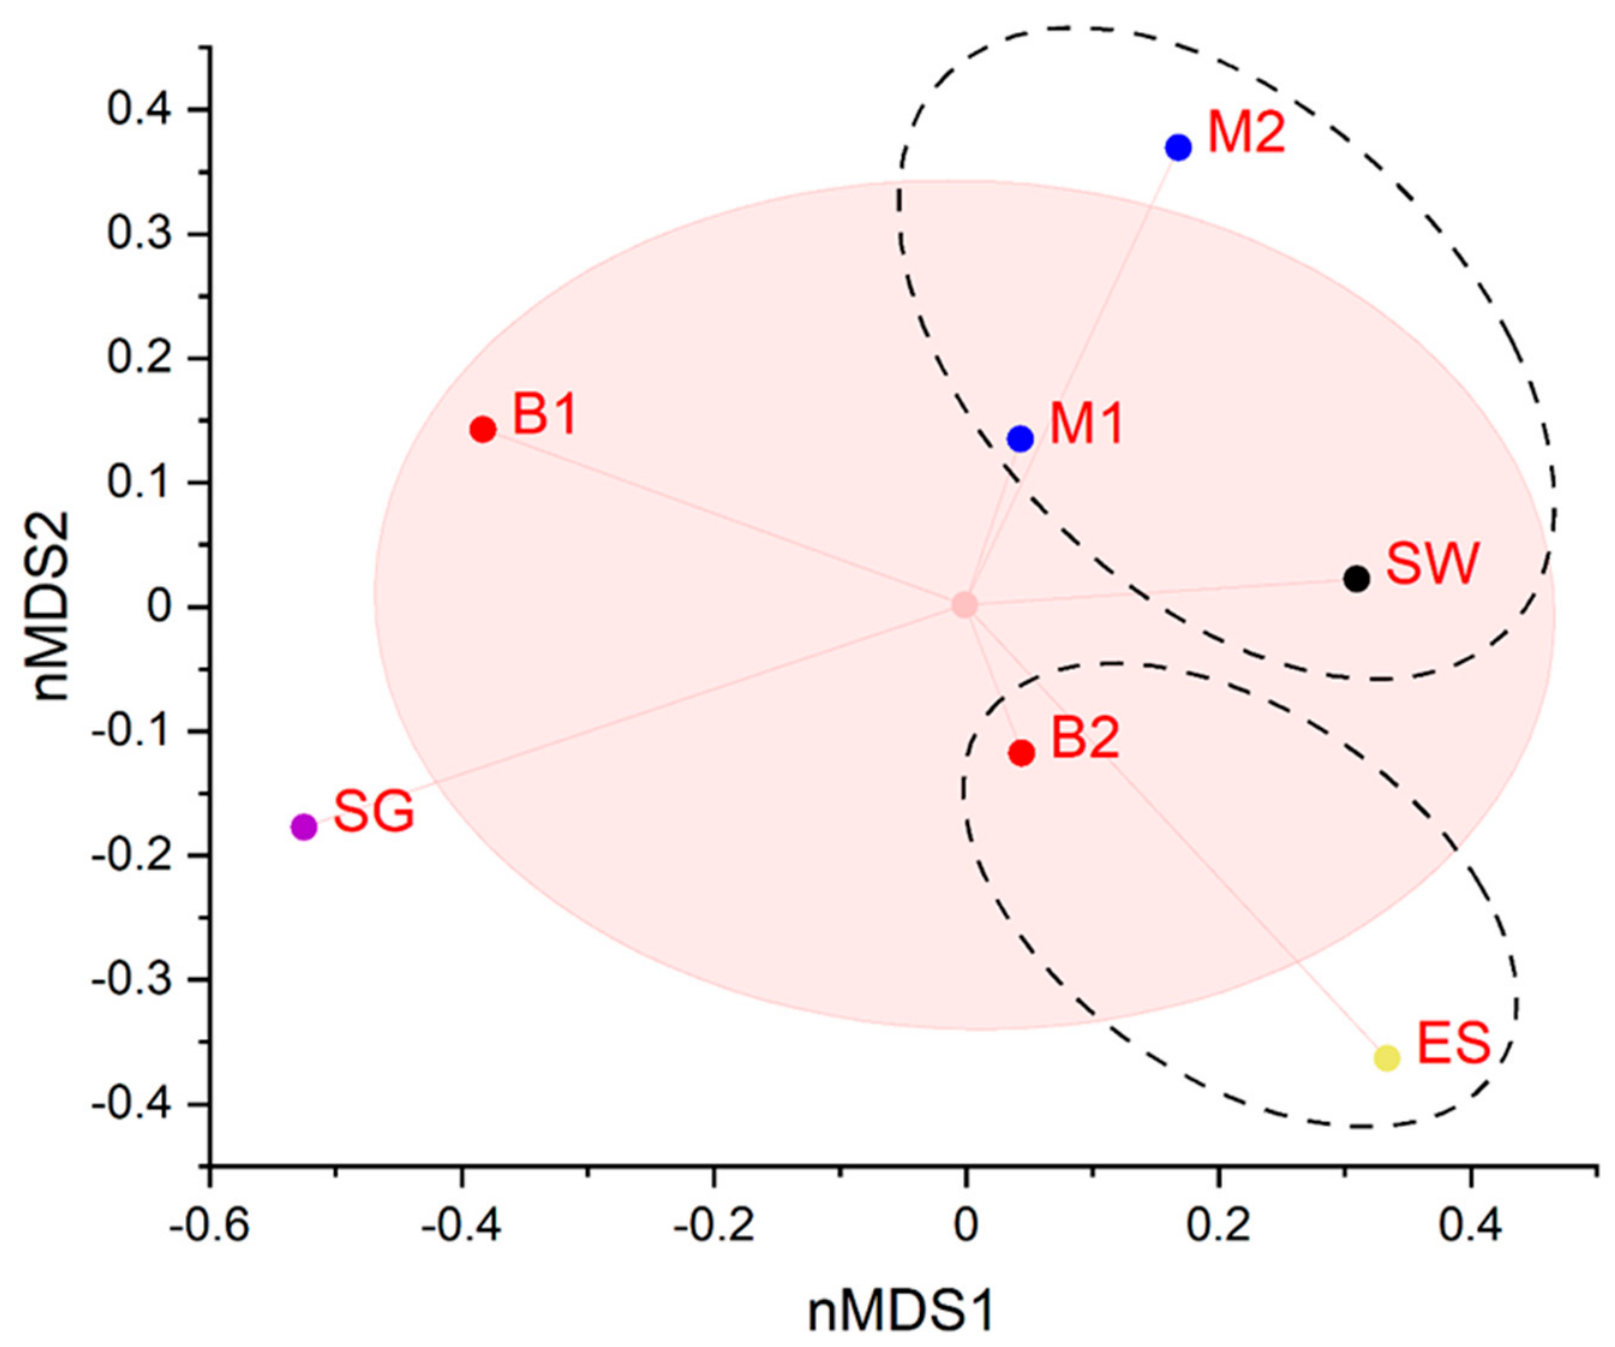
Non-metric multidimensional scaling (NMDS) was used to evaluate similarities in microplastic characteristics among sampling sites. The analysis represents the distance relationships among matrices in a two-dimensional ordination while preserving the rank order of dissimilarities, as indicated by the stress value. The NMDS plot yielded a stress value of 0.034, which is acceptable, as values below 0.1 indicate that the two-dimensional projection is accurate (Figure 6). The NMDS revealed clustering of sites, with M1, M2, and SW clustering together, likely indicating that these sites shared common microplastic characteristics. Sampling sites positioned closer together exhibited similar multivariate microplastic fingerprints across size, shape, color, and polymer type. Among the matrices, mangrove sites (M1 + M2) and surface water (SW) showed high and similar abundance of microplastic characteristics, resulting in tight clustering. Subsequently, B2 and ES exhibited lower abundance and restricted polymer and color profiles, forming a separate cluster (Figure 3). Meanwhile, B1 and SG appeared isolated in the ordination, reflecting their distinct and lower-diversity microplastic profiles. This separation may be associated with their adjacent sampling locations and the potential influence of a limited or common microplastic source (Figure 1).
Figure 6.
Non-metric multidimensional scaling (nMDS) ordination of microplastic characteristics among coastal matrices. Clustering indicates similar microplastic assemblages, while separation reflects differences in environmental conditions, transport dynamics, and potential sources.
4. Discussion
This study examined the distribution of microplastics across different coastal environmental matrices, with mangrove sediments showing the highest microplastic abundance, while sandy beaches and other matrices showed comparatively lower contamination. Differences in microplastic characteristics across matrices support the hypothesis that coastal environments function as sinks for various microplastic types, driven by physical retention mechanisms and environmental factors [5].
Across all coastal environmental matrices, although M2 exhibited a numerically higher microplastic abundance, the absence of significant differences among locations suggests that microplastic contamination was relatively widespread. The limited sample size (n = 3 per site), the lack of a standardized protocol for microplastic recovery, and an uneven number of sampling sites may have indirectly affected the high variability observed across environmental matrices and contributed to the lack of statistical significance [55]. This may be attributed to limited statistical power, which may have been insufficient to overcome the high spatial variability typically observed in sediment microplastic studies, including uneven particle distribution, localized deposition, and environmental heterogeneity [11,40]. This was aligned with the studies of Andoy et al. [1] and Menezes et al. [40], where microplastics in mangroves are primarily driven by anthropogenic activities. However, due to not significant differences, these potential influences cannot be conclusively distinguished from natural spatial variation within the sampling area.
On the contrary, the generally low abundances observed in B1, B2, SG, and ES may be attributable to reduced pollution inputs or to continuous sediment mixing and transport processes that limit microplastic accumulation [56]. Some possible factors were observed, including tidal action, sediment type, and water circulation, which contribute to the relatively uniform distribution of microplastics across matrices [57,58,59]. The lack of significant spatial variation suggests that microplastics are dispersed across the matrices rather than concentrated exclusively in specific locations [60]. Similar studies have been reported in other coastal and marine environments where hydrodynamic processes promote the resuspension of microplastics into the surface water column [34,61,62], which was likely to have influenced the observed microplastic concentration in the surface water in this study. Hydrodynamic conditions also promote the redistribution of microplastics across sediments [1,6]. This emphasizes that microplastic contamination can become ubiquitous in coastal sediments, acting as a generalized, rather than a localized, environmental issue [63].
Diverse microplastic characteristics were observed at the sampling sites, including color, shape, size, and polymer type. Regarding microplastic color, blue was the most dominant color observed across the sampling sites. This pattern aligns with the literature confirming that blue microplastics are the most abundant and are derived from fishing gear, textiles, and maritime activities [40,64,65]. Microplastic blue can pose a threat to marine wildlife because it is visually appealing and resembles natural prey [66]. An evident study of microplastics in fish found high levels of blue microplastics in the fish [67]. Subsequently, a notable portion of white microplastic was also observed across other sites (M1, M2, B1, and SG), which likely originates from the breakdown of consumer products; plastic packaging, disposable plastic cups, food containers, and industrial materials [49,68]. White microplastics resemble natural prey of marine wildlife and can pose a risk due to their plastic toxicity [66,69].
The distribution of microplastic shape across the site shows a clear spatial heterogeneity, but this variation is not uniform or widespread. Although Fisher’s exact test indicates a statistically significant association between site and microplastic shape, the relatively moderate effect size suggests that site is partially explains variability in particle morphology. Standardized residuals identified that SW was a clear outlier with a significant excess of fibers and a deficit of fragments. This suggests that SW is influenced by distinct input or retention processes compared with other matrices and likely influenced by transport dynamics [70]. One plausible reason is proximity to anthropogenic sources such as wastewater discharge, laundry effluent, or urban runoff, which are commonly associated with elevated fiber contamination due to textile shedding [71].
Subsequently, fragments and fibers were predominantly observed across mangrove and beach sediments, which is consistent with other published studies (Table 2) [1,6,10,36,72,73,74,75,76]. The predominance of fragments in mangrove and beach sediments is likely due to several factors. This includes the geographic location, which is adjacent to residential areas [77], and is likely due to wastewater discharge, fishing gears, and coastal leisure activities that trap and settle in different matrices [1,73]. Based on the study of Vdovchenko et al. [78] and Kim et al. [79], this is attributed to the breakdown of trapped larger plastic items into irregular pieces through mechanical abrasion, UV radiation, and chemical weathering. Subsequently, fibers were also observed across these sites, possibly from textiles and fishing nets. Many studies confirm that microplastics found in mangrove sites originate from wastewater-associated discharge and previously identified fishing-related inputs [80,81], whereas microplastics in beach sediments are likely due to the sampling location (high strandline) and beach litter [49]. Small portions of film and filament in all the matrices suggest that a strong environmental process is occurring or that limited sources of textiles and plastics are available [82]. Additionally, the same microplastic shape was observed on the adjacent site (ES and SG) with a small count, likely influenced by a combination of environmental, hydrodynamic, and sampling-related factors [83]. However, this study may have limitations, as we focused only on surface sediments and surface water, which could lead to over- or underestimation of microplastics. This finding suggests that the predominance of fragments results from the mechanical breakdown of plastic products in these sampling areas, whereas fibers, likely associated with textile-derived materials and wastewater discharge, are detected only at a few specific locations [6]. Overall, the result indicates that microplastic shape composition is stable across most sites but is significantly altered in SW, which appears to function as a localized hotspot of fiber accumulation.
Table 2.
Comparison of microplastics (abundance, size range, dominant shape, and polymer type) from this study and other matrices.
Diverse microplastic sizes are distributed to different matrices, ranging from 0.1 to 5 mm. However, smaller (0.1–1 mm and 1.1–2 mm) microplastics were consistently observed across all matrices. This abundance suggests that smaller microplastics found in water and sediments are due to transport behavior (buoyancy and sinking) [81]. Another pattern observed in the prevalence of smaller microplastics is due to fragmentation of larger plastics through physicochemical processes, tidal waves, and biological processes [49]. Based on the size-dependent toxicity, tiny plastic particles are more toxic compared to larger plastic particles, which means microplastics in this study pose a threat to organisms that mistakenly ingest them as food [45,84,85].
ATR-FTIR analysis revealed characteristic peaks (cm−1) of common polymers such as polystyrene (PS), polyethylene terephthalate (PET), polyester (PES), nylon, polyethylene (PE), and polypropylene (PP). The result highlights that PP (68.8%) is the prevalent polymer that dominates across matrices, followed by PES and PET, similar to the study of microplastics in Butuan Bay [6] and Palawan Island [10] (Table 2). A strong and significant association between the sampling site and polymer type was observed, supported by a large effect size. These demonstrate a spatial heterogeneity in polymer composition across sampling sites, suggesting the influence of different local microplastic sources and environmental transport processes. Potential sources of these microplastics may include the residential area nearby, the river, and coastal activities [1,6]. Most of the PP, PET, and PES microplastics are likely associated with blue fibers and fragments, which are commonly used for packaging, fishing gears, and textiles [6,49,86], which explains the spatial heterogeneity distribution across matrices.
The nMDS ordination revealed clear clustering of the samples [87]. The observed clustering suggests that sites under stronger marine influence tend to share more similar microplastic profiles, potentially dominated by widely distributed polymers such as polyethylene (PE) and polypropylene (PP), which are highly buoyant and commonly associated with secondary fragmentation that results from prolonged environmental weathering and hydrodynamic sorting [32]. Differences in size fractions also likely contribute to the separation pattern, with smaller particles being more widely dispersed across connected environments, while larger particles remain more localized due to limited transport and faster deposition [49]. This suggests that it may be due to wave action, sediment type (sandy gravel), tidal flushing, and wind-driven resuspension [58,59]. Additionally, variation in color composition may reflect differences in source materials and weathering stages, with transparent, white, and blue particles often indicating aged consumer plastics, whereas more heterogeneous coloration may suggest recent or site-specific inputs [49]. The clustering of the different environmental matrices suggests local sources of microplastics, such as fisheries-related activities and packaging. This aligns with the study of Li et al. [87], which confirms that coastal samples are clustered by microplastic characteristics, reflecting local sources like fisheries-related inputs. Additionally, the ordination highlights that the spatial structuring of microplastic assemblages is governed by interacting influences of polymer composition, transport dynamics, and environmental degradation processes across interconnected coastal matrices [87].
The potential threat posed by microplastics was observed across different coastal environmental matrices and revealed lower indices compared with those in the study on sandy beaches in Northern Mindanao [50]. The mangrove site (M2) had a relatively high contamination factor (CF) among sites and was significantly correlated with microplastic abundance [6,72]. Subsequently, the pollution load index (PLI) associated with the CF was also higher at M2 and significantly correlated with microplastic abundance across matrices. As stated by Kabir et al. [88], a site could be regarded as microplastic polluted when the PLI > 1. However, in this study, we use a uniform background concentration (Coi), as shown by Nakano et al. [8], which explains the high PLI per site. These findings were observed close to the reported result in mangrove areas along Butuan Bay, Philippines [72].
In contrast, the pollution hazard index shows a high hazard level for SG due to the polymer type present (PS), which has a higher hazard score [46]. For the PERI, the mangrove site (M2) also shows a high vulnerability to toxicological contamination by microplastics compared to non-mangrove matrices, confirming elevated ecological risk [72]. These results correlate with the abundance, specific polymers, and associated pollutants, which could pose a threat to ecological health [89]. However, the application of the CF, PLI, PHI, and PERI has its limitations in microplastic analysis due to the reliance on the abundance of microplastics and the predefined hazard weight provided in the study of Lithner et al. [46]. With these limitations, the use of indices is for the preliminary screening rather than direct measures of ecological risks because of several factors, which include weathering, sorption of environmental contaminants, and bioavailability [85].
Through a correlational analysis, all matrices show a strong correlation of microplastic abundance and associated ecological risk. The contamination factor (CF), pollution load index (PLI), and potential ecological risk index (PERI) show significant correlations with microplastic abundance across matrices, whereas the pollution hazard index (PHI) shows no significant correlation. This result suggests that all the matrices are indeed polluted with associated risks. The result aligns with studies in Butuan Bay, Philippines [72], and Misamis Oriental, Philippines [49], in which the PLI and CF correlates with microplastic abundance, and the PERI shows a notable correlation. Unlike other indices, the PHI shows no correlation because it relies on polymer type across sites, indicating a limitation in predicting overall microplastic pollution [49].
Overall, coastal zones are especially vulnerable to microplastic contamination, as they receive inputs from both land-based and marine sources while supporting high biological productivity and intense human activity. Studies have shown that microplastics are common on coastal environment worldwide, with sediments often containing synthetic fibers. Their presence is more closely linked to human population density and wastewater, highlighting that everyday human activities are the main cause of microplastic pollution [90].
5. Conclusions
This study comprehensively assesses the horizontal distribution of microplastics (size, shape, and polymer type) across different coastal environmental matrices in the estuarine ecosystem and their potential ecological risk. This emphasizes that the horizontal distribution of microplastics across matrices is best described as compositional differentiation rather than uniform mixing, suggesting that microplastic characteristics vary depending on matrix type. Across all matrices, fragments and fibers dominated the shape categories, although their relative proportions varied spatially. Matrices characterized by fiber-dominated assemblages were distinct from fragment-dominated matrices, suggesting differences in retention and trapping mechanisms, whereas films and filaments contributed minimally to spatial differentiation. Polypropylene (PP) was the most prevalent polymer across matrices, reflecting its widespread use and buoyant behavior, while minor polymers such as polyethylene (PE), nylon, polyester (PES), and polyethylene terephthalate (PET) occurred only in certain matrices. Small-sized (0.1–2 mm) microplastics dominate, indicating widespread fragmentation and indirect transport. However, differences among matrices are driven solely by size, with larger microplastics consistently observed across sites, regardless of polymer type. Subsequently, microplastic abundance correlates with its associated ecological risk, in which the contamination factor (CF), pollution load index (PLI), and potential ecological risk index (PERI) show a significant correlation with microplastic concentration, while the pollution hazard index (PHI) shows an insignificant correlation, due to reliance on polymer composition, which unfolds its predictive capacity. Additionally, the matrices differ in environmental characteristics: M1 and M2 are both mangrove ecosystems; B1 and B2 are both beach sand; SG is a seagrass bed with sandy sediments; and ES is an estuary bed with sandy sediments and adjacent to surface water (SW). These differences indicate matrix-specific retention and transport processes that are more likely due to surface properties, hydrodynamics, and exposure to anthropogenic inputs. Although microplastic density did not differ significantly among matrices, the composition of microplastic varied significantly in terms of shape and polymer type, suggesting differences in sources and transport pathways. This reveals that the horizontal distribution pattern of microplastics is ordered by shape and polymer composition, with other matrices showing consistent microplastic composition, while some show higher internal variability. This indicates that indirect transport mainly redistributes microplastics, whereas matrix-specific interactions selectively retain particular polymer and shape combinations.
Overall, this study presented the horizontal distribution and associated risks of microplastics across different environmental matrices, along with their driving factors. However, future research should also focus on the mechanisms of microplastic partitioning (size, shape, and polymer type), as well as on associated environmental conditions and standardized methods, to provide a more comprehensive understanding of plastic pollution dynamics in the environment.
Supplementary Materials
The following supporting information can be downloaded at: https://www.mdpi.com/article/10.3390/microplastics5030132/s1. Table S1. The classifications of different pollution indices and their categories; Table S2. Kruskal-Wallis ANOVA showing the microplastic abundance; Table S3. Comparison of microplastic shape distributions among sampling sites based on (A) Pearson’s chi-square tests x Fisher’s exact test, (B) measures of association, and (C) contingency tables; Table S4. Comparison of microplastic polymer type distributions among sampling sites based on (B) Pearson’s chi-square tests x Fisher’s exact test, (B) measures of association, and (A) contingency tables; Table S5. Polymer hazard index (PHI) and hazard level of the sampling sites based on the identified polymers [52]; Table S6. Pollution load index (PLI) per sites based on the contamination factor of microplastics; Table S7. Potential ecological risk index (PERI) of the sampling sites based on the identified polymers; Figure S1. Polymer composition of collected microplastics, A–F (top) and standard polymer spectra, A–F (bottom). (A) Polystyrene, (B) Nylon, (C) Polyethylene terephthalate, (D) Polyethylene, (E) Polyester, and (F) Polypropylene.
Author Contributions
Conceptualization, investigation, formal analysis, and writing—original draft preparation, J.J.B.P.; writing—review and editing, J.R.U.M. and N.B.A.; conceptualization and writing—review and editing, R.A.R.II and R.-F.S.; conceptualization, supervision, investigation, formal analysis, and writing—review and editing, H.P.B. All authors have read and agreed to the published version of the manuscript.
Funding
This research received no external funding.
Institutional Review Board Statement
Not applicable.
Informed Consent Statement
Not applicable.
Data Availability Statement
All data are available in the main text.
Acknowledgments
The authors would like to thank the Department of Science and Technology–Science Education Institute (DOST–SEI) for the financial support provided through the Accelerated Science and Technology Human Resource Development Program (ASTHRDP). We are also grateful to the National Taiwan Ocean University (NTOU) for their valuable assistance in microplastic polymer analysis.
Conflicts of Interest
The authors declare no conflicts of interest.
References
- Andoy, C.J.M.; Ochigue, P.C.D.; Romarate II, R.A.; Rodil, M.S.P.; Nakano, H.; Bacosa, H.P. Spatial and Vertical Distribution of Microplastics in Mangrove Sediment in the Southern Philippines. Mar. Environ. Res. 2025, 209, 107223. [Google Scholar] [CrossRef] [PubMed]
- Adhikari, P.L.; Bam, W.; Campbell, P.L.; Oberhaensli, F.; Metian, M.; Besson, M.; Jacob, H.; Swarzenski, P.W. Evaluating Microplastic Experimental Design and Exposure Studies in Aquatic Organisms. In Environmental Contamination Remediation and Management; Springer International Publishing: Cham, Switzerland, 2021; pp. 69–85. [Google Scholar]
- Abrahms-Kavunenko, S. Toward an Anthropology of Plastics. J. Mater. Cult. 2021, 28, 3–23. [Google Scholar] [CrossRef]
- Dokl, M.; Copot, A.; Krajnc, D.; Fan, Y.V.; Vujanović, A.; Aviso, K.B.; Tan, R.R.; Kravanja, Z.; Čuček, L. Global Projections of Plastic Use, End-of-Life Fate and Potential Changes in Consumption, Reduction, Recycling and Replacement with Bioplastics to 2050. Sustain. Prod. Consum. 2024, 51, 498–518. [Google Scholar] [CrossRef]
- Arcadio, C.G.L.A.; Navarro, C.K.P.; Similatan, K.M.; Inocente, S.A.T.; Ancla, S.M.B.; Banda, M.H.T.; Capangpangan, R.Y.; Torres, A.G.; Bacosa, H.P. Microplastics in Surface Water of Laguna de Bay: First Documented Evidence on the Largest Lake in the Philippines; Springer Science and Business Media LLC.: Berlin/Heidelberg, Germany, 2022. [Google Scholar] [CrossRef] [PubMed]
- Navarro, C.K.P.; Arcadio, C.G.L.A.; Similatan, K.M.; Inocente, S.A.T.; Banda, M.H.T.; Capangpangan, R.Y.; Torres, A.G.; Bacosa, H.P. Unraveling Microplastic Pollution in Mangrove Sediments of Butuan Bay, Philippines. Sustainability 2022, 14, 14469. [Google Scholar] [CrossRef]
- Yousafzai, S.; Farid, M.; Zubair, M.; Naeem, N.; Zafar, W.; ul Zaman Asam, Z.; Farid, S.; Ali, S. Detection and Degradation of Microplastics in the Environment: A Review. Environ. Sci. Adv. 2025, 4, 1142–1165. [Google Scholar] [CrossRef]
- Nakano, H.; Alfonso, M.B.; Jandang, S.; Imai, K.; Arakawa, H. Microplastic Pollution Indexes in the Coastal and Open Ocean Areas around Japan. Reg. Stud. Mar. Sci. 2024, 69, 103287. [Google Scholar] [CrossRef]
- Laermanns, H.; Reifferscheid, G.; Kruse, J.; Földi, C.; Dierkes, G.; Schaefer, D.; Scherer, C.; Bogner, C.; Stock, F. Microplastic in Water and Sediments at the Confluence of the Elbe and Mulde Rivers in Germany. Front. Environ. Sci. 2021, 9, 794895. [Google Scholar] [CrossRef]
- Sajorne, R.E.; Cayabo, G.D.B.; Gajardo, L.J.A.; Mabuhay-Omar, J.A.; Creencia, L.A.; Bacosa, H.P. Disentangling Microplastic Pollution on Beach Sand of Puerto Princesa, Palawan Island, Philippines: Abundance and Characteristics. Sustainability 2022, 14, 15303. [Google Scholar] [CrossRef]
- Jiang, H.; Li, Z.; Zhu, L.; Zhou, J.; Huang, Y.; Sun, D. Comprehensive Review of the Co-Transport of Microplastics and Suspended Sediments in Aquatic Environments: Macroscopic Transport and Microscopic Mechanisms. Environ. Sci. Eur. 2025, 37, 210. [Google Scholar] [CrossRef]
- Darabi, M.; Majeed, H.; Diehl, A.; Norton, J.; Zhang, Y. A Review of Microplastics in Aquatic Sediments: Occurrence, Fate, Transport, and Ecological Impact. Curr. Pollut. Rep. 2021, 7, 40–53. [Google Scholar] [CrossRef]
- Schmidt, C.; Krauth, T.; Wagner, S. Export of Plastic Debris by Rivers into the Sea. Environ. Sci. Technol. 2017, 51, 12246–12253. [Google Scholar] [CrossRef] [PubMed]
- Costa, M.F.; Barletta, M. Microplastics in Coastal and Marine Environments of the Western Tropical and Sub-Tropical Atlantic Ocean. Environ. Sci. Process. Impacts 2015, 17, 1868–1879. [Google Scholar] [CrossRef] [PubMed]
- Nunes, B.Z.; Huang, Y.; Ribeiro, V.V.; Wu, S.; Holbech, H.; Moreira, L.B.; Xu, E.G.; Castro, I.B. Microplastic Contamination in Seawater across Global Marine Protected Areas Boundaries. Environ. Pollut. 2023, 316, 120692. [Google Scholar] [CrossRef] [PubMed]
- Cordova, M.R.; Ulumuddin, Y.I.; Purbonegoro, T.; Shiomoto, A. Characterization of Microplastics in Mangrove Sediment of Muara Angke Wildlife Reserve, Indonesia. Mar. Pollut. Bull. 2021, 163, 112012. [Google Scholar] [CrossRef] [PubMed]
- Díaz-Mendoza, C.; Mouthon-Bello, J.; Pérez-Herrera, N.L.; Escobar-Díaz, S.M. Plastics and Microplastics, Effects on Marine Coastal Areas: A Review. Environ. Sci. Pollut. Res. 2020, 27, 39913–39922. [Google Scholar] [CrossRef] [PubMed]
- Galloway, T.S.; Cole, M.; Lewis, C. Interactions of Microplastic Debris throughout the Marine Ecosystem. Nat. Ecol. Evol. 2017, 1, 116. [Google Scholar] [CrossRef] [PubMed]
- Kibria, G. Impacts of Microplastic on Fisheries and Seafood Security—Global Analysis and Synthesis. Sci. Total Environ. 2023, 904, 166652. [Google Scholar] [CrossRef] [PubMed]
- Amer, N.B.; Ministerio, J.R.B.; Romarate II, R.A.; Chien, M.-F.; Bacosa, H.P. Elevational Variations in Atmospheric Microplastics and Surface-Adsorbed Heavy Metals in Roadside and Non-Roadside Areas in Iligan City, Philippines. Air Qual. Atmos. Health 2025, 18, 3947–3960. [Google Scholar] [CrossRef]
- Long, M.; Moriceau, B.; Gallinari, M.; Lambert, C.; Huvet, A.; Raffray, J.; Soudant, P. Interactions between Microplastics and Phytoplankton Aggregates: Impact on Their Respective Fates. Mar. Chem. 2015, 175, 39–46. [Google Scholar] [CrossRef]
- Licuanan, W.Y.; Robles, R.; Reyes, M. Status and Recent Trends in Coral Reefs of the Philippines. Mar. Pollut. Bull. 2019, 142, 544–550. [Google Scholar] [CrossRef] [PubMed]
- Gaboy, S.M.M.; Guihawan, J.Q.; Leopardas, V.E.; Bacosa, H.P. Unravelling Macroplastic Pollution in Seagrass Beds of Iligan City, Mindanao, Philippines. Mar. Pollut. Bull. 2022, 185, 114233. [Google Scholar] [CrossRef] [PubMed]
- Celmar, J.M.; Gabriel, A.D.; Hung, C.-C.; Bacosa, H.P. Microplastic Pollution on Seagrass Blades in Two Coastal Bays in Northern Mindanao, Philippines. Reg. Stud. Mar. Sci. 2024, 77, 103636. [Google Scholar] [CrossRef]
- Similatan, K.M.; Arcadio, C.G.L.A.; Navarro, C.K.P.; Capangpangan, R.Y.; Bacosa, H.P. Microplastic Ingestion by Adult Milkfish Chanos Chanos (Forsskål, 1775) in Aquaculture System: The Case of Butuan Bay, Philippines. Mar. Pollut. Bull. 2023, 194, 115409. [Google Scholar] [CrossRef] [PubMed]
- Navarro, C.K.; Arcadio, C.G.L.; Bacosa, H. Mangrove Filters or Microplastic Traps? Insights from Microplastic Ingestion in Polymesoda Erosa in Butuan Bay, Philippines. Curr. Appl. Sci. Technol. 2025, 26, e0267224. [Google Scholar] [CrossRef]
- Tan, E.; Mohd Zanuri, N.B. Abundance and Distribution of Microplastics in Tropical Estuarine Mangrove Areas around Penang, Malaysia. Front. Mar. Sci. 2023, 10, 1148804. [Google Scholar] [CrossRef]
- Hossain, M.J.; AftabUddin, S.; Akhter, F.; Nusrat, N.; Rahaman, A.; Sikder, M.N.A.; Monwar, M.M.; Chowdhury, M.S.N.; Jiang, S.; Shi, H.; et al. Surface Water, Sediment, and Biota: The First Multi-Compartment Analysis of Microplastics in the Karnafully River, Bangladesh. Mar. Pollut. Bull. 2022, 180, 113820. [Google Scholar] [CrossRef] [PubMed]
- Fulfer, V.M.; Walsh, J.P. Extensive Estuarine Sedimentary Storage of Plastics from City to Sea: Narragansett Bay, Rhode Island, USA. Sci. Rep. 2023, 13, 10195. [Google Scholar] [CrossRef] [PubMed]
- Ogbuagu, C.C.; Kassem, H.; Udiba, U.U.; Stead, J.L.; Cundy, A.B. Role of Saltmarsh Systems in Estuarine Trapping of Microplastics. Sci. Rep. 2022, 12, 15546. [Google Scholar] [CrossRef] [PubMed]
- Li, Y.; Ling, W.; Hou, C.; Yang, J.; Xing, Y.; Lu, Q.; Wu, T.; Gao, Z. Global Distribution Characteristics and Ecological Risk Assessment of Microplastics in Aquatic Organisms Based on Meta-Analysis. J. Hazard. Mater. 2025, 491, 137977. [Google Scholar] [CrossRef] [PubMed]
- Jiang, J.; He, L.; Zheng, S.; Liu, J.; Gong, L. A Review of Microplastic Transport in Coastal Zones. Mar. Environ. Res. 2024, 196, 106397. [Google Scholar] [CrossRef] [PubMed]
- Govender, J.; Naidoo, T.; Rajkaran, A.; Cebekhulu, S.; Bhugeloo, A.; Sershen, S. Towards Characterising Microplastic Abundance, Typology and Retention in Mangrove-Dominated Estuaries. Water 2020, 12, 2802. [Google Scholar] [CrossRef]
- Greenshields, J.; Anastasi, A.; Irving, A.D.; Capper, A. A Systematic Review To Assess Current Surface Water and Sediment Microplastic Sampling Practices in Seagrass and Mangrove Ecosystems. Environ. Sci. Pollut. Res. 2024, 31, 66615–66629. [Google Scholar] [CrossRef] [PubMed]
- Montoto-Martínez, T.; Meléndez-Díez, C.; Melián-Ramírez, A.; Hernández-Brito, J.J.; Gelado-Caballero, M.D. Comparison between the Traditional Manta Net and an Innovative Device for Microplastic Sampling in Surface Marine Waters. Mar. Pollut. Bull. 2022, 185, 114237. [Google Scholar] [CrossRef] [PubMed]
- Leads, R.R.; Weinstein, J.E.; Kell, S.E.; Overcash, J.M.; Ertel, B.M.; Gray, A.D. Spatial and Temporal Variability of Microplastic Abundance in Estuarine Intertidal Sediments: Implications for Sampling Frequency. Sci. Total Environ. 2023, 859, 160308. [Google Scholar] [CrossRef] [PubMed]
- Li, Y.; Lu, Z.; Zheng, H.; Wang, J.; Chen, C. Microplastics in Surface Water and Sediments of Chongming Island in the Yangtze Estuary, China. Environ. Sci. Eur. 2020, 32, 15. [Google Scholar] [CrossRef]
- Yaranal, N.A.; Subbiah, S.; Mohanty, K. Distribution and Characterization of Microplastics in Beach Sediments from Karnataka (India) Coastal Environments. Mar. Pollut. Bull. 2021, 169, 112550. [Google Scholar] [CrossRef] [PubMed]
- Scott, N.; Porter, A.; Santillo, D.; Simpson, H.; Lloyd-Williams, S.; Lewis, C. Particle Characteristics of Microplastics Contaminating the Mussel Mytilus Edulis and Their Surrounding Environments. Mar. Pollut. Bull. 2019, 146, 125–133. [Google Scholar] [CrossRef] [PubMed]
- Menezes, K.M.; da Costa, M.B.; Schuab, J.M.; Dalbó, G.Z.; Alves, M.M.; Ocaris, E.R.Y.; Rodrigues, F.L. Microplastic Contamination in the Mangroves of Piraquê-Açu and Piraquê-Mirim Rivers, Aracruz (Brazil): An Analysis in Sediment, Water, and Biota. Mar. Pollut. Bull. 2025, 214, 117696. [Google Scholar] [CrossRef] [PubMed]
- Zheng, Y.; Li, J.; Cao, W.; Jiang, F.; Zhao, C.; Ding, H.; Wang, M.; Gao, F.; Sun, C. Vertical Distribution of Microplastics in Bay Sediment Reflecting Effects of Sedimentation Dynamics and Anthropogenic Activities. Mar. Pollut. Bull. 2020, 152, 110885. [Google Scholar] [CrossRef] [PubMed]
- Bilugan, Q.M.; Limbago, J.S.; Gutierrez, R.L. Detection and Quantification of Microplastics from Cultured Green Mussel Perna Viridis in Bacoor Bay, Cavite, Philippines. Sustinere J. Environ. Sustain. 2021, 5, 90–102. [Google Scholar] [CrossRef]
- Fernández-González, V.; Andrade-Garda, J.M.; López-Mahía, P.; Muniategui-Lorenzo, S. Impact of Weathering on the Chemical Identification of Microplastics from Usual Packaging Polymers in the Marine Environment. Anal. Chim. Acta 2021, 1142, 179–188. [Google Scholar] [CrossRef] [PubMed]
- Bacosa, H.P.; Perpetua, Z.D.; Aron, J.B.; Bondaug, J.C.S.; Cui, V.T.; Imperial, J.E.; Monera, C.M.M.; Villariaz, J.; Gabriel, A.D.; Mayol, A.P.; et al. First Documented Evidence of Mesoplastic Pollution in the Philippines: The Case of the Sandy Beaches in Iligan City. Reg. Stud. Mar. Sci. 2024, 75, 103574. [Google Scholar] [CrossRef]
- Romarate II, R.A.; Pacilan, C.J.M.; Shiu, R.-F.; Sinco, A.L.; Torres, A.G.; Tampus, A.D.; Ochigue, P.C.D.; Rodil, M.S.P.; Bacosa, H.P. Microplastics in the Air of Metro Manila, Philippines: Diurnal and Seasonal Dynamics and Potential Health Risk. J. Hazard. Mater. 2025, 500, 140455. [Google Scholar] [CrossRef] [PubMed]
- Lithner, D.; Larsson, Å.; Dave, G. Environmental and Health Hazard Ranking and Assessment of Plastic Polymers Based on Chemical Composition. Sci. Total Environ. 2011, 409, 3309–3324. [Google Scholar] [CrossRef] [PubMed]
- Tomlinson, D.L.; Wilson, J.G.; Harris, C.R.; Jeffrey, D.W. Problems in the Assessment of Heavy-Metal Levels in Estuaries and the Formation of a Pollution Index. Helgoländer Meeresunters. 1980, 33, 566–575. [Google Scholar] [CrossRef]
- Rakib, M.R.J.; Hossain, M.B.; Kumar, R.; Ullah, M.A.; Al Nahian, S.; Rima, N.N.; Choudhury, T.R.; Liba, S.I.; Yu, J.; Khandaker, M.U.; et al. Spatial Distribution and Risk Assessments Due to the Microplastics Pollution in Sediments of Karnaphuli River Estuary, Bangladesh. Sci. Rep. 2022, 12, 8581. [Google Scholar] [CrossRef] [PubMed]
- Perpetua, Z.D.; Albarico, F.P.J.B.; Capangpangan, R.Y.; Shiu, R.-F.; Lim, Y.C.; Chen, C.-W.; Dong, C.-D.; Bacosa, H.P. Meso- and Microplastics Accumulation and Ecological Risks in Philippine Urban and Rural Sandy Beaches. Estuar. Coast. Shelf Sci. 2025, 323, 109414. [Google Scholar] [CrossRef]
- Xu, P.; Peng, G.; Su, L.; Gao, Y.; Gao, L.; Li, D. Microplastic Risk Assessment in Surface Waters: A Case Study in the Changjiang Estuary, China. Mar. Pollut. Bull. 2018, 133, 647–654. [Google Scholar] [CrossRef] [PubMed]
- Peng, G.; Zhu, B.; Yang, D.; Su, L.; Shi, H.; Li, D. Microplastics in Sediments of the Changjiang Estuary, China. Environ. Pollut. 2017, 225, 283–290. [Google Scholar] [CrossRef] [PubMed]
- Ranjani, M.; Veerasingam, S.; Venkatachalapathy, R.; Mugilarasan, M.; Bagaev, A.; Mukhanov, V.; Vethamony, P. Assessment of Potential Ecological Risk of Microplastics in the Coastal Sediments of India: A Meta-Analysis. Mar. Pollut. Bull. 2021, 163, 111969. [Google Scholar] [CrossRef] [PubMed]
- Faizi, N.; Alvi, Y. Categorical Variables. In Biostatistics Manual for Health Research; Elsevier: Amsterdam, The Netherlands, 2023; pp. 127–148. [Google Scholar]
- Cochran, W.G. Some Methods for Strengthening the Common χ 2 Tests. Biometrics 1954, 10, 417. [Google Scholar] [CrossRef]
- Nyadjro, E.S.; Cebrian, J.; Cox, T.E.; Wang, Z.; Lau, Y.H.; Konefal, A.M.; Turnage, G.; Offner, T.; Gilpin, R.; Boyer, T.; et al. Gaps and Pathways Towards Standardized, FAIR Microplastics Data Harmonization: A Systematic Review. Microplastics 2026, 5, 11. [Google Scholar] [CrossRef]
- Wang, T.; Zhao, S.; Zhu, L.; McWilliams, J.C.; Galgani, L.; Amin, R.M.; Nakajima, R.; Jiang, W.; Chen, M. Accumulation, Transformation and Transport of Microplastics in Estuarine Fronts. Nat. Rev. Earth Environ. 2022, 3, 795–805. [Google Scholar] [CrossRef]
- Liu, D.; Guo, Z.-F.; Xu, Y.-Y.; Ka Shun Chan, F.; Xu, Y.-Y.; Johnson, M.; Zhu, Y.-G. Widespread Occurrence of Microplastics in Marine Bays with Diverse Drivers and Environmental Risk. Environ. Int. 2022, 168, 107483. [Google Scholar] [CrossRef] [PubMed]
- Born, M.P.; Schüttrumpf, H. Microplastic in Coastal Areas—Impact of Waves, Sediments and Saltwater on the Degradation Behaviour. In Springer Water; Springer International Publishing: Cham, Switzerland, 2020; pp. 158–163. [Google Scholar]
- Ouri, A.; Guesmi, M.; Jlalia, I.; Grassl, B.; Abderrazak, H.; Souissi, R. Assessing Microplastic Presence and Distribution in Sandy Beaches: A Case Study of the Gulf of Tunis Coastline. Euro-Mediterr. J. Environ. Integr. 2024, 10, 437–450. [Google Scholar] [CrossRef]
- Zhang, X.; Chu, H.; Yin, M.; Liu, Y.; Chen, P.; Zhang, Q.; Dai, X.; Kong, L. Spatial Distribution and Risk Assessment of Microplastics in Surface Sediments in Semi-Enclosed Waters: A Case Study of Laizhou Bay. Front. Mar. Sci. 2025, 12, 1578167. [Google Scholar] [CrossRef]
- Chifflard, P.; Nather, T.; Weber, C.J. Transport of (Micro)Plastic within a River Cross-Section—Spatio-Temporal Variations and Loads. Microplastics 2024, 3, 755–770. [Google Scholar] [CrossRef]
- Drummond, J.D.; Schneidewind, U.; Li, A.; Hoellein, T.J.; Krause, S.; Packman, A.I. Microplastic Accumulation in Riverbed Sediment via Hyporheic Exchange from Headwaters to Mainstems. Sci. Adv. 2022, 8, eabi9305. [Google Scholar] [CrossRef] [PubMed]
- Jaafarzadeh, N.; Ravanbakhsh, M.; Talepour, N.; Jahedi, F.; Feizi, R.; Reyshahri, A. Spatial Distribution of Microplastics in Persian Gulf Marine Environments. Sci. Rep. 2025, 16, 2165. [Google Scholar] [CrossRef] [PubMed]
- Zamprogno, G.C.; Caniçali, F.B.; Cozer, C.d.R.; Otegui, M.B.P.; Graceli, J.B.; Costa, M.B.d. Spatial Distribution of Microplastics in the Superficial Sediment of a Mangrove in Southeast Brazil: A Comparison between Fringe and Basin. Sci. Total Environ. 2021, 784, 146963. [Google Scholar] [CrossRef] [PubMed]
- de Paula, M.S.; Schuab, J.M.; Pelletier, É.; Soubaneh, Y.D.; Langlois, V.; da Costa, M.B. Can Microplastic Pollution Be Affected by Beach Nourishment? Assessment in Intertidal Sediment and Bivalves. Sci. Total Environ. 2025, 960, 178374. [Google Scholar] [CrossRef] [PubMed]
- Paul, S.; Nath, S.; Bhattacharjee, S.; Mukherjee, S. Unveiling the Effects of Microplastics Pollution on Marine Fauna. Blue Biotechnol. 2024, 1, 6. [Google Scholar] [CrossRef]
- Steer, M.; Cole, M.; Thompson, R.C.; Lindeque, P.K. Microplastic Ingestion in Fish Larvae in the Western English Channel. Environ. Pollut. 2017, 226, 250–259. [Google Scholar] [CrossRef] [PubMed]
- Ramli Sulong, N.H.; Mustapa, S.A.S.; Abdul Rashid, M.K. Application of Expanded Polystyrene (EPS) in Buildings and Constructions: A Review. J. Appl. Polym. Sci. 2019, 136, 47529. [Google Scholar] [CrossRef]
- Grattagliano, A.; Grattagliano, Z.; Manfra, L.; Libralato, G.; Biandolino, F.; Prato, E. An Overview on Microplastics Hazards to the Marine Ecosystem and Humans’ Health. Water 2025, 17, 916. [Google Scholar] [CrossRef]
- Guo, M.; Noori, R.; Abolfathi, S. Microplastics in Freshwater Systems: Dynamic Behaviour and Transport Processes. Resour. Conserv. Recycl. 2024, 205, 107578. [Google Scholar] [CrossRef]
- Cabigliera, S.B.; Gabellini, P.; Cantagalli, D.; Ciattini, S.; Chelazzi, D.; Cincinelli, A.; Cioni, R.; Martellini, T. First Application of Automated Static Particle Analysis for Quantification of Textile Microplastics/Microfibers in Washing Effluents. Chemosphere 2025, 387, 144655. [Google Scholar] [CrossRef] [PubMed]
- Keleste, E.P.; Fedelis, J.S.; Opusa, W.F.T.; Inocente, S.A.T.; Banda, M.H.T.; Latayada, F.S.; Jumawan, J.C.; Vales, T.P.; Seronay, R.A.; Capangpangan, R.Y. Assessment of Microplastic Pollution Load and Ecological Risk Index in Surface Water and Sediment Matrices in the Mangrove Ecosystem along Butuan Bay, Southern Philippines. Environ. Nat. Resour. J. 2025, 23, 1–15. [Google Scholar] [CrossRef]
- Escañan, A.S.; Wang, M.-H.; Acot, F.T.; Perpetua, Z.D.; Sajorne, R.E.; Albarico, F.P.J.B.; Chen, C.-W.; Dong, C.-D.; Bacosa, H.P. Spatiotemporal Variations in Rural and Urban Beach Microplastics Accumulation in Sediment along Sarangani Bay Protected Seascape, Mindanao, the Philippines. Environ. Monit. Assess. 2025, 197, 687. [Google Scholar] [CrossRef] [PubMed]
- Tahir, A.; Soeprapto, D.A.; Sari, K.; Wicaksono, E.A.; Werorilangi, S. Microplastic Assessment in Seagrass Ecosystem at Kodingareng Lompo Island of Makassar City. IOP Conf. Ser. Earth Environ. Sci. 2020, 564, 012032. [Google Scholar] [CrossRef]
- Dahl, M.; Bergman, S.; Björk, M.; Diaz-Almela, E.; Granberg, M.; Gullström, M.; Leiva-Dueñas, C.; Magnusson, K.; Marco-Méndez, C.; Piñeiro-Juncal, N.; et al. A Temporal Record of Microplastic Pollution in Mediterranean Seagrass Soils. Environ. Pollut. 2021, 273, 116451. [Google Scholar] [CrossRef] [PubMed]
- Firdaus, M.; Trihadiningrum, Y.; Lestari, P. Microplastic Pollution in the Sediment of Jagir Estuary, Surabaya City, Indonesia. Mar. Pollut. Bull. 2020, 150, 110790. [Google Scholar] [CrossRef] [PubMed]
- Lumilan, D.R.T.; Shiu, R.-F.; Bacosa, H.P. Differentiating Macroplastic and Mesoplastic Pollution on Relatively Clean Beaches of Central Philippines. Mar. Environ. Res. 2025, 207, 107092. [Google Scholar] [CrossRef] [PubMed]
- Vdovchenko, A.; Resmini, M. Mapping Microplastics in Humans: Analysis of Polymer Types, and Shapes in Food and Drinking Water—A Systematic Review. Int. J. Mol. Sci. 2024, 25, 7074. [Google Scholar] [CrossRef] [PubMed]
- Kim, O.-H.; Chang, E.S.; Kang, H.; Lee, H.J. Unveiling the Impact of Microplastics: A Perspective on Size, Shape, and Composition in Human Health. Mol. Cell. Toxicol. 2025, 21, 997–1006. [Google Scholar] [CrossRef]
- Waldschläger, K.; Lechthaler, S.; Stauch, G.; Schüttrumpf, H. The Way of Microplastic through the Environment—Application of the Source-Pathway-Receptor Model (Review). Sci. Total Environ. 2020, 713, 136584. [Google Scholar] [CrossRef] [PubMed]
- Osorio, E.D.; Tanchuling, M.A.N.; Diola, M.B.L.D. Microplastics Occurrence in Surface Waters and Sediments in Five River Mouths of Manila Bay. Front. Environ. Sci. 2021, 9, 719274. [Google Scholar] [CrossRef]
- Meng, X.; Yuan, J.; Huang, Q.; Liu, R.; Yang, Y.; Yang, X.; Wang, K. A Review of Sources, Hazards, and Removal Methods of Microplastics in the Environment. Water 2025, 17, 102. [Google Scholar] [CrossRef]
- Lodh, A.; Shafi, M.; Goel, S. Global Inconsistencies in Microplastic Research: A Review of Sampling and Processing Techniques across Diverse Aqueous Matrices. J. Water Process Eng. 2025, 77, 108419. [Google Scholar] [CrossRef]
- Sabaani, N.J.; Bacosa, H.P.; Paradero, J.T.C.; Pardillo, J.J.B.; Maglupay, J.R.U.; Casas, P.A.; Madamba, M.R.S.; Martinez, J.G.T. Microplastic-Induced Reductions in Population Abundance and Body Size of Soil Nematodes. Microplastics Nanoplastics 2026, 6, 19. [Google Scholar] [CrossRef]
- Arcadio, C.G.L.A.; Maglupay, J.R.U.; Po, A.M.; Pardillo, J.J.B.; Bacosa, H.P. Microplastics as a Modifier of Polycyclic Aromatic Hydrocarbon (PAH) Toxicity: A Review on Context-Dependent Effects Across Organisms. Biology 2026, 15, 455. [Google Scholar] [CrossRef] [PubMed]
- Maurya, P.; Kumar, R. Emerging Threat of Microplastics across Environmental Matrices Encompassing Sources Ecotoxicological Effects and Management Strategies within the Framework of Sustainable Development Goals (SDGs). Discov. Sustain. 2026, 7, 225. [Google Scholar] [CrossRef]
- Li, C.; Zhu, L.; Wang, X.; Li, D. Elucidating the Distribution and Characteristics of Microplastics in Water Column of the Northwestern South China Sea with a Large-Volume in Situ Filtration Technology (Plankton Pump). Front. Mar. Sci. 2025, 12, 1556592. [Google Scholar] [CrossRef]
- Kabir, A.H.M.E.; Sekine, M.; Imai, T.; Yamamoto, K.; Kanno, A.; Higuchi, T. Assessing Small-Scale Freshwater Microplastics Pollution, Land-Use, Source-to-Sink Conduits, and Pollution Risks: Perspectives from Japanese Rivers Polluted with Microplastics. Sci. Total Environ. 2021, 768, 144655. [Google Scholar] [CrossRef] [PubMed]
- Keang, K.; Cheng, S.; Muhammad, U.; Wasnik, S. Review of Recent Advances in Microplastic Ecological Risk Assessment: From Problem Formulation to Risk Characterization. Microplastics 2026, 5, 44. [Google Scholar] [CrossRef]
- Browne, M.A.; Crump, P.; Niven, S.J.; Teuten, E.; Tonkin, A.; Galloway, T.; Thompson, R. Accumulation of Microplastic on Shorelines Worldwide: Sources and Sinks. Environ. Sci. Technol. 2011, 45, 9175–9179. [Google Scholar] [CrossRef] [PubMed]

Disclaimer/Publisher’s Note: The statements, opinions and data contained in all publications are solely those of the individual author(s) and contributor(s) and not of MDPI and/or the editor(s). MDPI and/or the editor(s) disclaim responsibility for any injury to people or property resulting from any ideas, methods, instructions or products referred to in the content. |
© 2026 by the authors. Licensee MDPI, Basel, Switzerland. This article is an open access article distributed under the terms and conditions of the Creative Commons Attribution (CC BY) license.