


Abstract
This study systematically investigated microplastics (MPs) in Pingshan River, Shenzhen—a representative urban river with short channel length, rapid flow, and limited environmental capacity. Surface water and sediment samples from seven sites were analyzed for MP abundance, size, morphology, color, and polymer composition. Results revealed significant MP pollution: surface water abundance ranged from 132 to 423 items/L (mean 311.42 ± 90.78 items/L), while sediment abundance ranged from 334 to 756 items/kg (mean 508.85 ± 151.79 items/kg). Spatial heterogeneity was pronounced, with the highest abundance at a construction-influenced site (Site 6) and the lowest at a less-impacted site (Site 2). MPs were predominantly 300–1000 μm in size. Fibers dominated surface water, while fragments prevailed in sediment. Transparent particles constituted >77% of all MPs. Polymer composition was dominated by polypropylene (PP) and polyethylene (PE). Key factors controlling spatial distribution included proximity to construction/industrial activities, aquatic vegetation cover, and hydrological conditions during the dry season. Polymer hazard risk index (H) classified all sites as Category II (10 ≤ H < 100), indicating low ecological risk despite high abundances. This research provides a scientific foundation for targeted pollution control in urban river systems, emphasizing the need to consider both abundance and polymer-specific toxicity in risk assessment.
1. Introduction
Plastics offer diverse applications but pose significant environmental challenges. As the world’s largest producer and consumer of plastics, China accounts for approximately one-third of global plastic flows [1]. Despite China’s implementation of comprehensive governance and regulatory measures targeting plastics, their extensive use continues to drive substantial plastic pollution [2]. It is estimated that around 90% of discarded plastics remain unrecovered [3]. Plastic pollution has become a major global environmental concern alongside climate change [4].
Once plastic waste enters the environment, particles smaller than 5 mm (MPs) pose threats to aquatic organisms and human health through the food chain [5,6]. Research on MPs remains a major focus, investigating their distribution across rivers, oceans, and soils, as well as their interactions with organic pollutants [7,8,9,10]. Acting as vectors, MPs are ingested by diverse organisms, facilitating bioaccumulation [11]. Human exposure to MPs is associated with various health risks [12]. Inland rivers are critical pathways for the long-distance transport of MPs from terrestrial to marine ecosystems. During transport, sediment deposition can induce secondary pollution, adversely affecting riparian zones and aquaculture systems [13,14].
China‘s abundant water resources have drawn significant attention to MP pollution in its aquatic ecosystems [15,16]. Urban rivers, serving as critical interfaces between human societies and aquatic environments, experience complex interactions between natural processes and anthropogenic pressures. Accelerated urbanization, industrial development, and human interventions have substantially degraded urban riverine ecosystems [17,18]. Beyond transport via hydrological currents, MPs accumulate extensively in benthic sediment [19,20]. Sediment matrices function as primary sinks for concentrated pollutants through depositional processes. Consequently, sediment analysis provides optimal characterization of historical MP contamination in aquatic systems [21]. Integrated monitoring and assessment of MPs in both water and sediment allows for a thorough understanding of their spatial distribution patterns [22,23].
The Pingshan River, a principal tributary in Shenzhen’s freshwater network (Guangdong Province, China), originates at Meisha Peak (Sanzhoutian) and traverses Pingshan District [24]. As a typical urban river, it exhibits a short channel length, rapid flow velocity, and limited environmental carrying capacity. Moreover, accelerated regional socioeconomic development has imposed excessive pollution loads on such waterways, causing significant degradation of water quality and ecological integrity [25,26]. Consequently, MP assessment in the Pingshan River provides critical insights into contamination patterns of urban river systems. Notably, unlike most previous studies that sampled during wet seasons or without considering hydrological context, this study focuses on dry-weather baseflow conditions—a scenario where dilution is minimal and local pollution signals are maximized, providing a conservative estimate of anthropogenic MP inputs under low-flow regimes.
This study systematically analyzed the distribution of MPs in both the water column and sediment of the Pingshan River, focusing on their abundance, morphology, size, color, and composition. The results of this research will supplement current understanding of MP pollution in rivers. They will provide valuable insights into the distribution mechanisms of MPs and inform the development of evidence-based strategies for pollution prevention and control.
2. Materials and Methods
2.1. Research Area and Sample Collection
The Pingshan River, located in Shenzhen’s Pingshan District, represents a typical urban river system. Its coordinates span 22°39′–22°47′ N and 114°17′–114°26′ E. The drainage area covers 133 km2 (total basin: 181 km2), with a 25 km main channel [27]. The synergistic superposition and combined action of intense rainfall and surface runoff will lead to a rapid increase in the runoff volume of the river. The river basin encompasses a mix of land use types—from urban developments and rural farmlands to natural wetlands and wastewater treatment facilities.
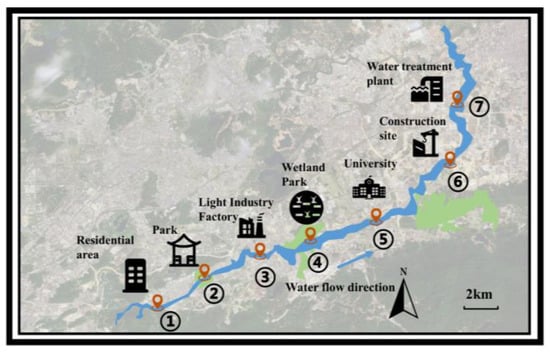
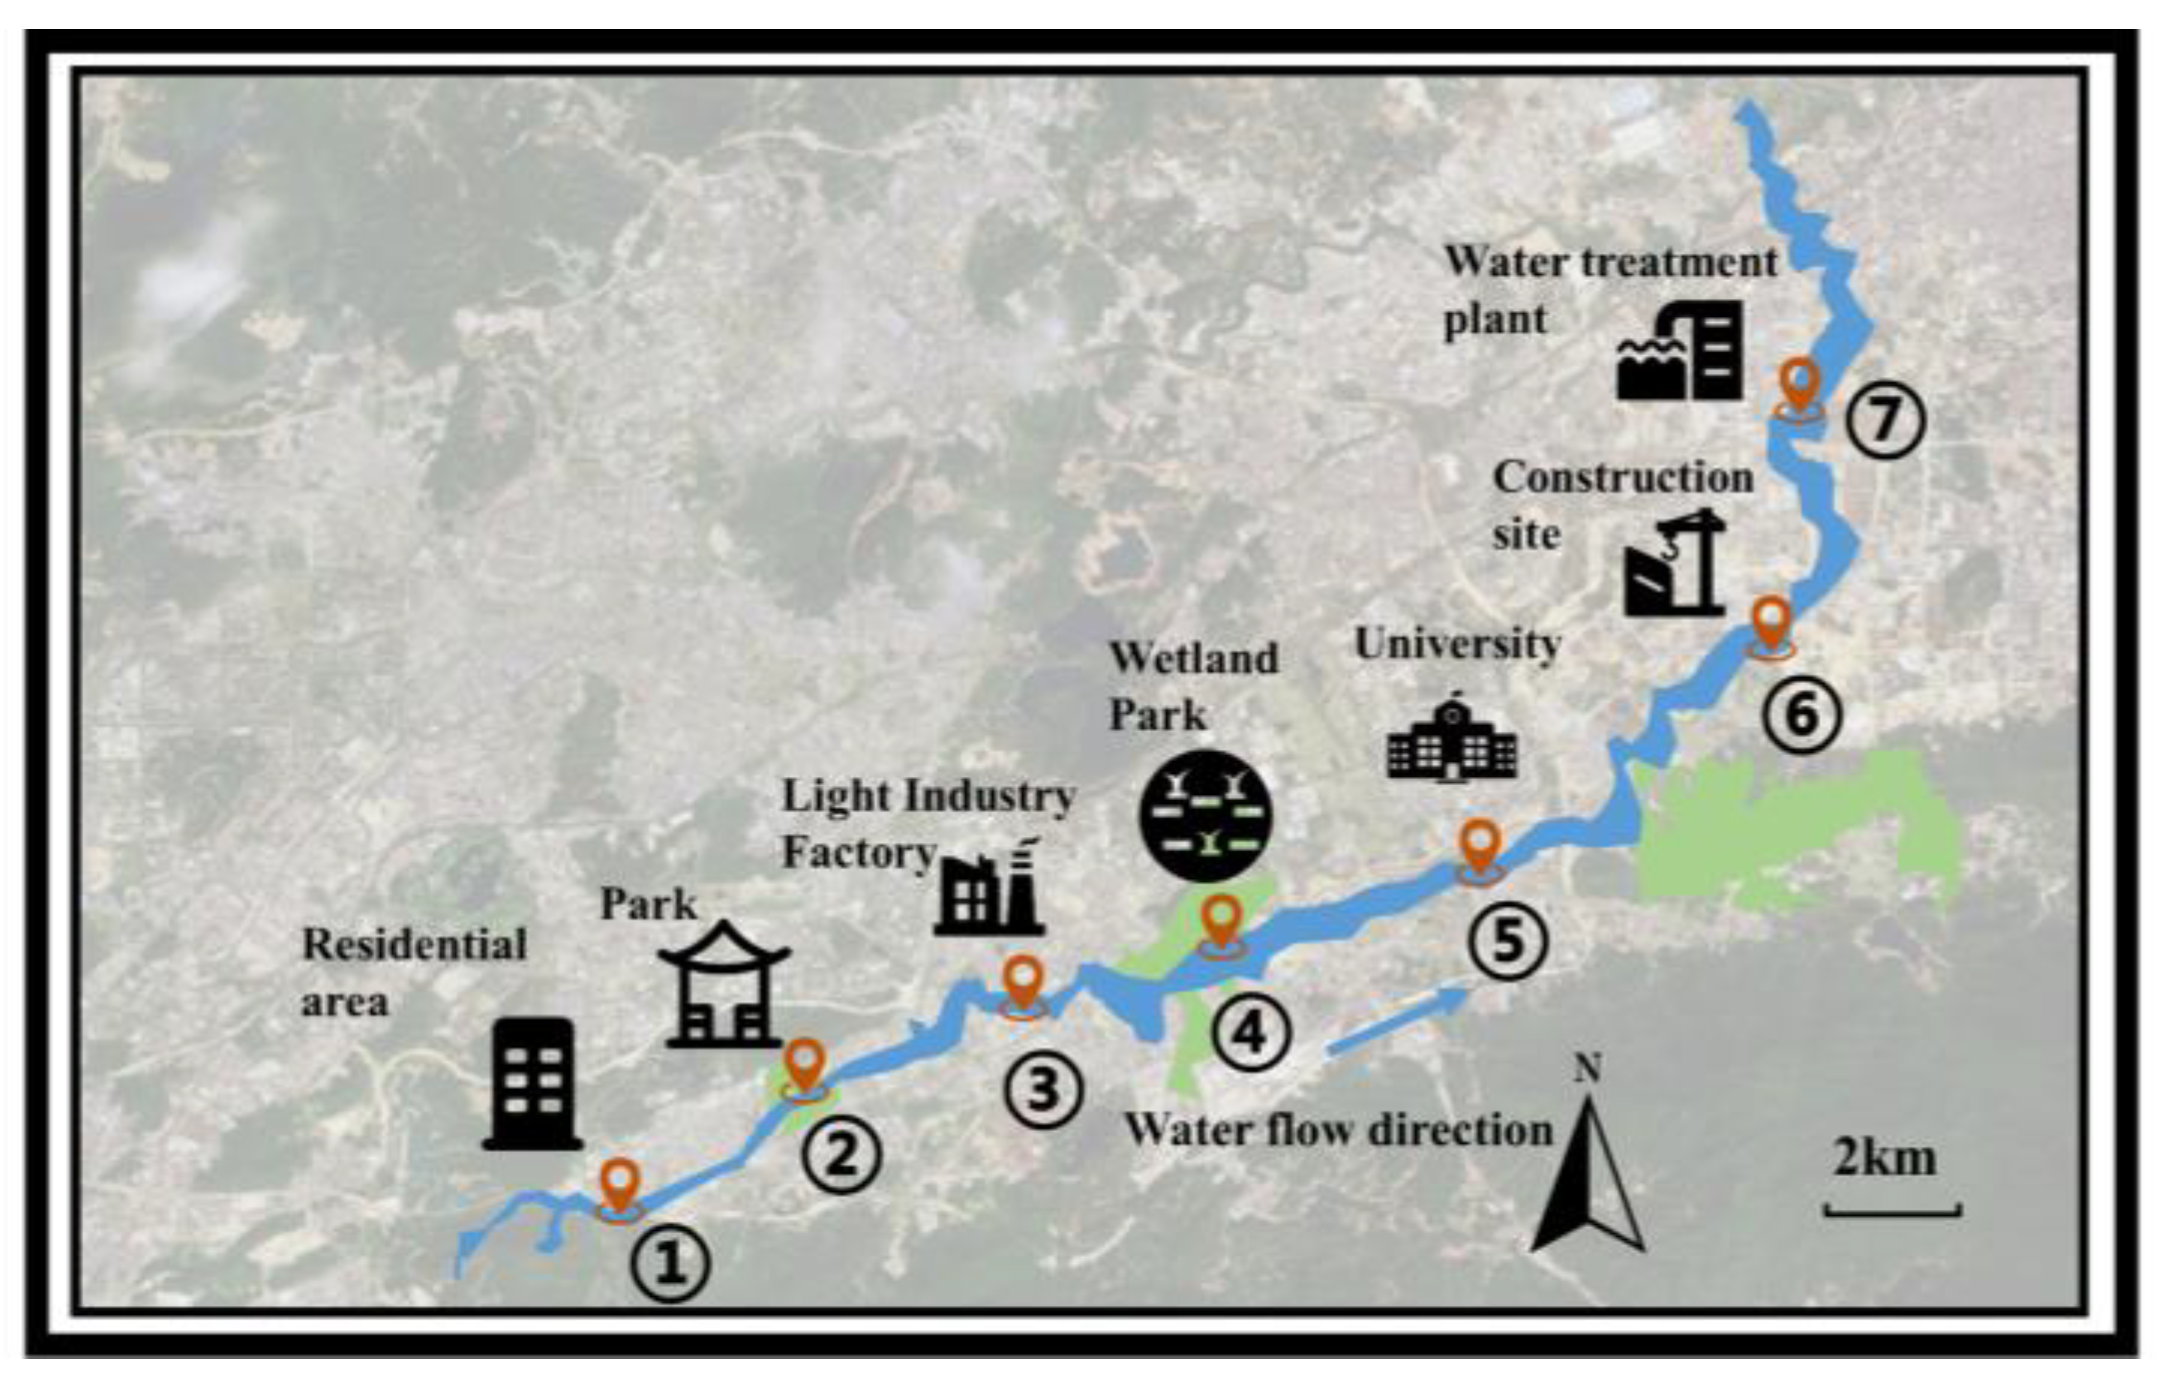
This study established seven representative sampling points along the river with intervals of about 4 km (Figure 1), ensuring spatial uniformity. Sampling was conducted in May 2023 during dry weather conditions, with no rainfall in the preceding 72 h. At each site, triplicate surface water and sediment samples were collected to ensure representativeness. Sampling locations were selected at the mid-section of the river channel to avoid the interference of lateral flow velocity gradients on sample quality [28]. For water samples, 1 L of subsurface water (approximately 20–30 cm below the water surface) was collected in stainless steel buckets for each replicate. The volume of 1 L was chosen as a compromise between representativeness and practical filtration capacity. In the studied streams, high suspended solid loads limited the filterable volume, and a larger volume would have caused frequent filter clogging. Similar volumes (0.5–2 L) are commonly used in microplastic surveys of turbid surface water [29]. For sediment samples, approximately 1 kg of surface sediment (0–5 cm depth) was collected using a stainless steel grab sampler (Peterson type) for each replicate. All seven sampling sites were accessed from bridges over the Pingshan River. Before sampling, all equipment underwent rigorous cleaning with ultrapure water to remove potential contaminants. Surface water was gathered in stainless steel buckets, and surface sediment from the riverbed were collected via stainless steel sediment samplers. Samples were preserved in stainless steel containers for laboratory analysis.
Figure 1.
Study area map of the Pingshan River watershed, showing the sampling locations of surface water and sediment.
2.2. Extraction of MPs
For water samples, the entire sample collected from each site was used for MP extraction. Water samples were vacuum-filtered through 3 μm stainless filters. Retained solids were rinsed with deionized water into beakers. Organic matter digestion employed 30% H2O2 at 65 °C (100 rpm, 24 h). Saturated NaCl solution (density ≈ 1.2 g/cm3) was added, followed by 10 min stirring and 24 h sedimentation. Density-enhanced separation isolated MPs, with supernatant vacuum-filtered through 3 μm metal filters. Filters underwent triple rinsing with deionized water to eliminate residual NaCl. Filters were transferred to sterile Petri dishes, dried at 50 °C for 24 h, and prepared for optical microscopy.
For sediment samples, after homogenization, the dried sediment was subsampled for MP extraction. Sediment was dried in stainless steel containers (60 °C, 48 h). A subsample of approximately 50 g (dry weight) was then mixed with saturated CaCl2 solution (density ≈ 1.4 g/cm3) and mechanically stirred (stainless steel device, 20 min). After 24 h sedimentation, supernatant was transferred to a conical flask. This extraction was repeated thrice with CaCl2 solution. The combined supernatant underwent vacuum filtration. Retained material was washed thrice with deionized water, transferred to a beaker, and digested in 30% H2O2 (65 °C, 100 rpm, 24 h). Subsequent steps followed identical steps to the river MPs, concluding with filter placement in a Petri dish.
The density separation procedures described above were adapted from established protocols [21]. However, the use of saturated NaCl solution (density ≈ 1.2 g/cm3) for water samples presents a notable limitation: polymer particles with densities greater than 1.2 g/cm3—such as polyethylene terephthalate (PET, ~1.38 g/cm3), polyvinyl chloride (PVC, ~1.40 g/cm3), and particularly tire wear particles (TWP, typically 1.2–1.3 g/cm3 or higher, depending on embedded materials)—may not float efficiently and could be lost during the separation step. Although a higher-density CaCl2 solution (1.4 g/cm3) was employed for sediment samples, the water samples were processed exclusively with NaCl solution, potentially leading to an underestimation of high-density microplastics, including TWP, in the aqueous phase. Consequently, the reported results likely reflect a conservative estimate of total microplastic abundance, with a systematic bias toward lower recovery of denser particles. The use of different density solutions was based on the distinct matrices: NaCl (1.2 g/cm3) is adequate for floating low-density polymers in water samples, while CaCl2 (1.4 g/cm3) provides a higher density to recover a wider range of polymers from the heavier sediment matrix.
To facilitate the interpretation of spatial distribution patterns of MPs across the seven sampling sites, qualitative site-specific environmental and sediment characteristics are summarized in Table 1. These characteristics were recorded during field observation in May 2023 under dry-weather conditions (no rainfall in the preceding 72 h) and supplemented by catchment land-use analysis. As shown in Table 1, the seven sites span a gradient of anthropogenic pressure: from the upstream residential area (Site 1) and parkland with managed vegetation (Site 2), through industrial (Site 3) and high-density residential (Site 5) zones, to a constructed wetland park (Site 4), an active construction zone (Site 6), and a downstream mixed-area site (Site 7). Riparian vegetation cover ranged from dense emergent macrophytes at Site 4 to sparse or absent vegetation at Sites 3 and 6. Water flow conditions varied from sluggish and vegetated (Site 4) to rapid and turbulent (Site 3) or disturbed and turbid (Site 6). After standardized drying, all sediment samples exhibited a visually uniform “dried soil” appearance, with no extreme textural differences among sites; however, field-observed surface sediment characteristics (e.g., color, approximate grain texture, presence of debris) are noted in Table 1. It should be noted that the data in Table 1 are primarily qualitative and observation-based, as quantitative sediment properties (e.g., grain size distribution, organic matter content) and detailed hydrological parameters (e.g., flow velocity, turbidity) were not measured during the original sampling campaign.
Table 1.
Site-specific environmental and sediment characteristics of the seven sampling sites along the Pingshan River (based on field observations during dry-weather sampling in May 2023 and catchment land-use analysis).
To minimize contamination, all glass and stainless steel containers were rinsed three times with deionized water before use. Plastic instruments were avoided. Operators wore 100% cotton garments during sampling and extraction. Field blanks (n = 3, ultrapure water exposed at sampling sites), laboratory blanks (n = 3), and process blanks (n = 3) were processed alongside environmental samples. No MPs were detected in any blanks. The limit of quantification (LOQ) was set at 10 items/L for water samples and 50 items/kg for sediment samples, based on the minimum number of particles (n = 10) reliably counted given the filtration volume and microscopic magnification. All reported abundances exceeded these LOQ values.
2.3. Observation and Identification of MPs
All 21 water samples and 21 sediment samples collected were subjected to the entire extraction, observation, and identification process described below. MPs on filters were analyzed using a polarizing light microscope (Murzider, Dongguan, China) and computer-linked camera for preliminary quantification and characterization. River surface water and sediment MPs were detected via micro-Fourier Transform Interferometer (μ-FTIR, Thermo Scientific, Waltham, MA, USA). Given the difficulty in identifying sub-10 μm particles via optical microscopy and μ-FTIR, only MPs > 10 μm were subjected to quantification, with their key attributes systematically recorded. For μ-FTIR analysis, a systematic subsampling approach was adopted: on each filter, 40 points were randomly selected, and at each point, a 200 μm × 200 μm area was analyzed for polymer identification. Polymer types were determined by matching infrared spectra against the OpenSpecy reference library, with a Pearson correlation coefficient ≥0.80 as the acceptance threshold.
2.4. Statistical Analysis
To identify the key factors influencing the spatial distribution of MPs and to explore potential source apportionment, principal component analysis (PCA) was applied to the datasets for both water and sediment. The PCA integrated variables including MP abundance, morphological proportions, color proportions, and dominant polymer type proportions. Data were standardized prior to analysis. PCA was performed using SPSS. A p-value of <0.05 was considered statistically significant for any other tests performed.
PCA was applied to identify factors influencing MP spatial distribution and to explore potential source apportionment. Variables included MP abundance, morphological proportions, color proportions, and dominant polymer type proportions. Data were standardized prior to analysis. PCA was performed using SPSS (version 26.0). A p-value < 0.05 was considered statistically significant. Given that polymer types (e.g., PP, PE, PET) and morphologies (e.g., fibers, fragments) can originate from multiple anthropogenic activities, PCA results are interpreted as plausible spatial associations to guide future targeted investigations.
3. Results
3.1. Abundance of MPs in Surface Water and Sediment
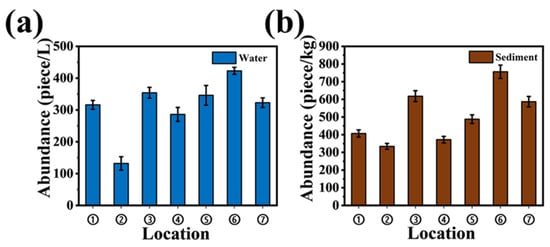
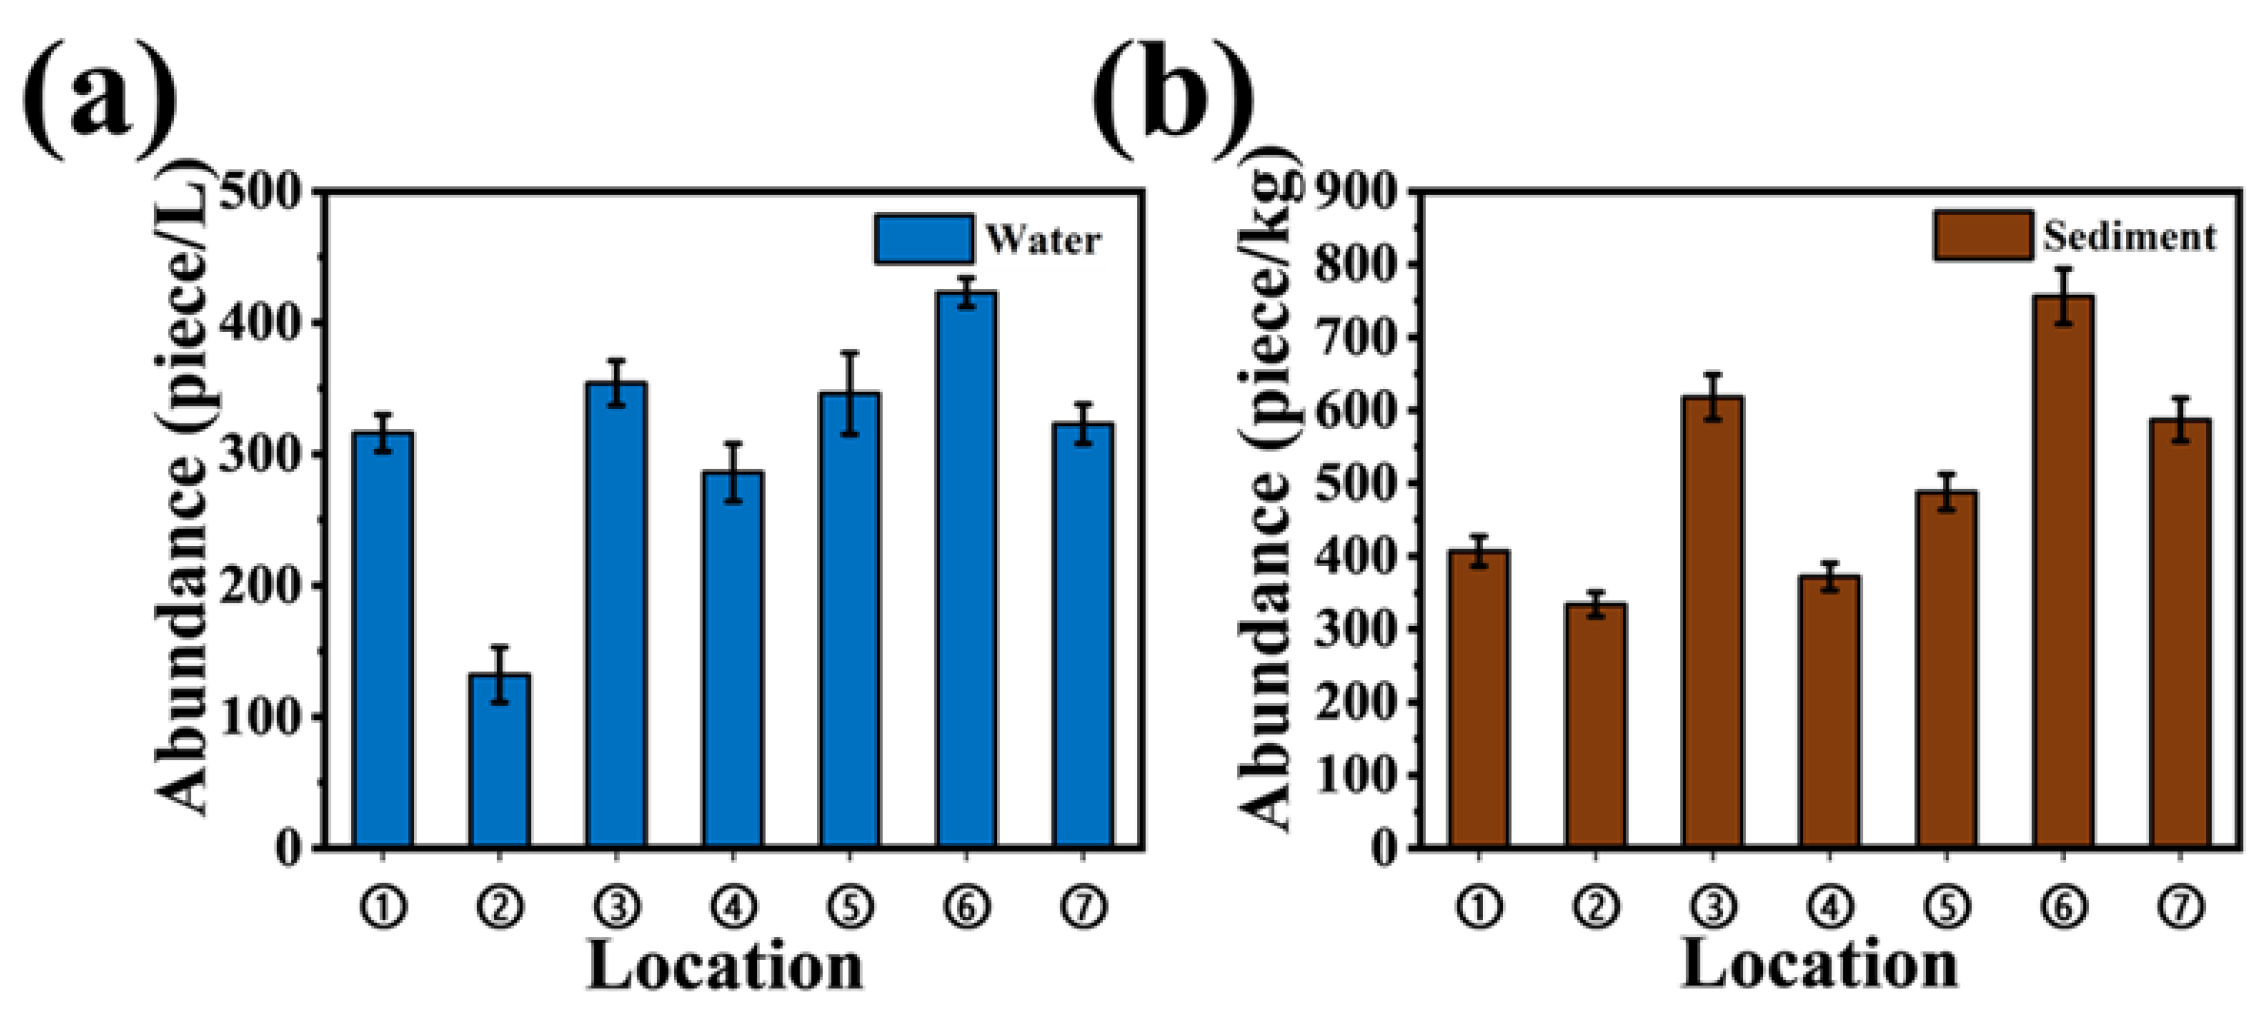
MPs were found in both surface water and sediment of the Pingshan River, with spatial distribution patterns illustrated in Figure 2. The abundance of MPs in surface water ranged from 132 to 423 items/L (mean: 311.42 ± 90.78 items/L), while sediment levels varied from 334 to 756 items/kg (mean: 508.85 ± 151.79 items/kg), exhibiting noticeable spatial variation across sampling sites, with approximately 3.4-fold and 3.3-fold differences between the highest and lowest concentrations in water and sediment, respectively. The error bars in Figure 2 represent standard deviations from triplicate samples. The relatively high standard deviations at Site 6 indicate greater spatial heterogeneity, likely due to localized pollution sources such as construction activities and untreated domestic discharges. In contrast, Site 2 showed the lowest MP abundance and smaller variability, possibly reflecting better riverbank vegetation management or lower anthropogenic pressure. Site 6 exhibited the highest MP abundance (approximately double that of Site 2 in water and sediment), whereas Site 2 showed the lowest values. To facilitate comparison between compartments, a sediment-to-water ratio was calculated for each site by dividing the mean MP abundance in sediment (items/kg) by the mean MP abundance in surface water (items/L). It is important to note that this ratio is a semi-quantitative index due to the different units, and is primarily used for relative comparison between sites. As shown in Table 2, the sediment-to-water MPs ratio varied across sites, ranging from 1.29 to 2.53. While most sites exhibited ratios between 1.29 and 1.82, Site 2 showed a notably higher ratio of 2.53. Field investigations revealed that the anomalous ratio at Site 2 was mainly due to the reduction in aquatic vegetation in the river channel caused by artificial maintenance, in contrast to the vegetated Site 4 (wetland park). This diminished vegetation coverage weakened the interception capacity for MPs in surface water, enhancing their migration via water flow or direct sedimentation into sediment [30].
Figure 2.
MPs content in water and sediment for samples collected at 7 locations: (a) water; (b) sediment.
Table 2.
Ratio of MPs in sediment and water at 7 locations.
3.2. Particle Size Analysis of MPs in Surface Water and Sediment
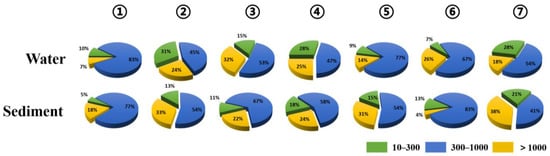
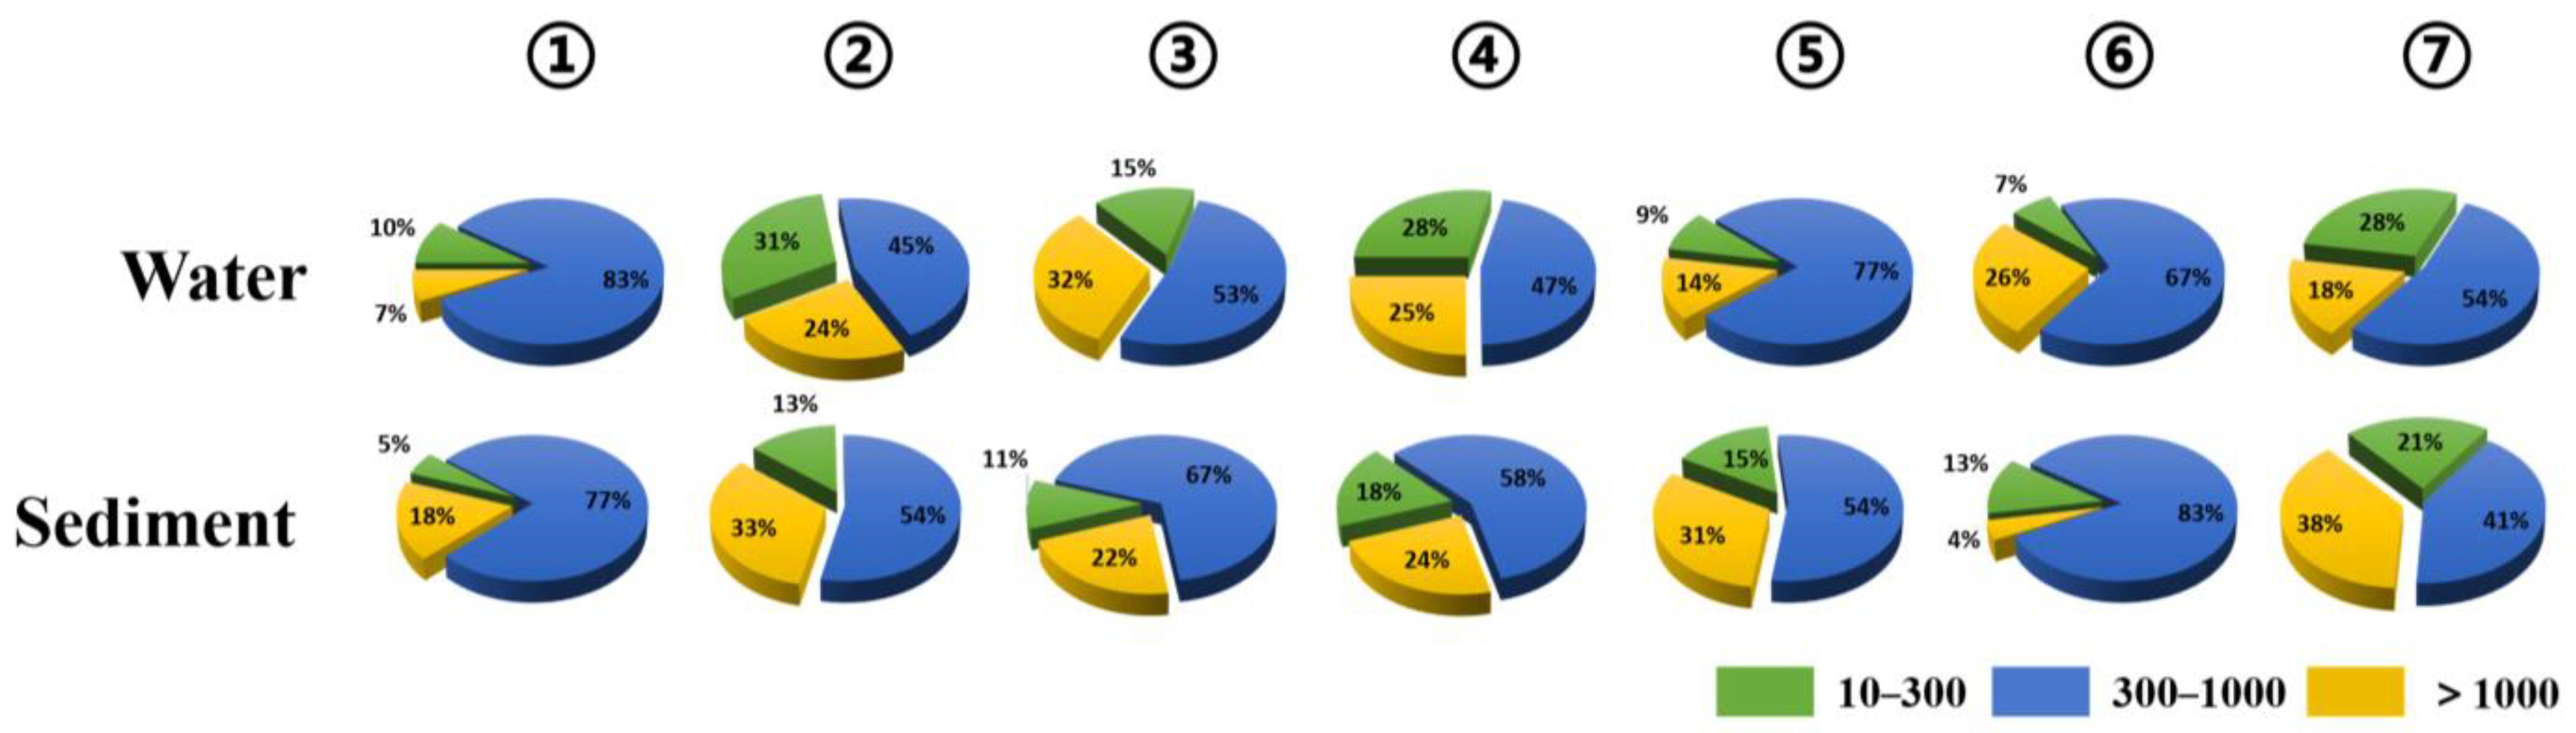
MPs in the 300–1000 μm size range constituted the largest proportion in both surface water and sediment, particularly at densely populated Sites 1, 5, and 6 (Figure 3). At most sites, the proportion of smaller-sized MPs (<300 μm) was higher in water than in sediment, consistent with the higher buoyancy and transport capacity of small particles [31,32,33,34]. The exceptions were Sites 5 and 6, where the water–sediment difference was minor, possibly due to localized turbulent mixing from construction activities or experimental variability.
Figure 3.
The size of MPs distribution for samples collected at 7 locations.
3.3. Morphological and Color Characteristics of MPs in Surface Water and Sediment
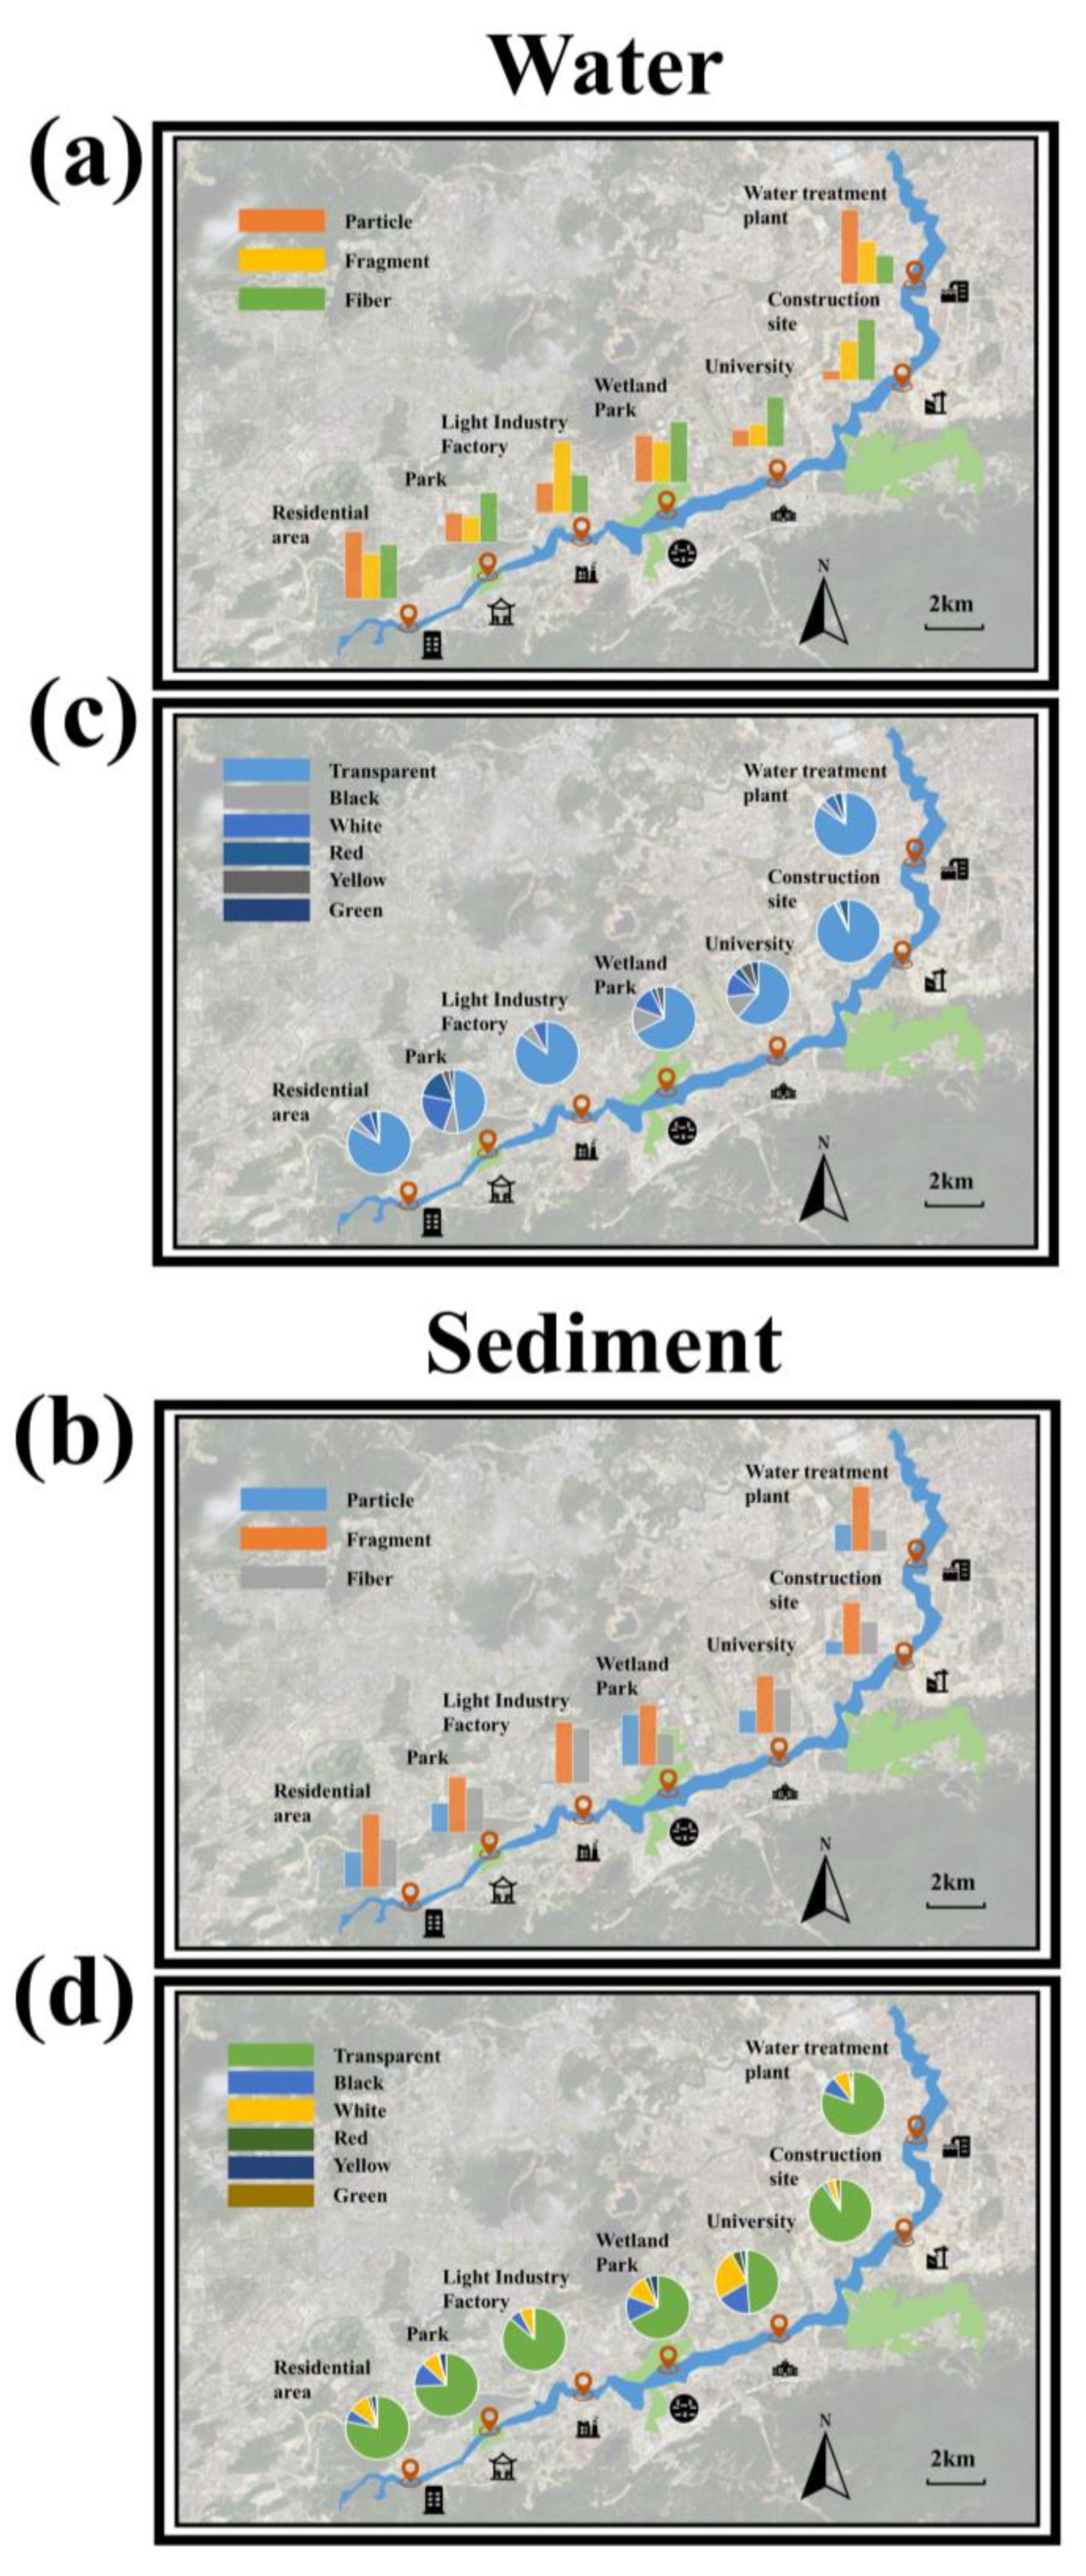
Morphological and chromatic characteristics of MPs on filters were analyzed using stereomicroscopy, with Figure 4 displaying features of samples collected from individual sampling sites. MPs in the Pingshan River samples were categorized into three morphological types: particles, fragments, and fibers. Fiber accounted for a large proportion of MPs in the surface water, and fragment MPs accounted for a large proportion of MPs in sediment. The prevalence of fibrous MPs is often associated with the degradation of textile fabrics or woven materials in the literature [35,36]. The elevated abundance of fibers at densely populated Site 5 and construction Site 6 is consistent with this interpretation, suggesting potential inputs from domestic wastewater and construction-related activities. Notably, at industrial Site 3, Fragment MPs accounted for a notably high proportion of total MPs. At this site, MPs enter the river through two distinct pathways: gaseous industrial emissions via atmospheric deposition and rainfall transport, and the weathered plastic waste of factory via fluvial and wind-driven transport [37,38]. Although atmospheric deposition is a potential pathway, no microplastics were detected in the field blanks. This likely reflects the relatively short exposure time and the limited atmospheric microplastic flux under the calm weather conditions during sampling, rather than the absence of atmospheric inputs in general. Future studies with longer blank exposure would be needed to capture this contribution. Particulate MPs are commonly found in industrial raw materials and cosmetic additives [39,40]. Spatial variations in the color distribution of MPs correlate with local environmental factors. For instance, a higher proportion of colored MPs was observed at Sites 2, 4, and 5. These sites are densely populated areas, which may be associated with considerable colored plastic waste.
Figure 4.
Morphological and color characteristics of MPs across 7 sampling sites. (a) Morphological composition of MPs in surface water (%), (b) morphological composition of MPs in sediment (%), (c) color distribution of MPs in surface water (%), (d) color distribution of MPs in sediment (%). Bar graphs represent the proportion of each category relative to the total MPs count at each site.
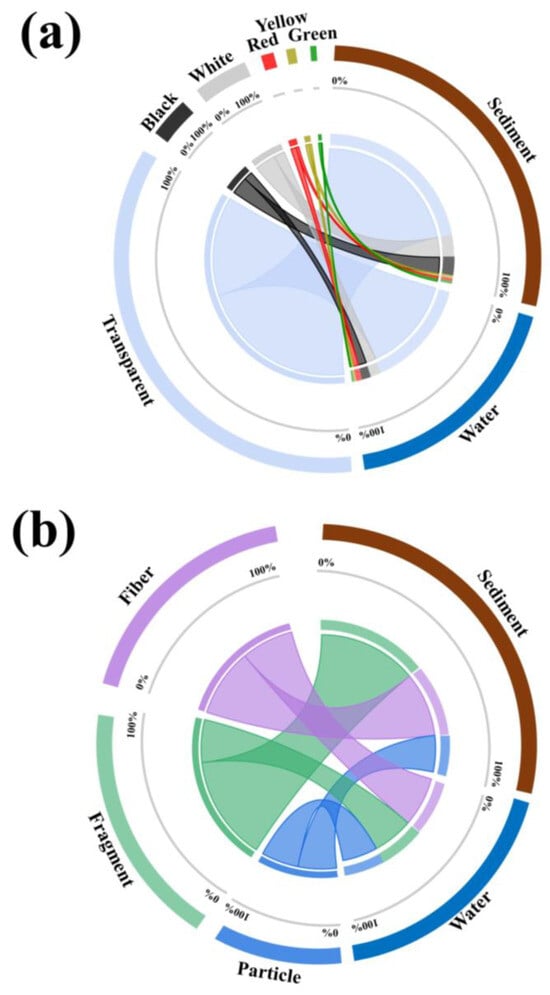
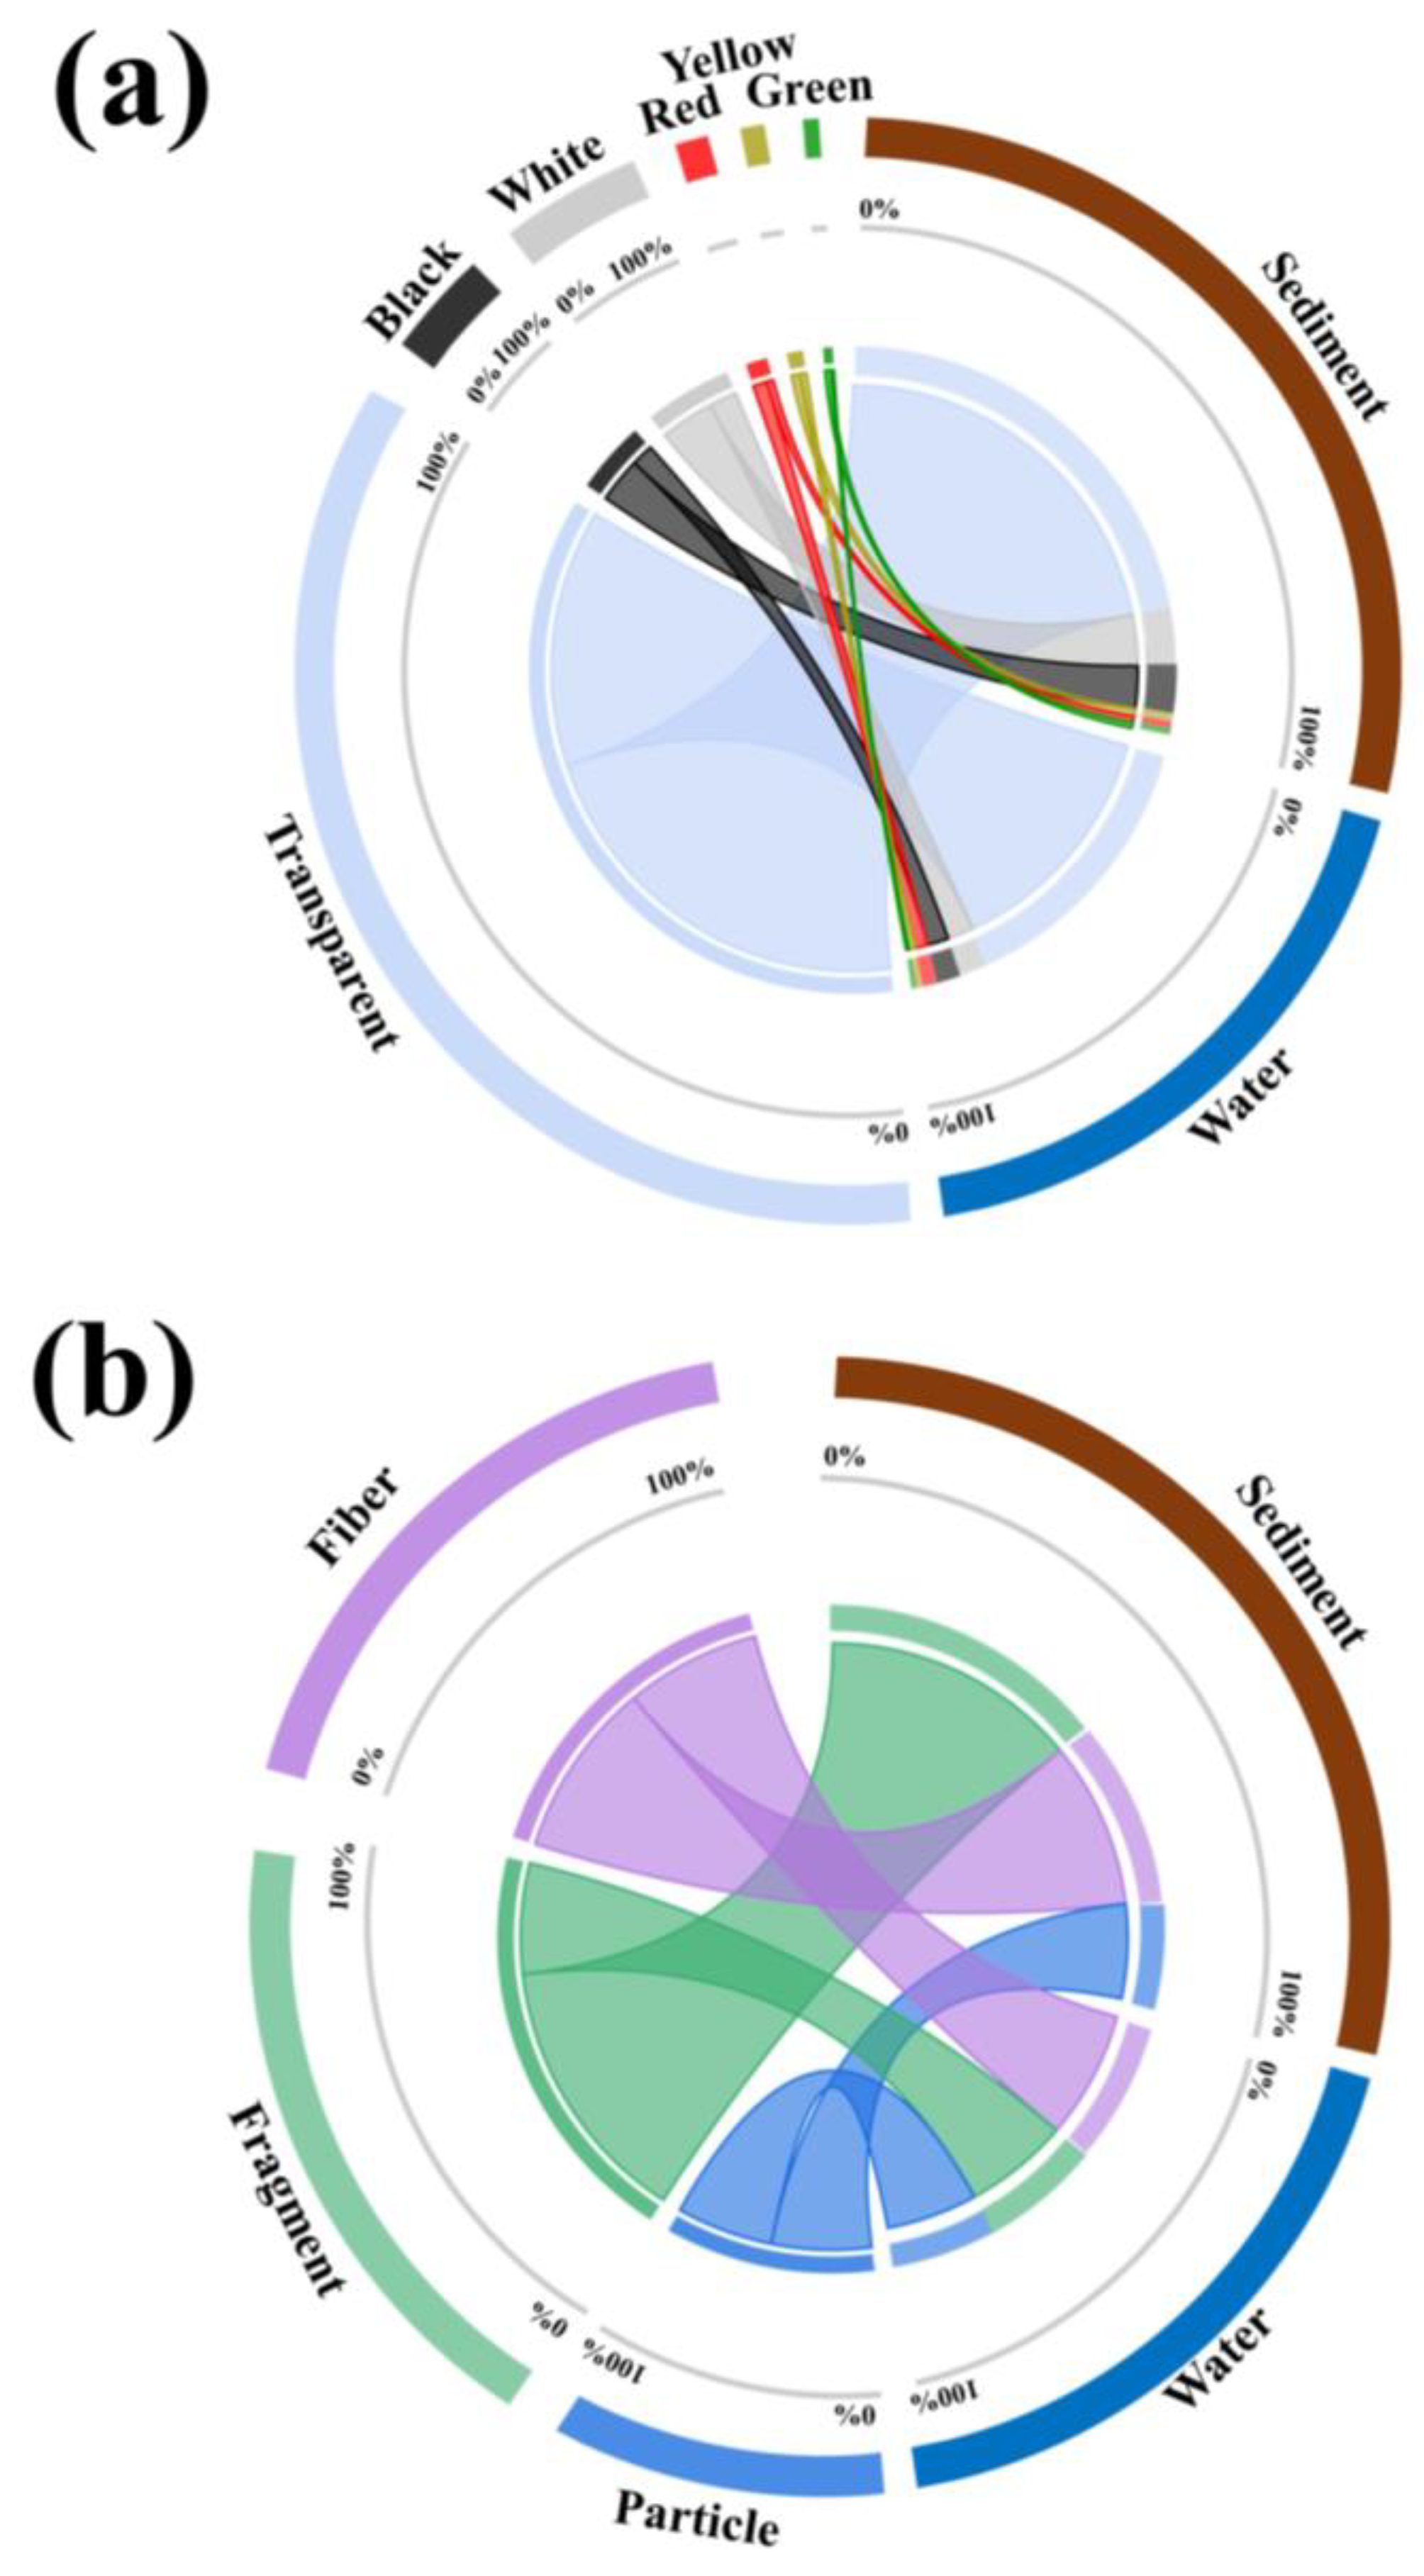
As illustrated in Figure 5a, the morphological composition of MPs in surface water shows roughly similar proportions of particle, fragment, and fiber morphotypes, while those in sediment show a distinct abundance order: fragment > fiber > particle. The reason why fragmented MPs account for a higher proportion than particulate ones may be physical abrasion in the riverbed, which converts particle MPs into fragments. As shown in Figure 5b, transparent MPs accounted for the highest proportion in both surface water (77.84%) and sediment (77.39%) samples. Classifying MPs by color can help identify potential sources, as different colors may originate from specific plastic products or degradation stages [41,42,43].
Figure 5.
(a) Integrated morphological characteristics of MPs throughout the basin, showing the relative proportions of fiber, fragment, and particle MPs in surface water and sediment. (b) Integrated color characteristics of MPs throughout the basin, showing the relative proportions of different color classes in surface water and sediment. The outer ring shows the MPs characteristics in the Pingshan River basin and whether they are from surface water or sediment; the inner ring represents the proportion of each component. The percentage values for each category are indicated in the diagram.
3.4. Types of MPs in Surface Water and Sediment
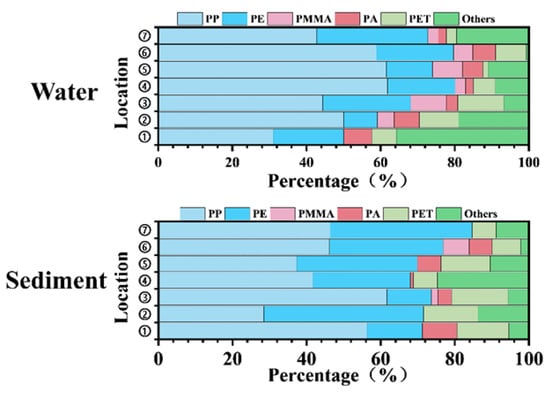
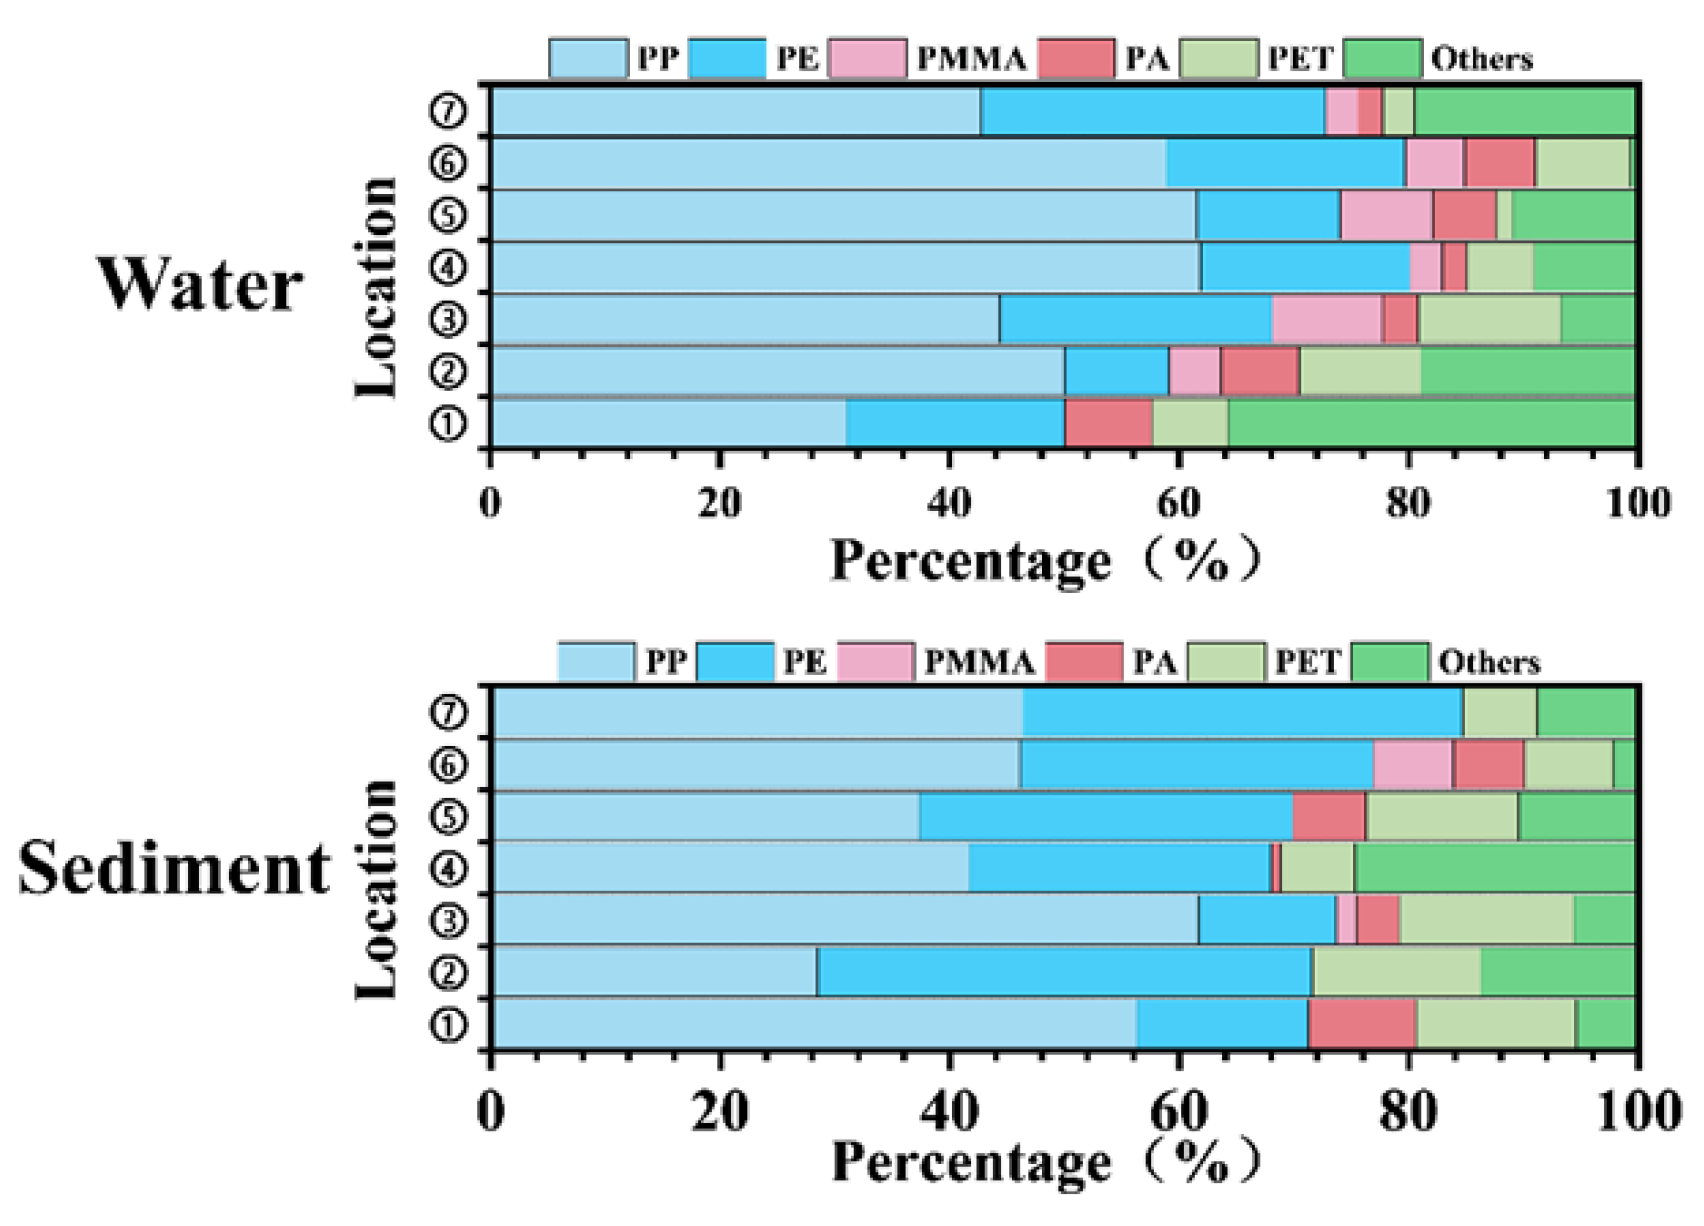
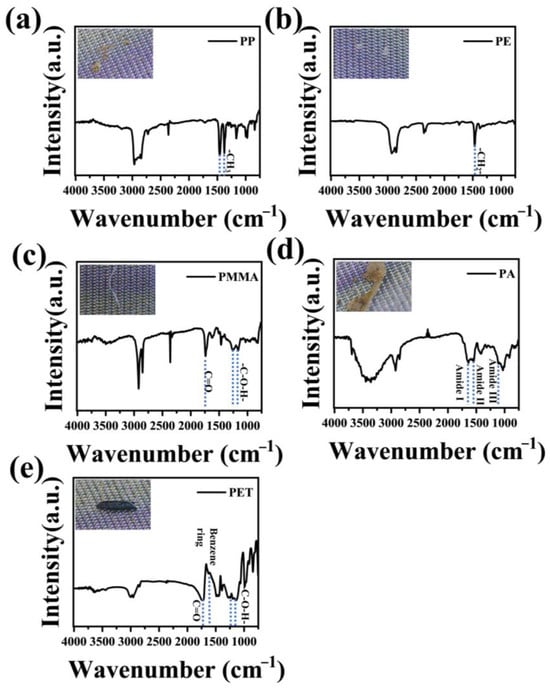
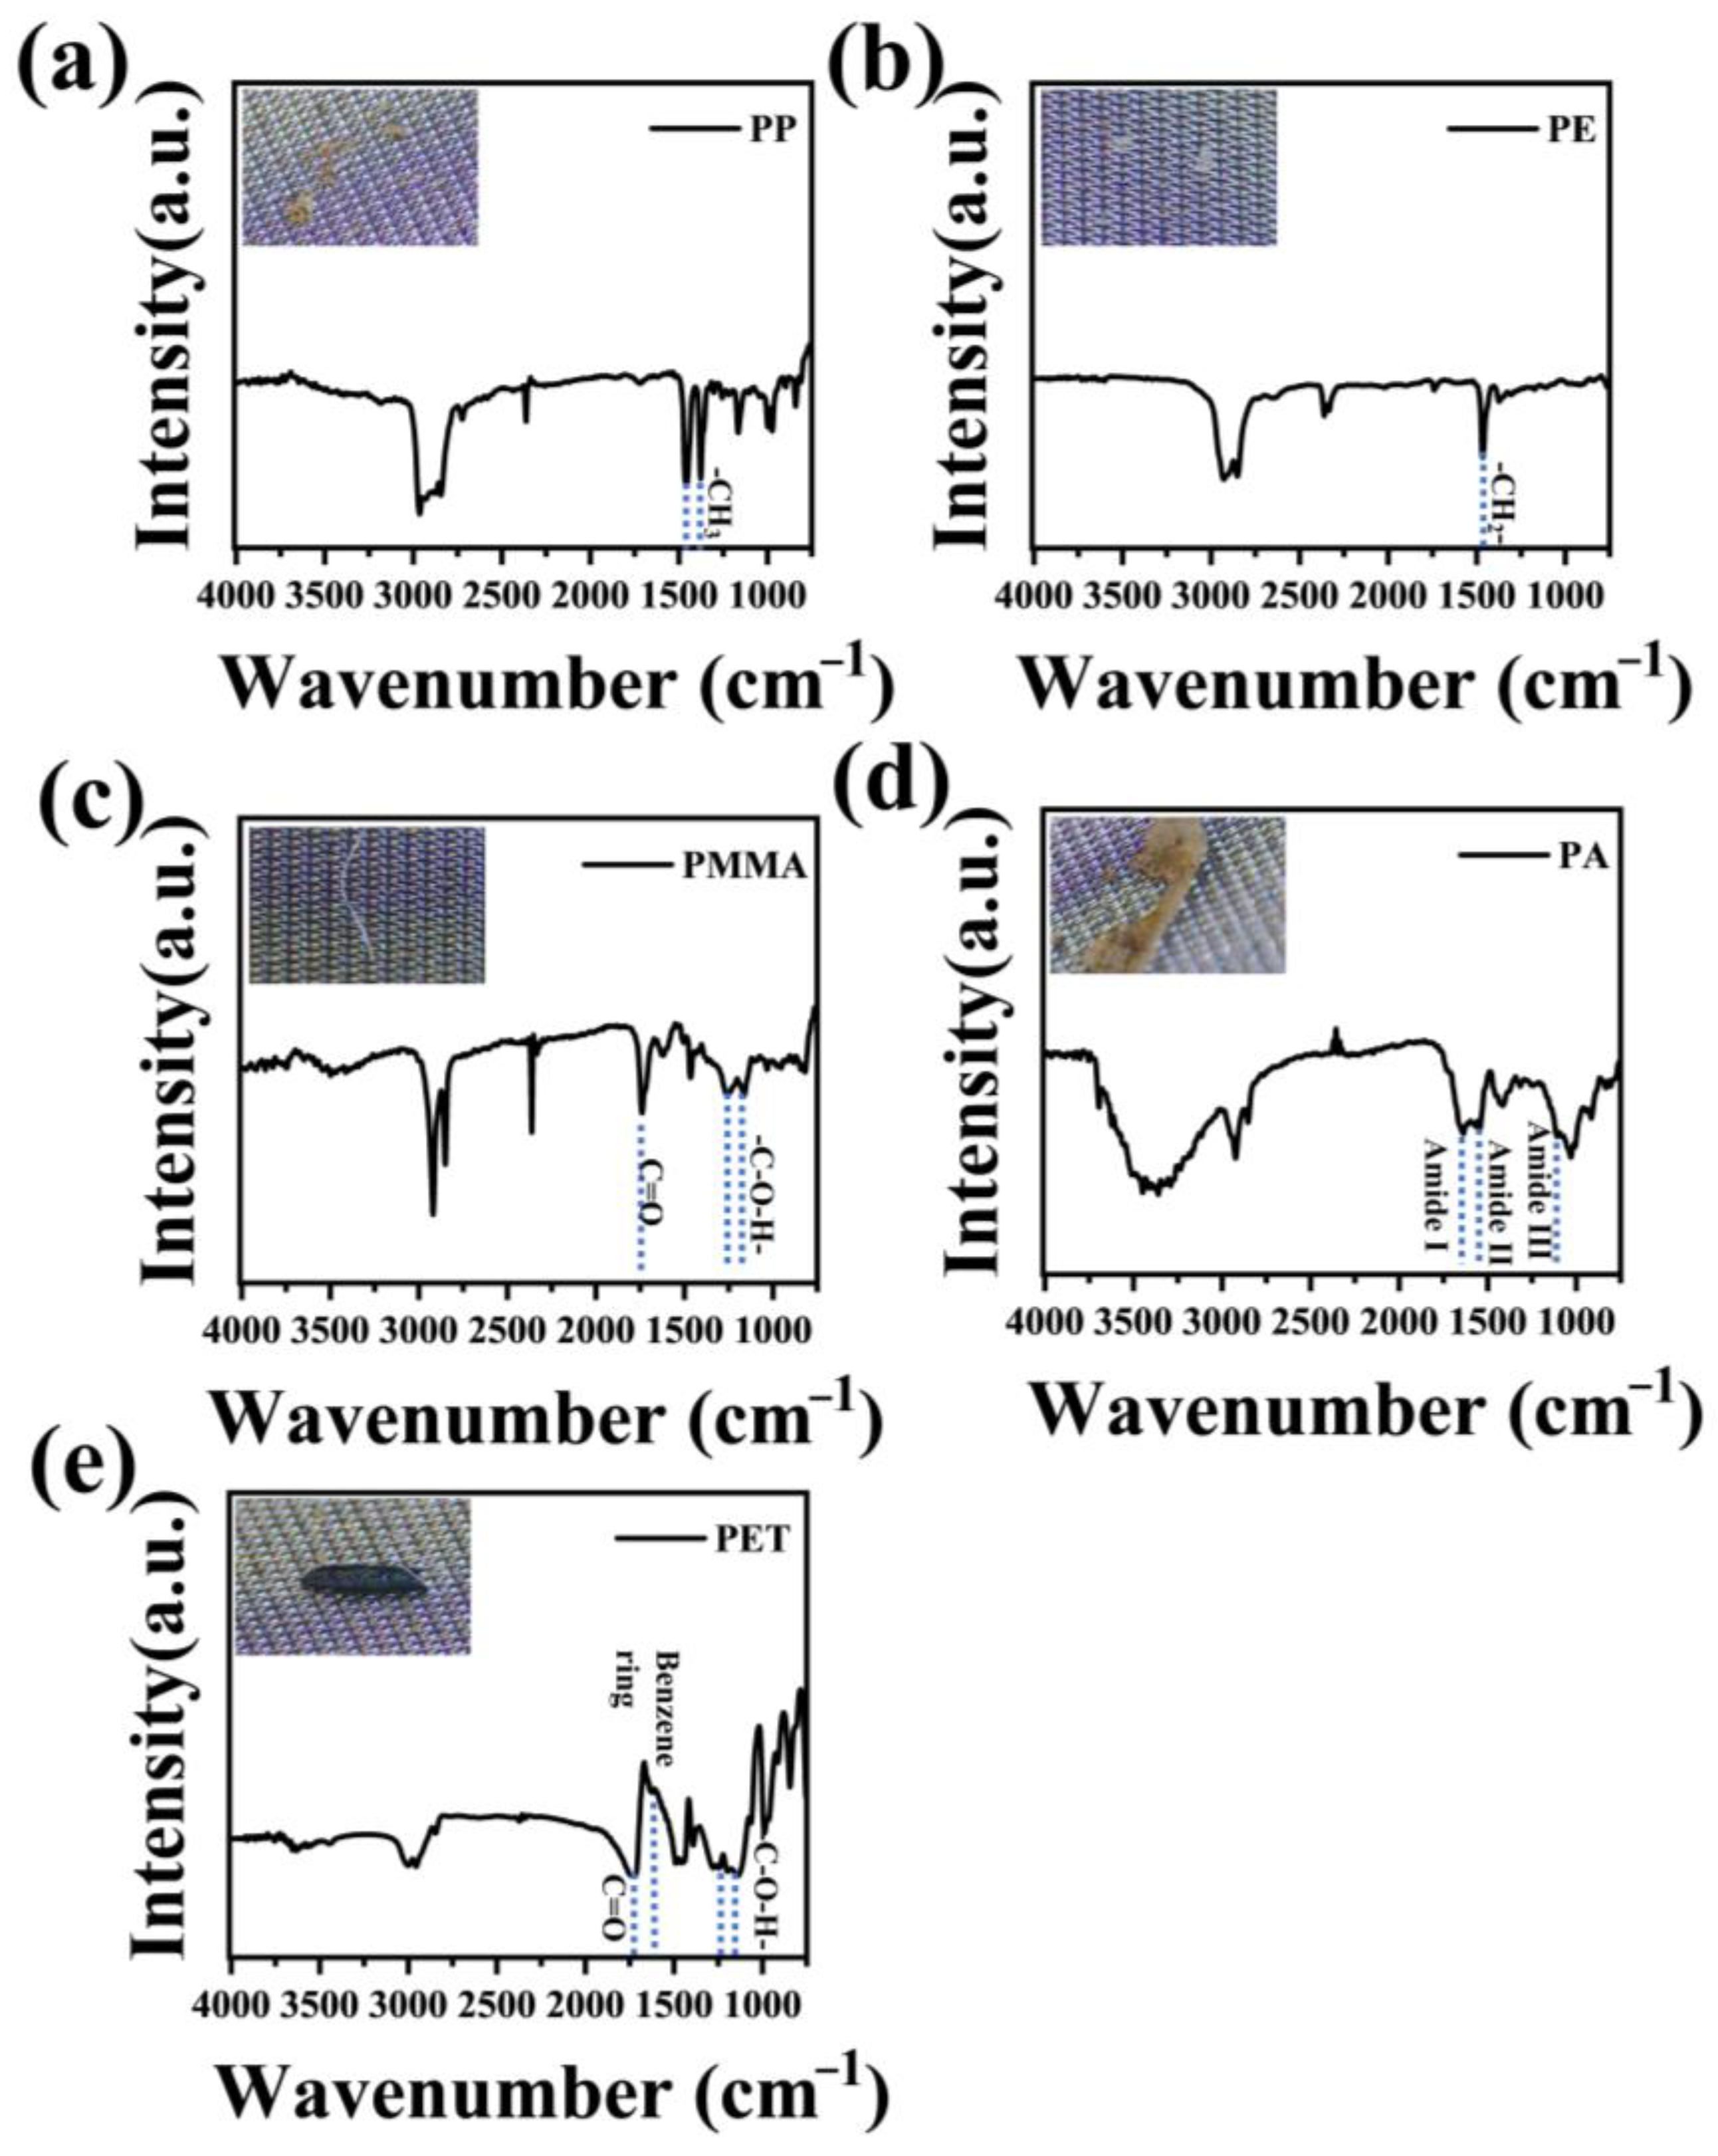
As illustrated in Figure 6, the polymer composition of MPs in the Pingshan River aligns with other urban waterways, dominated by polypropylene (PP) and polyethylene (PE) [44,45], with secondary components comprising polymethyl methacrylate (PMMA), polyamide (PA), polyethylene terephthalate (PET) and a fraction of particles that could not be identified based on spectral analysis, classified as “Unidentified”. Representative μ-FTIR spectra of observed polymers are provided in Figure 7. Source analysis indicates: PP and PE primarily originate from improperly disposed single-use packaging and food containers [46]; PMMA derives predominantly from packaging and advertising materials [47]; PA links to medical and textile industries [48]; PET enrichment in densely populated areas correlates with construction materials and the washing of clothes [49]. Differences in polymer composition across different regions effectively mirror the types of human activities in respective areas within the watershed.
Figure 6.
Major types of polymers found in water and sediment.
Figure 7.
Representative μ-FTIR spectra of typical microplastics detected by μ-FTIR in Pingshan River: (a) PP, (b) PE, (c) PMMA, (d) PA, (e) PET. The y-axis represents absorbance in arbitrary units (a.u.).
4. Discussion
The objectives of this study were threefold: (1) to delineate the characteristics (abundance, morphology, size, and polymer identity) of microplastics in an urban stream system; (2) to identify the key factors driving spatial distribution; and (3) to apportion potential sources using multivariate analysis. The results directly address these aims. For aim 1, microplastics were found to be ubiquitous, dominated by small fibers and fragments mainly composed of polyethylene and polypropylene. For aim 2, proximity to construction areas and domestic outfalls, coupled with low-flow dry-season conditions, emerged as the primary factors explaining the heterogeneous spatial patterns. For aim 3, principal component analysis effectively separated the sampling sites and linked distinct microplastic profiles to probable source categories, demonstrating the apportionment potential. In the following subsections, these findings are discussed in detail, moving from source identification to risk implications.
4.1. PCA-Based Source Identification
The spatial distribution of MPs in the Pingshan River exhibits pronounced heterogeneity, with higher abundances observed at sites influenced by construction activities (Site 6) and industrial discharge (Site 3), while lower levels occur at sites with better vegetation cover (Site 4) or less anthropogenic pressure (Site 2). These patterns suggest that local land use and human activities are key determinants of MPs input and retention in urban rivers. To further elucidate the underlying factors controlling MPs distribution, PCA was applied to both water and sediment datasets, integrating abundance, morphological features, color, and dominant polymer types.
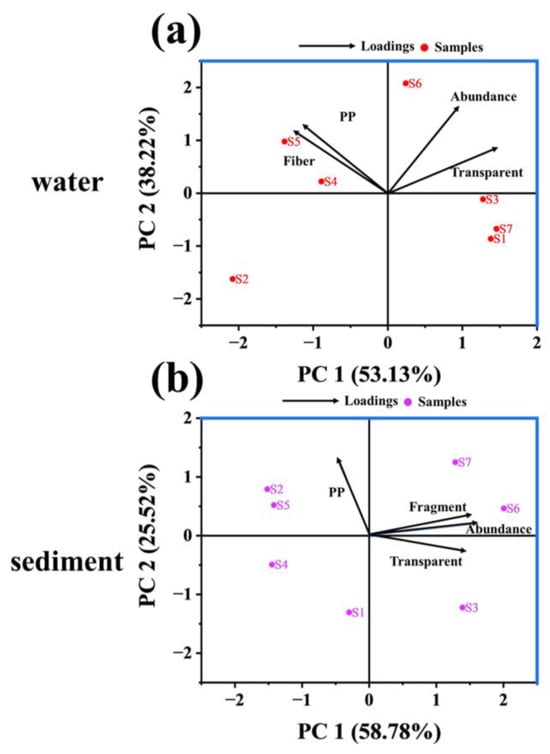
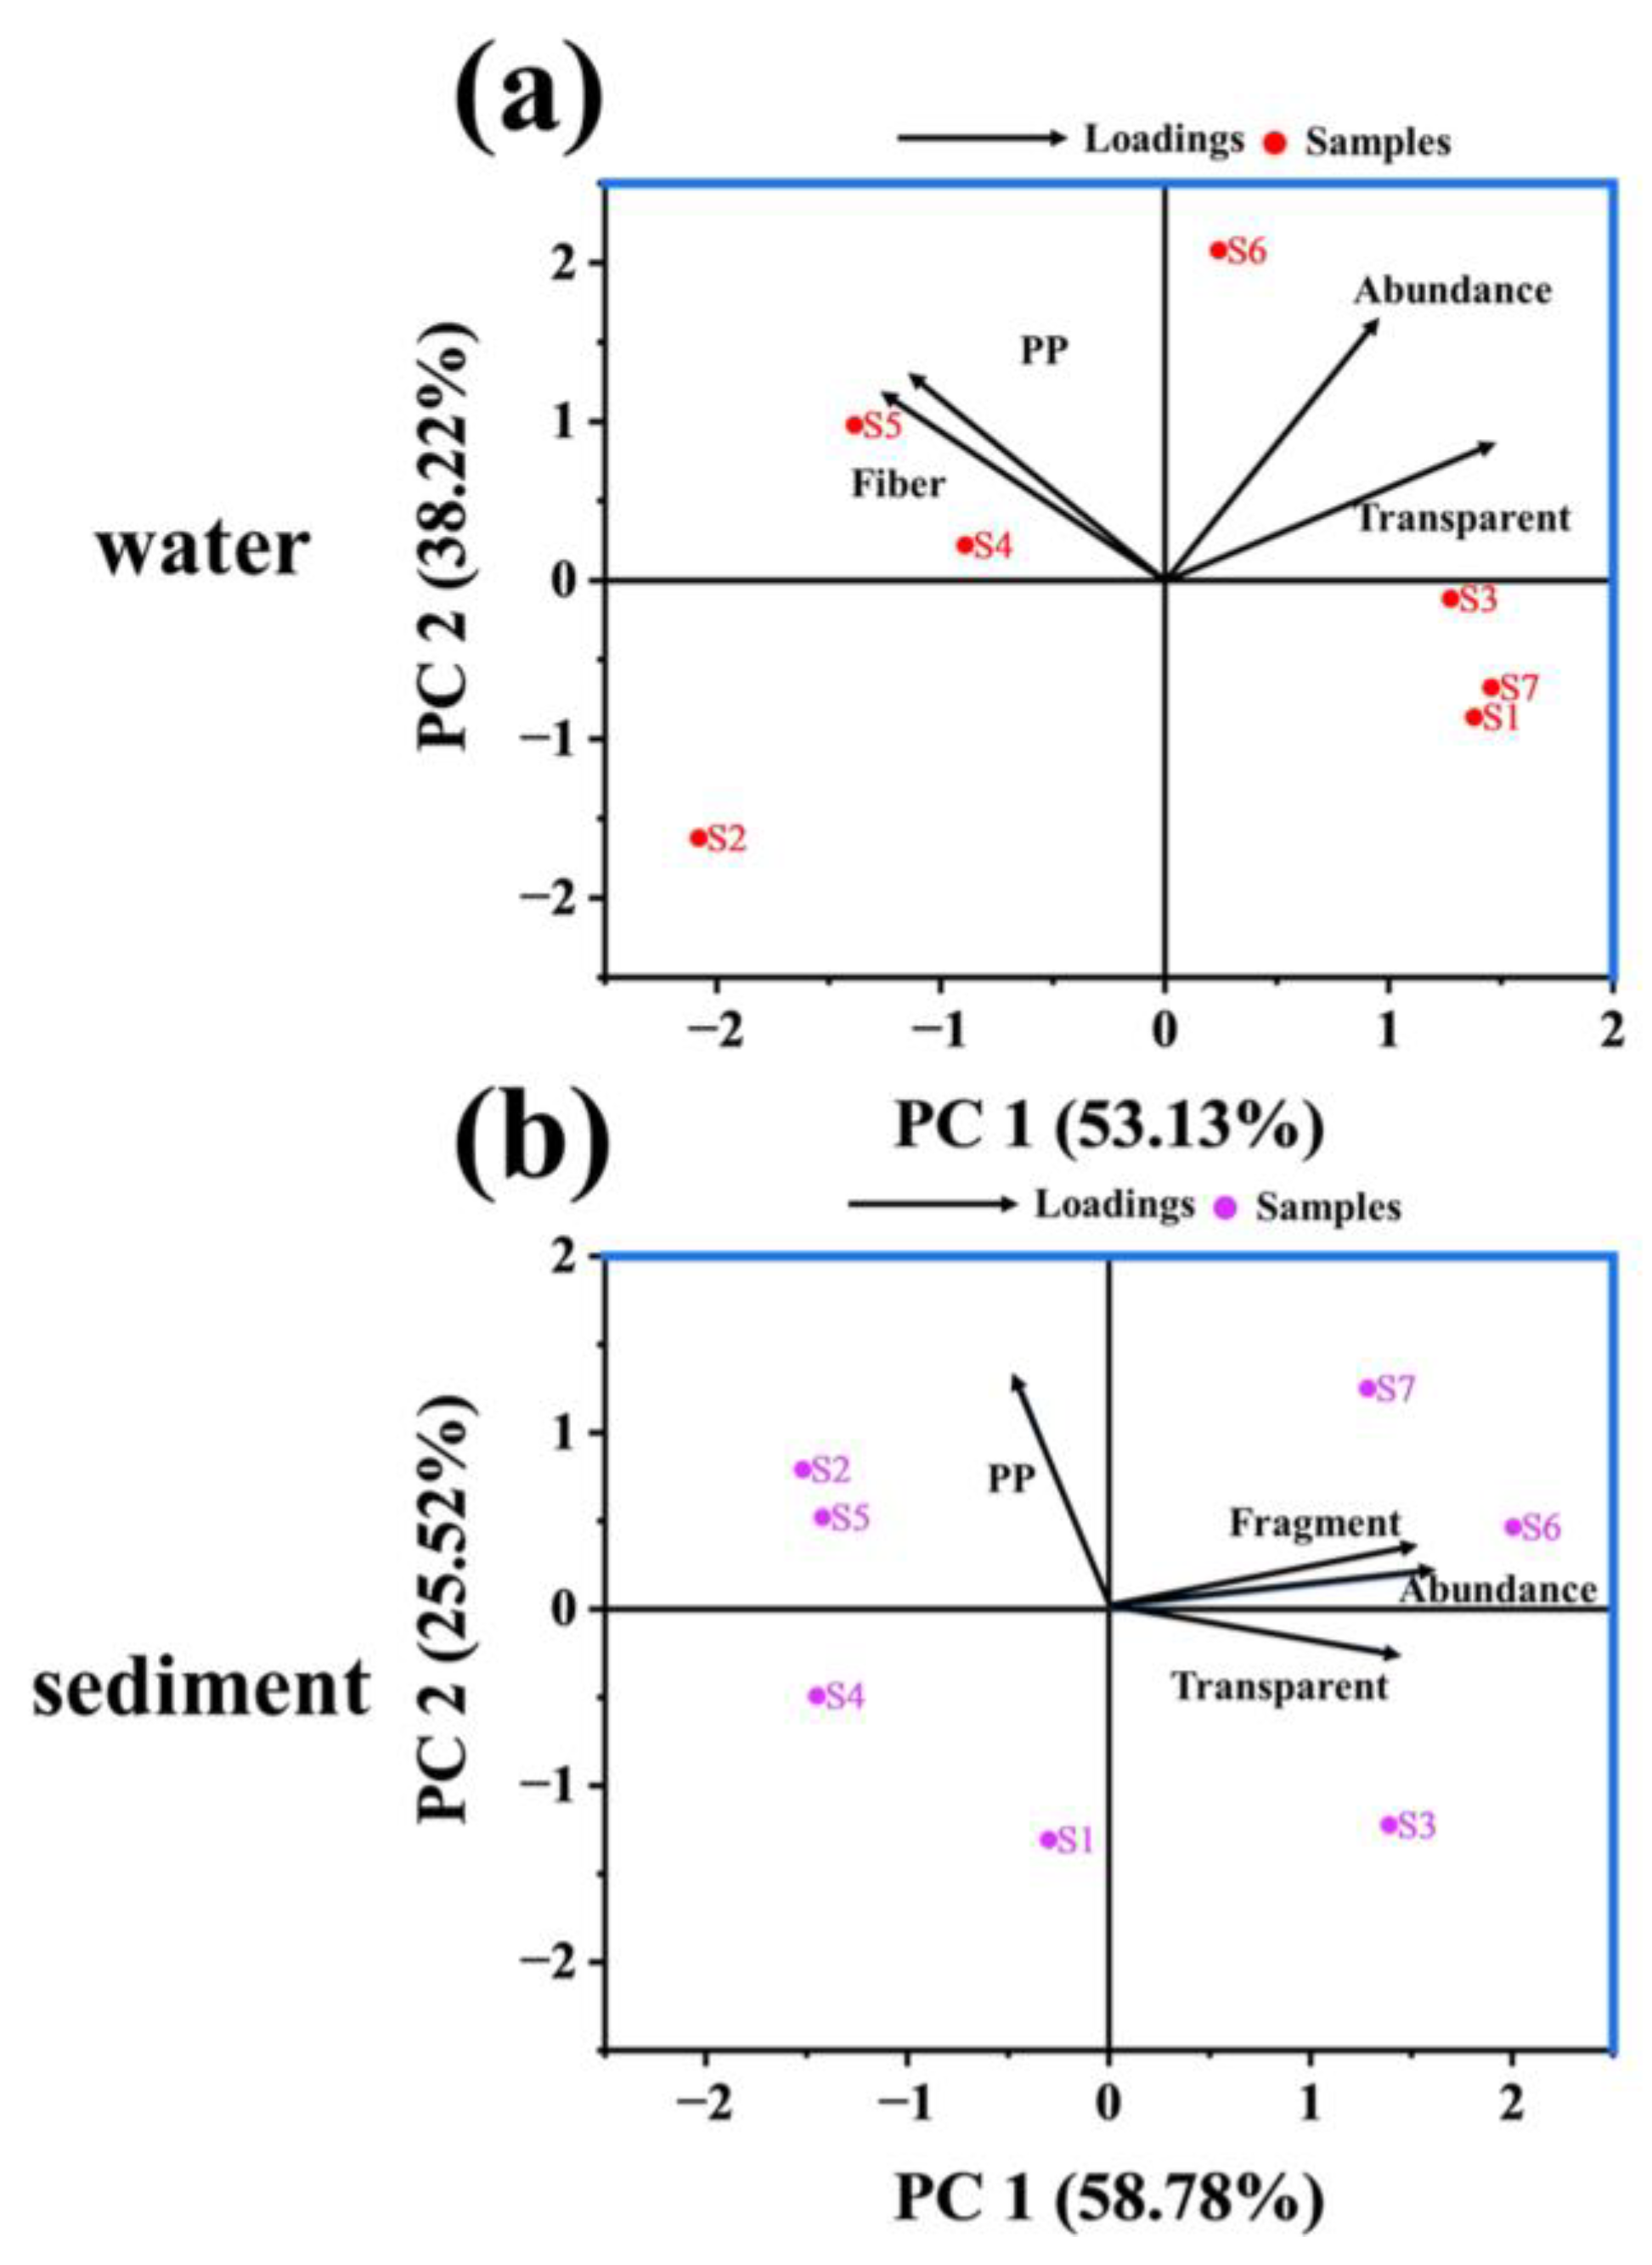
In surface water (Figure 8a), the first two principal components explained 53.13% and 38.22% of the variance. Site 6 (construction zone) was plotted close to the abundance vector, consistent with its elevated MP concentration (423 items/L). Sites 4 and 5 appeared near the PP and fiber vectors, reinforcing the link between residential activities and fibrous MP inputs. Site 3 (industrial area) was positioned opposite the fiber vector, where fragment MPs dominated—consistent with potential inputs from atmospheric deposition and industrial discharge. Site 2 was plotted distinctly in the fourth quadrant, which may reflect reduced aquatic vegetation due to artificial maintenance, diminishing natural MP interception capacity.
Figure 8.
Principal component analysis biplots of microplastic characteristics in (a) surface water and (b) sediment of Pingshan River. Black arrows represent variable loadings; Red and purple dots represent sampling site scores.
For sediment samples (Figure 8b), PC1 and PC2 accounted for 58.78% and 25.52% of the variance. Sites 6 and 7 were plotted near fragment and abundance vectors, indicating accumulation of weathered MPs in downstream sediments through physical abrasion and biofilm-mediated settling. Sites 2 and 5 appeared near the PP vector, consistent with inputs of plastic waste from anthropogenic activities. Site 3 was positioned near the transparent vector. Sites 1 and 4 clustered separately: Site 4’s wetland vegetation contributed to lower sediment MP retention, while Site 1 was influenced by constricted upstream flow conditions.
Collectively, while PCA reveals spatial patterns that correlate with land use and anthropogenic activities, the source inferences presented above should be regarded as exploratory. Given the widespread use of PP, PE, and PET in countless consumer products, and the common occurrence of fibers and fragments in urban runoff, domestic sewage, industrial effluents, and atmospheric fallout, a high degree of source overlap exists. Definitive source apportionment would require additional lines of evidence, such as chemical fingerprinting of plastic additives (e.g., stabilizers, flame retardants) or isotope labeling, which were beyond the scope of this study. The PCA results are therefore best used to generate hypotheses and prioritize areas for future targeted investigations, rather than to provide a quantitative source budget.
4.2. Pollution Assessment
The MPs Risk Index (H) evaluates pollution in the Pingshan River, quantifying MPs effects on organisms [50]. The formula is:
H represents the polymer risk index, Pn the proportion of a specific polymer among all MPs, and Sn the plastic polymer hazard factor. Sn values are: PP = 1, PET = 3, PE = 11, PA = 50, PMMA = 1021 [51].
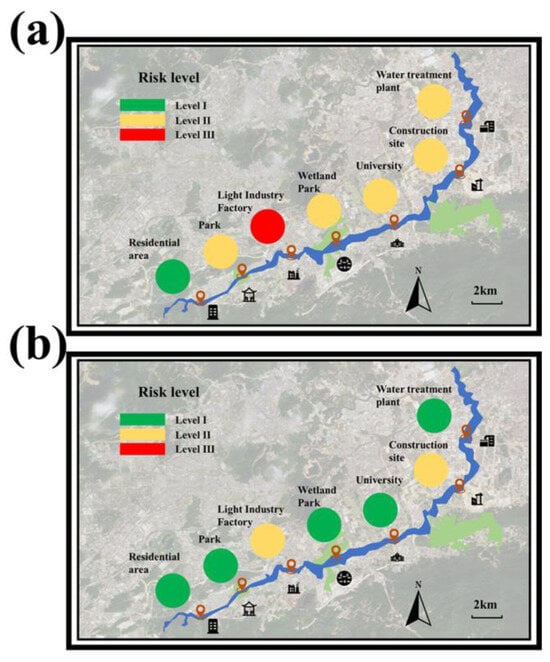
The risk levels of microplastics in surface water and sediments at each monitoring site along the Pingshan River are illustrated in Figure 9. The H is divided into four categories: Category I (H < 10), Category II (10 ≤ H < 100), Category III (100 ≤ H < 1000), and Category IV (H ≥ 1000), with Category I representing the lowest risk level. Based on the polymer hazard assessment, the calculated risk indicator for surface water was higher than that for sediments. However, this comparison is based solely on polymer hazard levels and does not imply that microplastic abundances in surface water are higher than those in sediments, nor does it constitute a comprehensive risk assessment across the two matrices. From the perspective of pollution classification across the entire watershed, both surface water and sediments in the Pingshan River are consistently at a Category II risk level.
Figure 9.
Potential environmental risk assessment of microplastics at seven sampling points in Pingshan River: (a) polymer hazard risk index for surface water samples, and (b) polymer hazard risk index for sediment samples.
It is noteworthy that Site 6, despite exhibiting the highest MP abundance (423 items/L in water and 756 items/kg in sediment) due to construction activities, did not show the highest polymer risk index (H). This is because the H index heavily weights the polymer hazard factor (Sn) of each plastic type. At Site 6, the dominant polymers were PP (Sn = 1) and PE (Sn = 11), whereas PMMA (Sn = 1021) and PA (Sn = 50) were present only in minor proportions. Consequently, the overall H remained within Category II. In contrast, sites with even trace amounts of high-hazard polymers (e.g., PMMA) could exhibit disproportionately elevated H values. This highlights that the polymer risk index reflects chemical hazard potential rather than particle abundance alone, and a low H does not necessarily imply low ecological impact from physical effects such as organismal ingestion or tissue damage. Therefore, risk assessment should integrate both abundance-based and polymer-hazard-based metrics for a comprehensive evaluation.
Compared with other Chinese rivers (Table 3), MP pollution in the Pingshan River falls within the upper range of reported abundances. This relatively high level can be attributed to several factors. First, methodological differences play a role: the use of a 3 μm filter in this study, as opposed to the larger pore sizes employed in many previous investigations, enabled the capture of a greater number of small-sized MPs. Second, the river itself possesses typical urban hydrological characteristics—namely a short channel, rapid flow, and limited environmental capacity—which, combined with intensive anthropogenic inputs, facilitate the accumulation of MPs. Third, sampling was conducted during the dry season with no antecedent rainfall, which minimized dilution effects and allowed local pollution signals to be more pronounced. Fourth, the inclusion of small size fractions (down to 10 μm) further contributed to the higher abundance estimates. Despite these elevated abundances, however, the polymer hazard risk index (H) classified all sites as Category II (10 ≤ H < 100), indicating a relatively low ecological risk based on polymer composition.
Table 3.
The situation of microplastics in river in China.
4.3. Limitations of the Study
Several limitations should be considered when interpreting the findings. First, the sampling was performed only once during the dry season (May 2023), providing a temporal snapshot that does not capture seasonal variability or the influence of rainfall and runoff events on microplastic mobilization. Second, the use of 1 L grab samples from the water surface limits the representativeness of the entire water column and may over- or under-estimate concentrations depending on vertical stratification. Third, laboratory methods such as visual sorting, despite strict quality control, carry a certain degree of subjectivity and may lead to underestimation of small or transparent particles; the exclusion of particles <300 µm also means that the counted concentrations are conservative. Fourth, only the most probable polymer types were confirmed via spectroscopy on a subset of particles, which introduces some uncertainty in the full compositional profile. Future studies could implement time-integrated and cross-seasonal sampling, larger volumes combined with depth-integrated techniques, and automated spectroscopic analysis of all particles to address these limitations. Furthermore, as indicated in Table 1, this study did not quantitatively characterize site-specific sediment properties such as grain size distribution, organic matter content, or detailed hydrological parameters (e.g., flow velocity, turbidity). While qualitative field observations are provided to aid interpretation, the absence of these quantitative environmental covariates limits the ability to perform rigorous statistical source apportionment or to disentangle the relative contributions of physical versus biological retention mechanisms. The interpretations of spatial heterogeneity (e.g., the role of aquatic vegetation or construction activities) are therefore primarily descriptive and should be considered hypothesis-generating rather than confirmatory. Future studies should integrate concurrent measurements of sediment texture, flow dynamics, and water quality parameters to enable more robust causal inference.
5. Conclusions
This study provides a comprehensive assessment of MP pollution in Shenzhen’s Pingshan River, a typical urban river with short channel length, rapid flow, and limited environmental capacity. Key findings include: (1) significant MP pollution in both surface water (mean 311.42 ± 90.78 items/L) and sediment (mean 508.85 ± 151.79 items/kg), with spatial heterogeneity linked to construction activities (Site 6: highest) and vegetation cover (Site 4: lower retention); (2) distinct morphological partitioning—fibers dominate water, fragments dominate sediment; (3) PP and PE as dominant polymers; and (4) a low polymer hazard risk (Category II) despite high abundances.
Author Contributions
Conceptualization, J.W. and S.Y.; methodology, J.W.; software, J.W.; validation, J.W. and S.Y.; formal analysis, J.W.; investigation, J.W.; resources, S.Y.; data curation, J.W.; writing—original draft preparation, J.W.; writing—review and editing, S.Y.; visualization, J.W.; supervision, S.Y.; project administration, S.Y.; funding acquisition, S.Y. All authors have read and agreed to the published version of the manuscript.
Funding
This research received no external funding.
Institutional Review Board Statement
Not applicable.
Informed Consent Statement
Not applicable.
Data Availability Statement
The data used in this study are available from the authors of this paper upon request.
Acknowledgments
The authors would like to thank the staff at the Pingshan River watershed for their assistance during field sampling. Technical support from the College of Materials Science and Engineering, Taiyuan University of Technology, is gratefully acknowledged. The authors have reviewed and edited the output and take full responsibility for the content of this publication.
Conflicts of Interest
The authors declare no conflicts of interest.
References
- Jiang, X.; Wang, T.; Jiang, M.; Xu, M.; Yu, Y.; Guo, B.; Chen, D.; Hu, S.; Jiang, J.; Zhang, Y.; et al. Assessment of Plastic Stocks and Flows in China: 1978–2017. Resour. Conserv. Recycl. 2020, 161, 104969. [Google Scholar] [CrossRef]
- Fang, M.; Liao, Z.; Ji, X.; Zhu, X.; Wang, Z.; Lu, C.; Shi, C.; Chen, Z.; Ge, L.; Zhang, M.; et al. Microplastic ingestion from atmospheric deposition during dining/drinking activities. J. Hazard. Mater. 2022, 432, 128674. [Google Scholar] [CrossRef] [PubMed]
- Wang, W.; Themelis, N.J.; Sun, K.; Bourtsalas, A.C.; Huang, Q.; Zhang, Y.; Wu, Z. Current influence of China’s ban on plastic waste imports. Waste Dispos. Sustain. Energy 2019, 1, 67–78. [Google Scholar] [CrossRef]
- Shen, M.; Huang, W.; Chen, M.; Song, B.; Zeng, G.; Zhang, Y. (Micro)plastic crisis: Un-ignorable contribution to global greenhouse gas emissions and climate change. J. Clean. Prod. 2020, 254, 120138. [Google Scholar] [CrossRef]
- Ratnasari, A.; Zainiyah, I.F.; Hadibarata, T.; Yan, L.Y.; Sharma, S.; Thakur, S.S. The Crucial Nexus of Microplastics on Ecosystem and Climate Change: Types, Source, Impacts, and Transport. Water Air Soil Pollut. 2024, 235, 315. [Google Scholar] [CrossRef]
- Saha, N.D.; Kumari, P.; Das, B.; Sahoo, R.N.; Kumar, R.; Golui, D.; Singh, B.; Jain, N.; Bhatia, A.; Chaudhary, A.; et al. Vis-NIR spectroscopy based rapid and non-destructive method to quantitate microplastics: An emerging contaminant in farm soil. Sci. Total Environ. 2024, 927, 172088. [Google Scholar] [CrossRef] [PubMed]
- Dhivert, E.; Pruvost, J.; Winiarski, T.; Gasperi, J.; Delor-Jestin, F.; Tassin, B.; Mourier, B. Time-varying microplastic contributions of a large urban and industrial area to river sediments. Environ. Pollut. 2024, 347, 123702. [Google Scholar] [CrossRef] [PubMed]
- Guo, M.; Noori, R.; Abolfathi, S. Microplastics in freshwater systems: Dynamic behaviour and transport processes. Resour. Conserv. Recycl. 2024, 205, 107578. [Google Scholar] [CrossRef]
- Leistenschneider, C.; Wu, F.; Primpke, S.; Gerdts, G.; Burkhardt-Holm, P. Unveiling high concentrations of small microplastics (11–500 μm) in surface water samples from the southern Weddell Sea off Antarctica. Sci. Total Environ. 2024, 927, 172124. [Google Scholar] [CrossRef] [PubMed]
- Li, G.; Tang, Y.; Lou, J.; Wang, Y.; Yin, S.; Li, L.; Iqbal, B.; Lozano, Y.M.; Zhao, T.; Du, D. The promoting effects of soil microplastics on alien plant invasion depend on microplastic shape and concentration. Sci. Total Environ. 2024, 926, 172089. [Google Scholar] [CrossRef] [PubMed]
- Eze, C.G.; Nwankwo, C.E.; Dey, S.; Sundaramurthy, S.; Okeke, E.S. Food chain microplastics contamination and impact on human health: A review. Environ. Chem. Lett. 2024, 22, 1889–1927. [Google Scholar] [CrossRef]
- Winiarska, E.; Jutel, M.; Zemelka-Wiacek, M. The potential impact of nano- and microplastics on human health: Understanding human health risks. Environ. Res. 2024, 251, 118535. [Google Scholar] [CrossRef] [PubMed]
- Patidar, K.; Ambade, B.; Alshehri, M. Microplastics and associated polycyclic aromatic hydrocarbons in surface water and sediment of the Bay of Bengal coastal area, India: Sources, pathway and ecological risk. Environ. Geochem. Health 2024, 46, 176. [Google Scholar] [CrossRef] [PubMed]
- Zhao, W.; Jiang, J.; Liu, M.; Tu, T.; Wang, L.; Zhang, S. Exploring correlations between microplastics, microorganisms, and water quality in an urban drinking water source. Ecotoxicol. Environ. Saf. 2024, 275, 116249. [Google Scholar] [CrossRef] [PubMed]
- Sun, Y.; Liu, N.; Shang, J.; Zhang, J. Sustainable utilization of water resources in China: A system dynamics model. J. Clean. Prod. 2017, 142, 613–625. [Google Scholar] [CrossRef]
- Tang, S.; Gao, L.; Gao, H.; Chen, Z.; Zou, D. Microplastics pollution in China water ecosystems: A review of the abundance, characteristics, fate, risk and removal. Water Sci. Technol. 2020, 82, 1495–1508. [Google Scholar] [CrossRef] [PubMed]
- Wang, L.; Han, X.; Zhang, Y.; Zhang, Q.; Wan, X.; Liang, T.; Song, H.; Bolan, N.; Shaheen, S.M.; White, J.R.; et al. Impacts of land uses on spatio-temporal variations of seasonal water quality in a regulated river basin, Huai River, China. Sci. Total Environ. 2023, 857, 159584. [Google Scholar] [CrossRef] [PubMed]
- Zhao, J.; Fang, G.; Wang, X.; Zhong, H. Joint Optimization of Urban Water Quantity and Quality Allocation in the Plain River Network Area. Sustainability 2024, 16, 1368. [Google Scholar] [CrossRef]
- Ji, Q.; Zhang, Y.; Xia, Y.; Wang, X.; He, M.; Yang, Y.; Sabel, C.E.; Huang, B.; Zhu, F.; Shao, M.; et al. Centennial Records of Microplastics in Lake Cores in Huguangyan Maar Lake, China. Environ. Sci. Technol. 2024, 58, 11140–11151. [Google Scholar] [CrossRef] [PubMed]
- Liu, Y.; Liang, L.; Wu, J.; Zhao, X.; Li, J.; Fang, T.; Liang, Y.; Jiang, Z. Microplastic pollutants in sediments from a water supply reservoir: Spatial heterogeneity in abundance, characteristics and pollution evaluation. Limnologica 2024, 107, 126186. [Google Scholar] [CrossRef]
- Gardoki, J.; Cearreta, A.; Irabien, M.J.; Gómez-Arozamena, J.; Villasante-Marcos, V.; García-Artola, A.; Bessa, F. Recent environmental and morphosedimentary evolution of the mining-impacted Nalón Estuary (Asturias, N Spain): Disentangling natural and anthropogenic processes. Sci. Total Environ. 2024, 943, 173792. [Google Scholar] [CrossRef] [PubMed]
- Guo, Q.; Ding, C.; Meng, Q.; Shen, X.; Yang, K.; Li, Z.; Chen, X.; Wang, C.; Wu, J.; Yu, J.; et al. Abundance, characteristics and ecological risks of microplastics from South Yellow Sea Mudflat. Sci. Total Environ. 2024, 950, 175374. [Google Scholar] [CrossRef] [PubMed]
- Idowu, G.A.; Olanipekun, O.O.; Adelodun, A.A.; Gbadamosi, O.K.; Adu, B.W.; Aiyesanmi, A.F. Meso- and micro-plastics contamination of water, sediments and fish species in coastal communities of Ondo State, Nigeria. Reg. Stud. Mar. Sci. 2024, 77, 103727. [Google Scholar] [CrossRef]
- Liu, Y.; Wang, C.; Yu, Y.; Chen, Y.; Du, L.; Qu, X.; Peng, W.; Zhang, M.; Gui, C. Effect of Urban Stormwater Road Runoff of Different Land Use Types on an Urban River in Shenzhen, China. Water 2019, 11, 2545. [Google Scholar] [CrossRef]
- Liu, M.; Hao, Z.; Radu, T.; Leng, X.; Lu, H.; Wang, L. Evaluation method for restoration effect of different sections of small and medium-sized rivers: A case study of the Qingyi River, China. Environ. Res. 2023, 236, 116797. [Google Scholar] [CrossRef] [PubMed]
- Yan, Z.; Zhou, Z.; Sang, X.; Wang, H. Water replenishment for ecological flow with an improved water resources allocation model. Sci. Total Environ. 2018, 643, 1152–1165. [Google Scholar] [CrossRef] [PubMed]
- Li, Q.; Yu, Y.; Catena, M.R.; Ahmad, S.; Jia, H.; Guan, Y. Multifactor-based spatio-temporal analysis of effects of urbanization and policy interventions on ecosystem service capacity: A case study of Pingshan River Catchment in Shenzhen city, China. Urban For. Urban Green. 2021, 64, 127263. [Google Scholar] [CrossRef]
- Alilou, H.; Moghaddam Nia, A.; Saravi, M.M.; Salajegheh, A.; Han, D.; Bakhtiari Enayat, B. A novel approach for selecting sampling points locations to river water quality monitoring in data-scarce regions. J. Hydrol. 2019, 573, 109–122. [Google Scholar] [CrossRef]
- Alvarez-Vázquez, L.J.; Martínez, A.; Vázquez-Méndez, M.E.; Vilar, M.A. Optimal location of sampling points for river pollution control. Math. Comput. Simul. 2006, 71, 149–160. [Google Scholar] [CrossRef]
- Gao, M.; Li, C.; Li, Y.; Wen, S.; Zhang, Y.; Liu, L.; Zhang, J.; Chen, M.; Yang, J. Integration of ecological restoration and landscape aesthetics: Mechanisms of microplastic retention by optimization of aquatic plants landscape design in urban constructed wetlands—A case study of the living water park in Chengdu. Sci. Total Environ. 2024, 957, 177331. [Google Scholar] [CrossRef] [PubMed]
- Besseling, E.; Quik, J.T.K.; Sun, M.; Koelmans, A.A. Fate of nano- and microplastic in freshwater systems: A modeling study. Environ. Pollut. 2017, 220, 540–548. [Google Scholar] [CrossRef] [PubMed]
- Matsuguma, Y.; Takada, H.; Kumata, H.; Kanke, H.; Sakurai, S.; Suzuki, T.; Itoh, M.; Okazaki, Y.; Boonyatumanond, R.; Zakaria, M.P.; et al. Microplastics in Sediment Cores from Asia and Africa as Indicators of Temporal Trends in Plastic Pollution. Arch. Environ. Contam. Toxicol. 2017, 73, 230–239. [Google Scholar] [CrossRef] [PubMed]
- Zheng, Y.; Li, J.; Cao, W.; Jiang, F.; Zhao, C.; Ding, H.; Wang, M.; Gao, F.; Sun, C. Vertical distribution of microplastics in bay sediment reflecting effects of sedimentation dynamics and anthropogenic activities. Mar. Pollut. Bull. 2020, 152, 110885. [Google Scholar] [CrossRef] [PubMed]
- Fazey, F.M.C.; Ryan, P.G. Biofouling on buoyant marine plastics: An experimental study into the effect of size on surface longevity. Environ. Pollut. 2016, 210, 354–360. [Google Scholar] [CrossRef] [PubMed]
- Dris, R.; Gasperi, J.; Saad, M.; Mirande, C.; Tassin, B. Synthetic fibers in atmospheric fallout: A source of microplastics in the environment? Mar. Pollut. Bull. 2016, 104, 290–293. [Google Scholar] [CrossRef] [PubMed]
- González-Pleiter, M.; Velázquez, D.; Edo, C.; Carretero, O.; Gago, J.; Barón-Sola, Á.; Hernández, L.E.; Yousef, I.; Quesada, A.; Leganés, F.; et al. Fibers spreading worldwide: Microplastics and other anthropogenic litter in an Arctic freshwater lake. Sci. Total Environ. 2020, 722, 137904. [Google Scholar] [CrossRef] [PubMed]
- Lee, T.-Y.; Kim, L.; Kim, D.; An, S.; An, Y.-J. Microplastics from shoe sole fragments cause oxidative stress in a plant (Vigna radiata) and impair soil environment. J. Hazard. Mater. 2022, 429, 128306. [Google Scholar] [CrossRef] [PubMed]
- Werbowski, L.M.; Gilbreath, A.N.; Munno, K.; Zhu, X.; Grbic, J.; Wu, T.; Sutton, R.; Sedlak, M.D.; Deshpande, A.D.; Rochman, C.M. Urban Stormwater Runoff: A Major Pathway for Anthropogenic Particles, Black Rubbery Fragments, and Other Types of Microplastics to Urban Receiving Waters. ACS EST Water 2021, 1, 1420–1428. [Google Scholar] [CrossRef]
- Sembiring, E.; Mahapati, W.O.S.W.; Hidayat, S. Microplastics particle size affects cloth filter performance. J. Water Process Eng. 2021, 42, 102166. [Google Scholar] [CrossRef]
- Zhou, Y.; Ashokkumar, V.; Amobonye, A.; Bhattacharjee, G.; Sirohi, R.; Singh, V.; Flora, G.; Kumar, V.; Pillai, S.; Zhang, Z.; et al. Current research trends on cosmetic microplastic pollution and its impacts on the ecosystem: A review. Environ. Pollut. 2023, 320, 121106. [Google Scholar] [CrossRef] [PubMed]
- Huang, B.; Sun, L.; Liu, M.; Huang, H.; He, H.; Han, F.; Wang, X.; Xu, Z.; Li, B.; Pan, X. Abundance and distribution characteristics of microplastic in plateau cultivated land of Yunnan Province, China. Environ. Sci. Pollut. Res. 2021, 28, 1675–1688. [Google Scholar] [CrossRef] [PubMed]
- Yin, L.; Jiang, C.; Wen, X.; Du, C.; Zhong, W.; Feng, Z.; Long, Y.; Ma, Y. Microplastic Pollution in Surface Water of Urban Lakes in Changsha, China. Int. J. Environ. Res. Public Health 2019, 16, 1650. [Google Scholar] [CrossRef] [PubMed]
- Dikareva, N.; Simon, K.S. Microplastic pollution in streams spanning an urbanisation gradient. Environ. Pollut. 2019, 250, 292–299. [Google Scholar] [CrossRef] [PubMed]
- Pan, Z.; Sun, Y.; Liu, Q.; Lin, C.; Sun, X.; He, Q.; Zhou, K.; Lin, H. Riverine microplastic pollution matters: A case study in the Zhangjiang River of Southeastern China. Mar. Pollut. Bull. 2020, 159, 111516. [Google Scholar] [CrossRef] [PubMed]
- Zhang, Z.; Deng, C.; Dong, L.; Liu, L.; Li, H.; Wu, J.; Ye, C. Microplastic pollution in the Yangtze River Basin: Heterogeneity of abundances and characteristics in different environments. Environ. Pollut. 2021, 287, 117580. [Google Scholar] [CrossRef] [PubMed]
- Zheng, X.; Feng, Q.; Chen, J.; Yan, J.; Li, X.; Guo, L. Quantification analysis of microplastics released from disposable polystyrene tableware with fluorescent polymer staining. Sci. Total Environ. 2023, 864, 161155. [Google Scholar] [CrossRef] [PubMed]
- Shi, T.; Xu, H.; Pan, C.; Wang, X.; Jiang, Y.; Li, Q.; Guo, J.; Mo, X.; Luo, P.; Fang, Q.; et al. Distribution, characteristics, and ecological risks of microplastics in the Hongyingzi sorghum production base in China. Environ. Pollut. 2024, 361, 124866. [Google Scholar] [CrossRef] [PubMed]
- Bäuerlein, P.S.; Hofman-Caris, R.C.H.M.; Pieke, E.N.; ter Laak, T.L. Fate of microplastics in the drinking water production. Water Res. 2022, 221, 118790. [Google Scholar] [CrossRef] [PubMed]
- Šaravanja, A.; Pušić, T.; Dekanić, T. Microplastics in Wastewater by Washing Polyester Fabrics. Materials 2022, 15, 2683. [Google Scholar] [CrossRef] [PubMed]
- Zhou, G.; Wang, Q.; Zhang, J.; Li, Q.; Wang, Y.; Wang, M.; Huang, X. Distribution and characteristics of microplastics in urban waters of seven cities in the Tuojiang River basin, China. Environ. Res. 2020, 189, 109893. [Google Scholar] [CrossRef] [PubMed]
- Lithner, D.; Larsson, Å.; Dave, G. Environmental and health hazard ranking and assessment of plastic polymers based on chemical composition. Sci. Total Environ. 2011, 409, 3309–3324. [Google Scholar] [CrossRef] [PubMed]
- Mo, C.; Di, Q.; Wang, S.; Zhou, Z.; Ding, J.; Zhan, M.; Hayat, K.; Xu, X.; Liu, W. Beyond Particle Counts: Mass-Based Microplastic Risk Assessment in Urban Freshwater Reveals PVC-Dominated Ecological Threats in China’s Qiantang River. Water Air Soil Pollut. 2026, 237, 640. [Google Scholar] [CrossRef]
- Tan, S.; Tang, W. Characteristics of Microplastic Pollution in the Water and Sediments of the Suzhou River, Shanghai, China. Water 2026, 18, 467. [Google Scholar] [CrossRef]
- Yao, N.; Wang, J.; Yan, S.; Yang, F.; Zhang, M.; Zhang, Y.; Liu, Y.; Zhou, Q. Seasonal variations in microplastic abundance and key driving factors in the aquatic environment of a typical river-connected lake. Eng. Environ. 2026, 20, 39. [Google Scholar] [CrossRef]
- Bao, L.; Hao, J.; Pan, W. Distribution, Sources, and Ecological Risk Assessment of Microplastics in the Lower Minjiang River. Toxics 2025, 13, 1033. [Google Scholar] [CrossRef] [PubMed]
- Tan, T.; Liu, A.; Yang, Y.; Yu, R.; Lin, N.; Ke, Q.; Wang, Q. Microplastic Pollution in Typical Subtropical Rivers in Eastern China: A Case Study of the Feiyun River Basin. Water 2025, 17, 3170. [Google Scholar] [CrossRef]
- Zhao, S.; Tian, Y.; Zhong, Y.; Lin, J.; Niu, L.; Yang, Q. Hydro-sedimentary conditions shape the microplastic occurrence in sediments of the Pearl River Estuary (China). Mar. Pollut. Bull. 2026, 222, 118894. [Google Scholar] [CrossRef] [PubMed]
- Chen, B.; Zhou, Y.; Hossain, K.B.; Chen, Y.; Zhu, X.; Li, H.; Xu, X.; Cai, M. Microplastic in tropical island estuaries in China: Source identification and management framework development. Mar. Environ. Res. 2026, 213, 107643. [Google Scholar] [CrossRef] [PubMed]
- Li, H.; Wang, X.; Liu, X.; Nan, F.; Xie, S.; Feng, J.; Liu, Y. Spatial variation of microplastics and dissolved organic matter: Deciphering their coupled impact on eukaryotic community assembly in the Fen River. Ecol. Indic. 2025, 178, 113861. [Google Scholar] [CrossRef]
- Guo, Y.; Wang, M.; Wang, M.; Jiang, F.; Guo, X.; Xing, M.; Han, Q.; Jia, B.; Pan, H.; Chen, M. Characteristics of microplastic pollution in sediments and error analysis of ecological risk assessment in Qin River, China. J. Hazard. Mater. 2025, 495, 138869. [Google Scholar] [CrossRef] [PubMed]

Disclaimer/Publisher’s Note: The statements, opinions and data contained in all publications are solely those of the individual author(s) and contributor(s) and not of MDPI and/or the editor(s). MDPI and/or the editor(s) disclaim responsibility for any injury to people or property resulting from any ideas, methods, instructions or products referred to in the content. |
© 2026 by the authors. Licensee MDPI, Basel, Switzerland. This article is an open access article distributed under the terms and conditions of the Creative Commons Attribution (CC BY) license.